 Honglei Wang
 Lijuan Shen2*
 Junke Zhang
 Xinyao Xie
 Xiaobin Guan
94% of researchers rate our articles as excellent or good
Learn more about the work of our research integrity team to safeguard the quality of each article we publish.
Find out more
EDITORIAL article
Front. Environ. Sci., 11 April 2023
Sec. Atmosphere and Climate
Volume 11 - 2023 | https://doi.org/10.3389/fenvs.2023.1165474
This article is part of the Research TopicAir Pollution Remote Sensing and the Subsequent Interactions with Ecology on Regional Scales - Volume IIView all 10 articles
Editorial on the Research Topic
Air Pollution Remote Sensing and the Subsequent Interactions with Ecology on Regional Scales - Volume II
With the rapid development of science and technology, air pollution studies have become increasingly interdisciplinary and complicated. In addition to affecting human health, air pollution also affects the virtuous cycle of the ecosystem. Fortunately, the methods to understand and solve air pollution problems have also made great progress. The rapid development of remote sensing technology has broken the space-time limitations of human understanding for air pollution, which significantly improves the breadth of our knowledge, especially in large-scale air pollution Research Topic. The emergence of numerical models allows us to conduct sensitivity experiments under different scenarios, especially for the future. This Research Topic aims to cover all theoretical, observational, experimental, and modeling studies that present new knowledge in air pollution, remote sensing, and pollution-ecology interactions at a regional scale, such as a related study in China (Figure 1).
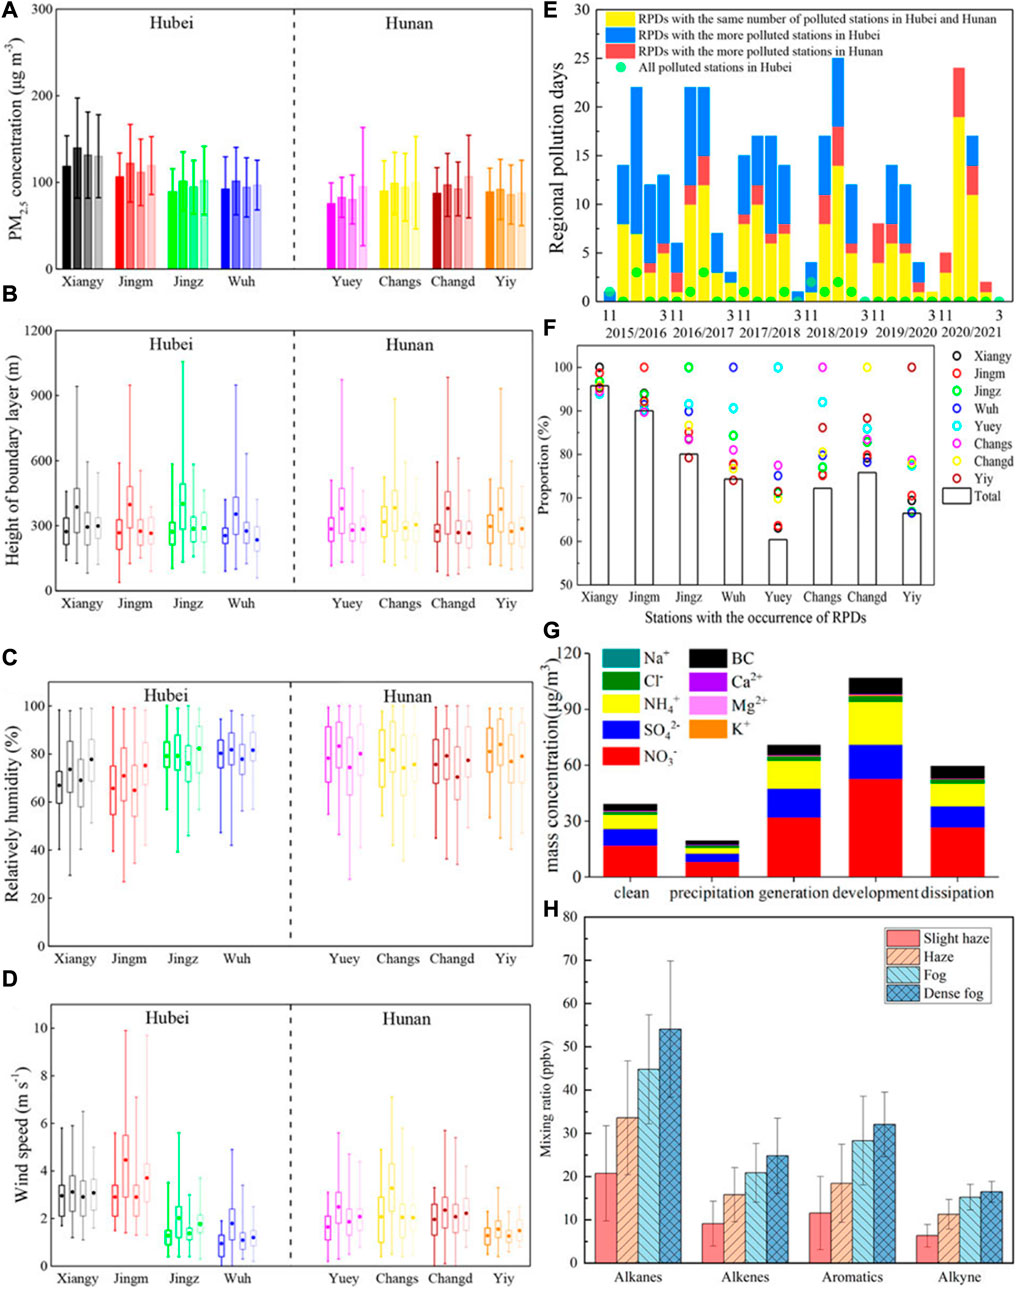
FIGURE 1. Distribution of (A) PM2.5 concentration, (B) boundary layer height, (C) relative humidity and (D) wind speed under four weather types for regional pollution days (RPDs) at eight stations in Hubei and Hunan provinces. The central box represents the values from the lower to upper quartiles (25th to 75th percentiles), and the vertical line extends from the minimum to the maximum. The middle solid dot represents the mean value. (E) Variation of RPDs and the differential distributions of polluted stations during RPDs in Hubei and Hunan. The green dots show all polluted stations located in Hubei during RPDs. (F) Proportions of pollution days at eight stations to the total RPDs and the occurrence of pollution days at each station. (G) Mass concentration of inorganic components under different stages of RPDs. (H) Average volume fractions of each component in atmospheric VOCs during different weather conditions. Adapted from Yue et al., Diao et al. and Zhao et al..
In recent decades, air pollution has attracted widespread attention around the world. The spatial distribution of air pollution is closely related to population and economy. Yan et al. found that high-pollution areas are clustered in the Beijing-Tianjin-Hebei region and southern Xinjiang in China. Their results showed that the spatial overlapping indicator of the air pollution gravity center (APGC) with the population gravity center (PGC) is the greatest, and the APGC and the secondary industry gravity center (SIGC) have the highest shifting consistency indicator there. Because meteorological conditions are external factors affecting air pollution, by using the T-model (T-PCA) classification method, Yue et al. divided the synoptic circulation for regional pollution days in Twain-Hu Basin into four types, namely: uniform pressure field (42 days); front of the cold high-pressure bottom (180 days); back of high-pressure (81 days); and low pressure with an inverted trough field (28 days). They constructed a stable index (STI) and a transport index (TRI) to describe the PM2.5 pollution whether caused by the stagnant weather or the transport weather.
The chemical composition of air pollutants changes significantly as a consequence of air pollution. Diao et al. found that the concentrations of SO42-, NO3−, NH4+, and black carbon are the highest in the developing stage of haze. The increment of NO3− dominates the haze development, the proportion of which increases by 4.05% from generation stage to development stage. Zhao et al. compared the composition characteristics and variation rules of volatile organic compounds (VOCs) in the atmosphere under four weather conditions (slight haze, haze, fog, and dense fog). They found that the average concentrations of VOCs rank as alkanes > aromatics > alkenes > alkynes, and their concentrations are in the order of dense fog > fog > haze > slight haze. The boundary layer characteristics and photochemical reaction rate are reported to be the main factors that contribute to the differences in VOC concentrations under different weather conditions.
Ozone pollution has become serious in the recent decade, and is now a critical urban environmental Research Topic in China. Li et al. analyzed the temporal variation of ozone concentrations and discussed the relationships between them and meteorological factors in low and high layers of the atmosphere. They indicated that ozone concentrations correlate significantly with air temperature, with correlation coefficients of 0.814 (p < 0.05) in the low layer and 0.731 (p < 0.05) in the high layer. Conversely, it shows weak correlations with relative humidity and wind speed in both layers.
As a natural phenomenon, the fog process, accompanied with a rapid increase in RH, will lead to a sharp decrease in visibility, and affect both traffic safety and air quality. Ge et al. discovered that the total ion concentration (TIC) of fog water is relatively high, especially in small droplets of diameter within 4–16 μm (463527.9 μeq/L). An interesting finding is that the TIC is greater in the second fog compared to the first fog; the stronger thermal inversion and local emissions proves to lead to a higher concentration of atmospheric particles in the second fog.
Vertical information about aerosols and clouds is vital to understand aerosol transport, aerosol-cloud interactions, and pollution-weather-climate feedback to reduce uncertainties in estimating their climatic effects. Yu et al. used aircraft measurements over southern Anhui at the Third China International Import Expo to examine the vertical characteristics of aerosol and cloud microphysical properties, as well as their variations before and after cloud seeding. Their observations showed aerosols and clouds are vertically stratified. Most of aerosols trapped within the boundary layer are small particles with sizes less than 0.12 µm.
Changes in the ecology will lead to variations in local meteorological conditions and underlying surface characteristics, especially the impact of solid and liquid pollutants on the ecological environment. These changes in the ecological environment will also affect air pollutants’ generation, transformation, transport and removal processes. However, waste utilization can effectively reduce environmental pollution and has high economic benefits. A large amount of medical waste has been generated during COVID-19. From the perspective of waste utilization, Wang et al. investigated disposable protective clothing (DPC) and disposable nitrile gloves (DNG) that are produced due to COVID-19 in combination with silty sand as subgrade filling for the Yellow River flood area (YRFA) of China. Their results showed that adding DPC improves the compressive strength and ductility of the sample. However, the impermeability of the sample remains unchanged.
The accurate inversion of terrain, especially for the inversion of complex terrain (such as plateaus, mountains, etc.), can reduce the simulation error caused by the characteristics of the underlying surface in the study of air pollution models, which is very beneficial for the model to simulate air pollutants’ transport and transformation mechanism accurately. The mountain base elevation, which refers to the initial altitude of a mountain or the altitudinal mountain belt, is of great significance for studying mountain altitudinal zonality and the mass elevation effect. Zhang et al. used a new method based on mountain structure modeling to calculate the mountain base elevation proposed for the Qinling-Daba Mountains (QDM). They indicated that the mountain base elevation quantification algorithm works well in mountain areas with complex terrain.
We thank the authors and reviewers who contributed to this Research Topic. Together these papers provide valuable insight into air pollution, remote sensing, and the subsequent interactions with ecology at regional scales in the future and open up exciting avenues for future research.
All authors listed have made a substantial, direct, and intellectual contribution to the work and approved it for publication.
This work was supported by the National Natural Science Foundation of China (42275196 and 41830965) and the Postdoctoral Science Foundation of China (Grant No. 2021M700139).
The authors declare that the research was conducted in the absence of any commercial or financial relationships that could be construed as a potential conflict of interest.
All claims expressed in this article are solely those of the authors and do not necessarily represent those of their affiliated organizations, or those of the publisher, the editors and the reviewers. Any product that may be evaluated in this article, or claim that may be made by its manufacturer, is not guaranteed or endorsed by the publisher.
Keywords: air pollution, remote sensing, haze, ozone, meteorology, ecology interactions
Citation: Wang H, Shen L, Zhang J, Xie X and Guan X (2023) Editorial: Air Pollution Remote Sensing and the Subsequent Interactions with Ecology on Regional Scales - Volume II. Front. Environ. Sci. 11:1165474. doi: 10.3389/fenvs.2023.1165474
Received: 14 February 2023; Accepted: 03 April 2023;
Published: 11 April 2023.
Edited and reviewed by:
Martin Siegert, University of Exeter, United KingdomCopyright © 2023 Wang, Shen, Zhang, Xie and Guan. This is an open-access article distributed under the terms of the Creative Commons Attribution License (CC BY). The use, distribution or reproduction in other forums is permitted, provided the original author(s) and the copyright owner(s) are credited and that the original publication in this journal is cited, in accordance with accepted academic practice. No use, distribution or reproduction is permitted which does not comply with these terms.
*Correspondence: Lijuan Shen, c2hlbmxqQGN3eHUuZWR1LmNu
Disclaimer: All claims expressed in this article are solely those of the authors and do not necessarily represent those of their affiliated organizations, or those of the publisher, the editors and the reviewers. Any product that may be evaluated in this article or claim that may be made by its manufacturer is not guaranteed or endorsed by the publisher.
Research integrity at Frontiers
Learn more about the work of our research integrity team to safeguard the quality of each article we publish.