 Jinguang Guo
 Yu Fu*
- Institute of Public Management, Dongbei University of Finance and Economics, Dalian, China
Introduction: Enhancing the green total factor productivity of dairy cows (GPDC) is crucial for fostering the low-carbon sustainable development of the dairy industry.
Methods: This research utilizes the Minimum distance to weak efficient frontier–Meta frontier–Malmquist–Luenberger (MinDW-MML) index to examine the GPDC using the unbalanced panel data on dairy cows in 26 provinces of China from 2004 to 2020, taking into account regional heterogeneity and unexpected output.
Results: The findings revealed that 1) from 2004 to 2020, China’s GPDC displayed a fluctuating and declining trend, with the steepest decrease occurring from 2007 to 2010 (2.26% at the common frontier and 1.81% at the group frontier). The fundamental cause of the low GPDC, as seen from the standpoint of efficiency decomposition, is technical advancement (technological change, or TC); 2) the GPDC exhibits a declining trend from east to west to central China for the two-level frontier. The eastern region benefits clearly from technological advancement (TC) and improved technical performance (EC), while the middle and western regions are mostly constrained by TC; and 3) the GPDC displayed regional heterogeneity at several scales. Although the efficiency values of medium- and small-scale aquaculture were low and large-scale aquaculture GPDC in the eastern and western regions was greater than 1, the GPDC did not reach the effective state in the central region.
Discussion: Based on these findings, we propose policy recommendations such as promoting technological innovation and low-carbon technology in dairy farming, improving the technical system of dairy farming, and optimizing the industrial layout of dairy farming, which will serve as a model for future high-quality and sustainable dairy farming development in China, and provide an experience for green dairy farming development in other countries.
1 Introduction
Milk is a very important food product in the diet structure of a population and has a significant effect on improving the quality of the human body and preventing non-communicable diseases. Milk has become necessary for national consumption and has a huge global consumer market (Zhou et al., 2002; Fuller et al., 2006; Cheng et al., 2015). China’s dairy industry has made great achievements due to the pull of the consumer side, which made milk production in China increase from 8.274 million tons in 2000 to 34.4 million tons in 2020, and the per capita milk share increased from 6.6 kg in 2000 to 24.4 kg in 2020. Although the supply has greatly increased, the growth rate of milk production is still lower than that of the total demand, and the self-sufficiency rate of milk sources is on the low side. Calculations by Liu and Han (2020), Liu and Han (2021), and Liu and Han (2022) show that from 2019 to 2021, China’s milk sources were 65.6%, 65.3%, and 62.9% self-sufficient, respectively, falling short of the 70% threshold suggested in 2018. Raising the dairy cow production efficiency is one of the most important variables in increasing the milk supply and satisfying Chinese citizens’ daily consumption needs. Therefore, measuring the total factor productivity of dairy cows in China is of great practical significance.
Inevitably, there are two aspects to consider in the dairy farming process: first, the climate issues arising from the farming process. Pollutants such as methane, carbon dioxide, manure, sewage, and garbage may be created during dairy cattle feeding. These pollutants can contribute to the greenhouse effect, microbial contamination, and other climate-related issues. The International Food and Agriculture Organization (FAO) reported that animal husbandry accounted for 18% of all greenhouse gas emissions in 2006. The FAO increased this ratio to 14.5% in 2013, with beef and milk contributing 41% and 19% of livestock-related greenhouse gas emissions, respectively. According to Twine’s most recent estimations, the lowest estimated value of greenhouse gas emissions from animal husbandry, as a fraction of all greenhouse gas emissions, should be 16.5%. As a result, encouraging green farming in dairy cows is crucial to combating climate change and changing the breeding industry’s broad production model to an environment-intensive one. Second is the issue of regional heterogeneity. On one hand, fresh milk has limited supply due to transportation distance, has a short shelf life, and must be delivered to factories and customers as quickly as feasible. China’s varied regions have varying traffic levels, with the eastern and central regions performing better than the western regions. Dairy cows must be self-reliant in different places to guarantee sufficient milk supply. On the other hand, the eastern, central, and western areas have different levels of urbanization, resource endowment, and environmental carrying capacity (Sobczyński et al., 2015; Leng et al., 2017; Wang et al., 2023a). The eastern region benefits from a strong economy, cutting-edge technology, and a large market (Mei et al., 2015; Yu et al., 2019; Zhong et al., 2022b). The western part is rich in pasture resources and sparsely inhabited for dairy production, whereas the middle region has flat terrains and strong industrial intensity (Shen et al., 2020). Therefore, geographical variability must be considered while examining the total factor productivity of dairy cows. Therefore, it is necessary to analyze different situations to make recommendations that align with local realities. In summary, this paper considers regional heterogeneity while incorporating undesirable outputs into the evaluation system, employing the Minimum distance to weak efficient frontier–Meta-frontier–Malmquist–Luenberger (MinDW-MML) model and analyzing the Chinese GPDC using data from 26 Chinese provinces from 2004 to 2020. We hope to provide reference values for future policies to promote the sustainable development of dairy farming in China and the broader region. The rest of this paper is structured as follows: the second part is the Literature review, and the third part is the Theoretical basis, a detailed description of the model formula, input–output variables, and data sources. The fourth part is the Empirical analysis and results. The fifth part is the Conclusion and suggestions.
2 Literature review
On the issue of cow breeding efficiency, scholars from different countries have made many contributions from different perspectives. Using the fixed-effect production function and the data on 96 dairy farms in Vermont from 1971 to 1984, Ahmad and Bravo-Ureta (1995) found that the contribution rate of technological progress to the total production efficiency was about 94%. According to Brümmer et al. (2002), an analysis of the sources of the total factor productivity (TFP) growth in dairy farms in Germany, the Netherlands, and Poland revealed that technological change primarily influences productivity growth in Germany and Poland, while allocation efficiency primarily influences productivity growth in the Netherlands. In dairy farms from 2001 to 2007, Latruffe et al. (2012) discovered that Hungary had superior technical efficiency to France under a common boundary. Madau et al. (2017) examined the TFP of dairy farms in 22 European nations between 2004 and 2012 using the data envelopment analysis (DEA) method, and they discovered that there was little room for dairy farms to increase their technical efficiency and that the production efficiency of European dairy farming declined. Different scholars have conducted in-depth studies on the effect of the farm size on the total factor productivity of dairy cows, but their conclusions differ. According to Newman and Matthews (2006), major dairy farms in Ireland saw increased productivity and quicker technological advancement between 1984 and 2000. SFA and the technical inefficiency model were used by Cabrera et al. (2010) to investigate the factors influencing the technical efficiency of 273 dairy farms in Wisconsin. The findings demonstrate that farm size does not affect productivity levels, which depend on technological advances and efficiency. According to Moreira and Bravo-Ureta. (2016), the farm size has no significant effect on dairy farm productivity growth, but structural changes in the dairy industry may promote the transition from small-scale to large-scale farms. Olagunju et al. (2022) examined the factors influencing dairy cow TFP in Northern Ireland farms using panel data from 2005 to 2016. They discovered that the herd size and feeding density positively impacted the TFP while emphasizing the importance of technological complexity in improving dairy farm productivity. The production efficiency of the dairy cow receives less attention in Chinese academic studies on animal husbandry than pigs, mariculture, laying hens, and other species. The environmental effectiveness of pig production was examined in 30 Chinese provinces between 2004 and 2012 using the stochastic frontier model by Zhou et al. (2015). They discovered a strong correlation between technology and environmental effectiveness, and that areas with high environmental effectiveness also have high technical efficiency levels. The huge data from China’s 2004–2010 rural fixed-point survey were analyzed using SFA by Tian et al. (2015). They discovered that the eastern region’s production efficiency was greater than that of the central and western regions. Specialized pig farms had higher production efficiency than other areas. Yan et al. (2020) used SFA and Tobit models to examine the environmental efficiency of 260 pig farms in Hebei Province and discovered that the technical efficiency was related to the farm size while the environmental efficiency was lower. Wang and Ji (2017) assessed the effectiveness of mariculture in 10 Chinese coastal regions from 2003 to 2012 using DEA and Tobit models. The study’s findings indicate that Tianjin, Guangxi, Hebei, and other regions in China have comparatively poor mariculture productivity overall, huge interprovincial productivity variations, and low mariculture productivity overall. In their analysis of China’s laying hens breeding green total factor productivity (LHBG), Zhong et al. (2021b) used the DDF-MML index. They discovered that the LHBG shows a downward trend in the west–central–east region and that scale and technical efficiency are more important than management efficiency. In conclusion, research on dairy cows is reasonably well-developed in the United States, Europe, Ireland, Australia, and other nations but relatively scant in China. This work can fill the knowledge gap in this area.
The analytical model used to investigate production efficiency has also evolved over the years. Initially, scholars from various countries studied production efficiency primarily using the parametric method SFA and the non-parametric method DEA. Since it was first developed, the SFA has found widespread use in commerce, industry, and agriculture (Aigner et al., 1977; Meeusen and van Den Broeck, 1977). In their analysis of 130 dairy farms’ balance panel data using the SFA, Alvarez and del Corral (2010) discovered that intense technology outperforms extensive technology and that intensive farms are more productive than coarse farms. Ma et al. (2012) used the SFA to study the elements that affected the total factor productivity of dairy cows in China. They discovered that the technical efficiency of small and big farms replaced general technological transformation as the industry’s growth strategy. Jiang and Sharp (2015) discovered heterogeneity in farm production technology located on various islands after using the stochastic frontier model to assess the technical efficiency and technological gap of 1,294 dairy farms in New Zealand. There are certain restrictions to the SFA since its fundamental hypothesis is complicated and unable to address issues involving multiple inputs and outputs. A non-parametric efficiency evaluation technique called the DEA was suggested by Charnes et al. (1978). Its basic idea is to utilize linear programming to construct the optimal production frontier using various DMU input–output data and then calculate the production efficiency value by calculating the distance between the DMU and the production frontier. In their assessment of the complete environmental performance of Dutch dairy farms using the SFA and DEA, Reinhard et al. (2000) highlighted the benefits and drawbacks of the two methodologies and discovered that energy efficiency significantly influences the environmental efficiency score. The DEA model was used by Lansink and Reinhard (2004) to examine the technical and environmental performance of Dutch pig farms. They discovered that the breeding scale was near the best technical scale and that the average technical efficiency of Dutch pig farms was as high as 90%. The relationship between the economic and environmental performances of 56 dairy farms in Switzerland was assessed using the life cycle assessment (LCA) and DEA techniques. According to Jan et al. (2012), economic and environmental performances are positively correlated. Green technology advancement can improve the green growth rate, according to Wang et al.’s (2021) analysis of the green growth rate of oil and gas resource cities in China from 2010 to 2017 using the non-radial and non-angular DEA-SBM mode. Compared to the SFA, the premise assumption in the DEA is looser and it can deal with output variables more flexibly, so subsequent generations prefer the DEA method to measure the production efficiency.
Non-expectation is gradually incorporated into the efficiency analysis model through the continual speech of analysis methods. To include the non-desired output in the DEA model, Chung et al. (1997) introduced the directional distance function (DDF) and Malmquist–Luenberger productivity index, which resolved the efficiency evaluation problem of non-desired output production activities and could accurately analyze the production efficiency and its sources. Since then, many researchers have added an unintended output to efficiency evaluation models and evaluated the green total factor productivity using various techniques (Fisher-Vanden et al., 2004; Li and Wu, 2017; Yao et al., 2018; Zhu et al., 2018). The practice of animal husbandry also makes extensive use of this technique. Using a directed distance function with greenhouse gas emissions as a negative output, Njuki et al. (2016) assessed the environmental efficiency of dairy farms in the northeastern United States and discovered that larger farms were more productive than smaller farms. Cecchini et al. (2018) evaluated the environmental performance of 10 dairy farms in Umbria (Italy) using LCA and SBM-DEA models with carbon dioxide emission equivalents as a negative output and found that half of the farms had improved environmental performance and that the use of low-emission technologies and measures helped close the gap with more environmentally friendly farms. Zhong et al. (2021a) investigated the green total factor productivity of pig breeding (PBG) in China from 2004 to 2018, using pollutant emissions as a negative output, and discovered that an inefficient scale structure was the primary cause of the decline in PBG.
Scholars at home and abroad have conducted in-depth analyses on dairy farming and total factor productivity analysis methods and produced many research results, which provide important theoretical support and useful reference for this paper, but there are still some things that still need to be addressed. 1) Although research on dairy farming is abundant in the United States, Europe, Ireland, Australia, and other countries, more research needs to be conducted on the issue of productivity in Chinese dairy farming. 2) The majority of the literature has used models such as DDF and SBM, which can incorporate undesired outputs into the efficiency evaluation system and are more consistent with production laws than the traditional CCR and BBC models, but all of them have limitations. The MinDW model has the advantages of dealing with the problem of unreasonable treatment of non-desired outputs in the DDF model and overcoming the shortcomings of the traditional CCR and SBM models, in which the DMU is very far away from the frontier, which leads to a decrease in the “motivation” to catch up. The model effectively reduces data anomalies, increases the objectivity of the analysis process, and improves the accuracy of the assessment results (Liu and Gao, 2022). Therefore, the MinDW model is used in this paper to measure the GPDC. 3) The majority of the literature has analyzed the total factor productivity of dairy cattle and its influencing factors from an overall perspective, but there are differences in resource endowment, industrial structure, and economic development levels in different regions due to differences in resource inputs and pollution emissions of different farming scales. Most of the existing literature examines the total factor productivity of dairy cows and its influencing factors in aggregate. However, the resource input and pollution discharge of different breeding scales differ, as do the resource endowment, industrial structure, and level of economic development of different regions (Li et al., 2021). This suggests that it is necessary to consider scale and regional heterogeneity when analyzing such problems. As a consequence, this paper divides the dairy farming scale into three scales, large, medium, and small, and takes into account inter-regional variability and the traditional division of agricultural regions such as the East, Middle, and West.
The scientific value of this paper is reflected in the following three points. First, there are few studies on the GTFP in China’s dairy farming industry, and the topic of this paper is novel and has the potential to compensate for the lack of existing studies in terms of theory. Second, the MinDW-MML index will be applied in this paper to overcome the traditional DEA model and the slack measure-based SBM model, and to incorporate non-desired output into the production efficiency evaluation system, which is more in line with the production law and has practical significance. Third, to better propose policy recommendations suitable for the sustainable development of dairy farming, this paper considers regional heterogeneity and the analysis of the GPDC in different regions and scales under environmental constraints.
3 Methodology
3.1 MinDW
The MinDW model is the closest distance of the evaluated DMU to the frontier surface and does not consider whether its projection point on the frontier surface is strongly or weakly effective. Referring to the methods of Charnes et al. (1996) and Briec (1999), a MinDW model with non-desired outputs is constructed. It is assumed that there are n DMU in the manufacturing process, including m input variables x, f expected output variables y, and g non-expected output variables u, expressed as a matrix:
where
The efficiency value of each model is as follows (Eq. 3):
The MinDW efficiency value is
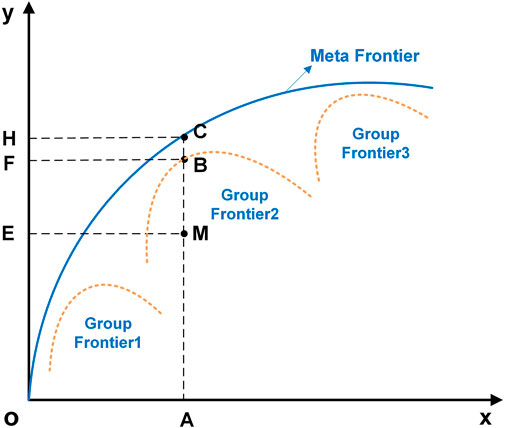
FIGURE 1. Double-hierarchy meta-frontier.
Similarly, the value of the DMU common frontier efficiency can be obtained by Eq. 5:
Finally, the technology gap ratio (TGR) can be obtained by calculating the ratio of the common frontier to the group frontier, and the calculation equation is (Eq. 6)
As shown in Figure 1, take the M point as an example
3.2 Meta-frontier–Malmquist–Luenberger index
Based on the non-parametric method, Färe et al. (1992) constructed the Malmquist productivity index from period t to t + 1, which effectively made up for the defect that the traditional DEA could not measure dynamic efficiency. Since the Malmquist index cannot deal with undesired output, Chung et al. (1997) combined the Malmquist and Luenberger indexes to construct the Malmquist–Luenberger (ML) productivity index containing the undesired output. However, the ML index has some problems, such as a linear scale without feasible solution, non-transitivity, and technical retrogression, which still has some limitations. To solve the shortcomings of the ML index, Oh (2010) proposed the global Malmquist–Luenberger (GML) index. At the same time, Oh and Lee (2010) incorporated the meta-frontier method into the Malmquist index and constructed the Meta-frontier–Luenberger productivity index considering group heterogeneity. Therefore, this paper refers to the method of Oh and Lee, constructs the Meta-frontier–Malmquist–Luenberger (MML) index, and takes the MML index as the GPDC.
To construct the MML index, two production points in adjacent periods and their common frontier distance composition with transferability are required. Then, the GPDC under the common frontier and regional group frontier can be calculated by Eqs 7, 8, respectively:
According to Wang et al. (2013), the GPDC index is decomposed into technology change (TC) and efficiency change (EC), that is, Eq. 9:
where
3.3 Data and variables
Referring to the existing research, this paper selects five indicators to construct the GPDC evaluation system, and the specific content is as follows:
(1) Labor input: one measure of labor input is the number of workers employed. The index is the number of day workers, and family members worked together while dairy farming was in operation.
(2) Input of feed: this is measured in terms of the volume of concentrate feed. Dairy cows can receive a variety of minerals and vitamins from concentrate feed, which can also improve disease resistance and raise cow yield and feed return.
(3) Capital investment: this includes the total costs for water, fuel, electricity, medical care and disease control, depreciation of fixed assets, maintenance and repair, supplies, and equipment.
(4) Expected output: the milk output is shown here, as expressed by the output of the principal product.
(5) Undesired output: represented by carbon dioxide emissions during dairy farming. Ruminants like dairy cows emit greenhouse gases like CO2, CH4, and N2O when they eat, and CH4 and N2O can turn into CO2 emissions (GWP). The specific calculation equation is (Eq. 10)
where
Among the input–output indicators in this paper, data on the number of workers used, concentrate feed consumption, water consumption, fuel power, medical and epidemic prevention, depreciation of fixed assets, repair and maintenance, tools and materials, and milk production were obtained from the 2004–2020 National Compilation of Information on Costs and Benefits of Agricultural Products, and data on year-end dairy cattle inventory were obtained from the 2004–2020 China Rural Statistical Yearbook. To eliminate the influence of price fluctuation, the fixed assets’ investment price index in the China Statistical Yearbook is used to reduce the depreciation of fixed assets, repair and maintenance costs, and tool material costs. The fuel–power index was used to deflate water consumption, fuel and power costs, and medical and epidemic prevention costs, and the year 2004 was used as the base period.
According to the availability and completeness of the data, this paper selects 26 provinces as the research object and divides them into the eastern, central, and western regions, as shown in Figure 2. The provinces in the eastern region include Beijing, Shanghai, Tianjin, Hebei, Fujian, Shandong, Guangdong, Jiangsu, Zhejiang, and Liaoning; the provinces in the central region include Inner Mongolia, Heilongjiang, Jilin, Shanxi, Anhui, Henan, Hubei, and Hunan; and the provinces in the western region include Yunnan, Gansu, Guangxi, Chongqing, Shaanxi, Xinjiang, Ningxia, and Qinghai. Based on the division of the scale of dairy cows in the National Collection of Costs and Benefits of National Agricultural Product Cost and Benefits Data Compilation, 10–50 cows are small-scale, 50–500 are medium-scale, and more than 500 are large-scale.
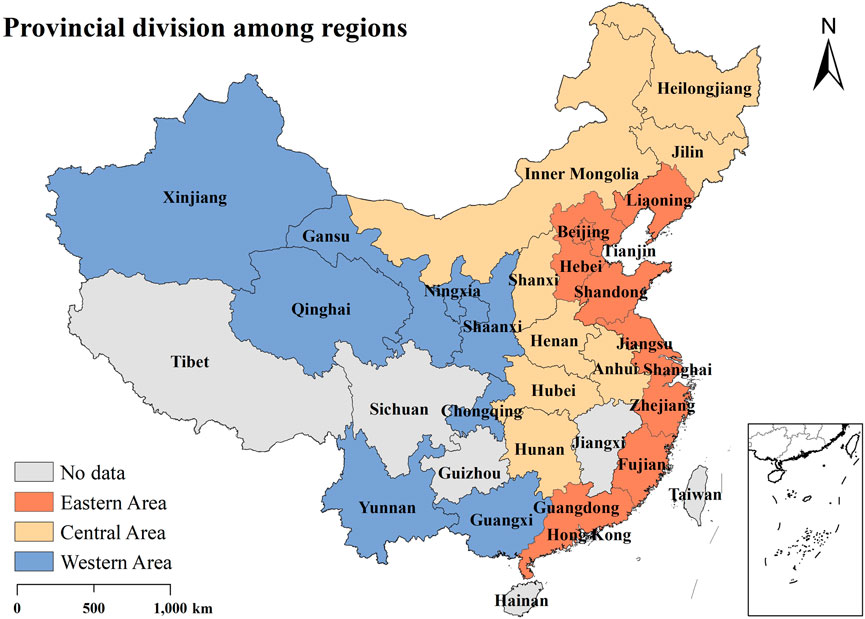
FIGURE 2. Different regional divisions in China.
4 Results and discussions
4.1 Spatiotemporal dynamic characteristics of GPDC regions and scale under double frontiers
As shown in Figure 3, the fluctuation trend of the GPDC is consistent under the common frontier and the group frontier. The annual average efficiency values under the common frontier are 1.0049, 1.0079, 0.9916, 0.9773, 0.9979, 0.998, 1.0037, 1.0002, 0.9984, 0.9952, 1.009, 1.0035, 1.0075, 1.0031, 0.9987, and 1.0033. From 2004 to 2020, the annual average values of the GPDC under the two frontiers are 0.9999 and 0.9987, indicating a decreasing trend of the GPDC in China, which, in further analysis, is mainly caused by the low technological progress index (0.9988 under the common frontier and 0.9982 under the cluster frontier). It can be concluded that, on one hand, China’s GPDC is mainly constrained by technological progress, which needs to be more advanced in terms of a green environment, and the overall technical progress efficiency value needs to be higher. On the other hand, the technical efficiency value of China’s dairy cow is high, which indicates that the overall resource allocation level is good, and the green environment resources are used efficiently and managed at a high level.
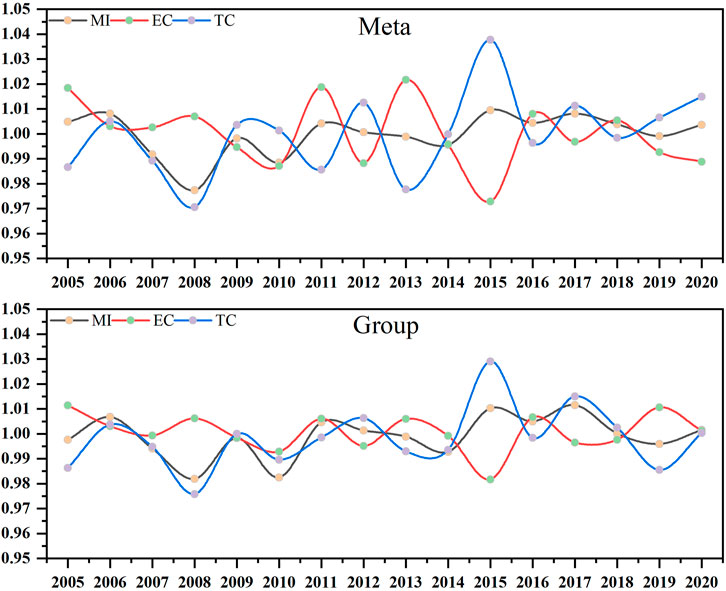
FIGURE 3. China’s GPDC and decomposition target during 2004–2020.
Over the 17 years, GPDC decreased in 2007–2010 and 2013–2014, with the largest decrease in the former (2.26% under the common frontier and 1.81% under the cluster frontier) and a decreasing decrease in the latter. The primary causes of the GPDC’s decrease from 2007 to 2010 are as follows. First off, the majority of farmers have much expertise with feeding, but they need a base for producing feed or silage, and the service guarantee system needs to be more effective. A lack of understanding of scientific formulas for feeding, breeding, and epidemic prevention occasionally causes cow diseases to develop, resulting in poor cow output and breeding effectiveness. Second, farmers’ profit margins are significantly reduced, and their motivation to breed is declining due to rising feed prices and low milk prices. Third, China strengthened the supervision of dairy farms and businesses, following the milk powder disaster in 2008, and implemented pertinent policies to support the expansion of our dairy market. Fresh milk was in high demand in 2013, and the dairy market experienced robust demand. As international milk imports surged and domestic farmers scaled up their operations one after the other, market supply and demand shifts were triggered. “Milk shortage” to “milk leftover” took just 1 year. China has continued implementing pertinent regulations to increase the scale, intensification, and standardization of cow farming and to promote integrated professional management and breeding technology quickly after experiencing “milk scarcity” in 2013 and “milk leftover” in 2014. Thanks to the peak green total factor productivity and technological progress index of dairy cows in 2015, the efficiency of technological progress has been substantially accelerated. However, the inconsistent changes in technical efficiency and technological advancement in 2015 demonstrate that the pace of resource consumption and technical efficiency has lagged behind the rate of technological advancement, indicating that China’s dairy cow is steadily improving in its mode of operation, indemnification service system, and epidemic prevention system; the management efficiency is improved, the resource utilization rate is more appropriate, and the technological efficiency started to rise after 2016.
As shown in Figure 4, the overall GPDC under the double frontier does not reach the effective state (the efficiency value under the common frontier is 0.9995 and 0.9987 under the group frontier), indicating that the overall level of the GPDC in China shows a downward trend. Through efficiency decomposition, TC mostly affects the low GPDC, and under twin frontiers, the overall TC is less than 1. The eastern region has the highest efficiency value, followed by the western region and then the center region, according to further examination of the regional disparities. The key factor limiting the GPDC in the central region is the efficiency of technological advancement, where the EC is high and TC is low. In conclusion, China’s GPDC has a declining trend and is mostly constrained by the TC based on time and overall dimensions.
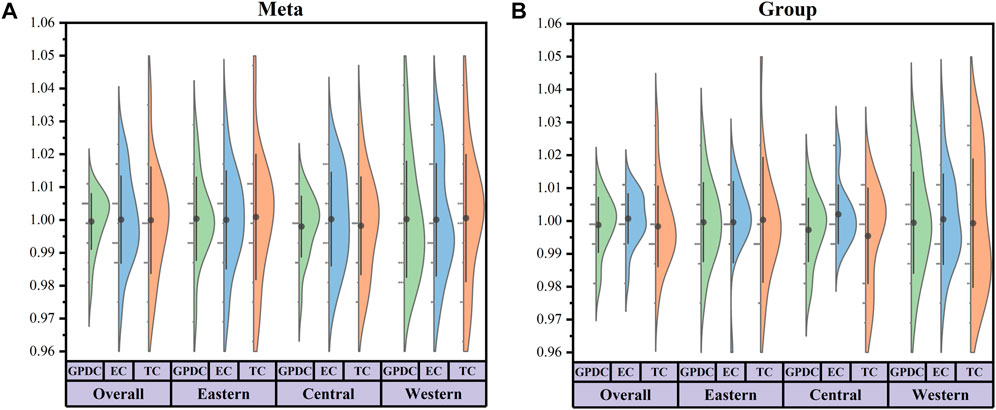
FIGURE 4. National average GPDC and its decomposition index.
As shown in Figure 5, the GPDC has different trends under different culture scales, with the highest efficiency on a large scale (1.0002 under the common frontier and 1.0008 under the group frontier), followed by a medium scale (common frontier 0.9993 and group frontier 0.9991), and the lowest in a small scale. From 2004 to 2020, the average growth rate of the GPDC under the common frontier was 0.04%, while that of the GPDC under the group frontier is 0.03%, and the increase is limited. Under the common frontier, the technological advancement index has an average yearly rise of 0.19% and an average annual decline of 0.16%, as seen from the standpoint of efficiency decomposition. The main driver of large-scale GPDC growth is technological advancement, which hinders technical efficiency, although there is still potential for improvement. Both medium- and small-scale GPDC need to be more effective; medium-scale GPDC is constrained by technological efficiency and advancement, while small-scale GPDC is mostly constrained by technological advancement. Under the melamine crisis in 2008, the GPDC’s performance on all three scales reached a low point in terms of time. Regarding market changes between 2013 and 2014, large-scale efficiency was the highest, while medium-scale and small-scale efficiencies were below 1. This is mostly due to large-scale aquaculture’s more sophisticated equipment, improved resource utilization efficiency, and environmental protection, all of which help strengthen its ability to mitigate risk and support total factor productivity growth.
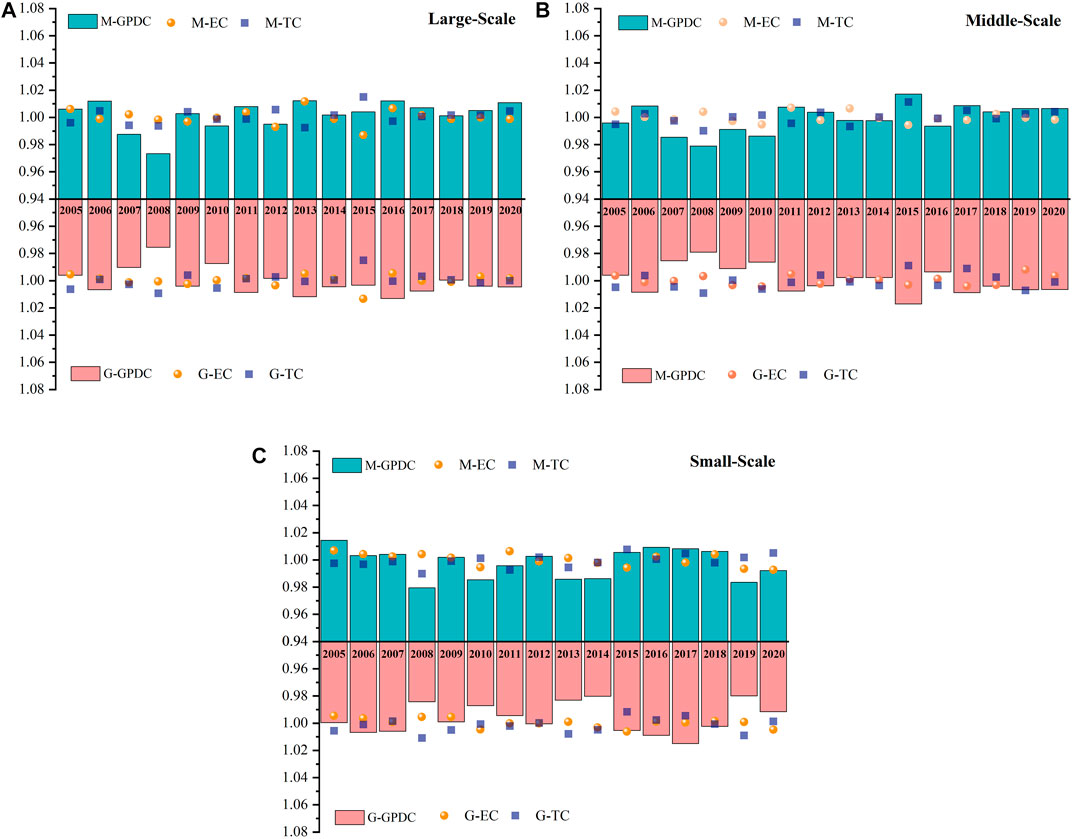
FIGURE 5. China’s various-sized GPDC and decomposition targets during 2004–2020.
4.2 Regional heterogeneity analysis of the GPDC
As shown in Figure 6, the average annual GPDCs of the eastern, central, and western regions under the common frontier are 1.0003, 0.9979, and 1.0002, respectively, and those under the group frontier are 0.9996, 0.9972, and 0.9994, respectively. Under the two frontiers, there is a decreasing trend in the east, west, and middle, and there is still much room for improvement in the central region. Regarding geographical distribution, the eastern region—which includes Beijing, Shanghai, Zhejiang, Guangdong, and Shandong—has a higher economic level, established transportation, and the benefit of industrial agglomeration, which makes for more effective resource usage. Scientific breeding technology has progressed, reducing resource waste and environmental degradation. The eastern region has more notable geographic benefits due to its higher population density, stronger dairy product consumption potential, higher dairy product consumption, and closer proximity of the dairy cows to the consumer market. The GPDC of the eastern and western areas is greater than that of the central regions, and policy considerations may also have an impact. In 2016, the Ministry of Agriculture issued the “National Agricultural Product Processing Industry and Rural Primary, Secondary, and Tertiary Industry Integration Development Plan (2016–2020),” proposing to seize the opportunity to pay full attention to mobile internet, big data, cloud computing, Internet of Things, and other information technology, which has injected inexhaustible impetus for the development of agricultural and livestock product processing industry and industrial integration. Establishing dominant regions for aquaculture products, enhancing the building of bases for processing raw materials, and accelerating the development of initial processing and high-value comprehensive utilization, logistics systems, and platforms for information sharing are all important. In addition to establishing significant producing areas in large cities’ northeast, north, northwest, south, and suburbs, we will continuously work to standardize and moderate-scale aquaculture. The development of dairy cows in the east and west has more benefits because of the program. Among the eight provinces in the central region, five provinces (Henan, Heilongjiang, Hunan, Inner Mongolia, and Shanxi) with TC less than 1 under the double frontiers are the main factors restricting the GPDC in the central region.
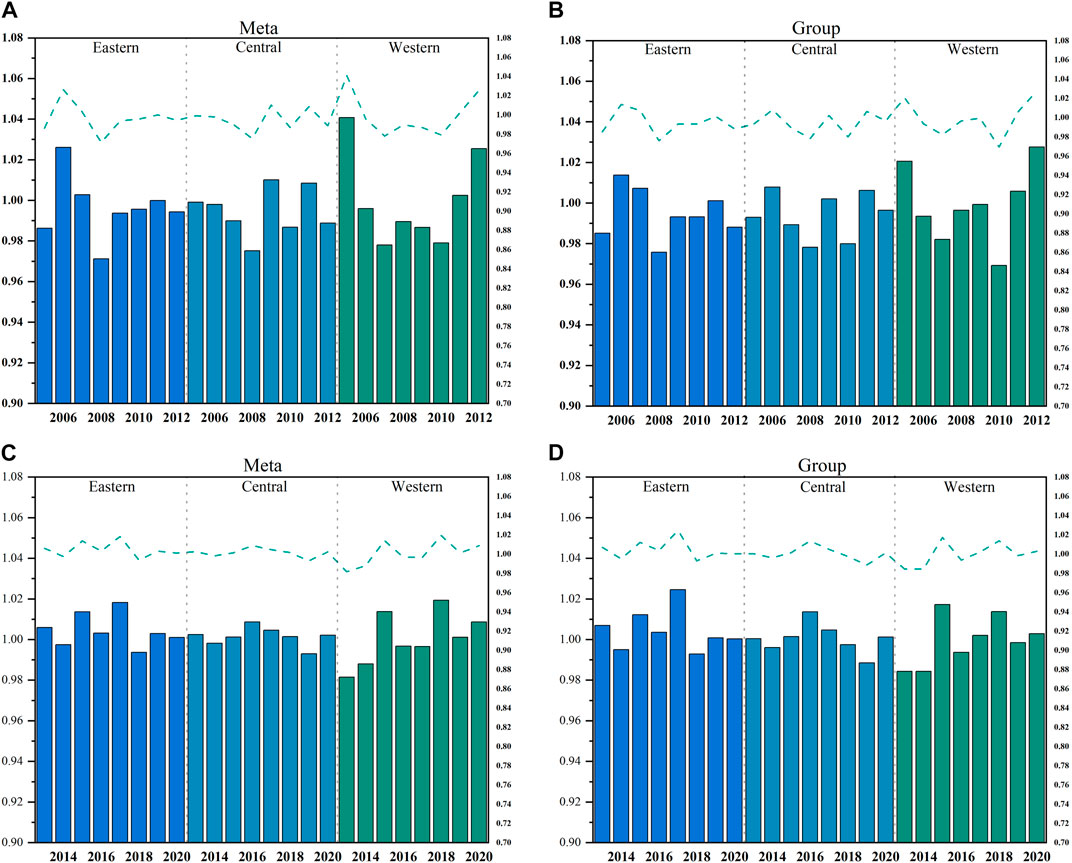
FIGURE 6. GPDC in three regions during 2004–2020.
In Figure 7, the GPDC of large, medium, and small sizes under the common frontier is 1.0026, 0.9999, and 0.9968 in the eastern region; 0.9982, 0.9983, and 0.9974 in the central region; and 1.004266, 0.999404, and 0.997535 in the western region, respectively. The eastern and western regions have witnessed good growth in large-scale aquaculture, whereas the central region has yet to attain an efficient level under three sizes, suggesting that the central region has greater potential. Under the region’s frontier, the GPDC of large, medium, and small sizes are 1.000853, 0.999562, and 0.997497 in the eastern region; 0.997814, 0.998741, and 0.99546 in the central region; and 1.003455, 0.999049, and 0.996125 in the western region, respectively. According to the aforementioned data, the large-scale GPDC is the highest in the eastern and western regions, while the three scales in the center region are still below the effective level. It demonstrates that large-scale farming is more productive on a green total factor basis in the eastern and western regions when the scale and area are considered.
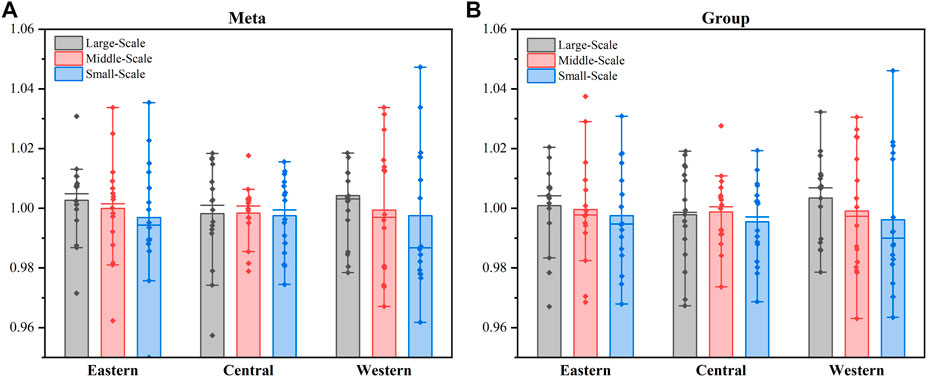
FIGURE 7. Various-scaled GPDC in different regions.
On one hand, the eastern region benefits from capital and technology, and this region’s resource allocation and management are more effective. On the other hand, the eastern region has stricter pollution prevention and control regulations, and it invests more money than the central and western regions. The following factors make the western region ideal for industrial-scale farming. First, large-scale dairy farming is more suitable in natural pastures due to their abundant resources and high vegetation coverage. Second, there is national policy support, which has benefited significantly from financial and technological advances. The central region’s large-scale GPDC technical efficiency and technological progress index are 0.9996 and 0.9989, respectively, under the common frontier, and 1.0013 and 0.9966, respectively, under the group frontier. It demonstrates that the central region’s technical development and efficiency indices have the opportunity for improvement of 0.04% and 0.11%, respectively, under the common frontier. The technical efficiency index of the large-scale GPDC in the central region under the common frontier is lower than that under the group frontier. This may be due to the common frontier being the group frontier’s envelope, which includes the potential best technical efficiency level in the nation, whereas the technical efficiency index of the large-scale GPDC in the central region under the common frontier has a higher room for improvement. In the central region, medium- and small-scale GPDCs still have space for improvement.
4.3 GPDC spatiotemporal variation decomposition
As shown in Figure 8, under the common frontier, there are 11 provinces with GPDCs greater than 1 and the remaining 15 provinces with GPDC less than 1, with significant regional differences. The top five provinces in GPDC are Guangdong (1.0094), Gansu (1.0052), Beijing (1.0051), Hubei (1.0042), and Fujian (1.0033), followed by Guangxi (0.9953), Inner Mongolia (0.9944), Liaoning (0.9939), Anhui (0.9939), and Shaanxi (0.9896). The top five provinces are Guangdong, Beijing, Gansu, Xinjiang, and Shandong, while the last five are Henan, Inner Mongolia, Guangxi, Liaoning, and Shaanxi. In the group, there are 13 provinces with GPDCs greater than 1 and 13 with GPDCs less than 1. Under the two frontiers, the top provinces are primarily found in the east and west, and as a result, the east and west’s GPDC is greater than that of the central region’s. The detailed study reveals that the top GPDC provinces, including Guangdong, Gansu, and Beijing, have higher technical efficiency and technological progress indices than 1. For instance, the technical efficiency index and technological progress index for Guangdong Province is 1.0049 and 1.0044, respectively, under the common frontier, and 1.0031 and 1.0033 under the group frontier, respectively. This shows that the GPDC of Guangdong Province is driven by both the technical efficiency and technological progress indexes.
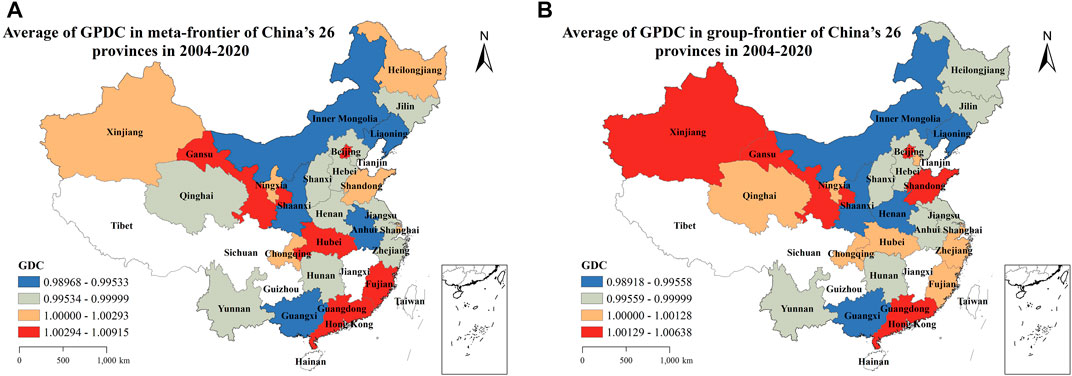
FIGURE 8. GPDC in different provinces during 2004–2020.
As shown in Figure 9, the provincial EC and TC show differences between the common and group frontiers. Under the group frontier, Yunnan, Anhui, Shanxi, and Hebei are mainly restricted by the technological progress index, while under the common frontier, these four provinces are still restricted by the technical efficiency index, and there is still room for improvement in technical efficiency. Under the two frontiers, the technical efficiency index and the technological advancement index limit Inner Mongolia, Guangxi, Liaoning, and Shaanxi, and the contribution of the green total factor production is insufficient. Although Inner Mongolia and Liaoning are important regions for dairy farming in China and are supported by pertinent national policies, their low GPDC indicates issues with management effectiveness, iterative pace, and the promotion of dairy cow breeding technology. High-tech entrepreneurship is the driving force of productivity. The government should encourage enterprises to start their own businesses by promoting and improving the business environment (El Ghak et al., 2021). To promote GPDC, Inner Mongolia and Liaoning should maximize their geographic and policy advantages, advance technical change, pay attention to staff training for dairy cows, and increase managerial effectiveness. Various factors may contribute to Guangxi and Shaanxi’s low technical efficiency and technological progress indices. On one hand, the two regions are not dominant dairy farming regions, have scarce natural resources, and need more capacity to treat pollution. On the other hand, Guangxi is a region home to ethnic minorities, making the promotion of aquaculture technology challenging and the technical level of aquaculture personnel low. The technical advancement indices of Guangxi and Shaanxi increased under a common boundary at a slow-growing average yearly rate of 0.10% and 0.17%, respectively.
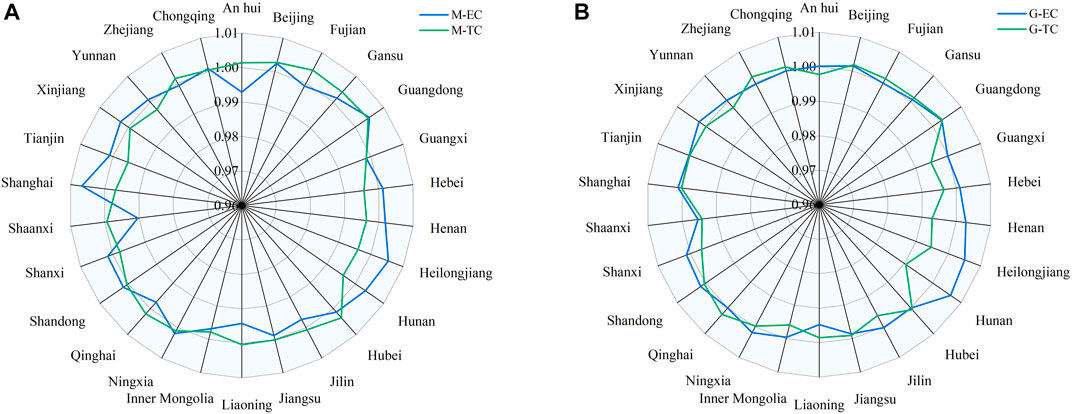
FIGURE 9. GPDC’s decomposition target in different provinces.
In the past 17 years, the average value of the TC in each province was low (0.9997 under the common frontier and 0.9984 under the group frontier), while the EC value was higher (1.0001 under the common frontier and 1.0006 under the group frontier), indicating that the main factor restricting the improvement of the GPDC in China is still technological progress. Excessive economic disparities between regions are not conducive to economic development and achieving carbon reduction targets (Wang et al., 2023b). China’s regions vary in economic growth, industrial agglomeration, breeding history, and natural resource endowment. To promote the improvement of GPDC in China, the government should take the lead in reducing regional disparities and promoting technological innovation in underserved regions. More effective methods include guiding dominant enterprises to settle down and strengthening breeder skill training.
As shown in Figure 10, 26 provinces show different trends in different periods, with great differences among provinces. Combined with the development of dairy cows in China, the period from 2004 to 2020 is divided into three stages: the first stage is the rapid development stage from 2004 to 2007; the second stage is the quality-driven stage from 2008 to 2015; and the third stage is the steady progress stage from 2016 until now. Under the double frontier, there are 12 provinces in the first stage with GPDC values of more than 1, of which six are in the eastern area. The eastern region has a location advantage regarding dairy cows, and its economic development and technological advancement are greater than those of the central and western regions. The 2008 melamine issue caused customers to become alarmed about dairy products. China released many relevant policies to address the dairy cow. The dairy cow brought about a significant reorganization, and the dairy cow evolved as a result. The quality of fresh milk and removing pollutants are considered more in dairy farming, which has evolved from small-scale to medium- and large-scale operations. In this setting, the dairy cow in the central and western regions ushered in development chances, and Qinghai, Yunnan, Guangxi, and other provinces placed highly in GPDC in the second stage. As it moves into the third stage, China pays greater attention to the environmental protection of the aquaculture sector and gradually closed low-quality farms between 2016 and 2020; dairy farming has also undergone additional changes, and breeding restrictions have been raised. The third level shows blatant inequalities between provinces. Jiangsu, Heilongjiang, and Yunnan rank at the bottom, and the GPDC has more potential for improvement. Guangdong, Zhejiang, Chongqing, and other provinces are at the top. Jiangsu and Heilongjiang’s GPDC is low and primarily impacted by EC restrictions. Technical efficiency may need to catch up with how quickly technology advances.
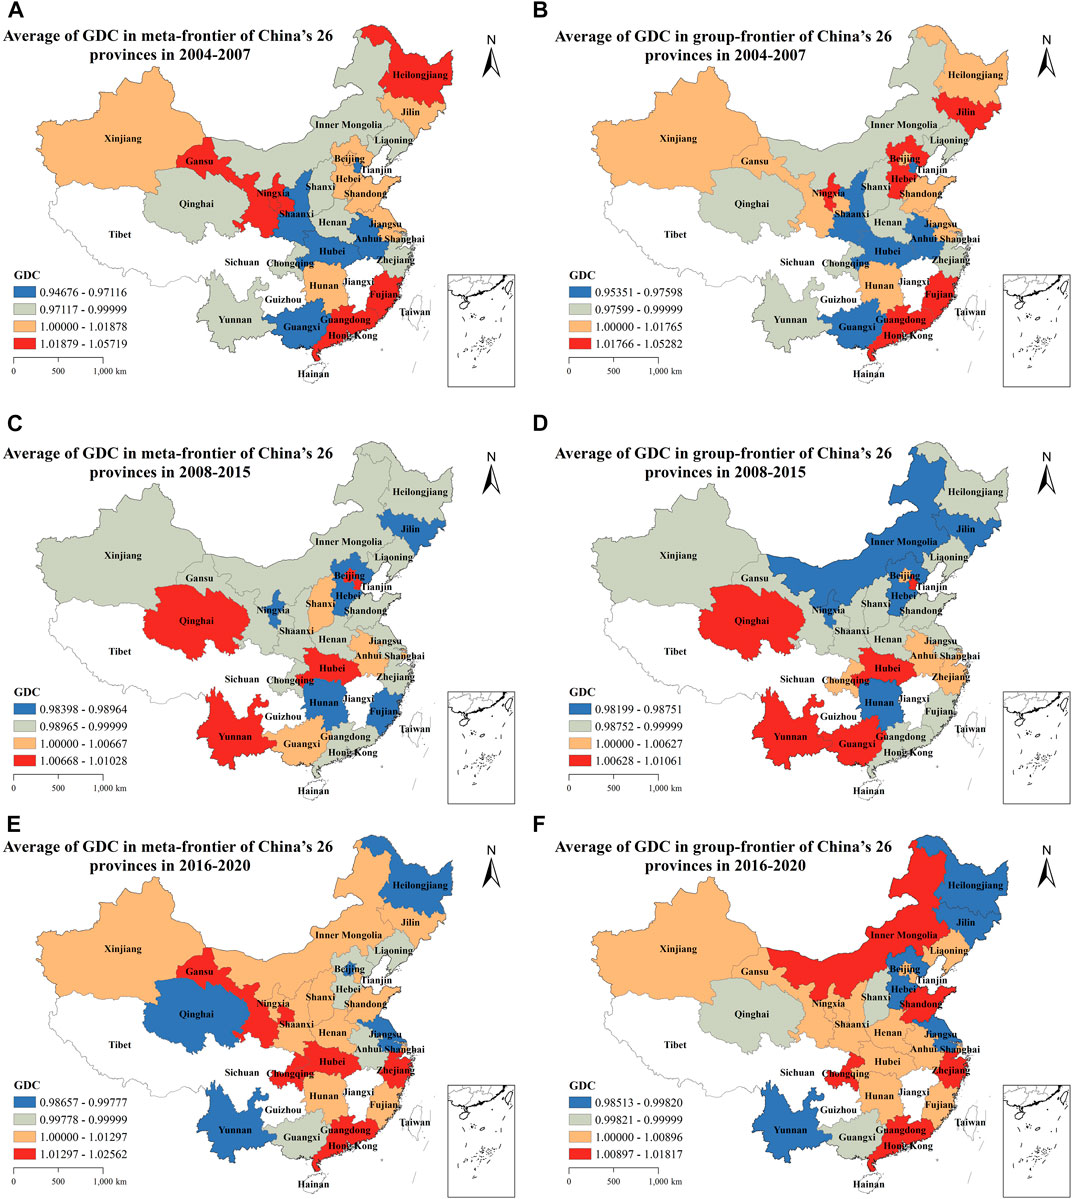
FIGURE 10. GPDC in different periods.
4.4 TGR
As shown in Figure 11, the TGR reflects the gap between the technological level under the group frontier and the technological level under the potential common frontier under a specific environmental system. When the TGR is closer to 1, it shows that the actual technical level of the DMU is closer to the technical level under the potential common frontier, that is, the technical level is higher in the environment. From the regional level, the average TGR of the three regions is less than 1; the TGR of the eastern region is 0.9672, the central region is 0.9671, and the western region is 0.9727. Among them, the TGR in the western region is higher than that in the eastern and central regions, indicating that it is close to the technical level under the potential common frontier and reaches 97.27% of the GPDC under the potential best technical level. However, the TGR in the eastern region is lower, but there is still an opportunity for a 3.27% increase in efficiency. The eastern region’s economy is growing, the industrial cluster effect is strong, and complex businesses are progressively incorporating new technology, but the care given to dairy cows could be better in the western and central regions. From the interprovincial level, the TGR of 26 provinces in China is greater than 0.9. The highest in Yunnan Province is 0.9969, and the lowest in Tianjin is 0.9192, indicating a small gap between the technical level of each province and the potential best technological level. From a scale perspective, large-scale culture in the eastern region has a higher TGR than medium- and small-scale cultures, and its efficiency is more in line with its theoretical ideal efficiency. In the center, the small-scale TGR was 0.9753. The small-scale efficiency is near the efficiency value under the common frontier, but the large-scale and medium-scale efficiencies have greater potential for growth from 2012 to 2020, as evidenced by the fact that it has been higher than the large-scale and medium-scale efficiencies. The western region’s large-scale TGR is 0.9821, higher than the small- and medium-scales’. Large-scale aquaculture thrives in the eastern and western regions, whereas a small-scale cow is more productive in the middle region. The TGR gap between the various regions is shrinking as well.
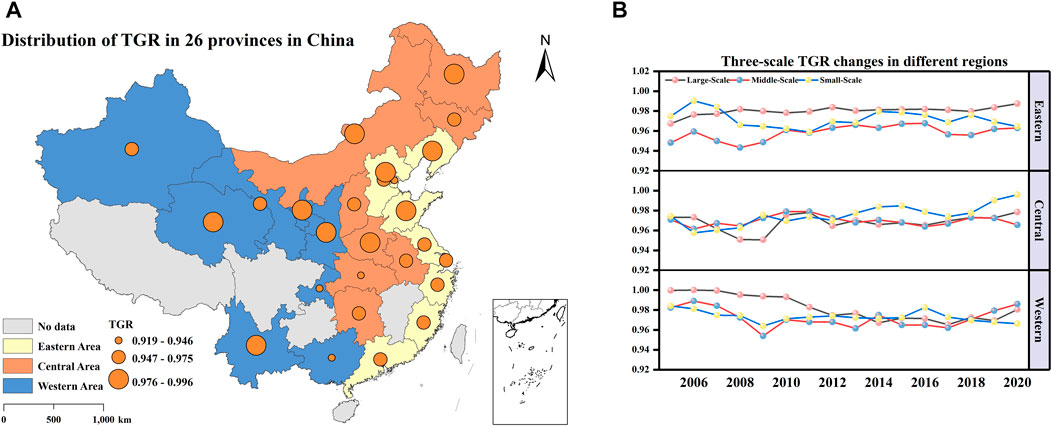
FIGURE 11. Average TGR in different regions.
5 Conclusion and policy implications
The conclusions are as follows. 1) China’s GPDC demonstrated a varying and negative pattern over time from 2004 to 2020, with GPDC values of less than 1 in 2007, 2010, 2013, and 2019, with the years 2007–2010 seeing the biggest decrease (2.26% at the common frontier and 1.81% at the front of the group). The primary cause of the low GPDC is the TC. This conclusion is contrary to the conclusion drawn by Zhong et al. (2022a), who suggested that China’s GPDC is on an upward trend. 2) Under the two-level frontier, the GPDC exhibits a declining tendency in the spatial direction from east to west to the middle. The middle and western regions are mostly constrained by the TC, while the eastern region benefits from the EC and TC. Provinces differ among one another. The EC and TC promote Guangdong, Beijing, and Gansu while restricting Inner Mongolia, Guangxi, Liaoning, and Shaanxi. 3) Large-scale aquaculture varies greatly from region to region. Although the efficiency values of medium- and small-scale aquaculture are low and the GPDC of large-scale aquaculture exceeds 1 in the eastern and western areas, it still needs to reach the effective state in the center region. This conclusion also differs from the results of Liu et al. (2022). They believe that small and medium-sized green plants are on the rise. 4) Although there is still potential for improvement in the eastern region by 3.27%, the TGR in the western region is higher than in the eastern and central regions. The efficiency of small-scale aquaculture is higher in the central region, while large-scale aquaculture performs best in the eastern and western regions. A trend is toward closing the TGR gap between the three aquaculture scales across regions.
In light of the current dairy cow issue in China, the following are some countermeasures and recommendations:
(1) Strengthen dairy farming technology innovation and low-carbon technology promotion. On one hand, the government can encourage the dairy industry to accelerate the adoption of low-carbon technologies by providing financial incentives and other policies that promote high-quality and sustainable dairy farming development. It can increase government funding for research institutions, create dairy farming-related research and innovation teams, improve genetic testing capabilities, and encourage iterative breeding technology upgrades. On the other hand, as renewable energy has a significant inhibitory effect on carbon dioxide emissions (Wang et al., 2022), the government should actively establish a modern green aquaculture industrial park and increase the effective use of renewable energy such as wind and solar energies in the breeding process (Wang et al., 2023c) to control carbon emissions generated in the dairy farming process and optimize the energy structure. At the same time, it promotes the technological innovation of manure treatment and the return of manure to the field, and organically combines dairy farming and green agriculture to reduce carbon emissions.
(2) Optimize the scale and layout of the dairy industry. Each region should adjust measures to the local conditions, improve the regional planning and layout of dairy farming according to its situation, and fully use the economic and geographical environment and natural resources’ endowment to maximize breeding benefits. We should support the development of large-scale farming in terms of funds and policies, promote the transition from medium-scale to large-scale farming, and improve the industrial technology system of dairy cattle farming through the effect of industrial agglomeration. In addition, we should promote intensive dairy cow farming technology, improve energy efficiency, and reduce carbon emissions in the dairy cow breeding process. The western region should continue to investigate breeding models that are appropriate for the region’s development, and appropriately strengthen large-scale and medium-scale aquaculture. Moreover, we should organically combine the dairy industry, dairy processing industry, and marketing industry, create a dairy industry with local characteristics by combining “online and offline,” and promote industry development through brand effect. Improving milk quality can also lead to increased efficiency.
This paper incorporates unexpected output into the GPDC evaluation system and employs the MinDW-MML model to comprehensively measure the green total factor productivity of China’s small, medium, and large-scale dairy industries under environmental constraints. This paper is a comprehensive static and dynamic perspective on the current state of the dairy industry in various provinces. Finally, adaptive policy recommendations are made to optimize China’s dairy industry’s green and low-carbon development. It is a useful supplement to existing achievements and a reference for the dairy industry’s future development and policy guidance. Unfortunately, this paper still has limitations despite tentative breakthroughs on some issues. In the future, we plan to concentrate on it and improve it. To begin with, according to spatial econometric theory, the flow of factors between different regions will result in the spatial correlation of input–output activities. This paper analyzes the GPDC of China based on regional heterogeneity but does not consider the spatial correlation between regions and the interaction between neighboring regions. In future research, it is necessary to quantitatively study the spatial spillover effects of the GPDC on different regions from the perspective of spatiotemporal correlations. Second, today’s economic development is accompanied by serious problems such as resource overdraft, ecological degradation, and environmental pollution, which requires the government to strengthen ecological supervision and protection and the legal protection of the ecological environment. Therefore, in future research, it is necessary to investigate the impact of environmental regulation on the green total factor productivity of the dairy industry in China.
Data availability statement
Publicly available datasets were analyzed in this study. These data can be found at: https://data.cnki.net/yearBook/single?id=N2006010336, https://data.cnki.net/ yearbook/Single/N2019120280, and https://data.cnki.net/yearbook/ Single/N2021120010.
Author contributions
JG and YF contributed to the conception and design of the study. FY organized the database, conducted the statistical analysis, and wrote the first draft of the manuscript. JG wrote parts of the manuscript and was responsible for the review and supervision of the manuscript. All authors listed have made a substantial, direct, and intellectual contribution to the work and approved it for publication. All authors contributed to the article and approved the submitted version.
Funding
This study was funded by the National Natural Science Foundation of China (72274029 and 71774027) and the National Social Science Foundation Major Projects of China (20&ZD169).
Conflict of interest
The authors declare that the research was conducted in the absence of any commercial or financial relationships that could be construed as a potential conflict of interest.
Publisher’s note
All claims expressed in this article are solely those of the authors and do not necessarily represent those of their affiliated organizations, or those of the publisher, the editors, and the reviewers. Any product that may be evaluated in this article, or claim that may be made by its manufacturer, is not guaranteed or endorsed by the publisher.
References
Ahmad, M., and Bravo-Ureta, B. E. (1995). An econometric decomposition of dairy output growth. Am. J. Agric. Econ. 77, 914–921. doi:10.2307/1243814
Aigner, D., Lovell, C. A. K., and Schmidt, P. (1977). Formulation and estimation of stochastic frontier production function models. J. Econom. 6, 21–37. doi:10.1016/0304-4076(77)90052-5
Alvarez, A., and del Corral, J. (2010). Identifying different technologies using a latent class model: Extensive versus intensive dairy farms. Eur. Rev. Agric. Econ. 37, 231–250. doi:10.1093/erae/jbq015
Battese, G. E., Rao, D. S. P., and O’Donnell, C. J. (2004). A metafrontier production function for estimation of technical efficiencies and technology gaps for firms operating under different technologies. J. Product. Anal. 21, 91–103. doi:10.1023/B:PROD.0000012454.06094.29
Briec, W. (1999). Hölder distance function and measurement of technical efficiency. J. Product. Anal. 11, 111–131. doi:10.1023/A:1007764912174
Brümmer, B., Glauben, T., and Thijssen, G. (2002). Decomposition of productivity growth using distance functions: The case of dairy farms in three European countries. Am. J. Agric. Econ. 84, 628–644. doi:10.1111/1467-8276.00324
Cabrera, V. E., Solís, D., and del Corral, J. (2010). Determinants of technical efficiency among dairy farms in Wisconsin. J. Dairy Sci. 93, 387–393. doi:10.3168/jds.2009-2307
Cecchini, L., Venanzi, S., Pierri, A., and Chiorri, M. (2018). Environmental efficiency analysis and estimation of CO2 abatement costs in dairy cattle farms in Umbria (Italy): A SBM-DEA model with undesirable output. J. Clean. Prod. 197, 895–907. doi:10.1016/j.jclepro.2018.06.165
Charnes, A., Cooper, W. W., and Rhodes, E. (1978). Measuring the efficiency of decision making units. Eur. J. Oper. Res. 2, 429–444. doi:10.1016/0377-2217(78)90138-8
Charnes, A., Rousseau, J. J., and Semple, J. H. (1996). Sensitivity and stability of efficiency classifications in data envelopment analysis. J. Product. Anal. 7, 5–18. doi:10.1007/BF00158473
Cheng, L., Yin, C., and Chien, H. (2015). Demand for milk quantity and safety in urban China: Evidence from beijing and harbin. Aust. J. Agric. Resour. Econ. 59, 275–287. doi:10.1111/1467-8489.12065
Chung, Y. H., Färe, R., and Grosskopf, S. (1997). Productivity and undesirable outputs: A directional distance function approach. J. Environ. Manage. 51, 229–240. doi:10.1006/jema.1997.0146
El Ghak, T., Gdairia, A., and Abassi, B. (2021). High-tech entrepreneurship and total factor productivity: The case of innovation-driven economies. J. Knowl. Econ. 12, 1152–1186. doi:10.1007/s13132-020-00659-9
Färe, R., Grosskopf, S., Lindgren, B., and Roos, P. (1992). Productivity changes in Swedish pharamacies 1980–1989: A non-parametric malmquist approach. J. Product. Anal. 3, 85–101. doi:10.1007/BF00158770
Fisher-Vanden, K., Jefferson, G. H., Liu, H., and Tao, Q. (2004). What is driving China’s decline in energy intensity? Resour. Energy Econ. 26, 77–97. doi:10.1016/j.reseneeco.2003.07.002
Fuller, F., Huang, J., Ma, H., and Rozelle, S. (2006). Got milk? The rapid rise of China’s dairy sector and its future prospects. Food Policy 31, 201–215. doi:10.1016/j.foodpol.2006.03.002
Jan, P., Dux, D., Lips, M., Alig, M., and Dumondel, M. (2012). On the link between economic and environmental performance of Swiss dairy farms of the alpine area. Int. J. Life Cycle Assess. 17, 706–719. doi:10.1007/s11367-012-0405-z
Jiang, N., and Sharp, B. (2015). Technical efficiency and technological gap of New Zealand dairy farms: A stochastic meta-frontier model. J. Product. Anal. 44, 39–49. doi:10.1007/s11123-015-0429-z
Lansink, A. O., and Reinhard, S. (2004). Investigating technical efficiency and potential technological change in Dutch pig farming. Agric. Syst. 79, 353–367. doi:10.1016/S0308-521X(03)00091-X
Latruffe, L., Fogarasi, J., and Desjeux, Y. (2012). Efficiency, productivity and technology comparison for farms in Central and Western Europe: The case of field crop and dairy farming in Hungary and France. Econ. Syst. 36, 264–278. doi:10.1016/j.ecosys.2011.07.002
Leng, B.-B., Gong, J., Zhang, W., and Ji, X.-Q. (2017). Study on the measurement and calculation of environmental pollution bearing index of China’s pig scale. IOP Conf. Ser. Earth Environ. Sci. 94, 012052. doi:10.1088/1755-1315/94/1/012052
Li, B., and Wu, S. (2017). Effects of local and civil environmental regulation on green total factor productivity in China: A spatial durbin econometric analysis. J. Clean. Prod. 153, 342–353. doi:10.1016/j.jclepro.2016.10.042
Li, R., Wang, Q., Liu, Y., and Jiang, R. (2021). Per-capita carbon emissions in 147 countries: The effect of economic, energy, social, and trade structural changes. Sustain. Prod. Consum. 27, 1149–1164. doi:10.1016/j.spc.2021.02.031
Liu, C., Cui, L., and Li, C. (2022). Impact of environmental regulation on the green total factor productivity of dairy farming: Evidence from China. Sustainability 14, 7274. doi:10.3390/su14127274
Ma, H., Oxley, L., Rae, A., Fan, C., Huang, J., and Rozelle, S. (2012). The evolution of productivity performance on China’s dairy farms in the new millennium. J. Dairy Sci. 95, 7074–7085. doi:10.3168/jds.2012-5529
Madau, F. A., Furesi, R., and Pulina, P. (2017). Technical efficiency and total factor productivity changes in European dairy farm sectors. Agric. Food Econ. 5, 17. doi:10.1186/s40100-017-0085-x
Meeusen, W., and van Den Broeck, J. (1977). Efficiency estimation from cobb-douglas production functions with composed error. Int. Econ. Rev. 18, 435. doi:10.2307/2525757
Mei, G., Gan, J., and Zhang, N. (2015). Metafrontier environmental efficiency for China’s regions: A slack-based efficiency measure. Sustainability 7, 4004–4021. doi:10.3390/su7044004
Moreira, V. H., and Bravo-Ureta, B. E. (2016). Total factor productivity change in dairy farming: Empirical evidence from southern Chile. J. Dairy Sci. 99, 8356–8364. doi:10.3168/jds.2016-11055
Newman, C., and Matthews, A. (2006). The productivity performance of Irish dairy farms 1984–2000: A multiple output distance function approach. J. Product. Anal. 26, 191–205. doi:10.1007/s11123-006-0013-7
Njuki, E., Bravo-Ureta, B. E., and Mukherjee, D. (2016). The good and the bad: Environmental efficiency in northeastern U.S. Dairy farming. Agric. Resour. Econ. Rev. 45, 22–43. doi:10.1017/age.2016.1
O’Donnell, C. J., Rao, D. S. P., and Battese, G. E. (2008). Metafrontier frameworks for the study of firm-level efficiencies and technology ratios. Empir. Econ. 34, 231–255. doi:10.1007/s00181-007-0119-4
Oh, D. (2010). A global Malmquist-Luenberger productivity index. J. Product. Anal. 34, 183–197. doi:10.1007/s11123-010-0178-y
Oh, D., and Lee, J. (2010). A metafrontier approach for measuring Malmquist productivity index. Empir. Econ. 38, 47–64. doi:10.1007/s00181-009-0255-0
Olagunju, K. O., Sherry, E., Samuel, A., and Caskie, P. (2022). Unpacking total factor productivity on dairy farms using empirical evidence. Agriculture 12, 225. doi:10.3390/agriculture12020225
Reinhard, S., Knox Lovell, C. A., and Thijssen, G. J. (2000). Environmental efficiency with multiple environmentally detrimental variables; estimated with SFA and DEA. Eur. J. Oper. Res. 121, 287–303. doi:10.1016/S0377-2217(99)00218-0
Shen, Y., Yue, S., Sun, S., and Guo, M. (2020). Sustainable total factor productivity growth: The case of China. J. Clean. Prod. 256, 120727. doi:10.1016/j.jclepro.2020.120727
Sobczyński, T., Klepacka, A. M., Revoredo-Giha, C., and Florkowski, W. J. (2015). Dairy farm cost efficiency in leading milk-producing regions in Poland. J. Dairy Sci. 98, 8294–8307. doi:10.3168/jds.2014-9030
Tian, X., Sun, F., and Zhou, Y. (2015). Technical efficiency and its determinants in China’s hog production. J. Integr. Agric. 14, 1057–1068. doi:10.1016/S2095-3119(14)60989-8
Wang, P., and Ji, J. (2017). Research on China’s mariculture efficiency evaluation and influencing factors with undesirable outputs—An empirical analysis of China’s ten coastal regions. Aquac. Int. 25, 1521–1530. doi:10.1007/s10499-017-0131-4
Wang, Q., Wang, L., and Li, R. (2023a). Trade protectionism jeopardizes carbon neutrality – decoupling and breakpoints roles of trade openness. Sustain. Prod. Consum. 35, 201–215. doi:10.1016/j.spc.2022.08.034
Wang, Q., Wang, X., and Li, R. (2022). Does urbanization redefine the environmental kuznets curve? An empirical analysis of 134 countries. Sustain. Cities Soc. 76, 103382. doi:10.1016/j.scs.2021.103382
Wang, Q., Yang, T., and Li, R. (2023b). Does income inequality reshape the environmental kuznets curve (ekc) hypothesis? A nonlinear panel data analysis. Environ. Res. 216, 114575. doi:10.1016/j.envres.2022.114575
Wang, Q., Zhang, F., and Li, R. (2023c). Revisiting the environmental kuznets curve hypothesis in 208 counties: The roles of trade openness, human capital, renewable energy and natural resource rent. Environ. Res. 216, 114637. doi:10.1016/j.envres.2022.114637
Wang, Q., Zhang, H., and Zhang, W. (2013). A Malmquist CO 2 emission performance index based on a metafrontier approach. Math. Comput. Model. 58, 1068–1073. doi:10.1016/j.mcm.2012.05.003
Wang, Y., Li, Y., Zhu, Z., and Dong, J. (2021). Evaluation of green growth efficiency of oil and gas resource-based cities in China. Clean. Technol. Environ. Policy 23, 1785–1795. doi:10.1007/s10098-021-02060-9
Yan, Z., Wang, C., and Liu, T. (2020). An analysis of the environmental efficiency of pig farms and its determinants—A field study from China. Environ. Sci. Pollut. Res. 27, 38084–38093. doi:10.1007/s11356-020-09922-7
Yao, X., Feng, W., Zhang, X., Wang, W., Zhang, C., and You, S. (2018). Measurement and decomposition of industrial green total factor water efficiency in China. J. Clean. Prod. 198, 1144–1156. doi:10.1016/j.jclepro.2018.07.138
Yu, Y., Huang, J., and Zhang, N. (2019). Modeling the eco-efficiency of Chinese prefecture-level cities with regional heterogeneities: A comparative perspective. Ecol. Model. 402, 1–17. doi:10.1016/j.ecolmodel.2019.03.012
Zhong, S., Li, J., Chen, X., and Wen, H. (2021a). A multi-hierarchy meta-frontier approach for measuring green total factor productivity: An application of pig breeding in China. Socioecon. Plann. Sci. 101152, 101152. doi:10.1016/j.seps.2021.101152
Zhong, S., Li, J., Chen, X., and Wen, H. (2021b). Research on the green total factor productivity of laying hens in China. J. Clean. Prod. 315, 128150. doi:10.1016/j.jclepro.2021.128150
Zhong, S., Li, J., and Qu, Y. (2022a). Green total factor productivity of dairy cow in China: Key facts from scale and regional sector. Technol. Forecast. Soc. Change 183, 121949. doi:10.1016/j.techfore.2022.121949
Zhong, S., Li, J., and Zhang, D. (2022b). Measurement of green total factor productivity on Chinese pig breeding: From the perspective of regional differences. Environ. Sci. Pollut. Res. 29, 27479–27495. doi:10.1007/s11356-021-17908-2
Zhou, Y., Zhang, X., Tian, X., Geng, X., Zhang, P., and Yan, B. (2015). Technical and environmental efficiency of hog production in China – a stochastic frontier production function analysis. J. Integr. Agric. 14, 1069–1080. doi:10.1016/S2095-3119(14)60990-4
Zhou, Z.-Y., Tian, W.-M., and Zhou, J.-L. (2002). The emerging dairy economy in China: Production, consumption and trade prospects. Australas. Agribus. Rev. 10, 1–17. doi:10.22004/ag.econ.206159
Keywords: dairy cow, MinDW-MML model, regional heterogeneity, unexpected output, green total factor productivity
Citation: Guo J and Fu Y (2023) Green total factor productivity of dairy cows in China: essential facts from the perspective of regional heterogeneity. Front. Environ. Sci. 11:1164770. doi: 10.3389/fenvs.2023.1164770
Received: 13 February 2023; Accepted: 27 April 2023;
Published: 11 May 2023.
Edited by:
Rongrong Li, China University of Petroleum (East China), ChinaReviewed by:
Muhammad Haroon Shah, Wuxi University, ChinaQiang Wang, China University of Petroleum, Huadong, China
Stavros Sindakis, Hellenic Open University, Greece
Copyright © 2023 Guo and Fu. This is an open-access article distributed under the terms of the Creative Commons Attribution License (CC BY). The use, distribution or reproduction in other forums is permitted, provided the original author(s) and the copyright owner(s) are credited and that the original publication in this journal is cited, in accordance with accepted academic practice. No use, distribution or reproduction is permitted which does not comply with these terms.
*Correspondence: Yu Fu, bW9udG9uZV9zQDE2My5jb20=