 Linwei Wang
 Qian Chang2
94% of researchers rate our articles as excellent or good
Learn more about the work of our research integrity team to safeguard the quality of each article we publish.
Find out more
ORIGINAL RESEARCH article
Front. Environ. Sci. , 21 August 2023
Sec. Environmental Economics and Management
Volume 11 - 2023 | https://doi.org/10.3389/fenvs.2023.1162502
Achieving green, healthy, and cyclical development in China’s pig industry not only enables the adjustment of the rural industrial structure but also helps meet community demand for safe meat, thus playing a critical role in promoting sustainable agricultural development. This research utilizes panel data from 21 provinces (districts) in China from 2004 to 2021 to construct an evaluation system for green total factor productivity in pig breeding (PGTFP). The super-efficient slacks-based measure (SBM) model is employed to measure PGTFP. Conversely, regional disparities in PGTFP are determined using the Dagum Gini coefficient method. Furthermore, we analyzed the convergence of pig breeding in different regions. The findings indicate that PGTFP in China exhibits fluctuations, with the highest PGTFP, observed in areas of constrained development. Development differences in PGTFP across China have gradually diminished, with the greatest development differences observed within potential growth areas. Furthermore, disparities between focused development areas and potential growth areas are the most pronounced and are primarily attributable to the super-variable density. Both α- and β-convergence are observed for PGTFP at the national level and within each breeding area. However, the α-convergence pattern during COVID-19 is not obvious. Consequently, the formulation of differentiated farming development strategies and fostering the coordinated development of pig breeding in all regions have become imperative. Meanwhile, preparing contingency prevention measures to promote stable and high-quality pig breeding is necessary.
Pig breeding is a pivotal industry for agricultural economic development and plays a crucial role in ensuring food security and improving the wellbeing of communities. With increasing demand in the pork market, scale and green pig breeding have received growing emphasis. This places higher requirements on both the quantity and quality of pig breeding. Traditional crude pig breeding faces two significant challenges. First, lower production efficiency is an issue because of the rising costs associated with pig breeding (Woyengo et al., 2014). Second, increased pollution resulting from animal intestinal fermentation and the management of animal manure emissions in large-scale farming remains an issue (Huang et al., 2019; Huang and Zhang, 2022). Therefore, considering the effective supply of pig breeding and ecological environmental protection, promoting the green development of pig breeding has become an effective approach to fostering the high-quality development of the farming industry and is an important initiative for achieving carbon peaking and carbon neutrality. Relevant departments attach great importance to the green development of pig breeding, as exemplified by the Ministry of Agriculture’s list of demonstration counties for the green development of animal husbandry. Their aim is to drive the green transformation and upgrading of animal husbandry in these counties and promote the overall development of animal husbandry nationwide. The key points of Green Development in Agriculture and Rural Areas underscore the importance of enhancing the coverage rate of manure-free treatment equipment in large-scale farms, optimizing the resource utilization of livestock and poultry manure across different regions, and guiding farmers to reduce volatile ammonia emissions. Furthermore, “Opinions on the Key Work of the Comprehensive Promotion of Rural Revitalization” emphasizes the promotion of green production methods, the enhancement of sustainable agricultural development, and the implementation of five major actions for green agricultural development. This includes the reduction of carbon emissions from livestock and poultry.
The assessment of total factor productivity (TFP) is significant in agricultural production research. Initially, TFP measurement solely focused on efficiency and did not account for environmental costs. However, under the concept of sustainable development, scholars began considering the importance of achieving coordinated economic efficiency and environmental effects (Kung et al., 2015). Chung et al. (1997) incorporated environmental costs into the efficiency analysis framework to introduce a new research paradigm for comprehensive efficiency assessment. The green total factor productivity of pig breeding (PGTFP) refers to the lowest resource consumption for achieving as much output as possible while minimizing the negative impact of pig breeding on the environment. PGTFP is an important indicator of the environmental and economic benefits of pig breeding development (Jia et al., 2021). The pig breeding industry has the most significant carbon emissions in the agricultural sector. Thus, focusing on PGTFP is not only essential for promoting an ecological culture and ensuring national food security, but it also aligns with the principles of “green water and green mountains are mountains of gold and silver” in pig breeding. In China, the pig breeding industry has transitioned from emphasizing factor inputs to accelerating technological progress and enhancing TFP. There has also been a shift from prioritizing “green and development” to “high-quality green development.” To achieve high-quality green development, the relationships between the economy, resources, and environment within the pig breeding industry must be effectively coordinated. Establishing a scientifically sound set of PGTFP measurement indicators and accurately grasping the evolving trends in PGTFP are necessary to promote the sustainable development of the pig breeding industry (Miguel et al., 2015).
Nevertheless, significant variations in resource endowment, economic development, policy direction, and technological levels among different regions result in geographical disparities in regional PGTFP. Moreover, the process of transitioning from traditional to modern agriculture may entail distinct characteristics in the green development of pig breeding. Therefore, addressing several questions regarding the measurement of PGTFP, its regional disparities under China’s pig breeding zoning policy, the convergence of PGTFP growth over time in each region, and the key factors influencing its growth are critical. These questions serve as prerequisites for formulating diverse agricultural and green development policies. Hence, this study first explores the role of each factor in enhancing PGTFP, building upon a comprehensive review of the literature and clarifying the logical connections between them. Second, we construct an effective indicator system for measuring PGTFP to assess its value. Subsequently, based on the index measurement, the dynamic evolution trends of PGTFP in focused, constrained, potential, and moderate development areas, along with the internal and external disparities in development, are analyzed in depth, utilizing the division of Chinese pig breeding areas as the measurement index. Finally, the convergence status of green development in each farming area is investigated, and the key factors affecting changes in PGTFP are analyzed.
Regarding the measurement and exploration of PGTFP, scholars have conducted extensive research using models such as the data envelopment approach (DEA), directional distance function (DDF), stochastic frontier analysis (SFA), and slacks-based measure (SBM). For instance, Njuki et al. (2016) utilized the DEA–Malmquist model to measure the efficiency of on-farm pig breeding in the USA, considering greenhouse gases as non-desired outputs. Yang (2009) employed the DDF to estimate the environmental efficiency and productivity of pig breeding in Taiwan. Han et al. (2020) used the SBM model to measure the TFP of the livestock environment in provincial and major livestock production areas from 2001 to 2017. Wang and Tian (2022) employed an endogenous DDF to measure PGTFP in China. They considered pollutants such as chemical oxygen demand as non-desired outputs and decomposed the sources of productivity growth into efficiency improvement and technological progress. Onyenweaku and Effiong (2006) utilized the SFA method to measure pig productivity in Nigeria and investigate the factors influencing it. Common non-desired output indicators include measures of chemical oxygen demand (COD), total nitrogen (TN), and total phosphorus (TP) surface source pollution values for PGTFP (Jia et al., 2021; Zhong et al., 2022a).
Scholars have subsequently focused on the following aspects to conduct more in-depth research:
The first is an analysis of the current situation of PGTFP and a comparison of regional differences. Different regions have distinct historical developments, geographic locations, and economic conditions, leading to variations in PGTFP characteristics (Daxini et al., 2018). Zhao et al. (2015) compared and analyzed the efficiency transfer of traditional production areas: the central, northeastern, coastal, and southwestern regions. They found that the pig breeding industry shifted to the central region without a corresponding increase in efficiency. Zhong et al. (2022b) analyzed the differences in green pig breeding between East and West China based on dominant pig breeding regions, revealing significantly higher PGTFP in the West than in the East and Central regions owing to the different transportation and environmental locations between these regions. Wang et al. (2020) analyzed pig breeding efficiency between farms and emphasized the need to narrow the farm gap to improve efficiency. Moreover, differences in pig feeding practices, business practices, and waste disposal result in variations in PGTFP (Galanopoulos et al., 2006; Zhuang et al., 2019).
The second focus of in-depth research is the analysis of the drivers of PGTFP. Studies from different perspectives and scales have confirmed that farmers exhibit a strong willingness to adopt green practices to balance benefits and risks. Internal and external factors influencing the green development of agriculture have been discussed. On the one hand, awareness of environmental protection among agricultural producers is positively correlated with adopting green production behavior and promotes the growth of PGTFP (Obubuafo et al., 2008). On the other hand, the allocation of production factors cannot be ignored; these mainly include the allocation of agricultural producers to factors such as technology, labor, and capital. Liu et al. (2021) also confirmed the considerable influence of the effective allocation of production factors on the efficiency of green production in agriculture. The external factors mainly include supervision, regulation, and incentives. Government regulation is critical to supervising the green development of pig breeding. Ma et al. (2022) and Liu C. et al. (2022) confirmed the positive impact of environmental regulation on green and sustainable agricultural development. Furthermore, He et al. (2023) explored the pressure brought on by government regulation on the green production behavior of pig breeding farmers. This included regulations related to green farming issued by the government and the design of a traceability system for pig meat products. These measures prompted pig farmers to adjust their long-term production behavior to meet their government‘s requirements and promote the sustainable development of pig breeding. Incentives are mainly derived from financial support, digital promotion, and industry aggregation. Rural finance not only provides financial support for green production through credit and insurance but also protects against agricultural risks (Yu et al., 2020; Fang et al., 2021; Li et al., 2022a). Jiang J. et al. (2022) explored the impact of the digital economy on the level of green agricultural development based on panel data from 30 Chinese provinces from 2011 to 2020; they found that the digital economy can effectively enhance the level of green agricultural development. The positive dividend is mainly concentrated in the east-central region, with significant regional heterogeneity. In addition, industrial agglomeration can affect PGTFP by attracting the concentration of production factors, reducing transaction costs, and increasing the degree of specialization in the division of labor to form economies of scale (Jiang Q. et al., 2022).
Furthermore, the convergence of economic growth that includes agricultural economic development has been widely discussed, the current discussion focuses mainly on the macro level. However, what is lacking is an in-depth exploration of convergence among regions regarding a specific farming species due to the variations in time and the regions studied. Shen et al. (2022) discussed the convergence of green production efficiency in Africa, revealing different types of Club convergence. Zhuang et al. (2022) explored the efficiency of agricultural green development in East and West China and found strong convergence, particularly in the East. Hu (2023) confirmed significant beta convergence in green TFP in Chinese agriculture, although the convergence was not significant in the western region.
While research on PGTFP is extensive and critical for understanding the current situation, impact mechanisms, interconnection with rural development, and improving green development in pig breeding, there are still some shortcomings. Existing studies lack uniformity in the measurement standards of PGTFP and often overlook agricultural carbon emissions, leading to measurement errors. Systematic and in-depth analyses of the current situation and the characteristics of green pig breeding are lacking, particularly analyses that explore regional differences beyond the East and West regions. Moreover, few studies have addressed the convergence of PGTFP and analyzed the influencing factors of green pig breeding based on conditional convergence. To address these gaps, this study employs data from 21 provinces in China from 2004 to 2021 to measure PGTFP using the super-efficient SBM model. It provides a comprehensive analysis of the dynamic evolution of regional PGTFP trends, assesses regional differences using the Dagum Gini coefficient, and investigates regional convergence.
Compared with existing studies, the possible contributions of this paper include the following three points. First, it is an exploratory construction of the PGTFP measurement index system and an analysis of the PGTFP evolution trend both overall and from the perspectives of different breeding areas, which helps to deepen the understanding of the current situation. Second, the differences within and between regions in the development of green pig breeding are explored in depth from a new perspective based on different breeding regions divided by countries, with a view to providing a reference basis for the precise formulation of sustainable development policies for diversified pig breeding. Third, this paper conducts a in-depth analysis of the effectiveness of green pig breeding under different convergence states, discusses the driving factors of pig breeding convergence, and enriches antecedent PGTFP research.
The Super SBM model measures PGTFP at different scales in each province. Tone (2004) constructed the non-expected output SBM model based on the Tone (2001) SBM model. It is assumed that there are
Here,
The Gini coefficient of Dagum (1997) is used to decompose the regional differences in the PGTFP growth index. The total Gini coefficient can be decomposed into intra-regional variation, interregional variation, and hyper-variance density contribution.
Total Gini coefficient:
Here,
Intra-regional differences:
Interregional differences:
Super variable density contribution:
Here,
Barro and Sala-i-Martin (1992) defined the concept of convergence from an econometric perspective and classified it into two categories: α-convergence and
α-convergence implies a state of decreasing differences in PGTFP across regions, which is manifested by a negative correlation between the rate of elevation and the initial level (Qi et al., 2020); it is generally chosen to be measured by the coefficient of variation, which indicates the presence of α-convergence when the coefficient of variation value shows a decreasing trend over time.
where n is the total number of districts,
According to the hypothesis of diminishing marginal returns of factors in neoclassical growth theory, the absolute convergence hypothesis presupposes that economically backward regions with the same development structure have higher economic growth rates than economically developed regions, thus achieving economic convergence. In this paper, absolute
Here,
Endogenous growth theory assumes that the state of convergence of variables varies depending on the influence of external conditions so conditional
Here,
Constructing reasonable input–output indicators is essential for proper, accurate efficiency evaluation. Different inputs and outputs yield varying efficiency measurement results, thereby impacting the accuracy of the evaluation. In this study, we draw on relevant studies on PGTFP measurement and select five input indicators, one desired output, and three non-desired outputs to be included in the super-efficiency SBM model to be measured (Du et al., 2019).
1. Input variable: The variables are obtained from the “National Compilation of Agricultural Cost-Benefit Information.” Physical capital comprises piglet weight, the quantity of concentrate feed, and the quantity of grain consumed. Labor input refers to the total number of days of household labor and hired labor per pig. Production costs encompass direct and indirect costs. Direct costs include the initial cost of raising pigs, feed processing, water, fuel, medical, technical, and maintenance costs. Indirect costs include depreciation of fixed assets, insurance, management, finance, taxes, and marketing costs. To eliminate the effects of inflation and other factors, the article uses 2004 as the base period and deflates the production cost data in the input index by using the price index of agricultural production materials in each province.
2. Desired output: The net production of hogs is used as the desired output indicator, obtained by subtracting the weight of piglets from the production of the main product.
3. Undesired outputs: Carbon emissions are the total carbon dioxide emissions from piglets to farrowing—primarily CH4 and N2O emissions from enteric fermentation and manure disposal of pigs. Indicator selection and data references are based on the 2006 IPCC Guidelines for National Greenhouse Gas Inventories. The formula for measuring carbon emissions from pig breeding is:
In formula (9), QC represents total carbon emissions from pig breeding. QF is the CH4 emission from enteric fermentation in hogs. QM is the carbon emission from the manure management system of hogs. EF is the CH4 emission factor from enteric fermentation in hogs, with a value of 1. GWPCH4 is the global warming potential value of CH4, with a value of 21. CEMC and CEMN represent the CH4 and N2O emissions from the manure management system. EF is the feeding period for hogs. EFMC is the CH4 emission factor from the manure management system, with a value of 4. DN is the daily carbon emission of hogs, with a value of 0.42. AW is the average body weight of the hog. EFMN is the N2O emission factor of the manure management system, with a value of 0.002. GWPN2O is the GWP value of N2O, with a value of 310.
Surface source pollution and heavy metal pollution are based on the discharge coefficients of livestock farms in the “First National Pollution Source Census: Livestock and Poultry Farming Source Output and Discharge Coefficient Manual.” The emissions of COD, TN, TP, Cu, and Zn are primarily measured during the nursery and fattening periods. Furthermore, the article classifies the data on pig farming in the aforementioned manual into professional farming households corresponding to retail households and small-scale, scale farming corresponding to medium-scale, and farming communities corresponding to large-scale. The percentages of cleaning away dry manure and water-flushing manure for retail households and small-scale farms are 4.12% and 95.88%, respectively. The percentages for medium-scale farms are 7.15% and 92.85%, respectively. For large-scale farms, the percentages are 55.40% and 44.59%, respectively. The formulas for measuring surface source pollution and heavy metal pollution are:
Here, US represents surface source pollution, and UH represents heavy metal pollution. UCOD, UTN, UTP, UCu, and UZn represent the amount of pollution from COD, TN, TP, Cu, and Zn, respectively. In formula (14), j takes the values 1 and 2 to represent dry manure removal and water-flushing manure removal, respectively. k takes 1 and 2 to represent the nursery and fattening stages of hogs, respectively. i takes 1, 2, 3, and 4 to represent retail, small, medium, and large scales, respectively. Cij is the proportion of the jth manure removal method in the ith scale of pig breeding. Fi,j,k represents the daily pollution coefficient of the jth manure removal method in the kth pig breeding stage of the ith scale hog farm. Tk represents the number of feeding days in the kth pig breeding stage. W represents the actual weight of hogs in the National Compilation of Cost and Benefit of Agricultural Products. W0 is the reference weight of hogs in the Manual of Source Production and Discharge Coefficients of Livestock and Poultry Farming. Table 1 shows the details of the PGTFP measurements.
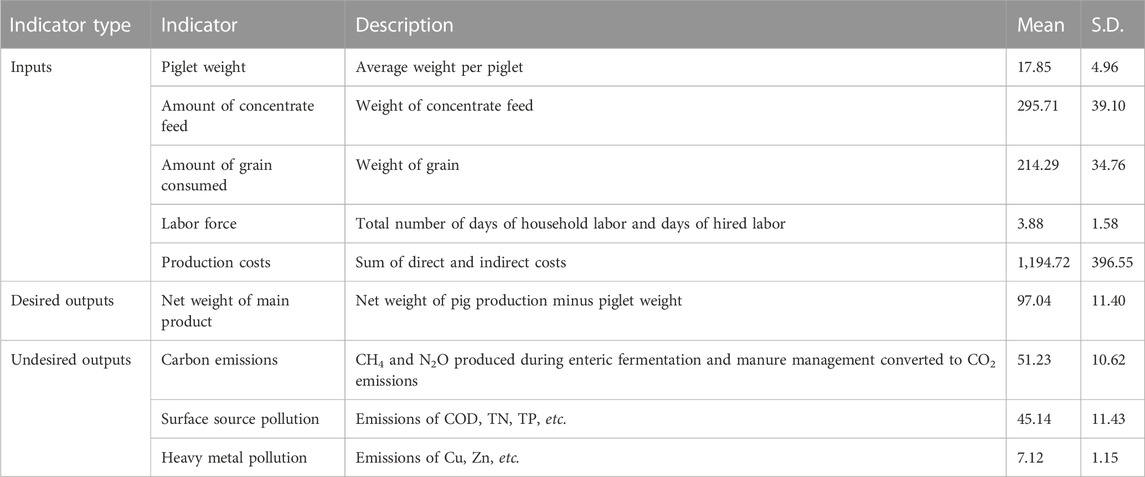
TABLE 1. Definition and description of PGTFP.
This paper uses panel data on pig breeding from 21 provinces of China from 2004 to 2021 for the following reasons: first, due to the specificity of pig breeding data, there is a mismatch of data from retail, small-scale, medium-scale, and large-scale provinces, and there is a need to maintain the consistency of pig breeding-scale research objects in different regions. Second, taking into account the key provinces of the National Pig Production Development Plan (2008–2015) and the National Pig Production Development Plan (2016–2020) on the regional division of pig breeding, the 21 main producing provinces in the dominant pig production area were selected as the research objects for analysis. According to the National Pig Production Development Plan, the country can be divided into four breeding areas: focused development (F), constrained development (C), potential growth (P), and moderate development (M) areas. F comprises seven provinces: Sichuan, Chongqing, Hebei, Henan, Shandong, Guangxi, and Hainan. C comprises the six provinces of Hubei, Hunan, Guangdong, Anhui, Jiangsu, and Zhejiang. P comprises the five provinces of Yunnan, Guizhou, Heilongjiang, Jilin, and Liaoning. M comprises the three provinces of Qinghai, Shaanxi, and Shanxi. The data used are mainly from the National Compilation of Cost and Benefit Information for Agricultural Products, the First National Pollution Source Census: Manual of Production and Discharge Coefficients for Livestock and Poultry Breeding Sources, the China Statistical Yearbook, the China Rural Statistical Yearbook, the China Environmental Statistical Yearbook, the WIEGO database, and the statistical yearbooks and bulletins of the 21 provinces (autonomous regions) in China.
Based on the research model, PGTFP was calculated for 21 provinces from 2005 to 2021; Figure 1 shows the overall PGTFP and that of different farming areas. The period 2005–2021 showed a fluctuating and slight decline in overall PGTFP and in each scale. However, it varied across different time stages. From an overall perspective, the 2005–2021 national PGTFP showed a fluctuating decline–stable rise–continuous decline trend. The first stage, from 2005 to 2011, saw PGTFP drop from 1.0199 in 2005 to 0.9337 in 2011—a large fluctuation decline. This was mainly due to the blue ear disease outbreak in 2006, which impacted the pig industry, and the swine flu outbreak in 2009, which led to a significant decline in pork prices, affecting pig production. The second stage, from 2011 to 2017, witnessed a steady rise in PGTFP, increasing from 0.9337 in 2011 to 1.0368 in 2017. This rise was driven by the vigorous promotion of national policies on green pig breeding, facilitating continuous pig breeding development. The third stage, from 2017 to 2021, saw PGTFP decline from 1.0368 in 2017 to 0.9439 in 2021. This was primarily attributable to the emergence of African swine fever in 2018, which significantly increased the mortality rate of live pigs and, subsequently, decreased the green TFP of pig breeding. Meanwhile, the COVID-19 outbreak in 2020 and 2021 would also have some impact on PGTFP.
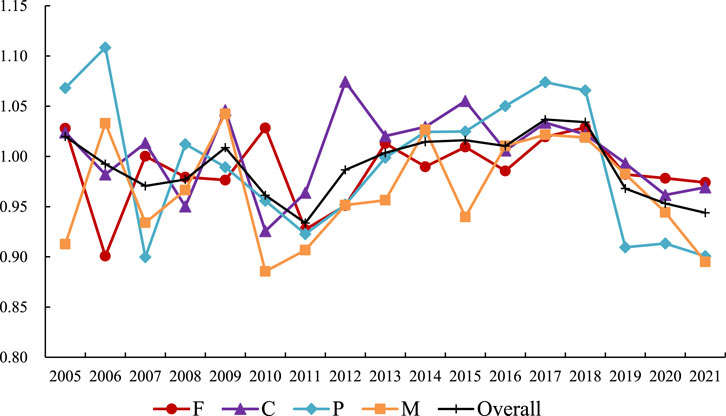
FIGURE 1. PGTFP for the whole country and different breeding areas, 2005–2021.
Regarding different farming areas, the PGTFP growth of all farming areas showed fluctuating changes from 2005 to 2021. Based on the mean results, the constrained development area exhibited the largest PGTFP, with a mean value of 1.0041, followed by the potential growth and focused development areas, with mean values of 0.9923 and 0.9866, while the moderate development area had the smallest PGTFP, with a mean value of 0.8950. The focused development area showed a fluctuating decreasing trend between 2005 and 2021, with larger fluctuations from 2005 to 2013 and more moderate fluctuations from 2014 to 2021, decreasing from 1.0281 in 2005 to 0.9741 in 2021. The constrained development area displayed a fluctuating increase and then decrease, rising from 1.0238 in 2005 to 1.0743 in 2012 and then decreasing to 0.9692 in 2021. The potential growth area experienced a cyclical evolution of continuous fluctuations in PGTFP from 1.0682 in 2005 to 0.9007 in 2021. The moderate development area exhibited a cyclic evolution of Small U–Large U–Small U, with PGTFP values of 0.9128 in 2005, 0.8855 in 2010, 0.9397 in 2015, and 0.8950 in 2021. Overall, the growth rate of each breeding area did not change significantly, and the overall development was relatively stable.
Table 2 presents the overall Gini coefficient of PGTFP. The national PGTFP difference decreased from 0.0785 in 2005 to 0.0703 in 2021—a decrease of 10.47%. This indicates that, with the growing emphasis on green agricultural development, each region has been consistently improving its green production efficiency in pig breeding. Hence, the gaps between regions have been narrowing, leading to synergistic development.
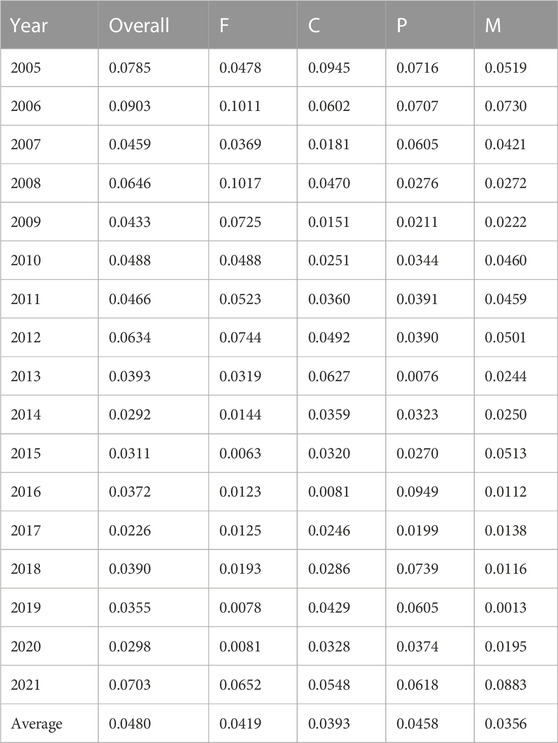
TABLE 2. Overall and intraregional variation in PGTFP.
When examining the internal differences within each pig breeding region, the potential growth area (P) was found to exhibit the largest PGTFP differences. This was followed by the focused development area (F) and the constrained development area (C), while the moderate development region (M) had the smallest differences. However, all breeding regions showed a trend of decreasing differences over time. Among them, the fastest convergence was in C and the slowest convergence was in M. F decreased from 0.0478 in 2005 to 0.0081 in 2020 and then increased to 0.0652 in 2021. C experienced the fastest convergence of differences, decreasing from 0.0945 in 2005 to 0.0548 in 2021, which is a decrease of 42.03% with an average annual reduction rate of 3.57%. P decreased from 0.0716 in 2005 to 0.0618 in 2021—a decrease of 13.64% with an average annual reduction rate of 0.97%. M exhibited the slowest convergence rate, decreasing from 0.0519 in 2005 to 0.0013 in 2019, then increasing to 0.0883 in 2021. The differences within each breeding area can be attributed to factors such as breeding scale, technical level, production conditions, resource endowment, and epidemic challenges. This results in varying internal differences. Based on the pig breeding division, F has been the main support area for national pig breeding. Before the COVID-19 epidemic, the gap within F was always in a fluctuating and narrowing state, reflecting the increasing level of green development of pig breeding during the COVID-19 epidemic, which led to a shift in resource allocation and a brief restriction on the green development of pig breeding in some areas, which widened the gap. C included Hubei, Hunan, Guangdong, Anhui, Jiangsu, and Zhejiang provinces with a high level of regional economic development, so that, although the gap gradually widened in 2021 due to the impact of the COVID-19 epidemic, the overall development difference gradually narrowed compared to 2005. P mainly refers to the area with a smaller breeding scale but a larger development potential. This includes three northeastern provinces and two southwestern regions in Guizhou and Yunnan, with large differences in production conditions between regions and different pig-rearing technologies and management levels. This has led to obvious gaps in the development process of P. Meanwhile, the slowest convergence rate in P may stem from differences in regional technological innovation and market expansion. This has led to a longer convergence time for PGTFP differences between regions. However, M consists of regions with moderate farming scales and stable development, resulting in relatively smaller internal gaps. However, it was affected by the COVID-19 epidemic, and the gap gradually widened in 2020 and 2021, probably stemming from the large difference in economic development levels between regions in M. When an outbreak occurs, the ability of regions to withstand risks subsequently decreases, leading to a widening gap in PGTFP between the regions.
Table 3 illustrates the interregional differences of PGTFP. Comparing the interregional differences, the mean value of the interregional differences between F and C from 2005 to 2021 is 0.0473. The mean value of the interregional differences between F and P is 0.0549. The mean value of the interregional differences between F and M is 0.0483. The mean value of the interregional differences between C and P is 0.0529. The mean value of the interregional differences between C and M is 0.0466. Finally, the mean value of the difference between P and M is 0.0515. This indicates that the greatest difference is between F and P, followed by that between C and P. The least difference is between C and M. This discrepancy may arise from the fact that F areas receive priority support in government regional planning, leading to more policy support, investment guidance, financial backing, and market share; thus, PGTFP increases. In contrast, P areas have limited government support and often face challenges, such as weak market exposure, insufficient technological innovation, and inefficient resource allocation, resulting in significant differences in development direction and market positioning between the two regions.

TABLE 3. Interregional differences in PGTFP.
Regarding regional differences within each breeding area, all differences between the areas show a trend of continuous convergence between 2005 and 2021. The regional difference between F and C decreased from 0.0790 in 2005 to 0.0634 in 2021, indicating a 19.72% decrease with an average annual reduction rate of 1.36%. The regional difference between F and P decreased from 0.0699 in 2005 to 0.0387 in 2020, then increased to 0.0727 in 2021. The difference between F and M decreased from 0.0701 in 2005 to 0.0201 in 2020, then increased to 0.0889 in 2021. The regional difference between the constrained development area and the potential growth area decreased from 0.0940 in 2005 to 0.0671 in 2021, indicating a 28.56% decrease with an average annual reduction rate of 2.08%. The regional difference between C and M decreased from 0.0986 in 2005 to 0.0808 in 2021, marking an 18.04% decrease with an average annual reduction rate of 1.24%. The regional difference between P and M decreased from 0.0993 in 2005 to 0.0824 in 2021, indicating a 17.03% decrease with an average annual reduction rate of 1.16%. These findings indicate that the differences between C and P converge the fastest, while the differences between F and M converge the slowest. Despite varying policy support and development orientations among regions, all regions prioritize green development in pig breeding, resulting in a convergence of PGTFP differences for overall growth.
Figure 2 illustrates the overall contribution rate measured by intraregional contribution, interregional contribution, and the decomposition term of the Gini coefficient of hypervariable density contribution. On the magnitude of contribution change, the hypervariable density contribution exhibits the most fluctuation, decreasing from 0.0387 in 2005 to 0.0341 in 2021—an 11.83% decrease. This is followed by the interregional contribution, which decreased from 0.0215 in 2005 to 0.0190 in 2021—a decrease of 11.47%. Finally, the intraregional contribution decreased from 0.0183 in 2005 to 0.0171 in 2021, indicating a 6.44% decrease. Comparing the mean values of different contributions, intraregional, interregional, and hypervariable density contributions have mean values of 0.0112, 0.0179, and 0.0189, respectively. This suggests that regional differences in PGTFP from 2005 to 2021 primarily originate from hypervariable density, followed by interregional differences, and finally intraregional differences. It is evident that the degree of competition and mutual influence among pig breeding regions significantly impacts the convergence rate between regions. Thus, government measures are required to encourage and support innovation, technology transfer, cooperation, and coordination among different regions to promote the sustainable development of the pig breeding industry.
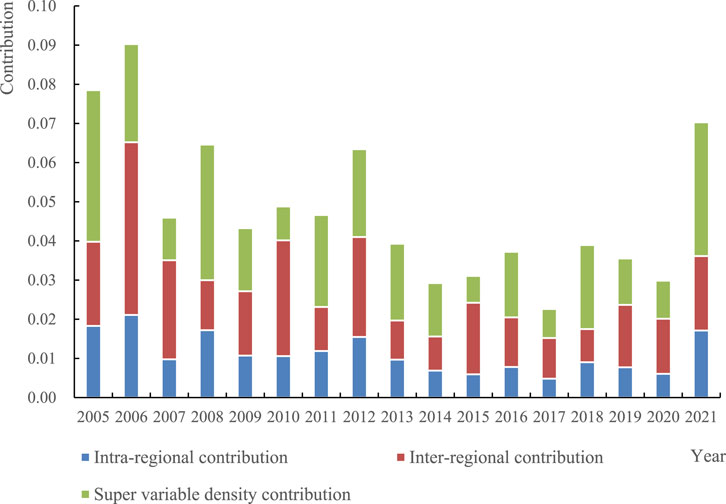
FIGURE 2. Contribution of regional differences.
The results of α-convergence for PGTFP for the entire country and each pig breeding region are shown in Figure 3. The α-value of national PGTFP from 2005 to 2021 exhibited a fluctuating decreasing trend, decreasing from 0.1451 in 2005 to 0.1327 in 2021, indicating a decrease of 8.55% and an average annual decrease rate of 0.56%. This trend suggests an obvious α-convergence of national PGTFP, reflecting a narrowing gap in PGTFP. In each pig breeding area, the coefficient of variation of PGTFP also displayed a trend of constant downward fluctuation, but there was a general increase in 2021. On the one hand, the coefficient of variation of the focused development area (F) decreased from 0.0951 in 2005 to 0.0158 in 2020, indicating an 83.36% decrease with an average annual reduction rate of 11.27%, but rising to 0.1360 in 2021. The coefficient of variation of the constrained development area (C) decreased from 0.1998 in 2005 to 0.0729 in 2020, marking a decrease of 63.52% with an average annual reduction rate of 6.50%, but rising to 0.1137 in 2021. The coefficient of variation of the potential growth area (P) decreased from 0.1497 in 2005 to 0.0760 in 2020, indicating a decrease of 49.26% with an average annual reduction rate of 4.42%, but rose to 0.1282 in 2021. Finally, the coefficient of variation of the moderate development area (M) decreased from 0.1169 in 2005 to 0.0498 in 2020, marking a decrease of 57.42% with an average annual reduction rate of 5.53% but rising to 0.2057 in 2021. These findings suggest an obvious α-convergence trend in all pig breeding areas from 2005 to 2020, with the fastest convergence rate observed in F, followed by C, and then M and P. The α-convergence results of PGTFP in 2021 for the whole country and each farming area show a rapid increase, and the gap between F and M widens most obviously. Since 2021 was the most serious period of COVID-19, the supply and demand of pig breeding produce changed greatly, leading to an increasing coefficient of variation of PGTFP. COVID-19 thus had a large impact on the pig breeding industry, which was unfavorable to the convergence of regional differences. It especially has a large impact on the F and M areas of pig breeding. On the other hand, the mean values of PGTFP for each area were 0.0879, 0.0819, 0.0982, and 0.0846, indicating that the development level of pig breeding in C had the least difference, while the development of pig breeding in P had the greatest.
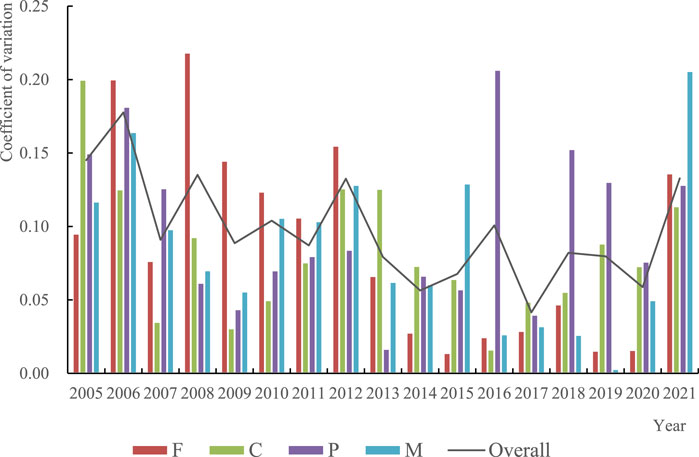
FIGURE 3. α-convergence analysis of PGTFP nationwide and in different breeding areas.
The empirical results of the absolute β-convergence of PGTFP in the country and each farming region are shown in Table 4. According to Eq. 7, which uses the panel data of 21 provinces, the OLS model was selected for measurement. The empirical analysis was performed by the Hausman test using fixed effects. The β coefficients are significant and negative for the entire country and each farming region, indicating the presence of absolute β-convergence for PGTFP in each region. The absolute value of the regression coefficient β suggests the following order: F > C > Overall > P > M. This indicates that the convergence speed varies across breeding areas due to differences in breeding scale, environmental carrying capacity, market demand, industrial agglomeration, and the degree of policy support. F exhibits the fastest convergence in PGTFP, followed by C, P, and M.
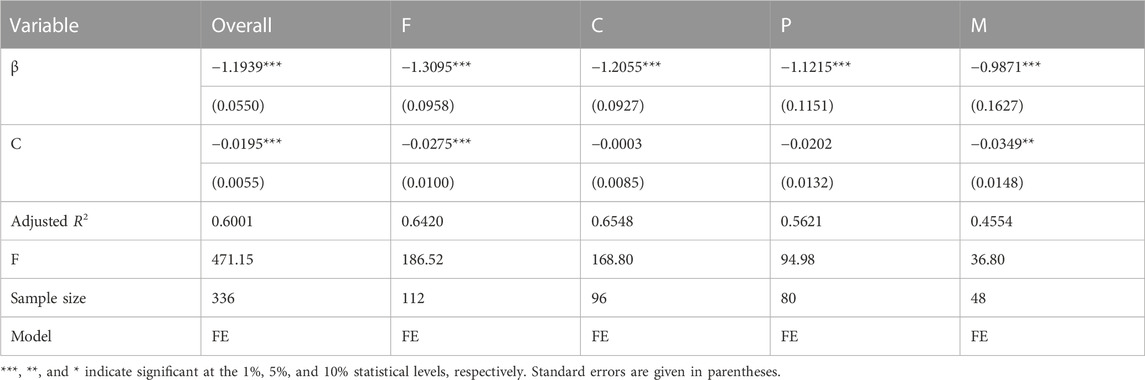
TABLE 4. Absolute β-convergence of PGTFP.
Building on existing studies (Liu et al., 2021; Li et al., 2022b; Liu H. et al., 2022; Chen et al., 2022; Huang and Xiong, 2022; Yang et al., 2022; Zhang et al., 2022; Zhu et al., 2022), this study introduces six control variables as influencing factors for the conditional β-convergence of PGTFP: the level of agricultural economic development (Agdp), capital input (Cap), pig industry agglomeration (Ind), openness to the outside world (Open), environmental regulation (Reg), and feed grain production capacity (Gra). The specific indicators are as follows: “Agdp” represents the overall economic level of development and quality of life, which influence the importance given to green development. It is measured by the actual gross output value of agriculture, forestry, animal husbandry, and fishery. “Cap” represents the strength of agricultural fixed asset inputs and the importance farmers attach to agricultural production. Fixed asset inputs are conducive to expanding the scale of operation, optimizing factor allocation, and improving technical efficiency. However, the input of agricultural machinery and other facilities may increase the use of agricultural diesel fuel, produce more environmental pollutants, and lead to a decrease in green productivity. In this study, we measured the proportion of farm households’ agricultural, forestry, animal husbandry, and fishery fixed assets to their total fixed assets. “Ind” indicates the degree of industrial agglomeration and its impact on the environment. Industrial agglomeration is measured by the ratio of raw pork production to total meat production in each province and the proportion of national raw pork production to total national meat production using locational entropy. “Open” measures the proportion of total agricultural exports to total agricultural, forestry, and fishery production. The lower the export value of agricultural products, the stronger the innovation ability of domestic agricultural products’ green technology and the higher the controllability of green production. “Reg” is measured by the ratio of investment in environmental pollution control to regional GDP and indicates the investment in environmental pollution control and its impact on agricultural green production. “Gra” measures pig feed production capacity according to the ratio of corn production in each province to national production. Higher feed production capacity in a region can improve the green production efficiency of pig breeding.
The empirical results of the conditional β-convergence of PGTFP for the nation and each farming region are shown in Table 5. According to Eq. 8, which uses the 21 provinces’ panel data, the OLS model was selected for measurement. The empirical analysis was performed by Hausman testing using fixed effects. The test results show that the β coefficients for both the national and each farming area are significant and negative at the 1% level. This indicates the presence of conditional beta convergence for PGTFP when controlling for individual variables. The convergence rate aligns with the absolute β-convergence results, with the fastest and slowest convergences observed in the focused and moderate development areas, respectively. Regarding the control variables, “Agdp” has a positive effect on PGTFP for the focused development areas. This indicates that higher levels of rural economic development can facilitate farming scale expansion and innovation in green technology to improve green efficiency. “Cap” has a significantly negative effect on PGTFP at the national level and in moderately developed areas, suggesting that higher capital input costs can be detrimental to efficiency growth; for example, some agricultural fixed assets have high input costs, and retail or small-scale farmer purchases are prone to wasting resources and are thus detrimental to productivity improvement—confirmed by more studies. The negative deterrent effect of “Open” on PGTFP in focused development areas may be due to the increased market risk faced by farmers, reducing their willingness to invest in advanced production technologies and equipment. Furthermore, increased competition from external agricultural products leads to lower prices and income levels for farmers, thereby reducing PGTFP by diminishing production inputs. As expected, “Gra” has a positive effect on PGTFP in moderately developed areas. As feed is the most important input factor for pig breeding, improving feed production capacity in each region can greatly reduce the cost of pig breeding and effectively increase PGTFP.
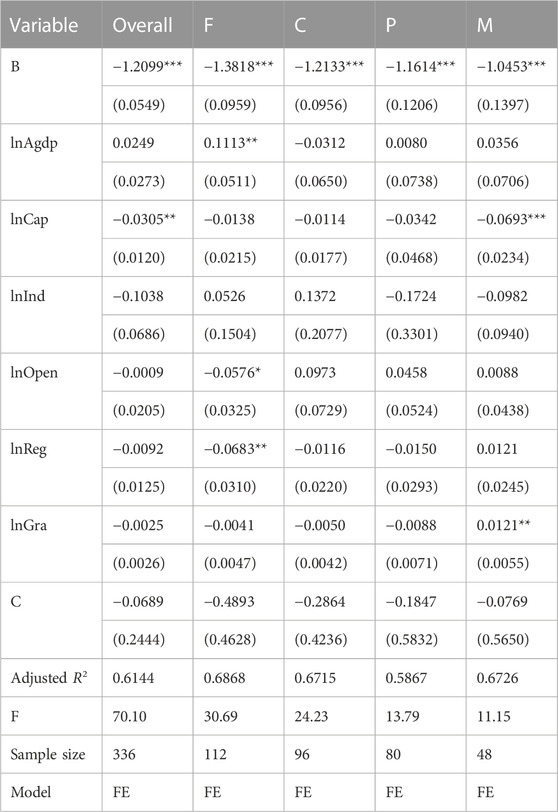
TABLE 5. Conditions β-convergence of PGTFP.
Green total factor productivity of pig breeding (PGTFP) is necessary for promoting the green development of the pig breeding industry to achieve the goal of “double carbon”—carbon reduction and emissions reduction in the farming industry. Moreover, it maintains the food and production safety of livestock products. This study is based on the results of PGTFP and discusses the regional differences and convergence of PGTFP in different pig breeding areas, thus enriching the research on PGTFP and meeting the realistic needs of high-quality development in the farming industry. The main value of this study, compared with existing studies, is as follows.
First, measuring and analyzing the evolution of PGTFP is an issue that scholars have extensively discussed. In recent years, all regions have emphasized the trio of “quantity, quality, and ecology” in agricultural production and increased their investment in farming. This has driven the development of PGTFP in each region. Consistent with existing studies, PGTFP did not increase nationwide or in all regions over time (Zhong et al., 2022b). Rather, it mostly fluctuated in phases, especially over 2005–2021, which was affected by the spread of unexpected diseases such as swine flu, African swine fever, and COVID-19. Moreover, the mean value of PGTFP in the constrained development area (C) is at its highest level due to the current situation of regional economic development. Most C areas have better economic development, and although the development space for pig production is limited, the overall breeding scale and green production capacity are the highest in the country. These research results are consistent with reality.
Second, exploring regional differences provides insight into the current evolution of unbalanced pig breeding development. It also decomposes differences by region to understand their sources, which is essential for scientifically formulating green pig development policies. By examining differences within the research sample as a whole and within each farming area, problems that exist between regions can be addressed in a timely manner. In recent years, relevant departments have introduced policies to support green agricultural development. These policies consider regional production and development bases, resource endowments, environmental carrying capacity, and consumption preferences to divide pig breeding areas, thereby promoting quality, efficiency, and sustainability in the pig breeding industry. The empirical results show that the PGTFP difference between the overall total and each farming area is decreasing. This indicates that the current green development policy for pig breeding is well implemented and that the farming areas are focused. Previous studies mainly divided the regional differences into eastern, central, and western regions and explored the differences in pig breeding in each area. Zhong et al. (2022c) found that pig breeding in the western region is more advantageous. This study’s findings explore the value of the development of the four farming regions from a policy-oriented perspective and find that the greatest differences lie within the potential growth areas (P). Moreover, the differences between the focused development areas (F) and the P are more pronounced. The regional differences mainly result from the hypervariable density contribution. This differs from existing studies that discuss regions but is consistent with the source of farming zone division. P has a favorable regional development environment, high growth potential, and sufficient advantages in feed resources. Thus, the regional development rate of areas within the region is inconsistent, showing a large internal gap. Conversely, F is the core area of stable pork supply, making it a key learning target for the potential growth area. In addition, the super-variable density is the main source of major regional differences. It also indicates that the degree of coordination between regions needs improvement, indicating the direction for green pig development, with a focus on regional development.
Furthermore, research commonly analyzes the convergence of regional differences over time when discussing regional differences. In this study, we examine the convergence pattern of PGTFP in four pig breeding regions in China using α- and β-convergences. The empirical results align with existing studies (Cui et al., 2020) and demonstrate α-convergence and β-convergence in overall and regional PGTFP. The PGTFP of each province within the region converges to a steady-state equilibrium value over time, regardless of the consideration of the regional factor structure. This finding indicates a “catch-up effect” of PGTFP in lagging regions toward developed regions and reflects the trend of moderate development areas, P areas, and constrained development areas moving closer to F areas, which aligns with national policies. The convergence of PGTFP is influenced by factors such as factor endowment, regional agricultural economic development, factor inputs, industrial structure, and openness to the outside world, which should be explored further to enhance PGTFP.
Based on panel data from 2004 to 2021, this study has examined the PGTFP growth index, regional differences, and convergence trends in 21 provinces (regions) of pig breeding. The analysis utilized the super-efficient SBM model, Dagum Gini coefficient, and convergence model. The empirical results lead to the following conclusions: 1) from 2005 to 2021, the nationwide PGTFP exhibited a pattern of fluctuating decline–stable rise–continuous decline. The PGTFP growth index shows fluctuations in all farming areas, with the constrained development area (C) experiencing the highest growth, followed by the potential growth area (P) and the focused development area (F), with the moderate development area (M) exhibiting the lowest PGTFP. 2) In terms of regional differences, the differences in PGTFP across the country have generally been decreasing. In terms of intraregional differences, the differences within each pig breeding area show a decreasing trend, with the largest PGTFP differences within P, followed by F and C, and the smallest but slowest convergence of differences in M. Furthermore, in terms of interregional differences, the differences between F and P are the largest and converge the slowest. Conversely, the differences between C and M are the smallest. In terms of the contribution of regional differences, the regional differences of PGTFP in 2005–2021 mainly originate from hypervariable density, followed by interregional differences and intraregional differences. 3) In terms of convergence characteristics, α-convergence and β-convergence of PGTFP are observed in the whole country and each farming area. Specifically, there is α-convergence in the coefficient of variation of PGTFP nationwide and in each farming area. However, the convergence state is not obvious during COVID-19. Absolute and conditional β-convergences exist in the whole country and each farming area, among which PGTFP converges fastest in F. This is followed by C and P. β-convergence is slowest in M, and the convergence rate is inconsistent among regions; however, PGTFP converges to its own steady state in all regions.
Based on the research findings, this study proposes the following recommendations: 1) Develop differentiated breeding strategies based on local conditions, capitalizing on large-scale breeding in each region, and determining appropriate breeding scales. Formulate a green development plan for the pig breeding industry according to the economic development level and demands of different-scale farmers in each production area. Implement regulations and supporting measures tailored to different regions and scales. For example, F areas should strengthen pig breeding organization and management, create regionally distinctive pig brands, and enhance market competitiveness. C areas should promote standardized breeding based on existing resource endowments and environmental carrying capacity, improving scientific breeding technology to relieve environmental pressure and achieve efficient pig breeding. P areas should focus on increasing the technical content of green breeding, supporting demonstration households to play a leading role, and continuously introducing capital, technology, and talent into the pig breeding industry. M areas should explore the path of ecological pig breeding, striving to narrow the regional gap, and development areas should explore the path of ecological pig breeding, narrowing regional gaps, and promoting the competition of pig industrialization, capitalizing on the comparative advantages of each region, optimizing resource allocation, and stimulating development potential. 2) Actively advocate the concept of cooperation and guide the interactive and coordinated development of pig breeding areas. Strengthen the economic linkage between different farming areas, deepening regional exchanges and cooperation, and sharing advanced green production management experiences. Pay particular attention to the coordinated and interactive relationship between focused development areas and potential growth areas. Simultaneously accelerate the establishment of a sound standard system for green development in the pig breeding industry and improve standardization levels, organizational aspects, and ecological construction. Enhance standards related to inputs and outputs in the breeding industry, reasonably allocating resources, and promoting green and standardized pig production. 3) Accelerate the enhancement of PGTFP and strengthen the layout of emergency prevention. Combine PGTFP drivers and adjust relevant green pig development policies. This adjustment should include increasing capital investment in the pig industry, promoting the pace of pig industry agglomeration, optimizing the industrial structure of farming, enhancing the comprehensive production capacity of pig breeding, and promoting sustainable development. At the same time, prepare for contingency prevention measures and outline measures in production and distribution in advance to deal with the impact of major contingencies.
This study also has certain limitations that need to be addressed. The limited access to macro-data and data matching factors at different scales in each province restricts the inclusion of data from all provinces in China. Field research and interviews with pig-breeding farmers across the country are necessary to validate the research findings. The outbreak of COVID-19 in 2020–2022 significantly affected the pork market. Due to current data access limitations, this study covers the period from 2004 to 2021 and does not fully reflect the fluctuating changes in green pig breeding development after the COVID-19 outbreak cycle. Future research should explore and compare the impact of COVID-19 on PGTFP growth in depth.
The original contributions presented in the study are included in the article/Supplementary Material; further inquiries can be directed to the corresponding author.
Conceptualization, LW; methodology, QC; data curation, LW; writing—original draft preparation, LW and QC; writing—review and editing, LW and RK; visualization, LW; supervision, RK; funding acquisition, RK. All authors contributed to the article and approved the submitted version.
This research was funded by the National Natural Science Foundation of China (grant numbers 72273107 and 71773094) and the Northwest Agriculture and Forestry University Major Incubation Program (grant number 2452021168).
The authors declare that the research was conducted in the absence of any commercial or financial relationships that could be construed as a potential conflict of interest.
All claims expressed in this article are solely those of the authors and do not necessarily represent those of their affiliated organizations, or those of the publisher, the editors, and the reviewers. Any product that may be evaluated in this article, or claim that may be made by its manufacturer, is not guaranteed or endorsed by the publisher.
Barro, R., and sala-i-martin, X. (1992). Convergence. J. Political Econ. 100, 223–251. doi:10.1086/261816
Chen, Y., Fu, W., and Wang, J. (2022). Evaluation and influencing factors of China’s agricultural productivity from the perspective of environmental constraints. Sustainability 14, 2807. doi:10.3390/su14052807
Chung, Y. H., Färe, R., and Grosskopf, S. (1997). Productivity and undesirable outputs: A directional distance function approach. J. Environ. Manag. 51, 229–240. doi:10.1006/jema.1997.0146
Cui, Y., Liu, W., Sufyan, U. K., Yu, C., Jun, Z., Yue, D., et al. (2020). Regional differential decomposition and convergence of rural green development efficiency: Evidence from China. Environ. Sci. Pollut. Res. 27, 22364–22379. doi:10.1007/s11356-020-08805-1
Dagum, C. (1997). A new approach to the decomposition of the Gini income inequality ratio. Empir. Econ. 22, 515–531. doi:10.1007/BF01205777
Daxini, A., O’Donoghue, C., Ryan, M., Buckley, C., Barnes, A. P., and Daly, K. (2018). Which factors influence farmers’ intentions to adopt nutrient management planning? J. Environ. Manag. 224, 350–360. doi:10.1016/j.jenvman.2018.07.059
Du, H., Wang, M., and Hu, M. (2019). Spatial-time disparities of green total factor productivity of hog breeding of different scale:Based on non-radial and non-angular SBM productivity rate model. J. Hunan Agric. Univ. Soc. Sci. 20, 16–23. doi:10.13331/j.cnki.jhau(ss).2019.02.003
Fang, L., Hu, R., Mao, H., and Chen, S. (2021). How crop insurance influences agricultural green total factor productivity: Evidence from Chinese farmers. J. Clean. Prod. 321, 128977. doi:10.1016/j.jclepro.2021.128977
Galanopoulos, K., Aggelopoulos, S., Kamenidou, I., and Mattas, K. (2006). Assessing the effects of managerial and production practices on the efficiency of commercial pig farming. Agric. Syst. 88, 125–141. doi:10.1016/j.agsy.2005.03.002
Han, Z., Han, C., and Yang, C. (2020). Spatial econometric analysis of environmental total factor productivity of ranimal husbandry and its influencing factors in China during 2001–2017. Sci. Total Environ. 723, 137726. doi:10.1016/j.scitotenv.2020.137726
He, Z., Jia, Y., and Ji, Y. (2023). Analysis of influencing factors and mechanism of farmers’ green production behaviors in China. Int. J. Environ. Res. Public Health 20, 961. doi:10.3390/ijerph20020961
Hu, J. (2023). Green productivity growth and convergence in Chinese agriculture. J. Environ. Plan. Manag. 8, 1–30. doi:10.1080/09640568.2023.2180350
Huang, Q., and Zhang, Y. (2022). Decoupling and decomposition analysis of agricultural carbon emissions: Evidence from Heilongjiang province, China. Int. J. Environ. Res. Public Health 19, 198. doi:10.3390/ijerph19010198
Huang, T., and Xiong, B. (2022). Space comparison of agricultural green growth in agricultural modernization: Scale and quality. Agriculture 12, 1067. doi:10.3390/agriculture12071067
Huang, X., Xu, X., Wang, Q., Zhang, L., Gao, X., and Chen, L. (2019). Assessment of agricultural carbon emissions and their spatiotemporal changes in China, 1997–2016. Int. J. Environ. Res. Public Health 16, 3105. doi:10.3390/ijerph16173105
Jia, Y., Zhang, Z., He, Z., Zhu, P., and Sun, T. (2021). Production efficiency prediction of pig breeding industry by optimized LSTM computer algorithm under environmental regulation. Sci. Program. 2021, 1–12. doi:10.1155/2021/3074167
Jiang, J., Lai, J., and Ni, T. (2022a). Effects of industrial agglomeration on production efficiency of pig breeding: Take major hog producing provinces (autonomous regions and municipalities) as an example. J. Yunnan Agric. Univ. Soc. Sci. 16, 78–86. doi:10.12371/j.ynau(s).202110053
Jiang, Q., Li, J., Si, H., and Su, Y. (2022b). The impact of the digital economy on agricultural green development: Evidence from China. Agriculture 12, 1107. doi:10.3390/agriculture12081107
Kung, C-C., Kong, F., and Choi, Y. (2015). Pyrolysis and biochar potential using crop residues and agricultural wastes in China. Ecol. Indic. 51, 139–145. doi:10.1016/j.ecolind.2014.06.043
Li, H., Tang, M., Cao, A., and Guo, L. (2022a). Assessing the relationship between air pollution, agricultural insurance, and agricultural green total factor productivity: Evidence from China. Environ. Sci. Pollut. Res. 29, 78381–78395. doi:10.1007/s11356-022-21287-7
Li, H., Zhou, X., Tang, M., and Guo, L. (2022b). Impact of population aging and renewable energy consumption on agricultural green total factor productivity in rural China: Evidence from panel VAR approach. Agriculture 12, 715. doi:10.3390/agriculture12050715
Liu, C., Cui, L., and Li, C. (2022a). Impact of environmental regulation on the green total factor productivity of dairy farming: Evidence from China. Sustainability 14, 7274. doi:10.3390/su14127274
Liu, D., Zhu, X., and Wang, Y. (2021). China’s agricultural green total factor productivity based on carbon emission: An analysis of evolution trend and influencing factors. J. Clean. Prod. 278, 123692. doi:10.1016/j.jclepro.2020.123692
Liu, H., Wen, S., and Wang, Z. (2022b). Agricultural production agglomeration and total factor carbon productivity: Based on NDDF–MML index analysis. China Agric. Econ. Rev. 14, 709–740. doi:10.1108/CAER-02-2022-0035
Ma, G., Lv, D., Luo, Y., and Jiang, T. (2022). Environmental regulation, urban-rural income gap and agricultural green total factor productivity. Sustainability 14, 8995. doi:10.3390/su14158995
Miguel, N. D., Hoekstra, A. Y., and García-Calvo, E. (2015). Sustainability of the water footprint of the Spanish pork industry. Ecol. Indic. 57, 465–474. doi:10.1016/j.ecolind.2015.05.023
Njuki, E., Bravo-Ureta, B., and Mukherjee, D. (2016). The good and the bad: Environmental efficiency in northeastern U.S. Dairy farming. Agric. Resour. Econ. Rev. 45, 22–43. doi:10.1017/age.2016.1
Obubuafo, J., Gillespie, J., Paudel, K., and Kim, S-A. (2008). Awareness of and application to the environmental quality incentives Program by cow–calf producers. J. Agric. Appl. Econ. 40, 357–368. doi:10.1017/s1074070800023658
Onyenweaku, C., and Effiong, E. (2006). Technical efficiency in pig production in akwa ibom state, Nigeria. Int. J. Agric. Rural Dev. 6, 51–57. doi:10.4314/ijard.v6i1.2588
Qi, Y., Han, S., and Deng, X. (2020). China's green agriculture development: Production level measurement, regional spatial difference and convergence analysis. J. Agrotechnical Econ. 4, 51–65. doi:10.13246/j.cnki.jae.2020.04.004
Shen, Z., Shao, A., Chen, J., and Cai, J. (2022). The club convergence of green productivity across African countries. Environ. Sci. Pollut. Res. 29, 4722–4735. doi:10.1007/s11356-021-15790-6
Tone, K. (2001). A slacks-based measure of efficiency in data envelopment analysis. Eur. J. Operational Res. 130, 498–509. doi:10.1016/S0377-2217(99)00407-5
Tone, K. (2004). Dealing with undesirable outputs in DEA: A slacks-based measure (SBM) approach. Nippon. Opereshonzu, Risachi Gakkai Shunki Kenkyu Happyokai Abus. 1, 44–45.
Wang, H., Zhang, X., Ma, Y., and Hou, Y. (2020). Mitigation potential for carbon and nitrogen emissions in pig production systems: Lessons from the north China plain. Sci. Total Environ. 725, 138482. doi:10.1016/j.scitotenv.2020.138482
Wang, S., Tian, X., Chen, J., Tang, H., Zhang, L., and Tang, G. (2022). Changes in bone marrow fatty acids early after ovariectomy-induced osteoporosis in rats and potential functions. Statistics Decis. 38, 36–41. doi:10.3390/metabo13010036
Woyengo, T. A., Beltranena, E., and Zijlstra, R. T. (2014). Nonruminant nutrition symposium: Controlling feed cost by including alternative ingredients into pig diets: A review1,2. J. Animal Sci. 92, 1293–1305. doi:10.2527/jas.2013-7169
Yang, C-C. (2009). Productive efficiency, environmental efficiency and their determinants in farrow-to-finish pig farming in Taiwan. Livest. Sci. 126, 195–205. doi:10.1016/j.livsci.2009.06.020
Yang, H., Lin, Y., Hu, Y., Liu, X., and Wu, Q. (2022). Influence mechanism of industrial agglomeration and technological innovation on land granting on green total factor productivity. Sustainability 14, 3331. doi:10.3390/su14063331
Yu, L., Zhao, D., Xue, Z., and Gao, Y. (2020). Research on the use of digital finance and the adoption of green control techniques by family farms in China. Technol. Soc. 62, 101323. doi:10.1016/j.techsoc.2020.101323
Zhang, Y., Wei, J., Wang, Y., and Tsai, S-B. (2022). An empirical study on the growth of agricultural green total factor productivity in the huanghuai river economic zone by big data computing. Math. Problems Eng. 2022, 1–11. doi:10.1155/2022/1775027
Zhao, L., Lin, J., and Zhu, J. (2015). Green total factor productivity of hog breeding in China: Application of SE-SBM model and grey relation matrix. Pol. J. Environ. Stud. 24, 403–412. doi:10.3724/SP.J.1105.2010.09178
Zhong, S., Li, J., Chen, X., and Wen, H. (2022a). A multi-hierarchy meta-frontier approach for measuring green total factor productivity: An application of pig breeding in China. Socio-Econ Plan. Sci. 81, 101152. doi:10.1016/j.seps.2021.101152
Zhong, S., Li, J., and Guo, X. (2022b). Analysis on the green total factor productivity of pig breeding in China: Evidence from a meta-frontier approach. PLOS One 17, e0270549. doi:10.1371/journal.pone.0270549
Zhong, S., Li, J., and Zhang, D. (2022c). Measurement of green total factor productivity on Chinese pig breeding: From the perspective of regional differences. Environ. Sci. Pollut. Res. 29, 27479–27495. doi:10.1007/s11356-021-17908-2
Zhu, Y., Zhang, Y., and Piao, H. (2022). Does agricultural mechanization improve the green total factor productivity of China’s planting industry? Energies 15, 940. doi:10.3390/en15030940
Zhuang, M., Lu, X., Caro, D., Gao, J., Zhang, J., Cullen, B., et al. (2019). Emissions of non-CO2 greenhouse gases from livestock in China during 2000–2015: Magnitude, trends and spatiotemporal patterns. J. Environ. Manag. 242, 40–45. doi:10.1016/j.jenvman.2019.04.079
Keywords: pig breeding, green total factor productivity, measurement, regional differences, convergence
Citation: Wang L, Chang Q and Kong R (2023) Regional differences and convergence of green total factor productivity in pig breeding: evidence from China. Front. Environ. Sci. 11:1162502. doi: 10.3389/fenvs.2023.1162502
Received: 09 February 2023; Accepted: 01 August 2023;
Published: 21 August 2023.
Edited by:
José M. Martínez-Paz, University of Murcia, SpainReviewed by:
Mohamed R. Abonazel, Cairo University, EgyptCopyright © 2023 Wang, Chang and Kong. This is an open-access article distributed under the terms of the Creative Commons Attribution License (CC BY). The use, distribution or reproduction in other forums is permitted, provided the original author(s) and the copyright owner(s) are credited and that the original publication in this journal is cited, in accordance with accepted academic practice. No use, distribution or reproduction is permitted which does not comply with these terms.
*Correspondence: Rong Kong, a3IxOTk2QDE2My5jb20=
Disclaimer: All claims expressed in this article are solely those of the authors and do not necessarily represent those of their affiliated organizations, or those of the publisher, the editors and the reviewers. Any product that may be evaluated in this article or claim that may be made by its manufacturer is not guaranteed or endorsed by the publisher.
Research integrity at Frontiers
Learn more about the work of our research integrity team to safeguard the quality of each article we publish.