- 1Key Laboratory of Meteorological Disaster, Ministry of Education (KLME), Collaborative Innovation Center on Forecast and Evaluation of Meteorological Disasters (CIC-FEMD), Joint International Research Laboratory of Climate and Environment Change (ILCEC), Joint Center for Data Assimilation Research and Applications, Nanjing University of Information Science and Technology, Nanjing, China
- 2Shandong Meteorological Bureau, Weihai, Shandong, China
- 3Anhui Public Meteorological Service Center, Hefei, Anhui, China
This study aims to investigate the impacts of the spring sensible heat (SH) over the Tibetan Plateau (TP) and the El Niño–Southern Oscillation (ENSO) in the preceding wintertime on midsummer (July–August) precipitation over South China under the different Pacific decadal oscillation (PDO) phases. More specifically, eight classifications are adopted at the demarcation point around 1996 when the spring SH over the TP and the midsummer precipitation in South China occurred as well as the PDO phase transition, including positive and negative SHs and ENSOs under a positive PDO phase (1979–1996) and a negative PDO phase (1997–2019), respectively, based on the Niño-3 index and the spring SH calculated from 48 stations over the central and eastern parts of the TP. The results show that both the spring SH and the ENSO in preceding wintertime have a significant impact on the midsummer precipitation over South China; that is, when the two factors are in their respective positive (negative) phase, the midsummer precipitation in South China is generally less (more). Importantly, the phase change of background field PDO can significantly enhance the effect of the SH and the ENSO on summer precipitation over South China. Moreover, compared with the preceding wintertime ENSO, the spring SH over the TP contributes more to the midsummer precipitation in South China based on analyses of their independent and synergistic effects. The main mechanism responsible for the anomalous midsummer precipitation over South China are the combined effects of the South Asian high (SAH) and the western Pacific subtropical high (WPSH), which are controlled by the spring SH anomaly over the TP and the ENSO, respectively. Deep understanding of the dominant factors of the midsummer precipitation over South China will help understand the local climate change and reduce the losses caused by drought and flood disasters.
1 Introduction
South China, characterized by a long rainy season and many heavy precipitation events, is the region with the highest average annual precipitation in China. Precipitation in South China is characterized by typical bimodal variation, namely, pre-flood (April–June) and post-flood (July–September) seasons, and the latter is related to monsoon precipitation and tropical cyclone precipitation and reaches a peak in August (Guo and Sha, 1998; Luo, 1999; Chi et al., 2005; Zheng et al., 2006; Luo and Zhang, 2015). Frequent droughts and floods have caused serious impacts on sustainable socio-economic development. Therefore, it is of great importance to understand the variations and cause of summer precipitation variation in South China.
Previous studies have shown that summer precipitation in South China has undergone a clear “increase–decrease–increase” interdecadal variation with two interdecadal turning points occurring in the mid-1970s and early 1990s, respectively. The precipitation anomalies were mainly located in northern China before the 1970s, and then the rain belt moved southward and finally to southern China in the 1990s, so that the precipitation increased significantly, and the interannual variability increased after the 1990s (Ding et al., 2010; Wu et al., 2010; Wang and Fan, 2013; Zhong et al., 2016; Chen et al., 2017). The Tibetan Plateau (TP), as the “Third Pole” of the Earth, has an important impact on the precipitation variation throughout the East Asian monsoon region (Zhao and Chen, 2001a; Zhou et al., 2009; Qiao et al., 2014). The TP acts as an uplifting heat source in the spring and summer, especially in the spring sensible heat (SH), which has a significant influence on precipitation in late summer over the East Asian region (Flohn, 1957; Yeh et al., 1957; Liu et al., 2012). The spring SH over the TP has a certain indicative significance acting as an important precursory signal for summer precipitation in South China, and there is a significant negative correlation between the spring SH source and summer precipitation in South China (Zhao and Chen, 2001a; Qian et al., 2004; Ao and Li, 2015).
The PDO and the ENSO, as the strong interannual and interdecadal signals, respectively, have profound impacts on climate change in China (Wang et al., 2008; Song and Zhou, 2015; Dong, 2016). Several studies have shown that the atmospheric circulation anomalies caused by the sea surface temperature (SST) and the western Pacific subtropical high pressure (WPSH) is directly responsible for the summer precipitation anomalies in southern China (Yang and Sun, 2005; Wang et al., 2009; Li et al., 2011). In addition, the PDO phase transition is also the main factor leading to the weakening of the East Asian summer monsoon and its relationship with the ENSO (Wang et al., 2008; Feng et al., 2014; Song and Zhou, 2015; Dong, 2016).
At present, few studies examine the synergism of the spring SH over the TP and the ENSO on summer precipitation associated with the prevailing summer monsoon, accompanied by frequent tropical cyclones in the post-rainy season in South China. Therefore, in this study, we focus on the midsummer (July–August) precipitation in South China. It is worthwhile understanding which one plays the dominant role and how the synergistic effects of both systems affect midsummer precipitation in southern China. We discuss the difference between midsummer precipitation and atmospheric circulation in South China corresponding to the multiple configurations of the spring SH over the TP and the ENSO under the modulation of the PDO. The effects of the SAH and the WPSH, which are mainly controlled by the SH and the ENSO, on midsummer precipitation in South China, are further explored in an attempt to reveal the mechanism of the impact of the spring SH over the TP and the ENSO on precipitation in South China.
2 Data and methods
2.1 Observation and reanalysis datasets
The observed precipitation data employed in this study were derived from over 2,944 stations of the National Meteorological Information Center operated by the China Meteorological Administration (CMA). Among the 2,944 stations, data from 347 stations during the period 1979–2019 were extracted for South China. The linear trends of precipitation were removed before performing the composite analysis for better interannual change signals.
The SH dataset of 48 stations that also originated from the CMA with 41 years of continuous observations from January 1979 to December 2019 over the TP used here was provided by Duan et al. (2018); Duan et al. (2022). Less than 7.3% of the entries are missing values. These data have been publicly released and can be freely downloaded (http://data.lasg.ac.cn/TPSHLH/TP_station_SHLH/).
The gridded datasets used in this study were derived from the European Centre for Medium-Range Weather Forecast (ECMWF) Interim Re-Analysis dataset (ERA-Interim; https://apps.ecmwf.int/datasets/). The same time periods mentioned previously were used, with a spatial resolution of 1.0°
The Niño-3 index is calculated as the SST anomaly (SSTA) in the domain of 150°–90°W, 5°S–5°N. We selected the ±0.5 standard deviation as the criterion for the El Niño and La Niña events. The Niño-3 index was derived from https://www.cpc.necp.noaa.gov/data/indexes/sstoi.indexes.
2.2 Estimation of surface sensible heat flux
According to the similarity theory (Monin and Obukhov, 1954), the positive algorithm method is used to estimate sensible heat flux (SH) with the bulk transfer equation as follows (Li et al., 2000; Duan et al., 2018):
where u, Tg, and Ta denote the wind speed at 10 m, ground temperature, and the near-surface air temperature at 2 m, respectively.
2.3 The method for assessing the relative contribution of impacting factors
Referring to previous studies (Lu et al., 2010; 2015; Tu and Lu, 2020; Hao and Lu, 2021), if the variable Z is affected by multiple factors such as X and Y at the same time, and the relationship between Z and the influencing factors X, Y, etc., is non-linear; it can be written in the general form of Z = Z(X, Y). To explore the relative importance of influencing factors, and to assess whether variable Z is more influenced by variable X or Y, multiple linear regression Z = AX + BY + ε can be used to fit their relationship, in which A = ∂Z/∂X and B = ∂Z/∂Y expressed the mean the change rates of Z with X and Y, respectively. Therefore, considering the interannual change rates and the perturbation scales of X and Y, two equations can be obtained to estimate the contributions of X and Y to the variable Z:
where σX (σY) in the equation represents the standard deviation of the interannual perturbation of X and Y. With the coefficients fitted and the normalizations performed (σX = σY = 1), the final equations of contribution can be expressed in the form of
and
Thus, the dominant relative effect of variables X and Y on variable Z can be assessed by comparing the magnitude of the absolute values of A and B.
2.4 Definitions for the South Asian high (SAH) and the WPSH index
The index of the SAH is defined as the longitude of the eastern ridge point corresponding to the 1,254 dagpm isoline on the 200 hPa geopotential height of the strongest warm high system that appears in the upper troposphere of the TP and its adjacent areas (Ren et al., 2015; Zeng et al., 2016; Guan et al., 2018). Similarly, the WPSH index in midsummer (July and August) is defined as the western ridge point of the 588 dagpm isoline on the 500 hPa geopotential height field over the Northwest Pacific (Huang and Wang, 1985; Yang et al., 2017; Guan et al., 2018).
A relative zonal position index of the SAH and the WPSH was constructed to determine the relative zonal position between the SAH and the WPSH. This index suggests that the greater (smaller) the absolute difference value is, the farther (closer) the relative zonal position of the two high pressures is.
The ridge point index of the WPSH defined in this study is verified by the 74 Atmospheric Circulation Index sorted by the National Climate Center of China (NCC), as shown in Figure 1. It can be seen that the correlation coefficients between the western ridge point index of the WPSH calculated here for July and August from 1979 to 2019 and the index provided by the NCC have
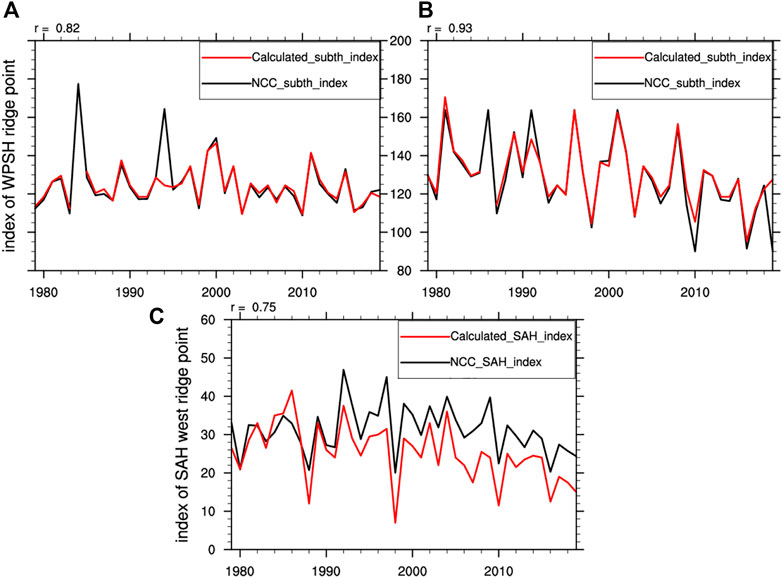
FIGURE 1. Western ridge index of the 588 dagpm isoline of the west Pacific subtropical high calculated (solid red line) and that provided by the NCC (solid black line) in (A) July and (B) August, and (C) calculated western ridge point index of the SAH from 1979 to 2019. Solid red and black lines represent the calculated index of the SAH and that provided by the NCC, respectively.
3 Results
3.1 Interannual change and trends of spring SH over the TP
The spatial distribution of the 48 observation stations and the climatological variations of the SH over the TP are shown in Figure 2. The TP presents a strong heat source from March to September, in which the SH is much stronger in the spring, especially when it reaches its annual peak in May (Zhao and Chen, 2001b; Liu et al., 2012; Xu and Chen, 2018). In addition, comparing the monthly variation of the standard deviation of the SH, it can be seen that the standard deviation of the SH is relatively larger in May (Qian et al., 2004). Therefore, in some studies, the SH in May was used to characterize the intensity of the spring heat source over the TP (Zhao and Chen, 2001b; Duan et al., 2017; Zhan et al., 2020; Duan et al., 2022).
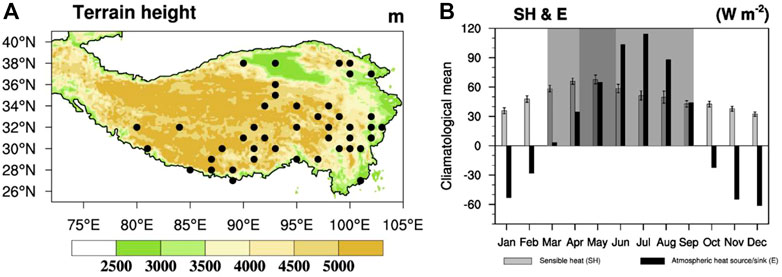
FIGURE 2. (A) Spatial distribution of routine surface China Meteorological Administration (CMA) stations over the TP. Shading indicates the altitude, unit: m; solid dots denote 48 stations covering 1979–2019. (B) Annual cycle of the SH and the atmospheric heat source/sink (unit: W·m−2) from 1979 to 2019 over the TP. The gray bars represent the variation of mean SH, and the black bars represent the change of the mean atmospheric heat source/sink (E) over the TP. The light gray and the dark gray shadows represent months of positive E and maximum SH, respectively.
Figure 3 shows the leading mode of the spatial and temporal distribution of EOF of the SH at 48 stations on the TP in May with its variance contribution of 23.2%. The spatial distribution (Figure 3A) shows that except for a few stations in the northeast TP, most of the TP stations are positive, denoting the SH on the TP mainly showed consistent spatial distribution characteristics throughout the whole region. The change curve of time coefficient series (Figure 3B) indicates the SH on the TP mainly shows a significant reduction trend (Qian et al., 2004; Duan and Wu, 2008; Wang et al., 2012; Duan et al., 2017) in the spring over the past 41 years, with a remarkable interannual variability. Recent studies (Zhu et al., 2017; Wang et al., 2019; Fan et al., 2021) also pointed out that recovery occurs every 2 decades. However, for simplicity, we removed a linear trend from the time series to obtain interannual signals for the following research.
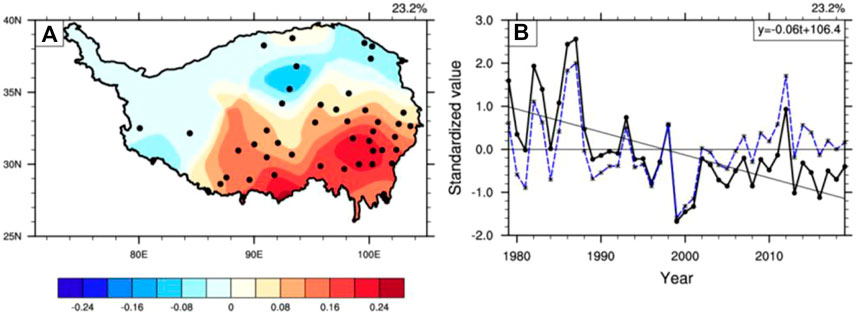
FIGURE 3. (A) First leading EOF mode of the SH on the TP in May and (B) time series from 1979 to 2019. Solid dots represent the distribution of 48 stations on the TP; the dotted blue line indicates the detrend variation. The sloping black line denotes the linear trend of the corresponding time series, indicating that the spring SH over the TP decreased at a rate of 0.6 (W·m−2)/10a.
3.2 Linear relationship of the spring SH over the TP and the ENSO with the midsummer precipitation in South China
To investigate the relationship of precipitation in midsummer in South China with the spring SH over the TP and the SSTA in Niño-3 in the preceding winter, the correlation coefficient patterns between the precipitation in midsummer in South China and the spring SH over the TP and the Niño-3 index in the preceding winter (December) are presented in Figure 4. In particular, the preceding winter (December) is chosen mainly because of the lagging influence of the ENSO on climate (Wang et al., 2001; Chen et al., 2018). From Figure 4A, it can be seen that a significant negative correlation exists between the spring SH over the TP and the midsummer precipitation in South China, while a remarkable positive correlation exists in the middle and lower reaches of the Yangtze River Basin, which shows a spatial dipole mode in eastern China. Clearly, the SSTA in the Niño-3 region has a similar relationship with the precipitation in eastern China (Figure 4B). As shown in the figures, the anomalous midsummer precipitation in South China (denoted by the rectangular box) is affected by both the spring SH over the TP and the variation of SST in Niño-3 areas, indicating that during in the years of the positive (negative) phase of the spring SH and the ENSO, the midsummer precipitation in South China will be obviously less (more), which is basically consistent with the results of Huang and Wu (1989) and Zong et al. (2010). Both the spring SH over the TP and the SSTA in Niño-3 have significant regulatory effects on midsummer precipitation in South China. Therefore, the research area of this study focuses on South China (110–120 °E, 20–28 °N), which is basically consistent with the scope of South China determined by previous studies (Wang and Fan, 2013; Yang et al., 2014; Wu and Mao, 2016).
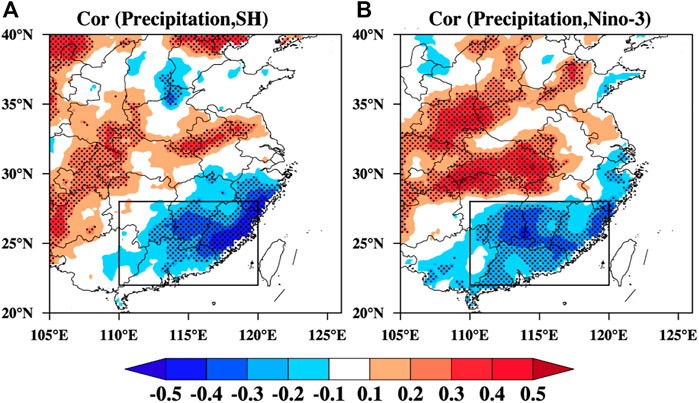
FIGURE 4. Distribution of correlation coefficients between midsummer precipitation in South China and (A) the spring SH over the TP and (B) the Niño-3 index in the preceding winter from 1979 to 2019, respectively. Cor (Precipitation, SH) and Cor (Precipitation, Niño-3) indicate the correlation coefficients between the spring SH over the TP, the SSTA in the preceding winter in the Niño-3 region and the midsummer precipitation, respectively. Rectangular boxes in the figures indicate the area of South China; the dotted areas pass the 90% significance level test.
To further demonstrate the key areas of the SH over the TP and the SSTA of the Pacific that are closely related to midsummer precipitation in South China, Figure 5 depicts the regression coefficient distributions of the standardized midsummer precipitation in South China regressed to the spring SH over the TP and the SSTA in the Pacific in the preceding winter. The spatial distribution pattern of the regression coefficient of midsummer precipitation in South China with the spring SH (Figure 5A) is identical to the spatial distribution of the first EOF model of the spring SH over the TP (Figure 2A), which indicates when the spring SH is relatively stronger (weaker) over the TP, the amount of midsummer precipitation in South China is relatively less (more), which is consistent with Figure 4A. Figure 5B shows a close relationship between midsummer precipitation in South China and the Pacific SSTA. The most significant correlation areas are in Niño-3 regions, implying that when the index in the preceding winter is on the high (low) side, the midsummer precipitation in South China is relatively less (more), which is in accordance with Figure 4B. In addition, the overall correlation coefficients are −0.42 and −0.34 (passing the 90% significance level test), respectively (in Figure 6).
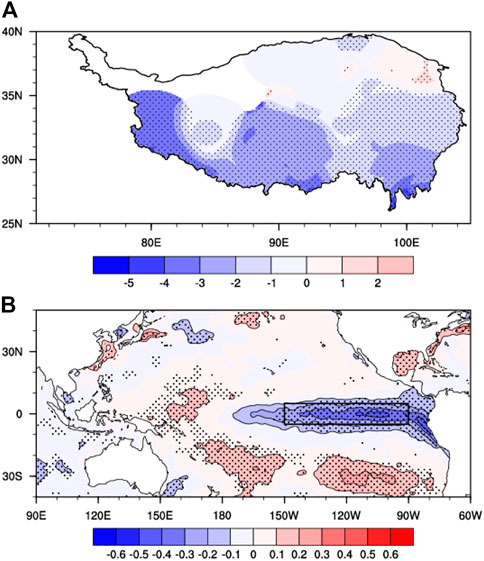
FIGURE 5. Regressed (A) the spring SH field over TP (units: W·m−2) and (B) the SSTA in preceding winter (December) (units: °C) on midsummer precipitation in South China. The dotted areas passing the 90% significance level test; the box indicates the scope of the Niño-3 region in Figure 5B.

FIGURE 6. Standardized series of midsummer precipitation in South China (solid black line; the axis representing precipitation is inverted) with the (A) spring SH (dotted black line) and the (B) preceding winter Niño-3 index (dotted black line).
The correlation and regression analysis results show that the spring SH over the TP and the SSTA in Niño-3 regions in the preceding winter are significantly related to the midsummer precipitation in South China. It can be seen from Figure 6 that when the spring SH and the SSTA in Niño-3 areas in the preceding winter are in a negative (positive) phase, the midsummer precipitation in South China is generally more (less).
3.3 Impact of the spring SH over the TP and the ENSO and the effect of PDO modulation
In order to explore whether the spring SH over the TP or the ENSO has a greater influence on the midsummer precipitation in South China, the contributions of the spring SH over the TP and the ENSO are calculated with the method mentioned previously in Section 2. Figure 7 shows the distribution of SSH, SNiño-3, and their differences.
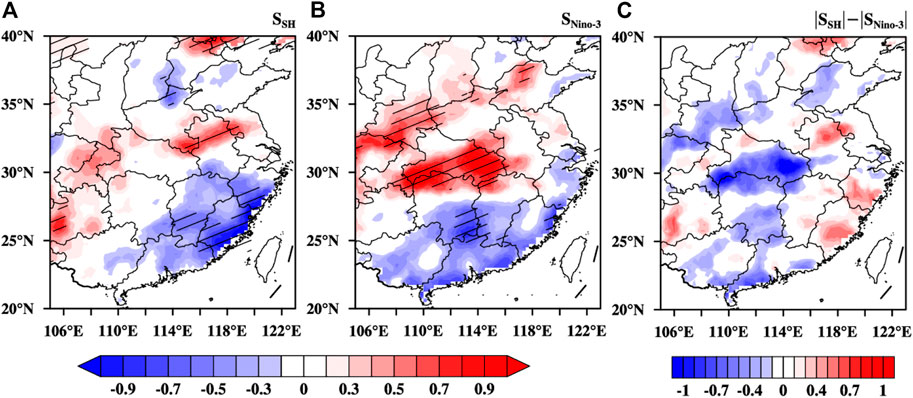
FIGURE 7. Contributions of (A) SH (A), (B) ENSO (B), and (C) difference (|A| - |B|) for the midsummer precipitation in South China. The areas shaded with diagonal lines in (A) and (B) pass the 90% significance test.
As shown in Figures 7A,B, the spatial distribution characteristics of the spring SH over the TP and the ENSO contributions to midsummer precipitation in eastern China are consistent with Figure 4. Combined with Figure 4, the spring SH over the TP and the ENSO have significant positive contributions to the Yangtze–Huaihe River Basin and the middle and lower reaches of the Yangtze River, respectively, while for the same region of South China, both show significant negative contributions (absolute values in the figures). When these non-linear relation-impacting factors have concurrent effects, it is difficult to discern their respective contribution to the midsummer precipitation in South China. However, with the difference between SSH and SNiño-3, the contribution from the spring SH over the TP and the ENSO can be compared (Figure 7C). There are regional differences in the impact of the SH and the ENSO on precipitation in South China; namely, the precipitation in the eastern coast of South China is mainly dominated by the spring SH over the TP, while the central and southern of South China is dominated by the ENSO.
Additionally, the PDO phase transition can weaken the impact of the ENSO on summer precipitation in southern China (Chan and Zhou, 2005; Wang et al., 2008; Song and Zhou, 2015; Dong, 2016). To clarify the impacts of the spring SH over the TP and the ENSO on the midsummer precipitation in South China under different PDO phases, the sliding t-test has been carried out for the spring SH and midsummer precipitation in South China, as shown in Figure 8A. Over the past 41 years, both the midsummer precipitation in South China and the spring SH over the TP changed significantly in 1996, as shown in Figure 8A (passing the 95% significance level), while ENSO events had no remarkable change. Figure 8B displays the 11-year low pass-filtered PDO in the preceding wintertime. Note that the PDO also experienced a positive-to-negative phase transition around 1996. Hence, for the convenience of research, the period 1979–1996 is recorded as T1, and the 1997–2019 period is T2. In addition, the 11-year low pass-filtered PDO is positively correlated to the sliding correlation between the ENSO and midsummer precipitation in South China, especially during the positive PDO phase (not significant during the negative PDO phase), which indicates that the PDO may play a moderating role on the ENSO and its relationship with midsummer precipitation in South China.

FIGURE 8. (A) Eleven-year sliding t-test of the spring SH over the TP and midsummer precipitation in South China. Solid red and black lines represent the spring SH over the TP and the midsummer precipitation in South China, respectively, and dashed lines indicate the 95% significance level. (B) Eleven-year moving average of the PDO index.
Eight categories are selected to further examine the regulation of the PDO on the effects of the SH over the TP and the ENSO on the midsummer precipitation in South China, as shown in Table 1. Then, composite analyses can be conducted for the different categories to distinguish the relative contributions of different factors to the precipitation in South China.

TABLE 1. Remarkable spring SH over the TP and ENSO events in Niño-3 based on the different PDO phases during 1979–2019.
Figure 9 depicts the composition of midsummer precipitation anomalies in South China in stronger and weaker years of the spring SH over the TP and the preceding ENSO under the positive PDO phase (period T1). On the one hand, the midsummer precipitation in South China significantly decreased (increased) in the years with a strong (weak) spring SH, especially in the southeast coastal areas (Figures 9A,B, respectively), which is consistent with the results obtained in Figure 6; on the other hand, in years of preceding El Niño (La Niña) events, the midsummer precipitation in South China significantly decreased (Figures 9C,D, respectively).
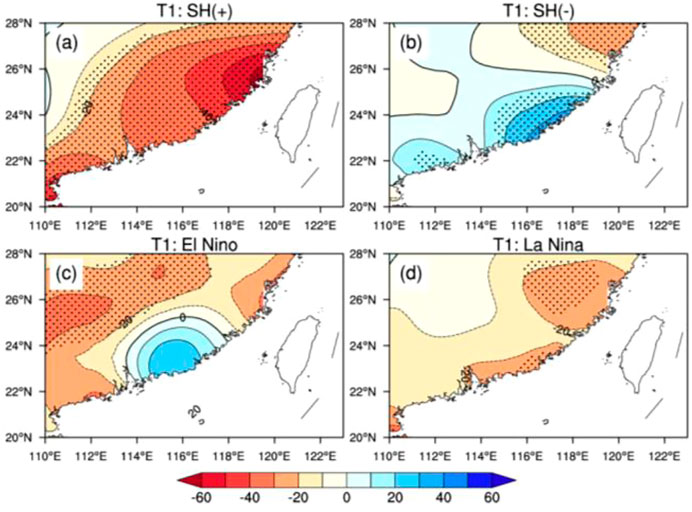
FIGURE 9. Composition of midsummer precipitation anomalies in South China in different phase years of the spring SH ((A,B) represent years of positive and negative SH, respectively) and the Ni–o-3 index anomalies ((C,D) represent years of El Niño and La Niña, respectively) under positive PDO phases during 1979–2019 (unit: mm; the dotted areas passing the 90% significance level test).
The PDO plays an important role in modulating the impacts of the ENSO (Power et al., 1999; Chen et al., 2013). During the T2 period (1997–2019), when the PDO was in a negative phase, the sliding correlation coefficient between the PDO and the ENSO with the midsummer precipitation in South China was not significant. Compared with the T1 period, the effect of the ENSO on midsummer precipitation in South China was enhanced after being modulated by the PDO (Figures 10C,D). At this time, the impacts of the spring SH over the TP and the ENSO in the preceding wintertime on midsummer precipitation in South China are relatively independent, which is consistent with Figure 4. In addition, it can be seen (Figures 10A,B) that the modulation effect of the PDO makes the influence of the spring SH on precipitation in midsummer in South China relatively symmetrical in the spatial distribution mode.
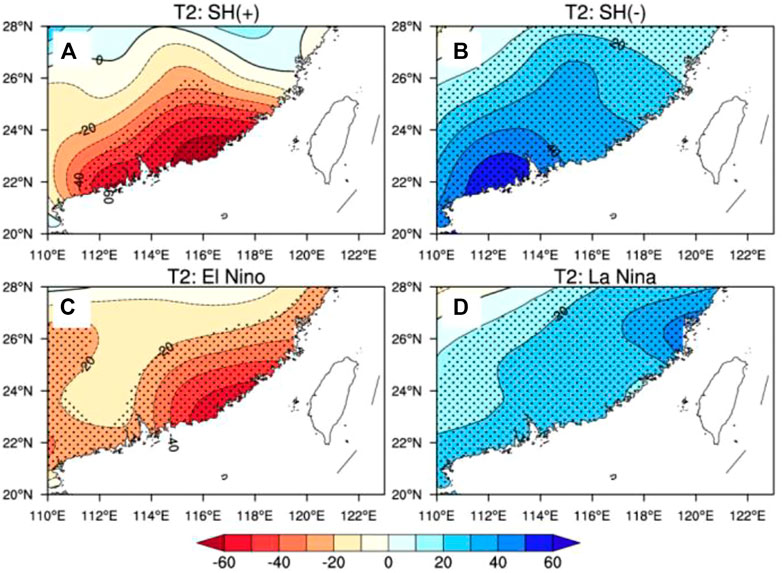
FIGURE 10. Composition of midsummer precipitation anomalies in South China in different phase years of the spring SH ((A,B) represent years of positive and negative SH, respectively) and the Niño-3 index anomalies ((C,D) represent years of El Niño and La Niña, respectively) under negative PDO phases during 1979–2019 (unit: mm; the dotted areas passing the 90% significance level test).
3.4 Atmospheric circulation and water vapor transport anomalies in South China
As shown in Figure 11, during the SH(+)/PDO (+) period (Figure 11A), the intensity of the SAH and the WPSH were consistent with the climatic state, and South China was under the control of low-level anticyclone anomalies at 850 hPa located between the SAH and the WPSH. This results in the convergence and transportation of water vapor to the middle and lower reaches of the Yangtze River in the Yangtze–Huaihe River Basin, leading to less precipitation in South China. Meanwhile, during the SH(−)/PDO (+) period (Figure 11B), as the intensity of both the SAH and the WPSH weakened abnormally, the SAH retreated westward, and the WPSH moved eastward. Under the configuration of the anomalous anticyclone centered in the Yellow Sea and the anomalous cyclone circulation centered in the South China Sea in the lower layers, the water vapor from the eastern coastal areas of South China was continuously transported to central and northern China. Meanwhile, there was weak water vapor convergence in the central and southern parts of South China, which is consistent with the precipitation anomalies in Figure 9B.
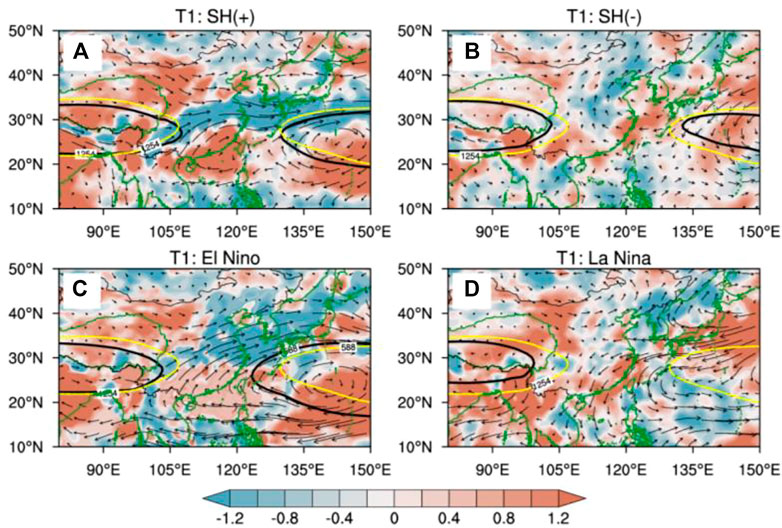
FIGURE 11. Transport of the column-integrated water vapor (unit: kg·m−1·s−1) and water vapor flux divergence (unit: 10−5 g·cm−2·hPa−1·s−1) in different phase years of the spring SH (a and b represent years of positive and negative SH, respectively) and the Niño-3 index anomalies (c and d represent years of El Niño and La Niña, respectively) under positive PDO phase. The solid black lines 1254 and 588 dgpm represent the characteristic lines of 200 hPa SAH and 500 hPa WPSH respectively; the yellow dotted line indicates the statistical mean position of the two high pressure system.
Moreover, the WPSH was stronger (weaker) in the El Niño (La Niña) event years under positive PDO phases, extending (retreating) westward (eastward). The whole area in South China is in the center of an anticyclone (cyclone) circulation anomaly with downdraft (updraft) movement, which gives rise to the whole-layer moisture flux diverging (converging) (Figures 11C,D) in the Yangtze–Huaihe River Basin, resulting in less (more) midsummer precipitation in South China. Hence, in the years of ENSO/PDO(+) , midsummer precipitation in South China is reduced (Figures 9C,D).
From the perspective of the circulation field, compared with the pre-mutation T1 period (positive PDO phase), due to the modulation of the PDO, in the SH(+) and El Nino years in T2 (negative PDO period) in Figures 12A, C, the SAH and the WPSH were abnormally enhanced. This manifested as the SAH extending eastward and the WPSH moving westward, resulting in their being very close to each other. Under this anomalous circulation configuration, the lower levels of South China were dominated by anomalous anticyclonic circulation. The water vapor was transported and converged to the Yangtze River Basin, leading to decreased midsummer precipitation in South China, which is identical to the result of Figures 10A,C. In the SH(−) and La Nina years in T2 shown in Figures 12B, D, the intensity variation of the SAH and the WPSH were relatively weak. South China was under the control of anomalous cyclonic circulation, accompanied by stronger ascending motion and water vapor convergence and transport; hence, midsummer precipitation increased abnormally (Figures 10B,D).
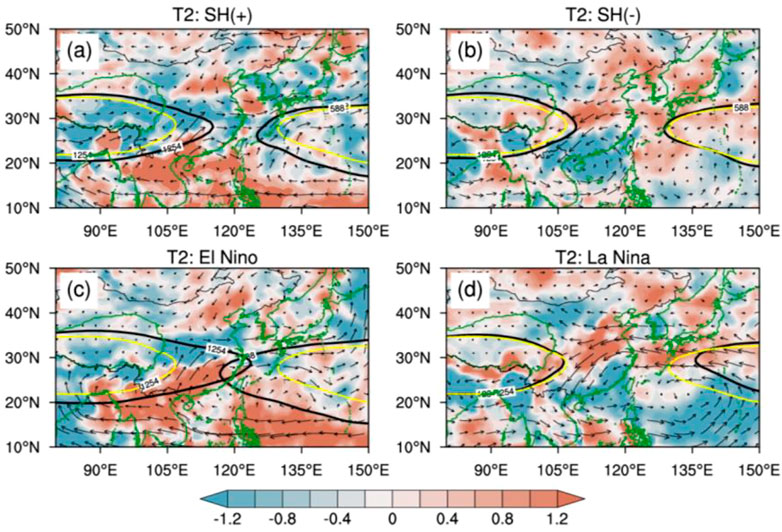
FIGURE 12. Transport of the column-integrated water vapor (unit: kg·m−1·s−1) and water vapor flux divergence (unit: 10−5 g·cm−2·hPa−1·s−1) in different phase years of the spring SH ((A,B) represent years of positive and negative SH, respectively) and the Niño-3 index anomalies ((C,D) represent years of El Niño and La Niña, respectively) under negative PDO phase. The solid black lines 1254 and 588 dgpm represent the characteristic lines of 200 hPa SAH and 500 hPa WPSH respectively; the yellow dotted line indicates the statistical mean position of the two high pressure system.
What is more, in the remarkable positive (negative) phase years of the spring SH and the ENSO, the SAH over South Asia strengthened (weakened) and extended (retreated) eastward (westward), and the WPSH reinforced (weakened) while moving west (east). There is a trend of “moving toward each other or moving away from each other” (Figure 12) (Tao and Chu, 1964) between the two high-pressure areas.
3.5 Influence of relative position changes in the SAH and WPSH on precipitation in South China
Whether the effects of the relative position changes of the SAH and the WPSH on the precipitation in South China are independent or synergistic is an important question. To analyze the influence of the zonal relative position variation of the SAH and the WPSH on the midsummer precipitation in South China, Figure 13 shows the index of the west ridge of the 588 dagpm isoline on the 500 hPa geopotential field and the east ridge of the 1,254 dagpm isoline on the 200 hPa geopotential field of the SAH (Figure 13A) in midsummer from 1979 to 2019. The normalized zonal relative position variation of the ridge point of the two high pressures is shown in Figure 13B, from which we can learn that in the past 41 years (1979–2019), compared to the climatological mean of the east ridge of the SAH and the west ridge of the WPSH, the position of the two high-pressure system ridges has changed westward 55% of the time and eastward 45% of the time. The analysis found that the relative motion of the SAH and the WPSH accounted for 70%, of which the motion of moving toward and away from each other was 37.5% and 32.5%, respectively (Table 2).

FIGURE 13. (A) Index of the east ridge point of the spring SH over the TP and the west ridge point of the WPSH and the (B) standardized zonal relative position anomaly. The solid red and black lines in (A) denote the index of ridge points of the SH and the WPSH, respectively. The red, black, and blue bars in (B) indicate the standardized anomaly index of the east ridge points of the SAH, the east ridge point of the WPSH, and the relative position change, respectively. The dashed lines denote ±1.0-

TABLE 2. Statistics of the ridge points and zonal relative position changes in the SAH and the WPSH.
In summer, under the effect of heating over the TP, a strong anticyclone is formed in the upper level of South Asia, and the airflow diverging from the TP to the east forms a horizontal convergence in the middle levels of the Pacific Ocean, thus playing an important role in the formation and maintenance of the WPSH. The two high pressures at different heights in the subtropical summer zone can be regarded as a whole, and they tend to move in opposite directions and apart from each other. According to ±1.0

TABLE 3. Two types of years selected according to the standardized zonal relative position anomalies during 1979–2019.
Figure 14 depicts the spatial distribution of midsummer precipitation anomaly in South China according to the zonal relative position of the SAH and the WPSH. When the SAH and the WPSH noticeably moved away from each other, that is, the SAH retreated to the west, and the WPSH retreated to the east, the midsummer precipitation in all South China areas increased significantly (Figure 14A), while the midsummer precipitation in South China reduced markedly when the two high pressures moved toward each other, namely, the SAH moved eastward, and the WPSH extended westward, and the two even overlapped (Figure 14B). The synergistic effect of the zonal relative position anomaly of the two high pressures on the midsummer precipitation in South China is primarily located in the southeast coastal areas, which passed the 90% significance level test.
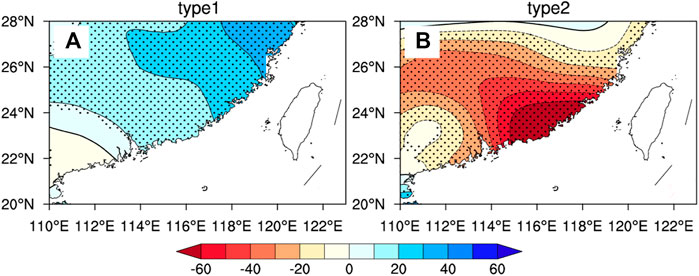
FIGURE 14. Composition of midsummer precipitation anomalies in South China in different phase years of zonal relative position index anomalies during 1979–2019. (A) and (B) are types 1 and 2; unit: mm.
In summation, what can be seen is that the synergistic influence of the zonal relative position of the SAH and the WPSH on midsummer precipitation in South China lies in when the two high pressures move toward (away from) each other, corresponding to the positive (negative) phase of the standardized ridge position index, the precipitation increases (decreases) significantly.
To discuss the relationship between the zonal relative position anomalies of the SAH and the WPSH and the precipitation in midsummer in South China, the anomalies of the atmospheric circulation field, the water vapor flux, and the water vapor divergence of the SAH and WPSH zonal relative positions were studied using composite analysis. As shown in Figure 15, when the SAH and the WPSH were far apart from each other (Figure 15A), the east extension ridge point of the 1,254 dagpm isoline on the 200 hPa geopotential field was located at 102.3°E, which is about 6 degrees of longitude westward compared with the climatic mean state. At the same time, the WPSH has also retreated to the sea, with the west ridge located at 138.2°E, which is about 16 degrees of longitude eastward from the mean state. In this modal, the whole South China region was under the cyclone circulation anomaly center with an updraft motion of the atmosphere, and the water vapor from both the middle and lower reaches of the Yangtze–Huaihe River Basin and the ocean converged to South China, which is conducive to the abnormal increase of midsummer precipitation in South China (Figure 11A). In contrast to the depiction in Figure 15A, South China was under the control of the anticyclone circulation anomaly shown in Figure 15B, accompanied by a downdraft motion of the atmosphere when the SAH and WPSH approached or overlapped. This is conducive to the convergence of water vapor to the Yangtze–Huaihe River Basin, decreasing the water vapor in South China significantly, and leading to decreased midsummer precipitation in South China.
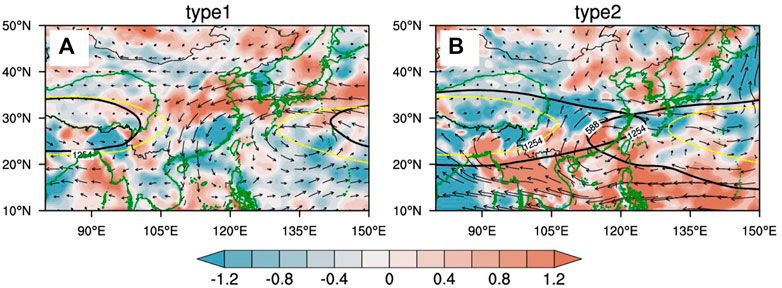
FIGURE 15. Whole-layers water vapor transportation (unit: kg·m−1·s−1) and water vapor flux divergence for type 1 (A) and type 2 (B) during 1979–2019 (unit: 10–5 g cm−2·hPa−1·s−1).
4 Conclusion
In this study, the impacts of the spring SH over the TP and the SSTA in Niño-3 regions on the midsummer precipitation were investigated based on the observation data and reanalysis datasets during 1979–2019. The variance of midsummer precipitation in South China exhibits a noticeable negative correlation with the spring SH over the TP and the SSTA in Niño-3 regions in the preceding winter. Usually, the positive phase years of the spring SH and Niño-3 index are accompanied by significant anticyclone circulation anomalies over South China, which tend to reduce moisture transport to areas in South China. Hence, the summer precipitation in South China, especially in midsummer, experienced a noticeable reduction in the period from 1979–2019. During the negative years of the spring SH and the Niño-3 index, the atmospheric circulation anomalies and water vapor transport are roughly opposite to those in the positive phase years. It is found that the response of the midsummer precipitation in South China is more sensitive to the spring SH over the TP than to the SSTA in Niño-3, indicating the spring SH over the TP plays a more dominant role in summer precipitation in South China. In addition, the spatial distribution of midsummer precipitation anomalies in South China is asymmetric with the different phases of the Niño-3 index, while it responds symmetrically to the spring SH.
We also explore the impact of the zonal relative position of the SAH and the WPSH on the midsummer precipitation in South China according to the definition of the ridge index from 1979 to 2019.
The midsummer precipitation anomalies in South China are obviously affected by the synergistic effects of the SAH and the WPSH, and the effect on the precipitation anomalies is the superposition of the two effects. Therefore, the synergistic effect of the zonal relative position of the SAH and the WPSH on midsummer precipitation in South China is that when the two high pressures move toward (away from) each other, corresponding to the positive (negative) phase of the standardized ridge position index, the precipitation increase (decrease) significantly.
Data availability statement
The original contributions presented in the study are included in the article/Supplementary Material; further inquiries can be directed to the corresponding author.
Author contributions
SZ and MW contributed to the conception and design of the study. YS and XS performed analyses and prepared the original draft. CW and ZD were involved in the editing and discussion. All authors contributed to manuscript revision and read and approved the submitted version.
Funding
This study was jointly supported by the Key Program of National Natural Science Foundation of China (Grant Nos. 42030602 and 42030611) and the National Key R&D Program of China (Grant No. 2016YFA0602003).
Acknowledgments
The authors are grateful to the China Meteorological Administration (CMA), ECMWF, and NCEP/NOAA for their datasets.
Conflict of interest
The authors declare that the research was conducted in the absence of any commercial or financial relationships that could be construed as a potential conflict of interest.
Publisher’s note
All claims expressed in this article are solely those of the authors and do not necessarily represent those of their affiliated organizations, or those of the publisher, the editors and the reviewers. Any product that may be evaluated in this article, or claim that may be made by its manufacturer, is not guaranteed or endorsed by the publisher.
References
Ao, T., and Li, Y. (2015). Summer thermal characteristics over Qinghai-Xizang Plateau and surrounding areas and its relationship with precipitation in east Asia. Plateau meteorol. 34 (5), 1204–1216. doi:10.7522/j.issn.1000-0534.2014.00100
Chan, J., and Zhou, W. (2005). PDO, ENSO and the early summer monsoon rainfall over South China. Geophys. Res. Lett. 32 (8), L08810. doi:10.1029/2004GL022015
Chen, W., Feng, J., and Wu, R. (2013). Roles of ENSO and PDO in the Link of the East Asian Winter Monsoon to the following Summer Monsoon. J. Clim. 26 (2), 622–635. doi:10.1175/JCLI-D-12-00021.1
Chen, J., Wen, Z., Wu, R., Wang, X., He, C., and Chen, Z. (2017). An interdecadal change in the intensity of interannual variability in summer rainfall over southern China around early 1990s. Clim. Dyn. 48, 191–207. doi:10.1007/s00382-016-3069-8
Chen, M., Yu, J., Wang, X., and Jiang, W. (2018). The changing impact mechanisms of a diverse El Niño on the western pacific subtropical high. Geophys. Res. Lett. 46 (2), 953–962. doi:10.1029/2018GL081131
Chi, Y., He, J., and Wu, Z. (2005). Features analysis of the difference precipitation periods in the pre-flood season in SouthSouth China. J. Nanjing Inst. Meteorology 28 (2), 163–171. doi:10.13878/j.cnki.dqkxxb.2005.02.003
Dee, D., Uppala, S., Simmons, A., Berrisford, P., Kobayashi, S., Andrae, U., et al. (2011). The ERA-Interim reanalysis: Configuration and performance of the data assimilation system. Q. J. R. meteorological Soc. 137 (656), 553–597. doi:10.1002/qj.828
Ding, Y., Wang, Z., and Sun, Y. (2010). Inter-decadal variation of the summer precipitation in East China and its association with decreasing Asian summer monsoon. Part I: Observed evidences. Int. J. Climatol. 28 (9), 1139–1161. doi:10.1002/joc.1615
Dong, X. (2016). Influences of the Pacific decadal oscillation on the East Asian summer monsoon in non-ENSO years. Atmos. Sci. Lett. 17 (1), 115–120. doi:10.1002/asl.634
Duan, A., and Wu, G. (2008). Weakening trend in the atmospheric heat source over the Tibetan plateau during recent decades. Part I: Observations. J. Clim. 21 (13), 3149–3164. doi:10.1175/2007JCLI1912.1
Duan, A., Sun, R., and He, J. (2017). Impact of surface sensible heating over the Tibetan plateau on the Western pacific subtropical high: A land–air–sea interaction perspective. Adv. Atmos. Sci. 34 (2), 157–168. doi:10.1007/s00376-016-6008-z
Duan, A., Xiao, Z., and Wang, Z. (2018). Impacts of the Tibetan plateau winter/spring snow depth and surface hear source on asian summer monsoon: A review (in Chinese). Chin. J. Atmos. Sci. 42 (4), 755–766. doi:10.3878/j.issn.1006-9895.1801.17247
Duan, A., Liu, S., Hu, W., Hu, D., and Peng, Y. (2022). Long-term daily dataset of surface sensible heat flux and latent heat release over the Tibetan Plateau based on routine meteorological observations. Big Earth Data 6 (4), 480–491. doi:10.1080/20964471.2022.2037203
Fan, W., Ma, W., Hu, Z., and Ma, Y. (2021). Recovery of sensible heating and its elevation amplification over and around the Tibetan Plateau since 2000s. Theor. Appl. Climatol. 146, 617–630. doi:10.1007/s00704-021-03737-3
Feng, J., Wang, L., and Chen, W. (2014). How does the East Asian summer monsoon behave in the decaying phase of El Niño during different PDO phases? J. Climate 27 (7), 2682–2698. doi:10.1175/JCLI-D-13-00015.1
Flohn, H. (1957). Large-scale aspects of the “Summer Monsoon” in South and east Asia. J. Meteorological Soc. Jpn. Ser. II 35, 180–186. doi:10.2151/jmsj1923.35A.0_180
Guan, W., Ren, X., Shang, W., and Hu, H. (2018). Subseasonal zonal oscillation of the western pacific subtropical high during early summer. J. Meteor. Res. 32 (5), 768–780. doi:10.1007/s13351-018-8061-2
Guo, Q., and Sha, W. (1998). Analysis of rainfall variability during the first rainy season in South China. Q. J. Appl. Meteorology 9 (1), 9–15.
Guo, R., and Zhi, X. (2008). Synoptic analysis of severe droughts during the summer 2003 in southern China. J. Nanjing Inst. Meteorology 31 (2), 234–241. doi:10.13878/j.cnki.dqkxxb.2008.02.012
Hao, J., and Lu, E. (2021). The quantitative comparison of contributions from vapour and temperature to midsummer precipitation in China under the influence of spring heat source over Tibet Plateau. Int. J. Climatol. 42 (3), 1754–1766. doi:10.1002/joc.7333
Huang, J., and Wang, S. (1985). Investigations on variations of the subtropical high in the Western Pacific during historic times. Clim. Change 7, 427–440. doi:10.1007/BF00139057
Huang, R., and Wu, Y. (1989). The influence of ENSO on the summer climate change in China and its mechanism. Adv. Atmos. Sci. 6 (1), 21–32. doi:10.1007/BF02656915
Li, G., Duan, T., and Gong, Y. (2000). The bulk transfer coefficients and surface fluxes on the Western Tibetan Plateau. Chin. Sci. Bull. 45 (13), 1221–1226. doi:10.1007/BF02886084
Li, X., Wen, Z., and Zhou, W. (2011). Long-term Change in Summer Water Vapor Transport over South China in Recent Decades. Journal of the Meteorological Society of Japan 89, 271–282. doi:10.2151/jmsj.2011-A17
Liu, Y., Wu, G., Hong, J., Dong, B., Duan, A., Bao, Q., et al. (2012). Revisiting asian monsoon formation and change associated with Tibetan plateau forcing: II. Change. Clim. Dyn. 39 (5), 1183–1195. doi:10.1007/s00382-012-1335-y
Lu, E., Takle, E., and Manoj, J. (2010). The relationships between climatic and hydrological changes in the upper Mississippi River Basin: A swat and multi-GCM study. J. Hydrometeor. 11 (2), 437–451. doi:10.1175/2009JHM1150.1
Lu, E., Ding, Y., Zhou, B., Zou, X., Chen, X., Cai, W., et al. (2015). Is the interannual variability of summer rainfall in China dominated by precipitation frequency or intensity? An analysis of relative importance. Clim. Dyn. 47 (1), 67–77. doi:10.1007/s00382-015-2822-8
Luo, X., and Zhang, Y. (2015). Interdecadal change in the seasonality of rainfall variation in South China. Theor. Appl. Climatol. 119, 1–11. doi:10.1007/s00704-013-1088-5
Luo, H. (1999). The onset of South China Sea monsoon and evolutions of its associated rainbands//Onset and evolutions of the South China Sea monsoon and its interaction with the ocean. Beijing: China Meteorological Press, 25–30.
Monin, A., and Obukhov, A. (1954). Basic laws of turbulent mixing in the atmosphere near the ground. Tr. Geofiz. Inst. Akad. Nauk. SSSR 24 (151), 163–187.
Power, S., Casey, T., Folland, C., Colman, A., and Mehta, V. (1999). Inter-decadal modulation of the impact of ENSO on Australia. Clim. Dyn. 15, 319–324. doi:10.1007/s003820050284
Qian, Y., Zhang, Y., Huang, Y., Huang, Y., and Yao, Y. (2004). The effects of the thermal anomalies over the Tibetan Plateau and its vicinities on climate variability in China. Adv. Atmos. Sci. 21 (3), 369–381. doi:10.1007/BF02915565
Qiao, Y., Zhou, S., Ma, Y., Wang, C., and Li, Q. (2014). Dynamic effect of Tibetan plateau and its impact on weather and climate in China. Meteorology Sci. Technol. 42 (6), 1039–1046. doi:10.3969/j.issn.1671-6345.2014.06.017
Rayner, N., Parker, D., Horton, E., Folland, C., Alexander, L., Rowell, D., et al. (2003). Global analyses of sea surface temperature, sea ice, and night marine air temperature since the late nineteenth century. J. Geophys. Res. Atmos. 108 (D14), 4407. doi:10.1029/2002JD002670
Ren, X., Yang, D., and Yang, X. (2015). Characteristics and mechanisms of the subseasonal eastward extension of the South Asian high. J. Clim. 28 (17), 6799–6822. doi:10.1175/JCLI-D-14-00682.1
Song, F., and Zhou, T. (2015). The crucial role of internal variability in modulating the decadal variation of the East Asian summer monsoon–ENSO relationship during the twentieth century. J. Clim. 28 (18), 7093–7107. doi:10.1175/JCLI-D-14-00783.1
Tao, S., and Chu, F. (1964). The 100 mb flow patterns in southern Asia in summer and its relation to the advance and retreat of the west2 Pacific subtropical anticyclone over the far east. Acta Meteorol. Sin. 34 (4), 385–396. doi:10.11676/qxxb1964.039
Tu, J., and Lu, E. (2020). Relative importance of water vapor and air temperature in the interannual variation of the seasonal precipitation: A comparison of the physical and statistical methods. Clim. Dyn. 54 (7), 3655–3670. doi:10.1007/s00382-020-05197-3
Wang, H., and Fan, K. (2013). Recent changes in the East asian monsoon. Chin. J. Atmos. Sci. (in Chinese) 37 (2), 313–318. doi:10.3878/j.issn.1006-9895.2012.12301
Wang, Y., Wang, B., and Oh, J. (2001). Impact of the preceding El Niño on the East asian summer atmosphere circulation. Journal of the Meteorological Society of Japan. Ser. II 79 (1B), 575–588. doi:10.2151/jmsj.79.575
Wang, L., Chen, W., and Huang, R. (2008). Interdecadal modulation of PDO on the impact of ENSO on the East Asian winter monsoon. Geophys. Res. Lett. 35 (20), L20702. doi:10.1029/2008GL035287
Wang, B., Huang, F., Wu, Z., Fu, X., and Kikuchi, K. (2009). Multi-scale climate variability of the SouthSouth China sea monsoon: A review. Dyn. Atmos. Oceans 47 (1-3), 15–37. doi:10.1016/j.dynatmoce.2008.09.004
Wang, M., Zhou, S., and Duan, A. (2012). Trend in the atmospheric heat source over the central and eastern Tibetan Plateau during recent decades: Comparison of observations and reanalysis data. Chinese Science Bulletin 57 (5), 548–557. doi:10.1007/s11434-011-4838-8
Wang, M., Wang, J., Chen, D., Duan, A., Liu, Y., Zhou, S., et al. (2019). Recent recovery of the boreal spring sensible heating over the Tibetan Plateau will continue in CMIP6 future projections. Environ. Res. Lett. 14 (12), 124066. doi:10.1088/1748-9326/ab57a3
Wu, X., and Mao, J. (2016). Interdecadal modulation of ENSO-related spring rainfall over SouthSouth China by the pacific decadal oscillation. Clim. Dyn. 47, 3203–3220. doi:10.1007/s00382-016-3021-y
Wu, R., Wen, Z., Song, Y., and Li, Y. (2010). An interdecadal change in southern China summer rainfall around 1992/93. J. Clim. 23 (9), 2389–2403. doi:10.1175/2009JCLI3336.1
Xu, Z., and Chen, H. (2018). Intraseasonal variation of midsummer precipitation anomaly in South China and its related atmospheric circulation anomalies. Journal of the Meteorological Sciences 38 (1), 1–10. doi:10.3969/2017jms.0008
Yang, H., and Sun, S. (2005). The characteristics of longitudinal movement of the subtropical high in the Western Pacific in the pre-rainy season in South China. Adv. Atmos. Sci. 22 (3), 392–400. doi:10.1007/BF02918752
Yang, S. H., Li, C., and Lu, R. (2014). Predictability of winter rainfall in South China as demonstrated by the coupled models of ENSEMBLES. Adv. Atmos. Sci. 31, 779–786. doi:10.1007/s00376-013-3172-2
Yang, R., Xie, Z., and Cao, J. (2017). A dynamic index for the westward ridge point variability of the western pacific subtropical high during summer. J. Clim. 30 (9), 3325–3341. doi:10.1175/JCLI-D-16-0434.1
Yeh, T., and Gao, Y. (1979). Meteorology of the qinghai-xizang (tibet) plateau (in Chinese). Beijing: Science Press, 278.
Yeh, T., Lo, S., and Chu, P. (1957). The wind structure and heat balance in the lower troposphere over Tibetan plateau. Acta Meteorologica Sinica 28 (2), 108–121. doi:10.11676/qxxb1957.010
Zeng, G., Zhang, G., Wu, Y., and Sun, Z. (2016). Numerical simulation of sea surface temperature anomaly effect on the interdecadal variation of South Asian high. Journal of the Meteorological Science 36 (4), 436–446. doi:10.3969/2015jms.0031
Zhan, C., Shi, Q., and Liang, S. (2020). Assessing the impacts of the spring sensible heat flux over the Tibetan Plateau on Asian summer monsoon rainfall using observational and reanalysis data. Int. J. Climatol. 40 (4), 2342–2358. doi:10.1002/joc.6336
Zhao, P., and Chen, L. (2001a). Climatic features of atmospheric heat source/sink over the Qinghai-Xizang Plateau in 35 years and its relation to rainfall in China. Sci. China Ser. D-Earth Sci. 44, 858–864. doi:10.1007/BF02907098
Zhao, P., and Chen, L. (2001b). Interannual variability of atmospheric heat source/sink over the Qinghai—xizang (Tibetan) plateau and its relation to circulation. Adv. Atmos. Sci. 18 (1), 106–116. doi:10.1007/s00376-001-0007-3
Zheng, B., Liang, J., Lin, A., Li, C., and Gu, D. (2006). Frontal rain and summer monsoon rain during pre-rainy season in SouthSouth China. Part Ⅰ: Determination of the division dates. Chinese Journal of Atmospheric Sciences 30 (6), 1207–1216. doi:10.3878/j.issn.1006-9895.2006.06.15
Zhong, Q., Zhang, L., Ding, R., and Qin, J. (2016). The variation of summer precipitation in SouthSouth China and its relationship with SST anomalies in the tropical pacific. Climate Change Research 12 (1), 28–36. doi:10.12006/j.issn.1673-1719.2015.123
Zhou, X., Zhao, P., Chen, J., Chen, L., and Li, W. (2009). Impacts of thermodynamic processes over the Tibetan plateau on the northern hemispheric climate. Sci. China Ser. D-Earth Sci. 52 (11), 1679–1693. doi:10.1007/s11430-009-0194-9
Zhu, L., Huang, G., Fan, G., Qu, X., Zhao, G., and Hua, W. (2017). Evolution of surface sensible heat over the Tibetan Plateau under the recent global warming hiatus. Adv. Atmos. Sci. 34, 1249–1262. doi:10.1007/s00376-017-6298-9
Keywords: sensible heat, Tibetan Plateau, ENSO, midsummer precipitation, South China
Citation: Sun Y, Shan X, Zhou S, Wang M, Wang C and Deng Z (2023) Impacts of Tibetan Plateau sensible heat and El Niño–Southern Oscillation on precipitation over South China under the background of the PDO. Front. Environ. Sci. 11:1156206. doi: 10.3389/fenvs.2023.1156206
Received: 01 February 2023; Accepted: 24 March 2023;
Published: 13 April 2023.
Edited by:
Zhiwen Dong, Chinese Academy of Sciences (CAS), ChinaReviewed by:
Xiaoyu Jiao, Chinese Academy of Sciences (CAS), ChinaXiaoli Liu, Henan University, China
Copyright © 2023 Sun, Shan, Zhou, Wang, Wang and Deng. This is an open-access article distributed under the terms of the Creative Commons Attribution License (CC BY). The use, distribution or reproduction in other forums is permitted, provided the original author(s) and the copyright owner(s) are credited and that the original publication in this journal is cited, in accordance with accepted academic practice. No use, distribution or reproduction is permitted which does not comply with these terms.
*Correspondence: Shunwu Zhou, emhvdUBudWlzdC5lZHUuY24=
 Yang Sun
 Xing Shan2
 Meirong Wang