 Chenyu Liu
94% of researchers rate our articles as excellent or good
Learn more about the work of our research integrity team to safeguard the quality of each article we publish.
Find out more
ORIGINAL RESEARCH article
Front. Environ. Sci. , 14 July 2023
Sec. Environmental Economics and Management
Volume 11 - 2023 | https://doi.org/10.3389/fenvs.2023.1155237
Water scarcity and pollution have become a global problem, especially in China. Whether China can solve the water resources dilemma is closely related to its ability to achieve high-quality development. At present, studies on China’s water resources policy are relatively few and all of them are theoretical interpretations or regional studies. There is little literature examining the impact of China’s water resources policy on enterprises and its mechanisms. Therefore, this paper takes China’s water resource tax reform in 2017 as a quasi-natural event and constructs a difference-in-differences model to investigate the micro-governance effects of water resource tax reform based on panel data of high water-consuming enterprises listed in Shanghai and Shenzhen A-shares between 2012 and 2020. The findings of the study are as follows. Firstly, the water resource tax reform significantly improves the environmental performance of water-intensive enterprises. Secondly, through the mechanism test the author finds that water resource tax reform can promote the research and development of green invention patents in companies, which in turn improves their environmental performance. However, water resource tax showed no significant effect on green utility model patents. Finally, taking into account heterogeneity, this paper points out that the impact of the reform is more prominent in water-scarce regions and among large-scale enterprises. This paper provides experience and evidence for the promotion of water resource tax reform and inspires the author to give some policy recommendations. In the future, China should continue to implement water resource tax policy and increase technical and financial support to enterprises for green innovation.
Water resources play an important role in safeguarding the earth’s ecological environment and promoting sustainable development. It is also a must for economic development and productive operations of enterprises. However, nowadays water scarcity has become a global problem. The UN World Water Development Report 2022 states that around two-fifths of the world’s population lack access to water for domestic use. According to the World Meteorological Organization (WMO), about 5 billion people worldwide will face severe water shortages by 2050. In China, per capita water availability only accounts one-fourth of the world average, yet the discharge of wastewater emissions are disproportionately high. As a result, water scarcity is particularly acute in China. With rapid industrialization, enterprise production, especially industrial production, constitutes the bulk of water use Besides, more and more attention has been paid to the environmental responsibility of enterprises in recent years. Therefore, indexes like water usage and the discharge and treatment of enterprise wastewater have been taken into consideration in evaluating their environmental performance. In high water-consuming industries such as liquor and furniture manufacturing, many investment institutions have even identified water issues as one of their core ESG risks. In view of the foregoing discussion, how to deal with the water use of high water-consuming enterprises so as to improve their environmental performance is crucial to getting China out of the water shortage predicament.
A review of the literature related to environmental protection reveals that existing studies have mainly explored how to prevent and control air pollution. In China, environmental protection policies such as the new air quality standards (Chen W et al., 2015) (Chen et al., 2015), the “Ten Atmospheric Articles” (Jiang X et al., 2015; Li T et al., 2021) (Jiang et al., 2015; Li et al., 2021) and carbon emissions trading (Hu Y et al., 2020; Liu J Y et al., 2021) (Hu et al., 2020; Liu et al., 2021) have played an active role in achieving efficient prevention and control of air pollution. Compared to other environmental protection policies, the water resource tax is a new way of tackling the problem at source. However, there is a paucity of research on this topic. Among those relavant researches, a majority of them focuses on policy review and interpretation (Xu Q, 2020; Chen Z R et al., 2021) (Xu, 2020; Chen et al., 2021). The few empirical studies focus on regional studies, such as He L and Chen K (2021) (He and Chen, 2021), Tian G et al. (2021) (Tian et al., 2021) and Ouyang R et al. (2022) (Ouyang et al., 2022), which found that water resource tax can effectively improve water use efficiency.
More importantly, in the exploration of the mechanisms of environmental regulation, the existing literature has shown that technological innovation is key to promoting better environmental performance of enterprises. For example, Long X et al. (2017) (Long et al., 2017) found that the impact of green innovation on environmental performance is significant and greater than economic performance. Liu Y et al. (2022) (Liu Y. et al., 2022) found that actions for air pollution control manage to improve energy efficiency mainly by stimulating technological innovation. In addition, Liu Y et al. (2023) (Liu et al., 2023) found that digital technologies can also significantly increase green total factor productivity.
There are two main limitations to current research. Firstly, the target audience for environmental protection in China is limited and there is little literature on how to improve the water resource environment. Secondly, China’s environmental protection strategy is mainly to control pollutant emissions at the end of the process, and there is little literature on how to improve environmental problems at source. Although numerous studies have found green innovation to be an important mechanism for promoting corporate environmental performance, there is little discussion on whether there are differences in the role of different types of green innovation, such as invention patents versus utility patents. Regarding this, it is urgent to investigate whether water resource tax has a governance effect on micro enterprises. The research gap thus provides sufficient motivation for this paper.
Based on the above discussions, this paper takes China’s water resource tax reform in 2017 as a quasi-natural experiment and adopts the difference-in-differences (DID) method to measure how the reform influence the environmental performance of high water-consuming enterprises. The study finds that the water resource tax reform significantly improves the environmental performance of water-intensive sectors via stimulating the research and development of green invention patents in companies. What’s more, such positive impact was more prominent in regions with scarcer water resources and in enterprises with larger assets.
The contribution of this paper is threefold. First of all, it is probably the first paper to examine the effects of water resource tax reform from a corporate perspective. Existing studies have mainly focused on the effects of regional governance, such as the efficiency of agricultural water use. A small number of empirical papers have probed into the impact of water resource tax reform on the performance of water quality in Hebei Province (He L and Chen K, 2021) (He and Chen, 2021). This paper examines the impact of water resource tax reform on the environmental performance of enterprises and manages to explore the governance effects of the reform from a micro perspective, which provides a unique angle for this topic.
On top of that, this paper further enriches the research results in the field of environment and economy. Most of the current research on environment and economy in China centers on the atmospheric environment and fairly fruitful results have already been produced. This paper, however, pays close attention to China’s water environment issues and examines the superiority of water resource tax as an environmental strategy for source treatment. As a result, this study not only embodies humanistic care but also takes into account geographical diffenrences as well as industry differences, which helps curb further irrational water use.
Last but not least, the paper provides evidence and recommendations for the promotion of water resources tax reform. Water resource taxation has already made a difference in improving governance effect. The policy can stimulate the research and development of green invention patents among companies, which will in turn improve corporate environmental performance. Water resources are of vital importance to the people’s wellbeing, the ecological security and even China’s future. Hence, only if we implement the most stringent resource management system can we promote the conservation and rational development of resources. In the future, water resource tax levy should be in tune with local conditions and enterprise characteristics so that the tax rate standard will be more scientific and reasonable.
The content of this paper are organized as follows. The first chapter is introduction, which introduces the research background, existing research and limitations as well as the contribution of this paper. The second chapter elaborates on institutional background and theoretical mechanism, which explains the content and characteristics of water resource tax and how the tax mechanism affects enterprises. The third chapter presents the research design, which introduces the model design, the definition of variables, and the selection of samples and data sources. The fourth chapter displays empirical analysis, which mainly includes descriptive statistics, dynamic effects test, benchmark regression analysis, and robustness test. The fifth chapter is further study, which mainly incorporates mechanism tests and heterogeneity analysis. The sixth chapter ends the paper with conclusion and implications.
The severe shortage of water resources is one of the long-standing development challenges facing China. To improve the efficiency of water use by enterprises and to control the amount of groundwater extracted in cities, water resource fees, as an important economic instrument, was adopted by the Chinese government in the early stages to solve the probelms. Specifically, in 2002, Article 48 of the amended Water Law of the People’s Republic of China incorporated water resource fees into the law. Water consumption is subject to a system of metering and progressive tariff increases over a fixed amount. Enterprises are required to apply for water permit and pay water resource fees to the relevant regulatory body. Subsequently, in order to standardize the water resource fees levy and the collection of water permits by enterprises, the State Council enacted the Regulations on Administration of Water Permits and Water Resource Fee Collection on 15 April 2006. On 10 November 2008, the Ministry of Finance, the Ministry of Water Resources and the National Development and Reform Commission promulgated the Measures for the Collection and Use of Water Resources Fees, further optimizing the water resource fee collection method. To a certain extent, the collection of water resource fees has achieved the effect of conserving and protecting water resources. However, there are still many problems in the actual management and collection work of water resource fees. For example, many water charges are not levied. In addition, water costs not recorded in time can be artificially adjusted to revenue progress. Moreover, sometimes water resource fees takes no account of sewage treatment fees. These issues discourage companies from paying their contributions in accordance with the law, which makes groundwater over-exploitation a chronic problem in our country.
To crack the hard nut of water scarcity alongside an unreasonable water supply structure, in May 2016 China began exploring mechanisms of converting water resource fees to taxes. In July of the same year, Hebei Province, one of the provinces facing the most serious groundwater overdraft, took the lead in piloting the new mechanism and exploring the right path. The taxation standard is set strictly in accordance with the principle of classification and zoning, and a higher tax rate is applied to the groundwater over-exploitation zone. In terms of the mode of water resource tax collection, management and supervision, Hebei Province has achieved two “firsts” — the first to adopt the “joint tax and water management” mode, and the first to initiate the “water going with electricity, terminal metering, electricity reflecting water” taxpayer identification method. On 1 December 2017, China expanded the trial to another nine provinces (autonomous regions and municipalities directly under the Central Government), namely, Beijing, Tianjin, Shanxi, Inner Mongolia, Shandong, Henan, Sichuan, Shaanxi and Ningxia. Compared to the original 24 pilot interim measures, the 2017 pilot implementation measures for the expanded water resource tax reform have been increased to 31 articles, with more detailed and scientific provisions that can make a bigger difference.
From the change of “fees” to “taxes”, the characteristics of the reform provisions among the nine pilot provinces can be sorted out. Firstly, the pilot areas are both universal and representative in that they are evenly distributed across the eastern, central and western parts of the country. Beijing, Tianjin and Shandong belong to the eastern part of China, Shanxi, Inner Mongolia and Henan to the central part of China, and Sichuan, Shaanxi and Ningxia to the western part of China. Meanwhile, four provinces, including Beijing, Tianjin, Shanxi and Inner Mongolia, are located in northern China. The conflict between supply and demand of water resources in North China is extremely prominent, and total amount of its groundwater overdraft already accounts for one-half of the country. Secondly, the subject of the charge and the standard have changed. In the past, the charge standard was “quantity-based collection”, that is to say, to calculate the cost of water resources according to the approved water intake. After the change of water resources fee to tax, the system adopts “ad valorem collection” standard, which undoubtedly puts stricter tax burden for high water-consuming enterprises. Thirdly, the implementing agency and policy enforcement has changed. By replacing the water resource fee levied by the administrative authorities with a water resource tax collected by tax authorities at all levels, the government has strengthened its ability to regulate the use of water by enterprises through a strong tax reform and has become more effective in the allocation of water resources. During the “water resource fee” period, the collection, management and supervision of fees respectively belong to three different departments, namely, the water resources department, the Ministry of Finance and the price department. Therefore, it is difficult to coordinate the interests and relationships among the three departments, thus lurking room for rent-seeking. By contrast, water resources tax is collected by the tax authorities and paid to the State Treasury. The taxation process and mechanism are thus more compulsory, standardized and complete. Finally, the incentive effect of taxation has been enhanced. The new pilot scheme summarizes the experience of Hebei Province so that it is more scientific and reasonable. The most innovative part in the scheme is the provision of six situations where no water resource tax is payable. The new scheme also expands the three cases of water resource tax reduction to six, which better motivates enterprises to use water.
Currently, the water resources tax reform has achieved significant governance results. As of 2020, Hebei Province, the first pilot area of water resources tax reform, has collected an average of up to RMB 2 billion annually. Meanwhile, the cumulative amount of groundwater overdraft has been reduced by 4.35 billion cubic meters, and the groundwater level in the deep and shallow layers of the overdraft area has risen by an average of 1.19 m and 0.24 m respectively year-on-year.
According to legitimacy theory, the development of a business must meet the requirements of local regulations, social values, and public habits. If an enterprise meets the legitimacy requirements, then it will get more resource support, such as government subsidies, bank loans, etc. Otherwise, it will lose the opportunity to grow and may face huge fines or even shutdown. In recent years, as environmental protection has become more and more important to the government and the public, the environmental legitimacy of a company has become a vital consideration for stakeholders to measure the value and competitiveness of the company (Suchman MC, 1995; Mahadeo J D, 2011) (Suchman, 1995; Mahadeo et al., 2011). Numerous studies have shown that enterprises under the pressure of environmental protection will improve their environmental performance through green innovation in an effort to meet the constraints of environmental legitimacy (Ren S et al., 2022; Ren S et al., 2022) (Ren et al., 2022a; Ren et al., 2022b). The Porter Hypothesis suggests that the relationship between environmental protection and economic development cannot be simply dichotomized. Strict and flexible environmental regulations can facilitate innovative activities and increase productivity. Furthermore, increased efficiency can offset the costs incurred by environmental protection so as to enhance the core competitiveness of firms in the marketplace (Porter et al., 1995) (Porter and Linde, 1995). In the short term, innovation may intensify cost pressures, but in the long term, it can contribute to the sustainability and quality of enterprise development. Apart from that, the Porter Hypothesis also affirms the role of government in coordinating economic growth with environmental policies. Generally speaking, it is difficult for enterprises to get sufficient information about innovative technologies. By contrast, governments have a natural advantage in pooling relevant information so that they can provide necessary technical and information support for firms to innovate (Jiao H et al., 2015; Song F and Zhao C, 2022) (Jiao et al., 2015; Song and Zhao, 2022).
Water resource tax is a strict yet flexible form of environmental regulation. On the one hand, the water resource tax itself is more prescriptive and mandatory than the water resource fee. After combining the experience and methods of the pilot in Hebei province, the criteria for water resources tax are more scientific (He L and Chen K, 2021) (He and Chen, 2021). The strong tax reform strengthens the government’s ability to regulate water use by enterprises and allows for a more effective allocation of water resources. On the other hand, the reform of changing water resource fees to taxes contains a series of incentives. For example, there are various situations where no water resource tax is payable and where water resource tax can be reduced. These incentives can further encourage companies to take the initiative to save water, reflecting the flexible nature of water resource tax. Therefore, based on legitimacy theory and Porter’s Hypothesis, this paper argues that water resource tax can promote green innovation by enterprises and thus improve their environmental performance. The specific analysis is as follows:
Firstly, the water resource tax increases the cost of water for enterprises, which will greatly restrict the production and operation of high water-consuming enterprises. One of the objectives of implementing the water resource tax is to reduce the total amount of industrial water and to force the transformation and upgrading of high water-consuming enterprises. Driven by the pressure of survival and the pursuit of profit maximization, enterprises can thus achieve efficient transformation through green innovation (Cui R and Wang J, 2022) (Cui and Wang, 2022). Green innovation can improve the environmental performance of enterprises by innovating production technologies and eliminating excess capacity. More specifically, green innovation can help high water-consuming enterprises to achieve a reduction in total water consumption and increase water use efficiency, thereby reducing the cost pressures arising from water resource tax reform.
Secondly, water resource tax reform may create reputational costs for high water-consuming firms and have a deterrent effect on their water use behavior (Morales-Raya M et al., 2019; De Blas M D M, 2020) (Morales-Raya et al., 2019; De Miguel De Blas, 2021). Companies’ unreasonable water demand will be disclosed through announcements such as annual reports and ESG reports. And the green image of companies will also be influenced through mass media, sending an unfavorable message to investors (Hur W M et al., 2014; Li N et al., 2022; Park S R and Oh K S, 2022) (Hur et al., 2014; Li et al., 2022; Park and Oh, 2022). What’s worse, negative reputation can have a substantial impact on corporate risks, costs and returns (Weng P S and Chen W Y, 2017) (Weng and Chen, 2017). The existing literature finds that a firm’s environmental reputation affects its financing activities and leads to an increase in its costs and decrease in the scale of production (Nguyen N P and Adomako S, 2021; Wang W et al., 2022) (Nguyen and Adomako, 2021; Wang W. et al., 2022). Hence, environmental reputation can also force high water-consuming firms to promote green technology innovation and transform their mindset from “I have to save water” to “I need to save water” in order to maintain their social image (Quintana-García C et al., 2022; Zhong S, 2022) (Quintana-García et al., 2022; Zhong et al., 2022).
Thirdly, the water resource tax scheme also allows the tax authorities to reduce or exempt their tax payable to a certain extent, thus providing stronger incentives for companies to save water actively. For example, the water resources tax reform stipulates situations where no water resources tax is payable and situations where water resources tax is reduced or exempted. In addition, the water resources tax reform gives special tax treatment to specific sectors and regions. These measures provide a continuous economic incentive for companies to save water (Dahlmann F et al., 2017) (Dahlmann et al., 2017). High water-consuming enterprises can improve their water use efficiency and reduce their total water consumption through green innovation so as to enjoy constant tax benefits.
Based on the above discussions, the following hypotheses are formulated in this paper.
Hypothesis 1:. Water resource tax reform can improve the environmental performance of high water-consuming enterprises.In summary, water resource tax can stimulate green innovation and improve the environmental performance of high water-consuming enterprises from three aspects: tax pressure, fear of bad reputation and economic incentives.
The difference-in-differences (DID) model is widely used in the assessment of policy effects. It can estimate “clean” policy effects by constructing an experimental group and a control group and comparing the difference between them before and after the policy, which effectively reduces the endogeneity problem.
Taking Wing C et al.’s (2018) (Wing et al., 2018) research results as a reference, a fixed effects difference-in-differences model is constructed in this paper as follows:
Where the subscript i denotes an enterprise and t is the year.
The hypothesis put forward in this paper is that water resource tax reform can help improve environmental performance of high water-consuming firms. The author therefore focuses on the coefficient value and significance of the coefficient
Regarding the definition of environmental performance, there are generally two measures. One of them is that the existing literature often uses the environmental protection investment and green innovation of enterprises to measure the environmental performance of enterprises (Zhang Y et al., 2022; Liu L et al., 2022) (Liu L. et al., 2022; Zhang et al., 2022). However, this method mainly measures the input of enterprises in the environmental protection process, which does not truly reflect the actual environmental protection effect. Therefore, the method fails to accurately measure the environmental performance of enterprises. The other measure is to evaluate negative corporate environmental behavior. For example, emissions such as PM2.5 and SO2 are considered as important dimensions of corporate environmental performance (Wang E et al., 2022; Jin H et al., 2022) (Wang E. et al., 2022; Jin et al., 2022). What’s more, to count administrative cases of corporate environmental violations are a more stringent metric (Wang Z and Dear K, 2017; Xiong Y et al., 2021; MaR et al., 2022) (Wang and Dear, 2017; Xiong et al., 2021; Ma et al., 2022). However, measuring environmental performance through negative corporate environmental behavior has its limitations owing to the large variation in environmental information disclosure of listed companies as well as divergent characteristics of different industries and enterprises. In summary, the two methods above generally use a single indicator to measure environmental performance, which cannot take into account multiple dimensions of environmental performance.
In contrast, the third-party ESG rating is a more comprehensive indicator system, which can cover information on the environmental performance of companies in a more comprehensive manner and take into account both positive and negative events (Broadstock D C et al., 2021; Li J and Li S, 2022) (Broadstock et al., 2021; Li and Li, 2022). Compared to the CSI ESG and R&L Global ESG, the Bloomberg ESG publishes a breakdown of environmental performance to the public. In the evaluation system of Bloomberg ESG’s environmental performance, water use and wastewater discharge are very critical items to be examined. Therefore, this paper selects the environmental assessment score in Bloomberg ESG as a proxy indicators for corporate environmental performance.
This paper defines Time as a dummy variable for whether the water resource tax reform is implemented or not, where Time = 1 if the time is 2017 or later, otherwise Time = 0. In addition, this paper defines Treat as a dummy variable for the pilot areas of the water resource tax reform, where Treat = 1 if the enterprise is registered in one of the nine pilot areas, otherwise Treat = 0. The cross multiplier between the two is the water resource tax reform, i.e., Time x Treat.
With reference to previous research findings related to corporate environmental performance, the paper selects a series of control variables, mainly including corporate financial indicators, governance structure and regional economic factors. The variables are defined in Table 1.

TABLE 1. Definition of variables.
This paper selects high water-consuming enterprises listed in Shanghai and Shenzhen A-shares between 2012 and 2020 as the initial sample. With regard to the definition of high water-consuming industries, this paper refers to the Guidance on Water Efficiency in Key Industries and the 2012 edition of the China Securities Regulatory Commission’s Industry Classification and selects the following industries. Firstly, all A-class industries, which include A01 Agriculture, A02 Forestry, A03 Animal Husbandry, A04 Fisheries and A05 Agriculture, Forestry, Livestock and Fisheries Services. Secondly, some C industries, which incorporate C13 Agriculture and Food Processing Industry, C14 Food Manufacturing Industry, C15 Wine, Beverage and Refined Tea Manufacturing Industry, C18 Textile, Clothing and Apparel Industry, C22 Paper and Paper Products Industry, C23 Printing and Recording Media Reproduction Industry, C25 Petroleum Processing, Coking and Nuclear Fuel Processing Industry, C26 Chemical Raw Materials and Chemical Products Manufacturing Industry, C30 Non-metallic Mineral Products Industry, C31 Ferrous Metal Smelting and Rolling Processing Industry, C32 Non-Ferrous Metal Smelting and Rolling Processing Industry, C33 Fabricated Metal Products Industry. Finally, D44 Electricity, heat production and supply industry in the D category of industries are also involved in the sample. However, it is worth noting that since Hebei Province started the pilot in 2016, all companies belonging to Hebei Province were thus excluded from the sample.
Based on what is outlined, this paper does the following screening work on the initial sample. At first, exclude samples that are ST and ST* in the current year. Second, remove samples that have been listed for 1 year or less. Third, weed out samples with gearing ratios greater than 100%. At last, samples with no Bloomberg ESG rating were deleted. After screening, 348 sample companies with 2547 observations were finally obtained in this paper. Each continuous variable was winsorized by 1% and 99%.
The corporate financial data in this paper are obtained from CSMAR and Wind databases. Data for each province in Mainland China were obtained by collating through the China Statistical Yearbook. This paper uses STATA 16.0 for data processing.
As shown in Table 2, this paper presents preliminary descriptive statistics for the variables. It can be found that the mean value of Environment is 10.725, the minimum value is 0 and the maximum value is 44.186, which indicates that the average level of environmental performance of high water-consuming enterprises in China is low. At the same time, the standard deviation of Environment is 8.337, which suggests a large dispersion between samples and a large variation in the level of environmental performance between enterprises. Descriptive statistics for the other variables are shown in the table.
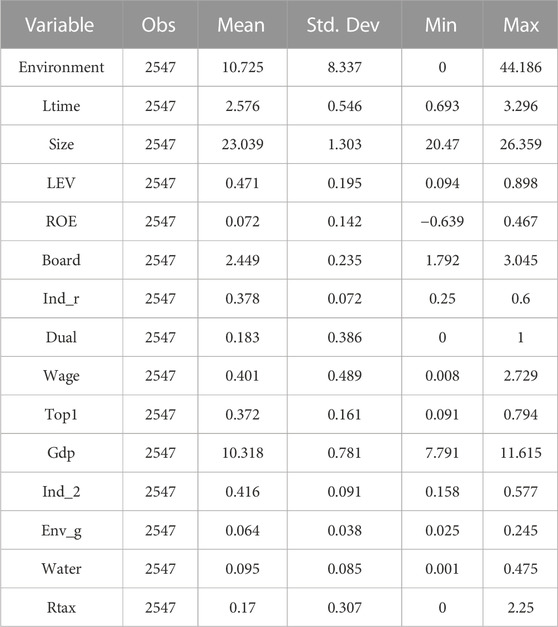
TABLE 2. Descriptive statistics.
As shown in Table 3, to test hypothesis 1, OLS regressions and FE regressions were conducted in this paper respectively. Columns (1) and (3) show that DID has a significant positive effect on Environment, thus indicating that water resource tax reform can significantly promote the environmental performance of high water-consuming enterprises. Columns (2) and (4) show that DID still has a significant positive effect on Environment after the inclusion of control variables. Therefore, hypothesis 1 is confirmed. Enterprises which are required to pay water resource tax improve their environmental performance by approximately 2 on average.
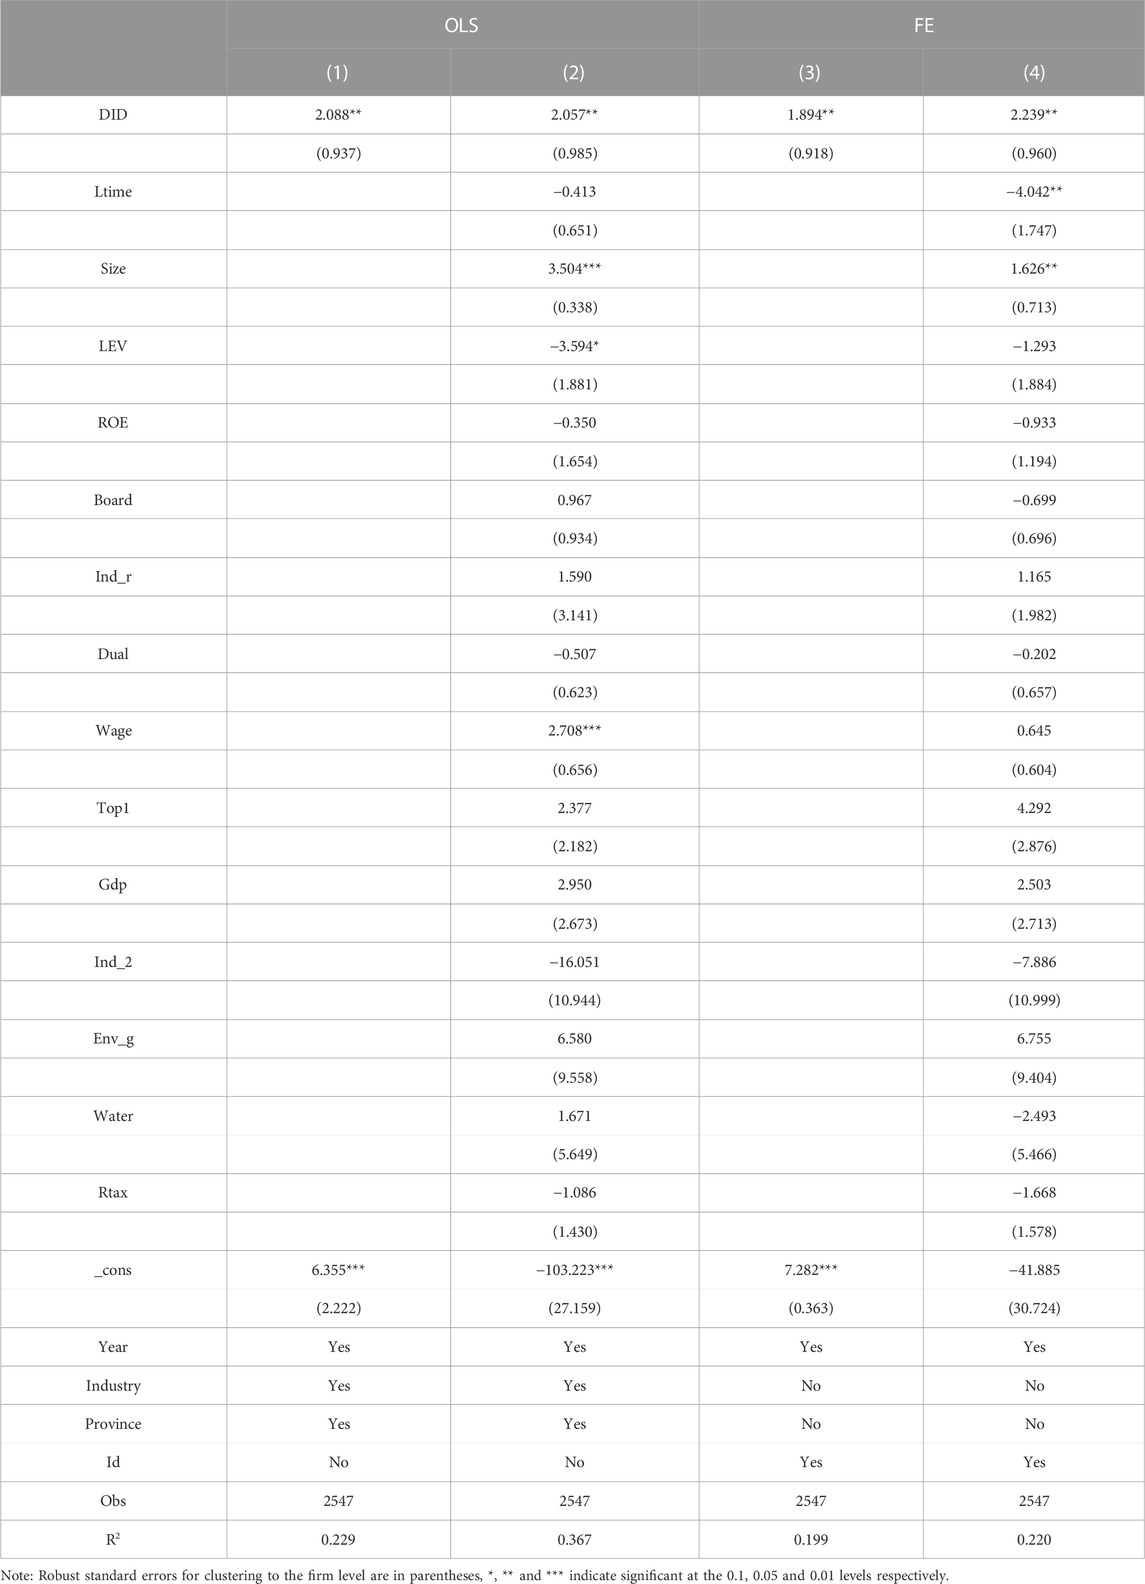
TABLE 3. Baseline regression.
According to the Porter hypothesis of legitimacy theory, the above results suggest the positive governance effect of water resource tax. On the one hand, with the increase of water resource tax, firms are constrained by external stakeholders on environmental legitimacy, so they have to improve their environmental performance. On the other hand, the increase in the cost of water use motivates firms to develop green innovation, thus generating the so-called “innovation compensation effect” that can significantly improves corporate environmental performance and core competitiveness.
The difference-in-differences model (DID) is based on the premise that the experimental and control groups satisfy the parallel trend hypothesis, i.e., there should be no significant difference between the two before the reform is implemented. Drawing on the ideas of the event study approach and referring to the results of Louis S et al. (1993) (Jacobson et al., 1993), this paper conducts a dynamic effects test and constructs the following model.
Referring to the results of Nunn N and Qian N (2011) (Nunn and Qian, 2011), this paper uses the first year of the sample (2012) as the base year. Figure 1 shows the dynamic effects of
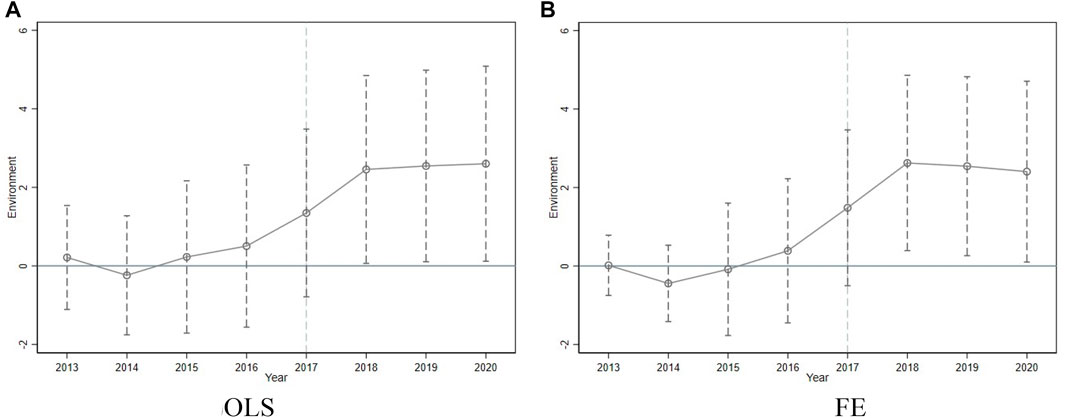
FIGURE 1. Dynamic effects test. (A) OLS (B) FE.
A common endogenous problem exists in experimental research, which is called the “placebo effect”. The placebo effect means that subjects’ responses and changes do not come from experimental shocks, but rather from a psychological effect. The same is true for policy effects, where changes in pilot areas may be caused by other unobservable factors.
According to the results of Xiqian Cai et al. (2016) (Cai et al., 2016), a placebo test is therefore conducted in this paper in order to further exclude the interference of unobservable variables on hypothesis 1. Specifically, nine provinces were randomly selected as the experimental group and assumed to have implemented the water resource tax reform, while other regions were used as the control group to observe the changes in regression coefficients and confidence intervals. For this purpose, 500 random sampling and baseline regressions were conducted in this paper.
Figure 2 plots the effect of the placebo test, a for the OLS model and b for the FE model. Several findings can be concluded according to the figure. Firstly, most of the regression results for the 500 random samples are around the value of 0 and do not reach the 95% level of significance. Secondly, the regression results of 2.057 and 2.239 for each of the 13 provinces according to the water resource tax (see Table 3, columns 2 and 4) are significantly different from the vast majority of the sampling results. Therefore, the regression results in this paper are largely unaffected by the unobservable variables.

FIGURE 2. Placebo test. (A) OLS (B) FE.
In experimental studies, in order to reduce the interference of endogeneity problems, it is common practice to ensure the same basic conditions of the experimental and control groups. However, it is difficult to guarantee the same condition in quasi-experimental studies, especially in policy studies. The selection of the experimental group is not completely random as reform formulation may be influenced by certain regional factors. And this calls for screening and matching the samples of the experimental and control groups to ensure that there is no significant difference between the two.
In this paper, we refer to the research findings of James J et al. (1997) (Heckman et al., 1997) and re-match the experimental group with the control group through the PSM method. Our findings are as follows. Firstly, as shown in Table 4, the macro-regional factors such as Gdp, Env_g, Ind_2, Water and Rtax were found to have significant effects on Treat through logit regression tests. Secondly, The above variables were selected for 1:1 nearest-neighbor matching of the original sample by calculating propensity scores. Finally, the samples that were not matched were excluded and regression tests were conducted on the new samples.
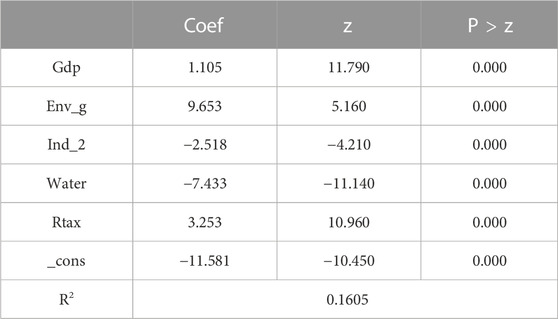
TABLE 4. Logit regression.
As shown in column (1) of Table 5, 1106 observations were matched by the PSM approach. The regression results show that the study findings remain robust after eliminating the factors that may influence reform formulation above.
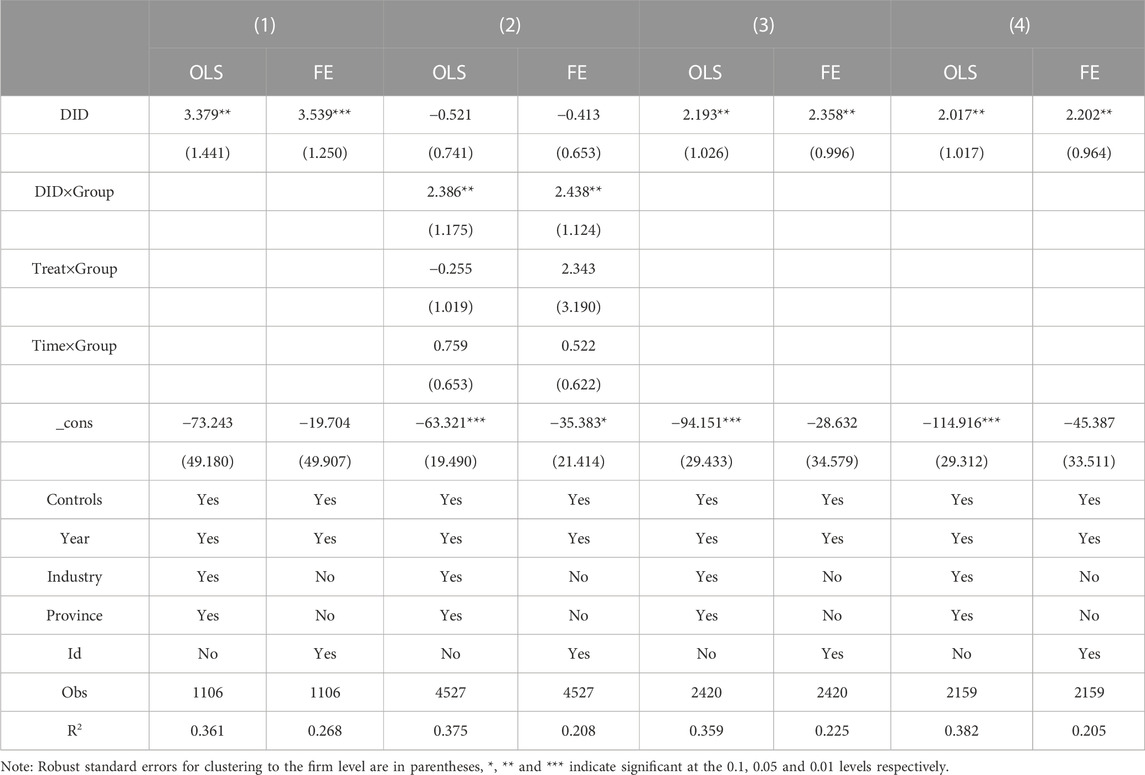
TABLE 5. Robustness tests.
Although the difference-in-differences model can effectively reduce the “noise” of the study by setting up an experimental group and a control group, it cannot completely eliminate the interference of similar policies. The water-intensive industries defined in this paper are distributed among the agriculture, forestry, livestock and fishing industries in category A, the manufacturing industries in category C and the electricity, heat, gas and water production and supply industries in category D. Therefore, the above tests cannot completely exclude the interference of industrial policies either. To address the issue, this paper uses a difference-in-difference-in-difference, (DDD) model for testing.
According to the 2012 edition of the Industry Classification of the China Securities Regulatory Commission, this paper defines the service industry as including all industries other than A agriculture, forestry, animal husbandry and fishery, B mining, C manufacturing, D electricity, heat, gas and water production and supply, E construction, J finance and K real estate. In this paper, the service sector is chosen as an additional control group for the difference-in-difference-in-difference model test. This is because the service sector, with its relatively low water consumption, is less likely to be affected by the water resource tax but by other industrial policies. In this context, the difference between the second experimental pair and the control group arises from the impact of other policies. The net effect of the water resource tax is obtained by subtracting the difference between the first experimental pair and the control group (which includes the difference between the water resource tax and other policies) from the difference between the second experimental pair and the control group. Therefore, a difference-in-difference-in-difference model is constructed in this paper as shown below.
In this model, Group functions as a dummy variable and it equailzes 1 when the firm is in a high water-consuming industry and 0 otherwise. As shown in column 2 of Table 5, under this condition the DID that includes the effect of other environmental regimes is not significantly positively correlated with Environment, while the DID x Group with only the net effect of water resource tax reform is significantly positively correlated with Environment. Therefore, the study findings remain robust.
The selection of the study sample may have an impact on the regression results. In this section, the Class A industries in the sample are removed and the regression tests are conducted again. On the one hand, most of the water resources in Class A agriculture, forestry, livestock and fisheries are recyclable and therefore the water resource tax may not have a significant impact on their production. On the other hand, the production patterns of agriculture, forestry, livestock and fisheries differ significantly from those of category C manufacturing and category D electricity, heat, gas and water production and supply, and the regression results may include the effects of industrial policy. As shown in column 3 of Table 5, after excluding the Class A industry sample, DID is significantly and positively correlated with Environment and the study findings remain robust.
In general, policy formulation is not determined by a single individual’s decision. However, the problem of reverse causation is commonly found in empirical studies. Hence, to further address the issue of endogeneity, this section lags the DID and all control variables by one period and performs the regression test again. The model for the lagged effect is presented below.
As shown in column 4 of Table 5, DID is significantly positively correlated with Environment after one period of lagging, and the findings remain robust.
This paper argues that water resource tax improves the environmental performance of high water-consuming enterprises mainly by promoting green innovation. In China, there are three main types of patents protected by the Patent Law: design patents, utility model patents and invention patents. In the area of green innovation, the only patents are green utility model patents and green invention patents. In the early days, China began to recognize utility model patents in 1984 in order to encourage higher levels of innovation among enterprises. Compared to invention patents, utility model patents embodies the following three features: 1) the research and development cycle is short; 2) the technology level is low; 3) the approval of patent rights is simplified. This accounts for the phenomenon that for a long time Chinese enterprises used utility model patents as the main form of R&D innovation. However, with the increasing support for corporate innovation, utility model patents are becoming more and more of a strategic innovation. Although utility model patents cannot directly and significantly improve the core competitiveness of enterprises, they can still benefit enterprises by providing more R&D subsidies, tax incentives and other green channels.
In China, many environmental policies have only promoted green utility model patents by enterprises and made no difference in “increasing the quantity and improving the quality” (Zhang Y, 2022) (Zhang et al., 2022). For one thing, this is due to the information asymmetry between the government and enterprises in terms of green innovation. For another, the lack of resources for innovation discourages firms from making riskier inventions and innovations. Compared to other environmental regulations, water resource taxes are more concerned with actual reform effects, i.e., water savings and wastewater use. To some extent, the water savings help alleviate the information asymmetry created by patents, and can also provide a more reasonable and realistic evaluation criteria for water resource tax incentives. Compared to green utility model patents, green invention patents can fundamentally optimize the total water consumption and water use structure of enterprises. Therefore, the water resource tax plays an important role in stimulating water-consuming enterprises to make constant effort in developing green invention patents.
As the patent data is a count variable, the green patents are processed by adding one to the natural logarithm. As shown in Table 6 Panel A, both OLS, FE, and DID have a significant positive effect on green invention patents, but not on green utility patents, which indicates that the water resource tax reform only promotes firms to conduct research and development on green invention patents. Then, green invention patents were added to the baseline regression model as a control variable. It can be found that patents on inventions have a significant positive effect on environmental performance. At the same time, the coefficient of DID is lower in value and significance compared to the benchmark regression. Hence, green invention patents play a mechanistic role in the reform effect.
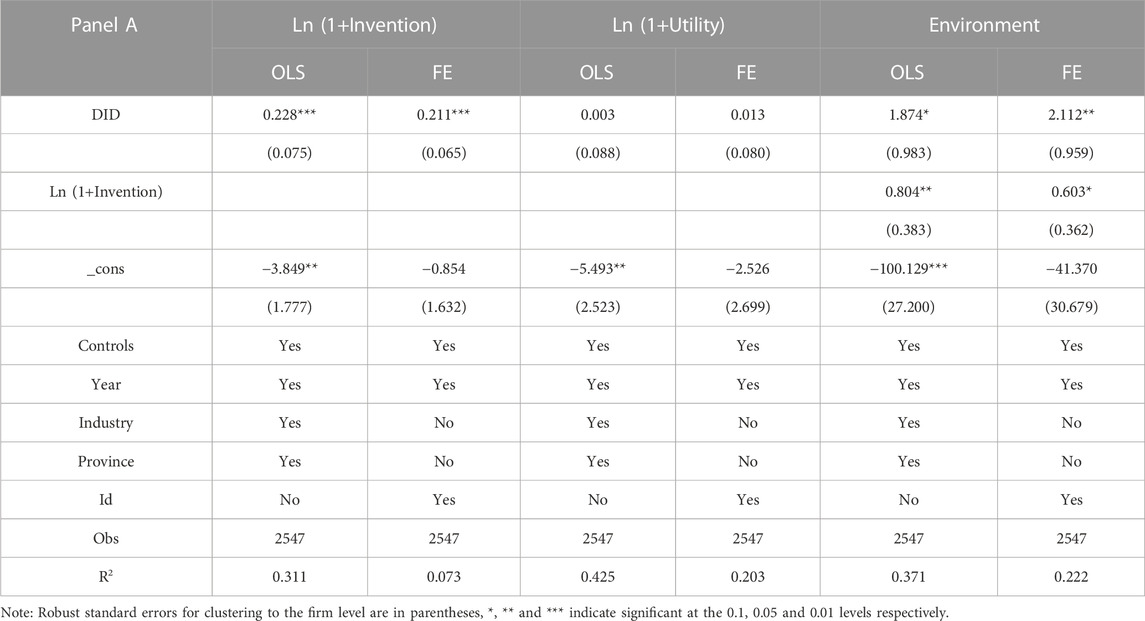
TABLE 6. Mechanism test.
As patent data is a count variable, there is a “law of rare events”. In order to ensure the robustness of the mechanism test, this section replaces the regression model with a negative binomial regression model. As shown in Panel B of Table 7, the effect of DID on green invention patents is significantly positive in both the OLS and FE models, while the effect of green utility patents is even negative.
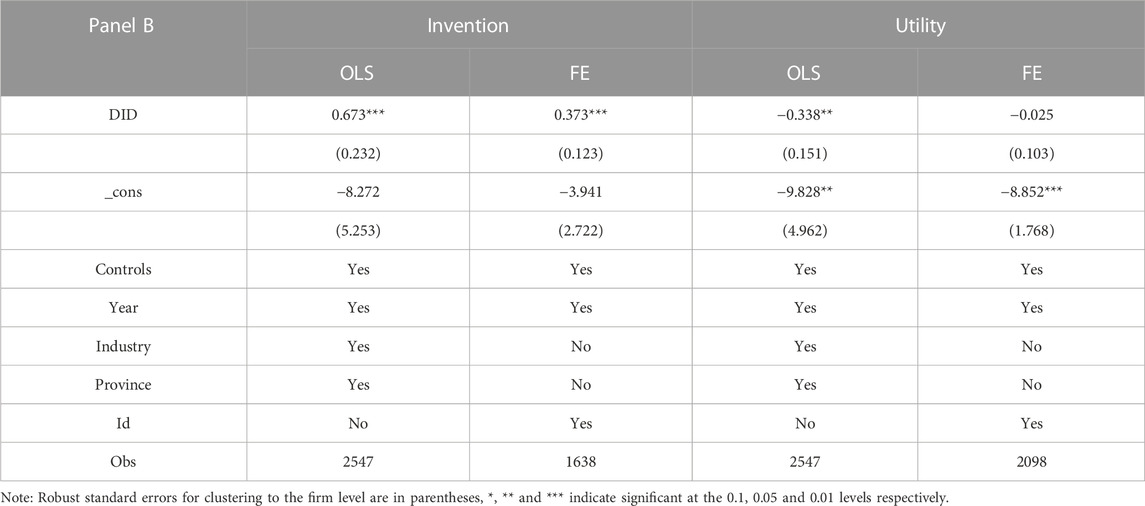
TABLE 7. Mechanism tests.
According to the legitimacy theory Porter hypothesis, the above results give us two implications. On the one hand, with the increase of water tax, firms try to generate new competitiveness by patenting green inventions so as to reduce cost expenditure and improve resource efficiency. On the other hand, through green invention patents companies are able to establish a green image for their companies, thus gaining resource support from stakeholders.
This paper argues that the response of local enterprises to water resource tax reform is more pronounced in areas where water resources are scarce. From the government’s perspective, reform implementation is stronger in areas where water resources are scarce, so the reform are likely to be more effective. From the enterprise’s perspective, enterprises in water-scarce area face more restrictions and higher cost on water use.
In this paper, the water resource endowment of an area is measured by the total water resources of a province in the corresponding year. The median of the water resources is used as the criterion, and provinces with water resources above the median are considered as water-rich areas and below as water-scarce areas. The results of the grouped regressions are reported in Table 8. In both of the OLS and FE models, the DID is significantly positive in the water scarce sample. However, in water-rich areas the correlation is negative, albeit insignificant. This suggests that firms in water-scarce areas improve their environmental performance more significantly with the same water resource tax.

TABLE 8. Water endowment.
The above results show that although the water resource tax has produced a broad governance effect, such effect still varies significantly from different regions. This paper asserts that only by setting differential and reasonable tax rates in different regions of different water resources conditons can we better implement the policy.
Based on Schumpeterian innovation theory, innovation is the process of regrouping the internal and external resources of a firm, which makes it a high risky practice. Compared to general innovation, green innovation involves higher investment and greater risk. Based on this, the paper argues that large-scale firms are more responsive to water resource tax reform. Firstly, large-scale enterprises have access to more external resources, such as local governments and banks, to support them. Secondly, large-scale enterprises have more fixed assets, equipment and more cash flow, so they are more resilient to risks. Finally, large-scale enterprises have more experience in innovation. However, smaller firms are just the reverse. For them, the resources for innovation are insufficient and the risk of failure may be unaffordable.
In this paper, the total assets of enterprises in each year are used to measure the size of enterprises, and the median is used as the standard, and enterprises above the median are used as a sample of large-scale enterprises. Otherwise, firms will be the sample of small-scale firms. The results of the grouped regressions are reported in Table 9. Both the OLS and FE models have a significantly positive DID in the larger sample. However, it is negatively, albeit insignificantly, correlated in the smaller sample. This suggests that, under the same water resource taxation system, larger firms are found to improve their environmental performance more significantly.
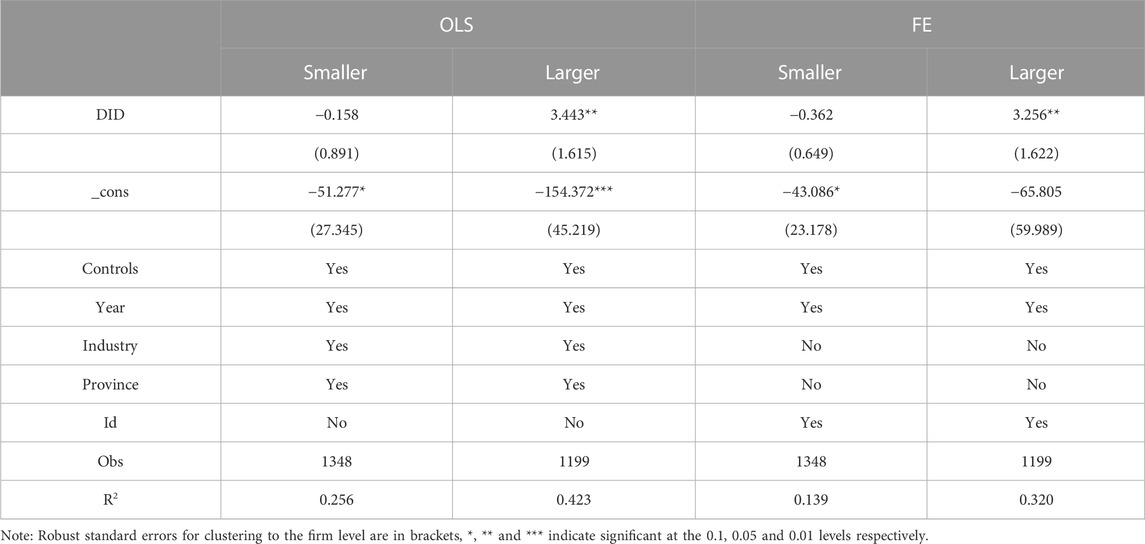
TABLE 9. Firm size.
The above results suggest that the impact of water resource taxes on enterprises of different sizes varies. This paper argues that water resources tax should not only make enterprises feel a sense of urgency in conserving water, but also leave room for their green transformation and provide strong support for their green innovation.
Bloomberg ESG’s assessment of the performance of environmental protection, social responsibility and corporate governance all support the paper in conducting additional analyses, namely, whether the water resource tax generates both social and corporate governance performance. Table 10 reports the regression results of the additional analysis, and there is no significant impact of water resource tax on social performance and corporate governance performance in either the OLS or FE models. Therefore, there are no reform spillovers from the water resource tax.
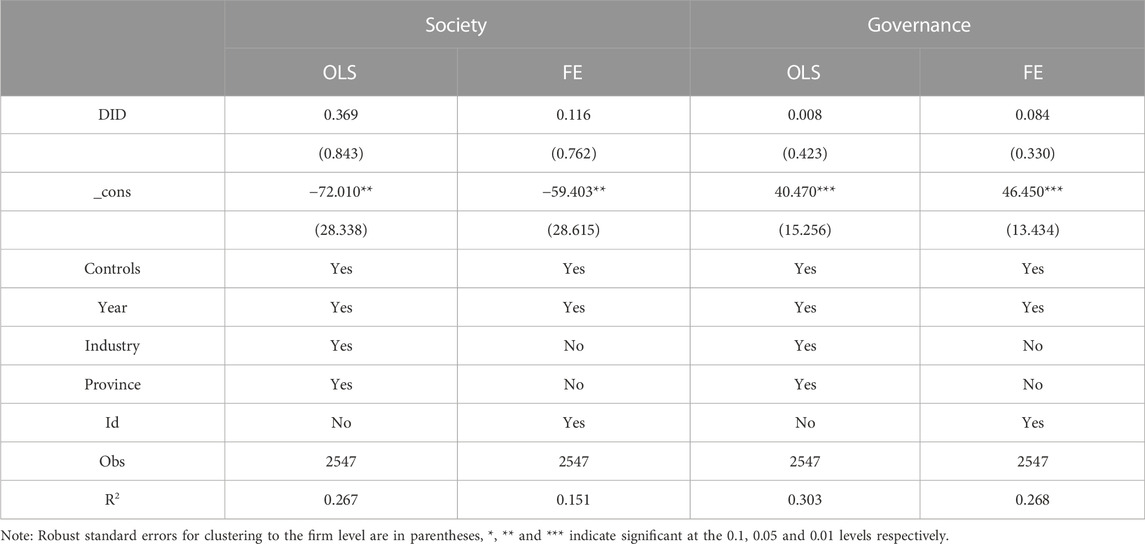
TABLE 10. Additional analysis.
This paper uses the 2017 water resource tax reform in China as a quasi-natural experiment and identifies its impact on the environmental performance of high water-consuming firms using the difference-in-differences model (DID).
First, this paper finds that water resource tax can promote enterprises to improve their environmental performance. Research results suggest that pilot regions should persist in implementing the water resource tax reform in depth, enforce the law strictly, and improve the efficiency of water resources utilization. At the same time, the Chinese government should summarize the successful experience of the pilot regions and expand the reform to all regions as soon as possible with an effort to solve the problem of water scarcity.
Second, this paper finds that water resource tax can improve environmental performance by encouraging enterprises to develop patent green inventions. Research suggests that local governments should fully integrate green financial policies to provide financial support for enterprise innovation, and motivate enterprises to make more green innovations of higher quality. Meanwhile, the local government should cultivate more innovation talents and build innovation platforms pooling more innovation resources for enterprise innovation.
Third, this paper finds that the policy effects of water resources tax vary in different regions and different enterprises. Study suggests that different tax rates should be implemented according to the water resources endowments in different regions. For regions with less water resources, local governments should implement higher tax rates to achieve better governance effects. Apart from that, the government can also provide different support to enterprises of different sizes and take the initiative to help small enterprises to make green transformation.
At last, this paper finds that the water tax does not have an impact on the social responsibility performance and corporate governance of enterprises. Study suggests that the government could take more social responsibility through water tax reform, for example, by donating to water-scarce regions. What’s more, corporate governance could be facilitated by establishing a dedicated water resources management department.
This paper may have limitations in several areas. Firstly, the paper finds that green innovation plays a mechanistic role, but other mechanisms are not explored and further research is needed. Secondly, the heterogeneity analysis in this paper only analyzes the characteristics at the regional and corporate level, whereas the industry characteristics and executive traits are also worth studying.
The original contributions presented in the study are included in the article/supplementary files, further inquiries can be directed to the corresponding author.
The author confirms being the sole contributor of this work and has approved it for publication.
Thanks to the reviewers for their suggestions for this research.
The author declares that the research was conducted in the absence of any commercial or financial relationships that could be construed as a potential conflict of interest.
All claims expressed in this article are solely those of the authors and do not necessarily represent those of their affiliated organizations, or those of the publisher, the editors and the reviewers. Any product that may be evaluated in this article, or claim that may be made by its manufacturer, is not guaranteed or endorsed by the publisher.
Broadstock, D. C., Chan, K., Cheng, L. T., and Wang, X. (2021). The role of ESG performance during times of financial crisis: Evidence from COVID-19 in China. Finance Res. Lett. 38, 101716. doi:10.1016/j.frl.2020.101716
Cai, X., Lu, Y., Wu, M., and Yu, L. (2016). Does environmental regulation drive away inbound foreign direct investment? Evidence from a quasi-natural experiment in China. J. Dev. Econ. 123, 73–85. doi:10.1016/j.jdeveco.2016.08.003
Chen, W., Wang, F., Xiao, G., Wu, K., and Zhang, S. (2015). Air quality of Beijing and impacts of the new ambient air quality standard. Atmosphere 6 (8), 1243–1258. doi:10.3390/atmos6081243
Chen, Z. R., Yuan, Y., and Xiao, X. (2021). Analysis of the fee-to-tax reform on water resources in China. Front. Energy Res. 9, 752592. doi:10.3389/fenrg.2021.752592
Cui, R., and Wang, J. (2022). Shaping sustainable development: External environmental pressure, exploratory green learning, and radical green innovation. Corp. Soc. Responsib. Environ. Manag. 29 (3), 481–495. doi:10.1002/csr.2213
Dahlmann, F., Branicki, L., and Brammer, S. (2017). ‘Carrots for corporate sustainability’: Impacts of incentive inclusiveness and variety on environmental performance. Bus. Strategy Environ. 26 (8), 1110–1131. doi:10.1002/bse.1971
De Miguel De Blas, M. (2021). Impact of environmental performance and policy on firm environmental reputation. Manag. Decis. 59 (2), 190–204. doi:10.1108/md-09-2019-1223
He, L., and Chen, K. (2021). Can China’s “tax-for-fee” reform improve water performance–evidence from Hebei province. Sustainability 13 (24), 13854. doi:10.3390/su132413854
Heckman, J. J., Ichimura, H., and Todd, P. E. (1997). Matching as an econometric evaluation estimator: Evidence from evaluating a job training programme. Rev. Econ. Stud. 64 (4), 605–654. doi:10.2307/2971733
Hu, Y., Ren, S., Wang, Y., and Chen, X. (2020). Can carbon emission trading scheme achieve energy conservation and emission reduction? Evidence from the industrial sector in China. Energy Econ. 85, 104590. doi:10.1016/j.eneco.2019.104590
Hur, W. M., Kim, H., and Woo, J. (2014). How CSR leads to corporate brand equity: Mediating mechanisms of corporate brand credibility and reputation. J. Bus. Ethics 125, 75–86. doi:10.1007/s10551-013-1910-0
Jacobson, L. S., LaLonde, R. J., and Sullivan, D. G. (1993). Earnings losses of displaced workers. Am. Econ. Rev. 83 (4), 685–709.
Jiang, X., Hong, C., Zheng, Y., Zheng, B., Guan, D., Gouldson, A., et al. (2015). To what extent can China’s near-term air pollution control policy protect air quality and human health? A case study of the pearl river delta region. Environ. Res. Lett. 10 (10), 104006. doi:10.1088/1748-9326/10/10/104006
Jiao, H., Koo, C. K., and Cui, Y. (2015). Legal environment, government effectiveness and firms' innovation in China: Examining the moderating influence of government ownership. Technol. Forecast. Soc. Change 96, 15–24. doi:10.1016/j.techfore.2015.01.008
Jin, H., Chen, X., Zhong, R., and Liu, M. (2022). Influence and prediction of PM2. 5 through multiple environmental variables in China. Sci. Total Environ. 849, 157910. doi:10.1016/j.scitotenv.2022.157910
Li, J., and Li, S. (2022). Environmental protection tax, corporate ESG performance, and green technological innovation. Front. Environ. Sci. 1512. doi:10.3389/fenvs.2022.982132
Li, N., Wang, X., Wang, Z., and Luan, X. (2022). The impact of digital transformation on corporate total factor productivity. Front. Psychol. 13, 1071986. doi:10.3389/fpsyg.2022.1071986
Li, T., Ma, J., and Mo, B. (2021). Does environmental policy affect green total factor productivity? Quasi-Natural experiment based on China’s air pollution control and prevention action plan[J]. Int. J. Environ. Res. Public Health 18 (15), 8216. doi:10.3390/ijerph18158216
Liu, J. Y., Woodward, R. T., and Zhang, Y. J. (2021). Has carbon emissions trading reduced PM2. 5 in China? Environ. Sci. Technol. 55 (10), 6631–6643. doi:10.1021/acs.est.1c00248
Liu, L., Ren, G., He, B., and Zheng, M. (2022b). Environmental regulation, environmental decentralization, and enterprise environmental protection investment: Evidence from China. Front. Public Health 10, 821488. doi:10.3389/fpubh.2022.821488
Liu, Y., Failler, P., and Liu, Z. (2022a). Impact of environmental regulations on energy efficiency: A case study of China’s air pollution prevention and control action plan. Sustainability 14 (6), 3168. doi:10.3390/su14063168
Liu, Y., Ma, C., and Huang, Z. (2023). Can the digital economy improve green total factor productivity? An empirical study based on Chinese urban data. Math. Biosci. Eng. 20 (4), 6866–6893. doi:10.3934/mbe.2023296
Long, X., Chen, Y., Du, J., Oh, K., and Han, I. (2017). Environmental innovation and its impact on economic and environmental performance: Evidence from Korean-owned firms in China. Energy Policy 107, 131–137. doi:10.1016/j.enpol.2017.04.044
Ma, R., Ji, Q., Zhai, P., and Yang, R. (2022). Environmental violations, refinancing risk, and the corporate bond cost in China. J. Int. Financial Manag. Account. 33 (3), 480–504. doi:10.1111/jifm.12154
Mahadeo, J. D., Oogarah-Hanuman, V., and Soobaroyen, T. (2011). Changes in social and environmental reporting practices in an emerging economy (2004–2007): Exploring the relevance of stakeholder and legitimacy theories. Account. Forum 35 (3), 158–175. doi:10.1016/j.accfor.2011.06.005, No.
Morales-Raya, M., Martín-Tapia, I., and Ortiz-de-Mandojana, N. (2019). To be or to seem: The role of environmental practices in corporate environmental reputation. Organ. Environ. 32 (3), 309–330. doi:10.1177/1086026617753154
Nguyen, N. P., and Adomako, S. (2021). Environmental proactivity, competitive strategy, and market performance: The mediating role of environmental reputation. Bus. Strategy Environ. 30 (4), 2008–2020. doi:10.1002/bse.2729
Nunn, N., and Qian, N. (2011). The potato's contribution to population and urbanization: Evidence from a historical experiment. Q. J. Econ. 126 (2), 593–650. doi:10.1093/qje/qjr009
Ouyang, R., Mu, E., Yu, Y., Chen, Y., Hu, J., Tong, H., et al. (2022). Assessing the effectiveness and function of the water resources tax policy pilot in China. Environ. Dev. Sustain., 1–17. doi:10.1007/s10668-022-02667-y
Park, S. R., and Oh, K. S. (2022). Integration of ESG information into individual investors’ corporate investment decisions: Utilizing the UTAUT framework. Front. Psychol. 13, 899480. doi:10.3389/fpsyg.2022.899480
Porter, M. E., and Linde, C. V. D. (1995). Toward a new conception of the environment-competitiveness relationship. J. Econ. Perspect. 9 (4), 97–118. doi:10.1257/jep.9.4.97
Quintana-García, C., Marchante-Lara, M., and Benavides-Chicón, C. G. (2022). Towards sustainable development: Environmental innovation, cleaner production performance, and reputation. Corp. Soc. Responsib. Environ. Manag. 29 (5), 1330–1340. doi:10.1002/csr.2272
Ren, S., He, D., Yan, J., Zeng, H., and Tan, J. (2022a). Environmental labeling certification and corporate environmental innovation: The moderating role of corporate ownership and local government intervention. J. Bus. Res. 140, 556–571. doi:10.1016/j.jbusres.2021.11.023
Ren, S., Huang, M., Liu, D., and Yan, J. (2022b). Understanding the impact of mandatory CSR disclosure on green innovation: Evidence from Chinese listed firms. Br. J. Manag. 34, 576–594. doi:10.1111/1467-8551.12609
Song, F., and Zhao, C. (2022). Why do Chinese enterprises make imitative innovation?—an empirical explanation based on government subsidies. Front. Psychol. 13, 802703. doi:10.3389/fpsyg.2022.802703
Suchman, M. C. (1995). Managing legitimacy: Strategic and institutional approaches. Acad. Manag. Rev. 20 (3), 571–610. doi:10.2307/258788
Tian, G. L., Wu, Z., and Hu, Y. C. (2021). Calculation of optimal tax rate of water resources and analysis of social welfare based on CGE model: A case study in Hebei province, China. Water Policy 23 (1), 96–113. doi:10.2166/wp.2020.118
Wang, E., Su, B., Zhong, S., and Guo, Q. (2022b). China's embodied SO2 emissions and aggregate embodied SO2 intensities in interprovincial and international trade. Technol. Forecast. Soc. Change 177, 121546. doi:10.1016/j.techfore.2022.121546
Wang, W., Yu, Y., and Li, X. (2022a). ESG performance, auditing quality, and investment efficiency: Empirical evidence from China. Front. Psychol. 13, 948674. doi:10.3389/fpsyg.2022.948674
Wang, Z., and Dear, K. (2017). Region and firm level determinants of environmental regulation violations: An empirical study in Chongqing, China. J. Clean. Prod. 141, 1011–1022. doi:10.1016/j.jclepro.2016.09.090
Weng, P. S., and Chen, W. Y. (2017). Doing good or choosing well? Corporate reputation, CEO reputation, and corporate financial performance. North Am. J. Econ. Finance 39, 223–240. doi:10.1016/j.najef.2016.10.008
Wing, C., Simon, K., and Bello-Gomez, R. A. (2018). Designing difference in difference studies: Best practices for public health policy research. Annu. Rev. public health 39, 453–469. doi:10.1146/annurev-publhealth-040617-013507
Xiong, Y., Lam, H. K., Hu, Q., Yee, R. W., and Blome, C. (2021). The financial impacts of environmental violations on supply chains: Evidence from an emerging market. Transp. Res. Part E Logist. Transp. Rev. 151, 102345. doi:10.1016/j.tre.2021.102345
Xu, Q. (2020). Water resource tax reform to build resource-saving society. J. Coast. Res. 115 (SI), 506–509. doi:10.2112/jcr-si115-139.1
Zhang, Y., Li, X., and Xing, C. (2022). How does China's green credit policy affect the green innovation of high polluting enterprises? The perspective of radical and incremental innovations. J. Clean. Prod. 336, 130387. doi:10.1016/j.jclepro.2022.130387
Keywords: water resource tax, environmental performance, high water-consuming enterprises, difference-in-differences model, green innovation
Citation: Liu C (2023) Can water resource tax reform improve the environmental performance of enterprises? evidence from China’s high water-consuming enterprises. Front. Environ. Sci. 11:1155237. doi: 10.3389/fenvs.2023.1155237
Received: 02 February 2023; Accepted: 05 July 2023;
Published: 14 July 2023.
Edited by:
Shi Yin, Hebei Agricultural University, ChinaReviewed by:
Xin Long Xu, Hunan Normal University, ChinaCopyright © 2023 Liu. This is an open-access article distributed under the terms of the Creative Commons Attribution License (CC BY). The use, distribution or reproduction in other forums is permitted, provided the original author(s) and the copyright owner(s) are credited and that the original publication in this journal is cited, in accordance with accepted academic practice. No use, distribution or reproduction is permitted which does not comply with these terms.
*Correspondence: Chenyu Liu, Ym14aWFveGlhbzIwMjNfQG1haWwuc2N1dC5lZHUuY24=
Disclaimer: All claims expressed in this article are solely those of the authors and do not necessarily represent those of their affiliated organizations, or those of the publisher, the editors and the reviewers. Any product that may be evaluated in this article or claim that may be made by its manufacturer is not guaranteed or endorsed by the publisher.
Research integrity at Frontiers
Learn more about the work of our research integrity team to safeguard the quality of each article we publish.