
95% of researchers rate our articles as excellent or good
Learn more about the work of our research integrity team to safeguard the quality of each article we publish.
Find out more
ORIGINAL RESEARCH article
Front. Environ. Sci. , 21 March 2023
Sec. Water and Wastewater Management
Volume 11 - 2023 | https://doi.org/10.3389/fenvs.2023.1154739
This article is part of the Research Topic Advanced Treatment of Toxic Pollutants Using 3D Materials in Wastewater View all 5 articles
 Sutrisno Salomo Hutagalung1,2*
 Ande Fudja Rafryanto3
 Wei Sun4Nurochma Juliasih5Sri Aditia5Jizhou Jiang4
 Arramel3Hermawan Kresno Dipojono6Sri Harjati Suhardi7Nurul Taufiqu Rochman2,3Deddy Kurniadi1*
The intricate nature of various textile manufacturing processes introduces colored dyes, surfactants, and toxic chemicals that have been harmful to ecosystems in recent years. Here, a combination ozone-based advanced oxidation process (AOP) is coupled with a nanobubbles generator for the generation of ozone nanobubbles (NB) utilized the same to treat the primary effluent acquired from textile wastewaters. Here we find several key parameters such as chemical oxygen demand ammonia content (NH3), and total suspended solids indicating a substantial recovery in which the respective percentages of 81.1%, 30.81%, and 41.98%, upon 300 min residence time are achieved. On the other hand, the pH is shifted from 7.93 to 7.46, indicating the generation of hydrogen peroxide (H2O2) due to the termination reaction and the self-reaction of reactive oxygen species (ROS). We propose that the reactive oxygen species can be identified from the negative zeta potential measurement (−22.43 ± 0.34 mV) collected in the final state of treatment. The combined method has successfully generated ozone nanobubbles with 99.94% of size distributed in 216.9 nm. This highlights that enhancement of ozone’s reactivity plays a crucial role in improving the water quality of textile wastewater towards being technologically efficient to date.
An alarming large production of undesired organic contaminants in the textile industry has become a long-standing issue that deserves special attention (I. Ali et al., 2012; Lapworth et al., 2012; Salah et al., 2022; Verma et al., 2022). Moreover, the diverse class of organic contaminants produced by the textile industry triggered a complexity that led to adverse effects on the human body. This undesired byproduct is highly harmful to environmental conditions (I. Ali et al., 2012; Gendy et al., 2022). Both the large volume of effluents and the type of chemical compositions, to some extent, create a tip of an iceberg issue that could eventually grow into complex problems. In the past years, nearly 1 million tons of toxic dyeing wastewater were produced annually, of which 200,000 tons were disposed as effluent without proper treatments (Holkar et al., 2016; Siddique et al., 2017). Therefore, tactical solutions and preventive measures in handling such environmental issues are highly pursued to facilitate safe downstream ecosystems and sustainable human health.
Several approaches have been introduced within the past 2 decades focusing on the treatment of organics-contaminated wastewater, and the common method in the current applications is chemical oxidation (Asghar et al., 2015; Sun et al., 2015). Among other chemical oxidation processes, AOP is categorized to be a versatile approach in wastewater technology due to the in situ formation of reactive oxygen species (ROS) such as hydroxyl radicals (OH•) (Yan et al., 2022; Yasasve et al., 2022; Aljedaani et al., 2023).
In the recent decade, different studies have formulated that the characteristic outcome of ozone-based AOP method is influenced by the chemical and physical parameters, such as pH of the solution (Deng and Zhao, 2015; Boczkaj and Fernandes, 2017; Koc-Jurczyk and Jurczyk, 2019). There is an ongoing discussion that pH is an essential parameter since it plays an important role during O3 decomposition process (Temesgen et al., 2017). The ozonation combined with UV-radiation (O3/UV) is an efficient catalytic wastewater system for the degradation of refractory pollutants. In principle, the catalytic process is started by ozone photolysis, followed by ROS production (Emam, 2012). Despite renewed interest of the AOP operational method in the last two decades (Zhang et al., 2021), few reports have compared to degrade various textile wastewaters using different AOP approaches.
Nanobubbles (NB) technology has been widely used to degrade organic contaminants in solutions (Ali et al., 2023; Aluthgun Hewage et al., 2021; Wang et al., 2019). The physicochemical concept of NB technology is slightly comparable to the AOP method. At a glance, NB facilitates the formation of a physical barrier such that a contaminant layers can be encapsulated by the bubble surface (Pan et al., 2021; Suvira and Zhang, 2021; Inoue et al., 2022; Selihin and Tay, 2022) thereby generating ROS efficiently (Fan et al., 2023). The formation of ROS plays a vital role in degrading organic compounds that are present in the wastewater (Mishra et al., 2017). However, the underlying mechanism in the NB technology is based on the realization of gas bubbling rather than a chemical treatment approach. Due to this reason, the ozone-based NB produced by the NB generator could extend its lifetime in the water column for a longer time compared to its counterparts (Hu and Xia, 2018). According to Meegoda and coworkers (J. Meegoda and Batagoda, 2016), when dissolved ozone interacts with the pollutants, the treated water remains in the saturated ozone. Therefore, NB retains its physical properties within the water column for several months under normal pressure. To the best of our knowledge, a few combinations of the NB applications and other AOP are introduced. For example, the work carried out by Tasaki et al. (2009) indicated that oxygen microbubbles (MB) could be implemented for the methyl orange removal in the presence of a photocatalyst under UV irradiation. In this study, we employ a combination of ozone-based AOP and NB to degrade textile wastewater samples during 300 min of residence time. To assess the water quality parameters, such as chemical oxygen demand (COD), ammonia content (NH3), and total suspended solids (TSS)are compared to find the integrated system performance. The NB formation is then analyzed using Dynamic Light Scatering (DLS) method to find the size, stability, and surface charge of our NB.
Our system consists of three processes: ozone injection, NB treatment, and circulation. Figure 1 depicts a technical schematic of the NB-AOP procedure’s piping and instrumentation’s diagram.
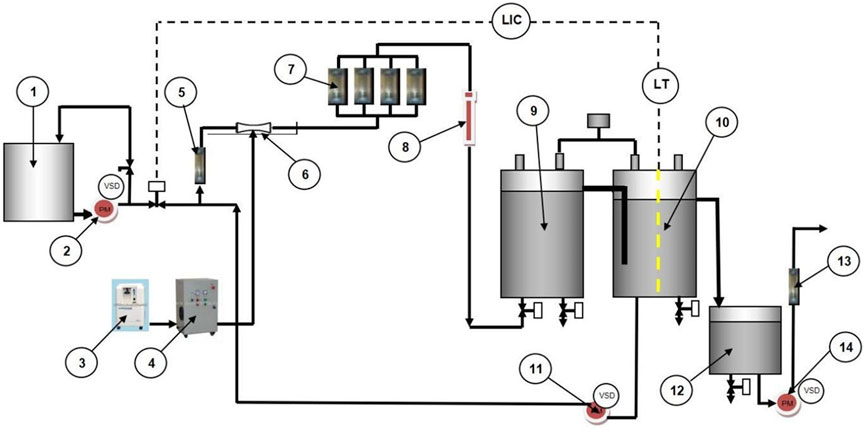
FIGURE 1. Piping and Instrumentation’s diagram of the combined ozone-based AOP and NB method. 1. Textile wastewater sample material, 2. Distribution pump, 3. Oxygen generator, 4. Ozone generator, 5. Rotameter A, 6. Venturi tube, 7. NB generator, 8. Ultraviolet device, 9. Tank 1, 10. Tank 2, 11. Circulation pump, 12. Reservoir Tank, 13. Outlet pump, 14. Rotameter B.
At a glance, initial textile wastewater was circulated via a distribution pump and controlled using a rotameter. Textile wastewater was collected from the Indonesian textile industry and utilized as received. The initial state of textile wastewater is indicated in Table 1. The water stream was then forced via a venturi tube, introducing ozone created by an ozone generator. In this investigation, the commercialized product of an ozone generator from PT. Nanobubbles Karya Indonesia (NKI) was employed to develop adequate ozone using the corona discharge method. The system received around 30 g L-1 ozone.
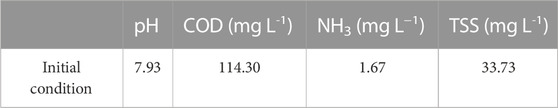
TABLE 1. The initial condition of textile wastewater.
After injecting ozone into the water stream, the mixture containing fluids and gases is passed through the four NB generators schematically arranged in parallel geometry/framework. The commercialized NB generator from PT. NKI was employed in this investigation. The NB generator used in this study is almost similar to the orifice plate principle conceptually formulated in the previous finding (Rahmawati et al., 2021). NB generator plate dimensions are 130 mm long and 50.8 mm in diameter. The NB generator comprises of 127 honeycomb-shaped holes with a diameter of 2.8 mm with a spacing of 1 mm. Figure 2 depicts the cross-section of an NB generator used in this investigation.
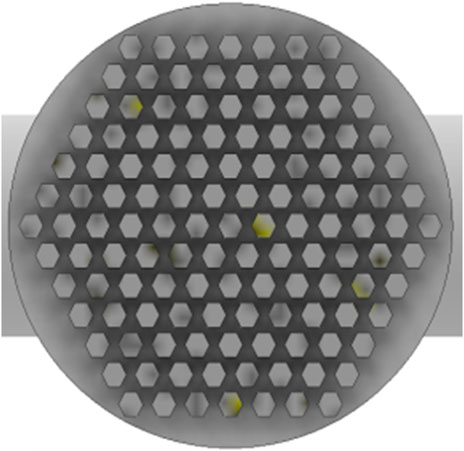
FIGURE 2. The cross-section of the NB Generator.
The water was then passed into the UV-source device situated in series with respect to the NB generator. Then the treated water is distributed via a circulating pump continuously. In our study, the process was conducted from 60 to 300 min. The whole system is regulated using a wireless system with a Programmable Logic Controller (PLC).
We note that the NB technology typically operates under the cavitation phenomenon. The cavitation behaviour is considered as a direct consequence of a significant reduction in the pressure stream. To elaborate the hydroxyl radical formations that are generated by the cavitation, we introduce the cavitation number (Cv) as shown in Eq. 1 to describe the degree of cavitation in the hydraulic devices such as NB unit.
We assign p2, pv, ρ, and Vo to fully recovered downstream pressure, liquid vapor pressure, liquid density, and velocity at the cavitating constriction’s throat, respectively (Saharan et al., 2013; Wang et al., 2020). The opening area of throat is defined as the whole area of the plate’s hole, which is close to 6.46 × 10⁻⁴ m2. Meanwhile, the liquid vapor pressure in 25°C (the actual temperature in process) is 3.165 kPa. We note that the incoming flow rate of 570 LPM and the input pressure of around 192 kPa were used. A pressure drops around 101 kPa was recorded upon the initialization NB procedure, indicating the effect of cavitation takes place. As a result, the cavitation number of 0.909 for our NB system can be determined using Eq. 1. According to Saharan et al. (2013), the cavitation phenomenon often occurs when Cv ≤ 1 (Montalvo Andia et al., 2021; Wang et al., 2020).
Measurement of size, zeta potential, and stability of NB: Ozone NB size distribution and zeta potential in water were analyzed using a particle size analyzer (Zetasizer Pro Blue, Malvern) based on the principle of dynamic light scattering method. The zetasizer is capable of determining the bubble sizes in the range of 0.3 nm–10 μm.
Measurement of pH: pH water was measured every 60 min of the process using the pH sensor CSIM11 by immersing the probe into the solution.
Measurement of COD: The measurement of COD in this experiment was based on standard methods for the examination of water and wastewater (Methods: 5220 C. Closed Reflux Titrimetric Method) from APPA, AWWA, and WEF (Baird et al., 2017). The heating tube was filled with textile effluent samples and 10 mL of 0.12 N K2Cr2O7 solution. After adding 25 mL of H2SO4 solution containing Ag2SO4 to a cooling bath, the heating tube was removed and dried. The following stage is to heat for 120 min at 155°C. After cooling, excess K2Cr2O7 was neutralized with a 0.12 N solution of ammonium ferrosulfate (FAS) and ferroin indicator (2 drops) until the color changed from blue-green to red-brown.
According to the redox back-titration method’s principles, there is a stoichiometric correlation between the quantity of oxidant remaining and the amount of reductive titrant added, which can be estimated from the end-point volume of FAS used in the titration process. By taking into consideration that the Fe2+/Fe3+ couple only transfers one electron, the COD value may be determined using the following equation (Rekhate and Shrivastava, 2020).
where
Measurement of TSS: Standard methods for water and wastewater examination (Method: 2540 D) from APHA, AWWA, and WEF were employed to measure the TSS of our sample (Baird et al., 2017). The 250 mL of textile wastewater samples were poured into beaker glass. The samples were then shaken homogeneously. Afterwards, the sample was filtered using Whatman 934-AH filter paper or its equivalent, which had predetermined its empty weight. The filter paper was stored in an oven at 105°C for 2 h or until dry, put in a desiccator for 15 min, and then weighed.
Measurement of NH3: NH3 analysis was conducted based on standard methods for examining water and wastewater (Method: 4500-NH3 Nitrogen) from APHA, AWWA, and EWF (Baird et al., 2017). The Kjeldahl flask containing the sample was slowly incorporated with boric acid, ensuring that the end of the condenser was submerged in the container solution in the beaker. The process is allowed to run for ±5 min to see the steam enter the reservoir. Subsequently, 25 mL of 50% NaOH solution was added through the funnel in the Kjeldahl apparatus. The distillation is allowed to run for 30–40 min. The result of distillation in the beaker glass is titrated with HCl solution until the color changes from red-purple to yellow.
To represents the significance of our combined method, the decoloration of textile wastewater is displayed in Figure 3. We find that the textile wastewater progressively changed its color solution as a function of residence time during the treatment process. Within the initial treatment of 60 and 120 min, we found that visual observation of the treated wastewater in tank one was significantly different compare to the tank 2. It was noticeable that within 120 min of residence time, the water color was changed from brownish to the pale-green, indicating an improvement in the water quality was achieved via extending the residence time and continuous circulation of the water line along the recovery water. At the end of the process (300 min), the textile wastewater color was unambiguously improved, showing a semi-transparent solution. Furthermore, the changes in several parameters control, namely, COD, NH3, and TSS are depicted in Figure 4.
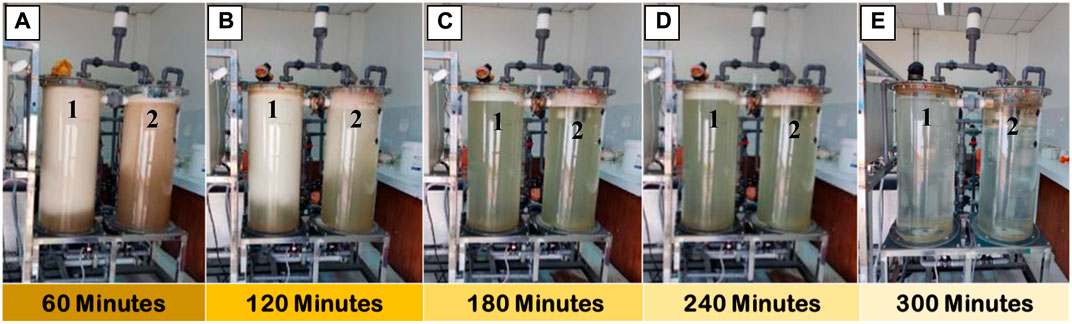
FIGURE 3. Photograph images of the reactor tanks upon AOP-NB treatment with different residence times (A) 60 min, (B) 120 min, (C) 180 min, (D) 240 min, and (E) 300 min, respectively.
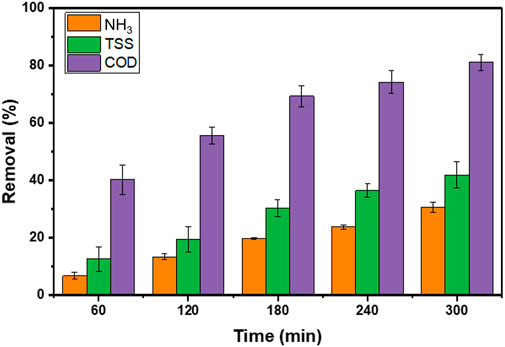
FIGURE 4. The characteristic of water quality parameters of textile wastewater; COD (purple), TSS (green), and NH3 (orange) during 300 min of treatment.
The evolution of COD values as a function of residence time is presented in Figure 4. According to the findings, the COD concentration is reduced along the residence time with the final state reach approximately 80% removal. Further details of COD evolution during 300 min of the treatment process can be found in Supplementary Table S1.
We compare the COD parameter of wastewater that was treated by the combined method of ozone based AOP + NB and ozone-based AOP alone, as depicted in Figure 5. In general, both systems have demonstrated their potential for lowering COD levels in water. As a result of the ozone exposure, the AOP system alone exhibited a sufficient removal rate to degrade the organic contaminants within the range of ∼10% upon 300 min treatment time. Interestingly, the combined method of NB + AOP system yielded substantial improvement in which the COD reduction rate was significantly greater than the AOP reduction (shown in red lines). Here, we postulated that such a high COD reduction rate might be attributed due to the ozone size modification, as those compounds are subsequently through the NB compartment. Ozone has an undesired physical characteristic such as poor solubility in the water. It led to a condition in which ozone is easily escape into the atmosphere from its solution phase. Therefore, one solution is required to enhance the persistence time by reducing the material size or shape. For instance, the size modification of a nanobubble with a smaller size could improve to a longer persistent time (Tekile et al., 2016; Nirmalkar et al., 2018).
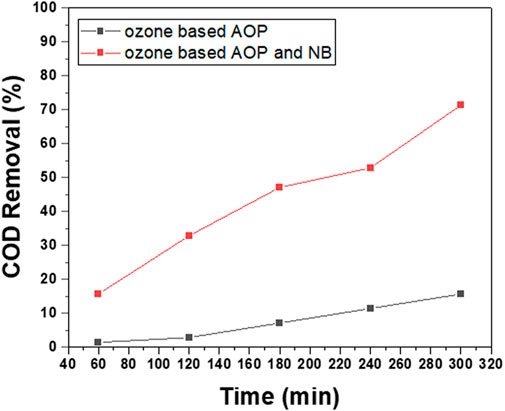
FIGURE 5. Comparison of COD removal percentage between ozone based AOP + NB versus AOP system.
Figure 6A Shows the bubble size findings that acquired using the DLS instrument according to the number-distribution data. The peak distribution value, approximated from 99.94% of the ozone-based NB was 216.9 nm in size. Here we noted that the quantity and size of NB could affect their mass transfer efficiency. A significant NB production is desirable in a large total surface area that would enhance the mass transfer flow from the bubbles toward the wastewater solution. However, we should also consider that non-negligible bubbles with a smaller size could arise under the higher internal pressure and larger specific area (Peng and Yu, 2015; Ulatowski et al., 2019; Rahmawati et al., 2021). Here, we revisit the contact principle used in this study in which multiphase gas-liquid flow was employed to generate NB. In order to produce a multiphase flow, we therefore consider that the water flow was injected with a pressurized ozone (Levitsky et al., 2015; Rahmawati et al., 2021). When the multiphase flow passed through the honeycomb structure of NB generator, then the ozone NBs are subsequently formed due to the multiphase flow breakdown (Ren et al., 2018; Rahmawati et al., 2021).
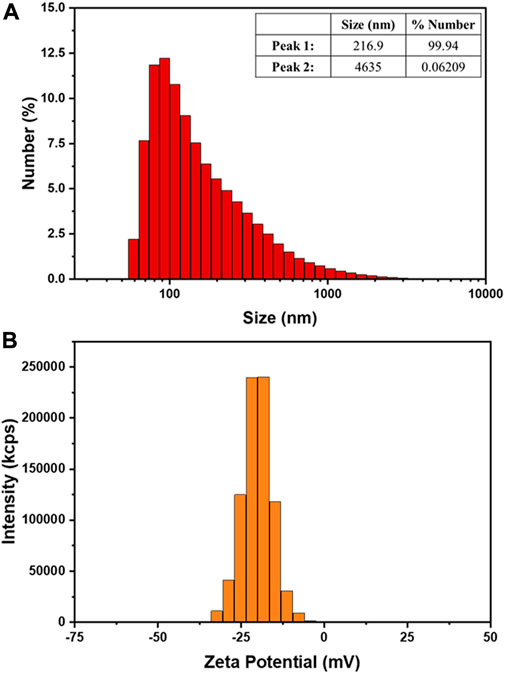
FIGURE 6. (A) Particle size distribution of ozone NB, and (B) Zeta potential value of ozone NB.
The zeta potential in the final residence time of 300 min is reported to be −21.08 ± 0.35 mV with the corresponding distribution is depicted in Figure 6B. The negative value here is assigned to the generated ROS at the bubble interface, which leads to the bubble stability (Ushikubo et al., 2010; Selihin and Tay, 2022; Zhou et al., 2022). Typically, zeta potential value can be associated to the charge of the bubble rather than its density in the water. The amount of zeta potential indirectly reflects how stable a colloidal system is. The electrically-charged surface causes particles to repel one another, preventing the bubbles from emerging on the other bubble surface (J. N. Meegoda et al., 2018; Ushikubo et al., 2010). The details of NB’s zeta potential in 300 min of the process can be found in Table S5.
To interpret such COD reduction in ozone based AOP and NB system, we propose that this finding could be driven by the enhanced synergistic effects promoting an efficient chemical degradation reaction pathway to remove the organic contaminants from the water.
The pollutant degradation mechanism can be understood in two consecutive processes. The first stage of the water recovery process is related to accumulating ozone NB (see arrow red in Figure 7), which leads to the first reaction with the incoming inlet wastewater. Ozone NB has higher surface contact compared to macro-bubble, so it would be more persistent in the solution. It also strongly influence both the pollutant degradation and ROS generation at the following treatment stage. Here, we found that fine control of ozone exposure under pH-neutral media accommodates the organic contaminants’ physical degradation. Our finding regarding COD reduction that operated at neutral pH in agreement with the previous reports (Lucas et al., 2009; Takahashi et al., 2012; Yang et al., 2012; Temesgen et al., 2017).
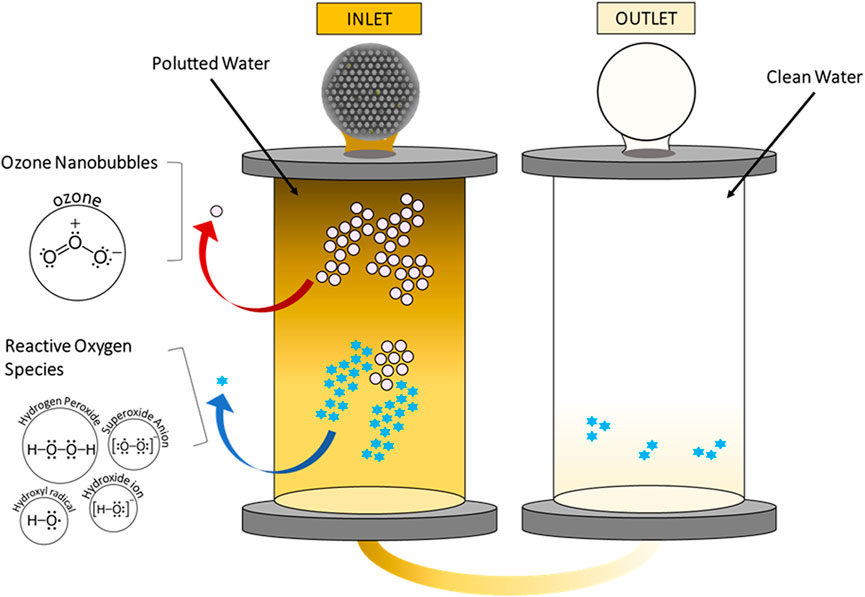
FIGURE 7. Schematic illustration of pollutant degradation in our system.
The second recovery stage corresponds to the utilization of ozone-based AOP as indicated by the blue arrow in Figure 7. In this section, the generation of ROS or negatively-charged NB dominantly contributed to degrade the organic contaminants. We revisit the conventional thermodynamics of bubble collapse phenomenon to describe the ROS generation (Ghadimkhani et al., 2016) and ozone breakdown (Ikhlaq et al., 2013; Oh and Nguyen, 2022). In the ozone decomposition, we attribute the ROS is a chain reaction comprised of initiation, propagation, and termination (Khuntia et al., 2015).
Furthermore, ROS via collapsing cavity bubbles can be described based on the Young-Laplace equation (Kimura et al., 2004; Takahashi et al., 2007; Ghadimkhani et al., 2016).
where P denotes gas pressure, Pl denotes liquid pressure, σ denotes liquid surface tension, and d denotes the bubble diameter. The internal pressure of a bubble is substantially determined by its size, according to Eq. 3. Since the d is inversely proportional to the gas pressure, the impact on the internal pressure for the NB differs significantly compared to the macro-bubbles. Thus, once NB is defragmented into molecular gas, thus the additional surface energy can rupture the hydrogen-oxygen bond and therefore generate ROS (Bandala and Rodriguez-Narvaez, 2019).
In addition, we present a semiempirical approach concerning the complete chemistry of the degradation pathway in our system. Based on our understanding, the chemical process in this study related to the concerted scheme of direct and indirect oxidation routes. Here, we consider that a direct route is related to a simultaneous chemical reaction between pollutant target and ozone, while the indirect route utilized ROS to degrade the targeted contaminants.
In terms of temporal consideration, a direct reaction of ozonation between specific compounds and functional groups lasted in relatively slow reaction time (a constant rate in the range of Kd = 1.0–106 M−1 s−1) (Gottschalk et al., 2010). Ozone reacts with a faster degradation rate when it interacts to certain types of aromatic and aliphatic compounds.
The indirect oxidation route can be attributed to the formation of ozone radical chains that comprise of three different steps. The first step involving a decay process of ozone which is accelerated by initiators. In our scenario, the hydroxyl anion (OH−) is converted into ROS constituent such as OH•. Based on their kinetic argument, the chemical specificity to the targeted pollutant is non-selective with the rate of Kd = 108–1010 M−1 s−1 (Gottschalk et al., 2010). Let us consider that the OH• regain their missing electron by removing an electron from the hydrogen atom of the target pollutant molecules. This in turns converted to targeted water product (H2O). Consequently, the targeted molecules converted to ROS that propagates the chain reactions. However, another scheme could also arise in which a radical reacts to the second radical and terminated the reaction. A formulated pathway (Voigt et al., 2020) is described in Figure 8.
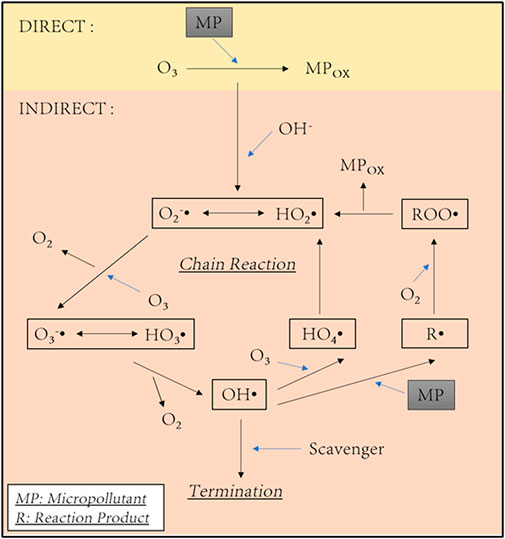
FIGURE 8. Proposed ozonation reaction through direct and indirect approaches.
We revisit the previous report that the removal contaminant rate can be maximized if the magnitude of ROS and targeted pollutants are similar, as previously reported by Bui and coworkers (Bui and Han, 2020). We note that in this study ROS was not analyzed quantitatively, nevertheless we predicted that our system able to produce ROS numbers that higher than the number of pollutants. It is an interesting fact that the COD removal during the first 60 min of the process shown a significant reduction around 40% removal. It is noticeable that our system was able to complete half of the final reduction within 60 min of the treatment process. In addition, this phenomenon can be realized with the stability and number of ROS. Upon simultaneous radicals’ formation, when the ROS number is higher than the pollutant number, the ROS will react with others through a terminating pathway to generate secondary ROS (with low reduction potential) and hydrogen peroxide (H2O2). Those secondary ROS then predicted it would dominate the oxidation process rather than the primary radicals (Esfahani et al., 2019), while H2O2 will contribute to reducing pH value, as seen in Figure 9.
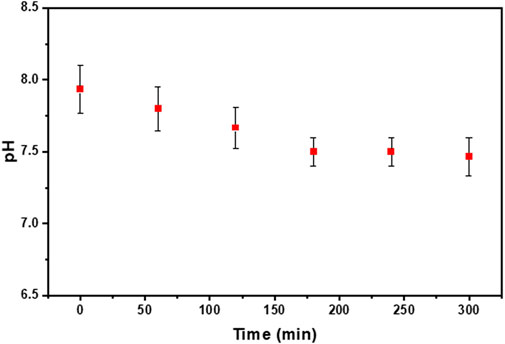
FIGURE 9. pH trend in solution probed during the treatment process.
By altering the residence time, the pH solution gradually decreased from 7.93 to 7.46, as shown in Supplementary Table S2 Based on previous study, pH in the initial state influences the rate of ozone oxidation (Patel et al., 2021; Jabesa and Ghosh, 2022; Jesus et al., 2022; John et al., 2022). When the pH of a solution is raised, the direct consequence is that the oxidation rate increases. However, there is a drawback in which the ozone concentration would decrease (Patel et al., 2021; Jabesa and Ghosh, 2022; Jesus et al., 2022; John et al., 2022). Furthermore, aqueous solutions containing high pH induced ozone autodecomposition since it led to indirect ozone breakdown, resulting in ROS such as peroxy radicals, HO2•, and OH• (Jabesa and Ghosh, 2022; Jesus et al., 2022). However, when the pH is more than 8, this eventually hampers the process with the decay of ozone half-lives (Gardoni et al., 2012). Furthermore, we consider that our UV in the AOP-Ozone combination promotes the chemical breakdown of organic pollutants, as previously described by Rekhate et al. (Rekhate and Shrivastava, 2020) and Wu et al. (Wu, 2008).
Similarly, the elimination of TSS and NH3 resulted in a significant shift throughout the residence time. In TSS removal, the large contaminants tended to adhere to the NB surface while floating to the outmost water surface (Ali et al., 2021). It will cluster the solid suspension in solution. As a result, the removal process of suspension would last rapidly (F. Ali et al., 2021). Detailed information regarding TSS values in different sampling regimes during 300 min can be found in Supplementary Table S3.
On the other hand, the pH of the solution had a considerable influence on NH3 decomposition. At pH 9, direct oxidation of NH3 occurs. In our study, the pH of the solution was determined to be 7-8, which is comparable to the initial conditions. In this pH range, we propose that direct oxidation is likely to occur. At low pH (lower than 7), the quantity of free NH3 was minimal, resulting in a sluggish rate of NH3 oxidation. As the pH gradually increases, the number of NH3 generated is continuously enhanced. Consequently, the availability of free NH3 increased the oxidation rate (Khuntia et al., 2013). The maximum reduction of NH3 in textile wastewater is achieved at 300 min residence time; further details can be found in Supplementary Table S4.
We summarized that approximately 81.1% of COD recovery in the water purification system is achieved by utilizing the combination oxidation methods of AOP and NB for textile wastewater samples. Here we emphasize the role of NB method in this investigation is essential to improve the gas–liquid phase efficiency processes. Moreover, the realization of ROS generation mediates the chemical conversion of the polluted water to the environmentally-safe effluent with low level of COD, NH3, and TSS. To statistically quantify the NB size of our system, we reported that 99.94% of the ozone bubble population is recorded with the size of 216.9 nm upon 300 min. The zeta potential values unambiguously shed some light on the existence of ROS at −22.43 ± 0.34 mV. An abrupt reduction of the COD is observed with the removal percentage of around 40% within the first 60 min residence time. Here, we consider that the initial reaction kinetics takes place in both processes facilitating the faster reaction rate compared to the individual stage of AOP or NB method.
The original contributions presented in the study are included in the article/Supplementary Material, further inquiries can be directed to the corresponding authors.
SH and DK conceived the project. SH formulated the recovery plant design and carried out the experiments with SS and NJ. AFR, SA, HD, and WS contributed to data analysis. SH, AR, and AFR. write the manuscript. NR, JJ, and DK. discussed the results and supervised the project. All the authors were involved in the discussion and manuscript preparation. All authors have approved the final version of the manuscript.
This research was supported under a doctoral research program (No. 183/H/2020) funded by the Indonesian Institute of Sciences and recently inaugurated as the National Research and Innovation Agency, Indonesia. This research was fully supported by the Institute of Technology Bandung (ITB) in collaboration with the National Research and Innovation Agency (BRIN), Indonesia. The authors declare that this study received funding from PT. Nanotech Indonesia Global, Tbk. The funder was not involved in the study design, collection, analysis, interpretation of data, the writing of this article, or the decision to submit it for publication.
AR and AFR. express gratitude to PT. Nanotech Indonesia Global, Tbk. for the start-up research grant.
Authors NJ and SA were employed by the company South Pacific Viscose.
The remaining authors declare that the research was conducted in the absence of any commercial or financial relationships that could be construed as a potential conflict of interest.
All claims expressed in this article are solely those of the authors and do not necessarily represent those of their affiliated organizations, or those of the publisher, the editors and the reviewers. Any product that may be evaluated in this article, or claim that may be made by its manufacturer, is not guaranteed or endorsed by the publisher.
The Supplementary Material for this article can be found online at: https://www.frontiersin.org/articles/10.3389/fenvs.2023.1154739/full#supplementary-material
Ali, F., Azmi, K. N., and Firdaus, M. R. (2021). The effectiveness of microbubble technology in the quality improvement of raw water sample. IOP Conf. Ser. Mater. Sci. Eng. 1144 (1), 012053. doi:10.1088/1757-899X/1144/1/012053
Ali, I., Asim, M., and Khan, T. A. (2012). Low cost adsorbents for the removal of organic pollutants from wastewater. J. Environ. Manag. 113, 170–183. doi:10.1016/j.jenvman.2012.08.028
Ali, J., Yang, Y., and Pan, G. (2023). Oxygen micro-nanobubbles for mitigating eutrophication induced sediment pollution in freshwater bodies. J. Environ. Manag. 331, 117281. doi:10.1016/J.JENVMAN.2023.117281
Aljedaani, R. O., Kosa, S. A., and Abdel Salam, M. (2023). Ecofriendly green synthesis of copper (II) oxide nanoparticles using corchorus olitorus leaves (molokhaia) extract and their application for the environmental remediation of direct violet dye via advanced oxidation process. Molecules 28 (1), 16. doi:10.3390/MOLECULES28010016
Aluthgun Hewage, S., Batagoda, J. H., and Meegoda, J. N. (2021). Remediation of contaminated sediments containing both organic and inorganic chemicals using ultrasound and ozone nanobubbles. Environ. Pollut. 274, 116538. doi:10.1016/J.ENVPOL.2021.116538
Asghar, A., Abdul Raman, A. A., and Wan Daud, W. M. A. (2015). Advanced oxidation processes for in-situ production of hydrogen peroxide/hydroxyl radical for textile wastewater treatment: A review. J. Clean. Prod. 87, 826–838. doi:10.1016/j.jclepro.2014.09.010
Baird, R., Eaton, A. D., Rice, E. W., and Bridgewater, L. (2017). “American public health association,” in American water works association, & water environment federation. (Colorado, United States: APHA).
Bandala, E. R., and Rodriguez-Narvaez, O. M. (2019). On the nature of hydrodynamic cavitation process and its application for the removal of water pollutants. Air, Soil Water Res. 12, 117862211988048. doi:10.1177/1178622119880488
Boczkaj, G., and Fernandes, A. (2017). Wastewater treatment by means of advanced oxidation processes at basic pH conditions: A review. Chem. Eng. J. 320, 608–633. doi:10.1016/J.CEJ.2017.03.084
Bui, T. T., and Han, M. (2020). Decolorization of dark green Rit dye using positively charged nanobubbles technologies. Sep. Purif. Technol. 233, 116034. doi:10.1016/j.seppur.2019.116034
Deng, Y., and Zhao, R. (2015). Advanced oxidation processes (AOPs) in wastewater treatment. Curr. Pollut. Rep. 1 (3), 167–176. doi:10.1007/s40726-015-0015-z
Emam, E. A. (2012). Effect of ozonation combined with heterogeneous catalysts and ultraviolet radiation on recycling of gas-station wastewater. Egypt. J. Petroleum 21 (1), 55–60. doi:10.1016/j.ejpe.2012.02.008
Esfahani, M. P., Gates, I. D., and de Visscher, A. (2019). Kinetic modeling of ozone decomposition and peroxone oxidation of toluene in an aqueous phase using ab initio calculations. Industrial Eng. Chem. Res. 58 (51), 22934–22941. doi:10.1021/acs.iecr.9b04960
Fan, W., Li, Y., Lyu, T., Yu, J., Chen, Z., Jarvis, P., et al. (2023). A modelling approach to explore the optimum bubble size for micro-nanobubble aeration. Water Res. 228, 119360. doi:10.1016/J.WATRES.2022.119360
Gardoni, D., Vailati, A., and Canziani, R. (2012). Decay of ozone in water: A review. Ozone: Sci. Eng. 34 (4), 233–242. doi:10.1080/01919512.2012.686354
Gendy, E. A., Oyekunle, D. T., Ifthikar, J., Jawad, A., and Chen, Z. (2022). A review on the adsorption mechanism of different organic contaminants by covalent organic framework (COF) from the aquatic environment. Environ. Sci. Pollut. Res. 29 (22), 32566–32593. doi:10.1007/S11356-022-18726-W
Ghadimkhani, A., Zhang, W., and Marhaba, T. (2016). Ceramic membrane defouling (cleaning) by air Nano Bubbles. Chemosphere 146, 379–384. doi:10.1016/j.chemosphere.2015.12.023
Gottschalk, C., Libra, J. A., and Saupe, A. (2010). Ozonation of water and waste water: A practical guide to understanding ozone and its applications. Weinheim, Germany: WileyVCH. doi:10.1002/9783527628926
Holkar, C. R., Jadhav, A. J., Pinjari, D. v., Mahamuni, N. M., and Pandit, A. B. (2016). A critical review on textile wastewater treatments: Possible approaches. J. Environ. Manag. 182, 351–366. doi:10.1016/j.jenvman.2016.07.090
Hu, L., and Xia, Z. (2018). Application of ozone micro-nano-bubbles to groundwater remediation. J. Hazard. Mater. 342, 446–453. doi:10.1016/j.jhazmat.2017.08.030
Ikhlaq, A., Brown, D. R., and Kasprzyk-Hordern, B. (2013). Mechanisms of catalytic ozonation: An investigation into superoxide ion radical and hydrogen peroxide formation during catalytic ozonation on alumina and zeolites in water. Appl. Catal. B: Environ. 129, 437–449. doi:10.1016/J.APCATB.2012.09.038
Inoue, S., Kimura, Y., and Uematsu, Y. (2022). Ostwald ripening of aqueous microbubble solutions. J. Chem. Phys. 157 (24), 244704. doi:10.1063/5.0128696
Jabesa, A., and Ghosh, P. (2022). Oxidation of bisphenol-A by ozone microbubbles: Effects of operational parameters and kinetics study. Environ. Technol. Innovation 26, 102271. doi:10.1016/J.ETI.2022.102271
Jesus, F., Domingues, E., Bernardo, C., Pereira, J. L., Martins, R. C., and Gomes, J. (2022). Ozonation of selected pharmaceutical and personal care products in secondary effluent—degradation kinetics and environmental assessment. Toxics 10 (12), 765. doi:10.3390/toxics10120765
John, A., Brookes, A., Carra, I., Jefferson, B., and Jarvis, P. (2022). Microbubbles and their application to ozonation in water treatment: A critical review exploring their benefit and future application. Crit. Rev. Environ. Sci. Technol. 52 (9), 1561–1603. doi:10.1080/10643389.2020.1860406
Khuntia, S., Majumder, S. K., and Ghosh, P. (2015). Quantitative prediction of generation of hydroxyl radicals from ozone microbubbles. Chem. Eng. Res. Des. 98, 231–239. doi:10.1016/J.CHERD.2015.04.003
Khuntia, S., Majumder, S. K., and Ghosh, P. (2013). Removal of ammonia from water by ozone microbubbles. Industrial Eng. Chem. Res. 52 (1), 318–326. doi:10.1021/ie302212p
Kimura, K., Hane, Y., Watanabe, Y., Amy, G., and Ohkuma, N. (2004). Irreversible membrane fouling during ultrafiltration of surface water. Water Res. 38 (14), 3431–3441. doi:10.1016/j.watres.2004.05.007
Koc-Jurczyk, J., and Jurczyk, Ł. (2019). Influence of pH in AOP on humic compounds removal from municipal landfill leachate concentrate after reverse osmosis. J. Ecol. Eng. 20 (2), 161–168. doi:10.12911/22998993/97285
Lapworth, D. J., Baran, N., Stuart, M. E., and Ward, R. S. (2012). Emerging organic contaminants in groundwater: A review of sources, fate and occurrence. Environ. Pollut. 163, 287–303. doi:10.1016/j.envpol.2011.12.034
Levitsky, I., Tavor, D., and Gitis, V. (2015). “Generation of air-water two-phase flow with narrow micro-bubble size distribution,” in Conference of the Israel Institute of chemical engineering (Israel: Wiley).
Lucas, M. S., Peres, J. A., Lan, B. Y., and Li Puma, G. (2009). Ozonation kinetics of winery wastewater in a pilot-scale bubble column reactor. Water Res. 43 (6), 1523–1532. doi:10.1016/j.watres.2008.12.036
Meegoda, J., and Batagoda, J. (2016). “A new technology to decontaminate sediments using ultrasound with ozone nano bubbles,” in Geo-chicago 2016. (Virginia, United States: American Society of Civil Engineers (ASCE)). doi:10.1061/9780784480168.039
Meegoda, J. N., Aluthgun Hewage, S., and Batagoda, J. H. (2018). Stability of nanobubbles. Environ. Eng. Sci. 35 (11), 1216–1227. doi:10.1089/ees.2018.0203
Mishra, N., Reddy, R., Kuila, A., Rani, A., Nawaz, A., and Pichiah, S. (2017). A review on advanced oxidation processes for effective water treatment. Curr. World Environ. 12 (3), 469–489. doi:10.12944/CWE.12.3.02
Montalvo Andia, J. P., Ticona Cayte, A. E., Illachura Rodriguez, J. M., López Belón, L., Cárdenas Málaga, M. A., and Teixeira, L. A. C. (2021). Combined treatment based on synergism between hydrodynamic cavitation and H2O2 for degradation of cyanide in effluents. Miner. Eng. 171, 107119. doi:10.1016/J.MINENG.2021.107119
Nirmalkar, N., Pacek, A. W., and Barigou, M. (2018). On the existence and stability of bulk nanobubbles. Langmuir : ACS J. Surfaces Colloids 34 (37), 10964–10973. doi:10.1021/ACS.LANGMUIR.8B01163/ASSET/IMAGES/LARGE/LA-2018-01163J_0002.JPEG
Oh, S. Y., and Nguyen, T. H. A. (2022). Ozonation of phenol in the presence of biochar and carbonaceous materials: The effect of surface functional groups and graphitic structure on the formation of reactive oxygen species. J. Environ. Chem. Eng. 10 (2), 107386. doi:10.1016/J.JECE.2022.107386
Pan, Y., He, B., and Wen, B. (2021). Effects of surface tension on the stability of surface nanobubbles. Front. Phys. 9, 731804. doi:10.3389/FPHY.2021.731804
Patel, S., Majumder, S. K., and Ghosh, P. (2021). Ozonation of diclofenac in a laboratory scale bubble column: Intermediates, mechanism, and mass transfer study. J. Water Process Eng. 44, 102325. doi:10.1016/J.JWPE.2021.102325
Peng, F. F., and Yu, X. (2015). Pico–nano bubble column flotation using static mixer-venturi tube for Pittsburgh No. 8 coal seam. Int. J. Min. Sci. Technol. 25 (3), 347–354. doi:10.1016/j.ijmst.2015.03.004
Rahmawati, A. I., Saputra, R. N., Hidayatullah, A., Dwiarto, A., Junaedi, H., Cahyadi, D., et al. (2021). Enhancement of Penaeus vannamei shrimp growth using nanobubble in indoor raceway pond. Aquac. Fish. 6 (3), 277–282. doi:10.1016/J.AAF.2020.03.005
Rekhate, C. v., and Shrivastava, J. K. (2020). Decolorization of azo dye solution by ozone based advanced oxidation processes: Optimization using response surface methodology and neural network. Ozone: Sci. Eng. 42 (6), 492–506. doi:10.1080/01919512.2020.1714426
Ren, F., Noda, N. A., Ueda, T., Sano, Y., Takase, Y., Umekage, T., et al. (2018). CFD-PBM coupled simulation of a nanobubble generator with honeycomb structure. IOP Conf. Ser. Mater. Sci. Eng. 372, 012012. doi:10.1088/1757-899X/372/1/012012
Saharan, V. K., Rizwani, M. A., Malani, A. A., and Pandit, A. B. (2013). Effect of geometry of hydrodynamically cavitating device on degradation of orange-G. Ultrason. Sonochemistry 20 (1), 345–353. doi:10.1016/J.ULTSONCH.2012.08.011
Salah, D., Hamd, A., Soliman, N. K., Elzanaty, A. M., Alanazi, A. M., Shaban, M., et al. (2022). Polyaniline/glauconite nanocomposite adsorbent for Congo red dye from textile wastewater. Separations 9 (11), 384. doi:10.3390/SEPARATIONS9110384
Selihin, N. M., and Tay, M. G. (2022). A review on future wastewater treatment technologies: Micro-nanobubbles, hybrid electro-fenton processes, photocatalytic fuel cells, and microbial fuel cells. Water Sci. Technol. 85 (1), 319–341. doi:10.2166/wst.2021.618
Siddique, K., Rizwan, M., Shahid, M. J., Ali, S., Ahmad, R., and Rizvi, H. (2017). “Textile wastewater treatment options: A critical review,” in Enhancing cleanup of environmental pollutants: Volume 2: Non-biological approaches. Editors N. A. Anjum, S. S. Gill, and N. Tuteja (Cham, Switzerland: Springer), 183–207. doi:10.1007/978-3-319-55423-5_6
Sun, L., Li, Y., and Li, A. (2015). Treatment of actual chemical wastewater by a heterogeneous fenton process using natural pyrite. Int. J. Environ. Res. Public Health 12 (11), 13762–13778. doi:10.3390/IJERPH121113762
Suvira, M., and Zhang, B. (2021). Effect of surfactant on electrochemically generated surface nanobubbles. Anal. Chem. 93 (12), 5170–5176. doi:10.1021/ACS.ANALCHEM.0C05067
Takahashi, M., Chiba, K., and Li, P. (2007). Free-radical generation from collapsing microbubbles in the absence of a dynamic stimulus. J. Phys. Chem. B 111 (6), 1343–1347. doi:10.1021/jp0669254
Takahashi, M., Ishikawa, H., Asano, T., and Horibe, H. (2012). Effect of microbubbles on ozonized water for photoresist removal. J. Phys. Chem. C 116 (23), 12578–12583. doi:10.1021/jp301746g
Tasaki, T., Wada, T., Fujimoto, K., Kai, S., Ohe, K., Oshima, T., et al. (2009). Degradation of methyl orange using short-wavelength UV irradiation with oxygen microbubbles. J. Hazard. Mater. 162 (2), 1103–1110. doi:10.1016/j.jhazmat.2008.05.162
Tekile, A., Kim, I., and Lee, J. Y. (2016). Extent and persistence of dissolved oxygen enhancement using nanobubbles. Environ. Eng. Res. 21 (4), 427–435. doi:10.4491/EER.2016.028
Temesgen, T., Bui, T. T., Han, M., Kim, T., and Park, H. (2017). Micro and nanobubble technologies as a new horizon for water-treatment techniques: A review. Adv. Colloid Interface Sci. 246, 40–51. doi:10.1016/j.cis.2017.06.011
Ulatowski, K., Sobieszuk, P., Mróz, A., and Ciach, T. (2019). Stability of nanobubbles generated in water using porous membrane system. Chem. Eng. Process. - Process Intensif. 136, 62–71. doi:10.1016/j.cep.2018.12.010
Ushikubo, F. Y., Enari, M., Furukawa, T., Nakagawa, R., Makino, Y., Kawagoe, Y., et al. (2010). Zeta-potential of micro- and/or nano-bubbles in water produced by some kinds of gases. IFAC Proc. Vol. 43 (26), 283–288. doi:10.3182/20101206-3-JP-3009.00050
Verma, L., Sonkar, D., Bhan, C., Singh, J., Kumar, U., Yadav, B. C., et al. (2022). Adsorptive performance of Tagetes flower waste based adsorbent for crystal violet dye removal from an aqueous solution. Environ. Sustain. 5 (4), 493–506. doi:10.1007/S42398-022-00250-9
Voigt, M., Wirtz, A., Hoffmann-Jacobsen, K., and Jaeger, M. (2020). Prior art for the development of a fourth purification stage in wastewater treatment plant for the elimination of anthropogenic micropollutants-a short-review. AIMS Environ. Sci. 7 (1), 69–98. doi:10.3934/ENVIRONSCI.2020005
Wang, J., Chen, H., Yuan, R., Wang, F., Ma, F., and Zhou, B. (2020). Intensified degradation of textile wastewater using a novel treatment of hydrodynamic cavitation with the combination of ozone. J. Environ. Chem. Eng. 8 (4), 103959. doi:10.1016/J.JECE.2020.103959
Wang, W. L., Cai, Y. Z., Hu, H. Y., Chen, J., Wang, J., Xue, G., et al. (2019). Advanced treatment of bio-treated dyeing and finishing wastewater using ozone-biological activated carbon: A study on the synergistic effects. Chem. Eng. J. 359, 168–175. doi:10.1016/J.CEJ.2018.11.059
Wu, C. H. (2008). Decolorization of C.I. Reactive Red 2 by ozonation catalyzed by Fe(II) and UV. React. Kinet. Catal. Lett. 93 (1), 35–42. doi:10.1007/s11144-008-5200-2
Yan, B., Li, Q., Chen, X., Deng, H., Feng, W., and Lu, H. (2022). Application of O3/PMS advanced oxidation technology in the treatment of organic pollutants in highly concentrated organic wastewater: A review. Separations 9 (12), 444. doi:10.3390/SEPARATIONS9120444
Yang, D., Wang, B., Ren, H., and Yuan, J. (2012). Effects and mechanism of ozonation for degradation of sodium acetate in aqueous solution. Water Sci. Eng. 5 (2), 155–163. doi:10.3882/j.issn.1674-2370.2012.02.004
Yasasve, M., Manjusha, M., Manojj, D., Hariharan, N. M., Sai Preethi, P., Asaithambi, P., et al. (2022). Unravelling the emerging carcinogenic contaminants from industrial waste water for prospective remediation by electrocoagulation – a review. Chemosphere 307, 136017. doi:10.1016/J.CHEMOSPHERE.2022.136017
Zhang, Y., Shaad, K., Vollmer, D., and Ma, C. (2021). Treatment of textile wastewater using advanced oxidation processes—A critical review. WaterSwitzerl. 13 (24), 3515. doi:10.3390/w13243515
Keywords: textile wastewater, advanced oxidation process, ozone, reactive oxygen species, water recovery, nanobubble
Citation: Hutagalung SS, Rafryanto AF, Sun W, Juliasih N, Aditia S, Jiang J, Arramel , Dipojono HK, Suhardi SH, Rochman NT and Kurniadi D (2023) Combination of ozone-based advanced oxidation process and nanobubbles generation toward textile wastewater recovery. Front. Environ. Sci. 11:1154739. doi: 10.3389/fenvs.2023.1154739
Received: 31 January 2023; Accepted: 06 March 2023;
Published: 21 March 2023.
Edited by:
Regis Guegan, Waseda University, JapanReviewed by:
Firdaus Ali, University of Indonesia, IndonesiaCopyright © 2023 Hutagalung, Rafryanto, Sun, Juliasih, Aditia, Jiang, Arramel, Dipojono, Suhardi, Rochman and Kurniadi. This is an open-access article distributed under the terms of the Creative Commons Attribution License (CC BY). The use, distribution or reproduction in other forums is permitted, provided the original author(s) and the copyright owner(s) are credited and that the original publication in this journal is cited, in accordance with accepted academic practice. No use, distribution or reproduction is permitted which does not comply with these terms.
*Correspondence: Sutrisno Salomo Hutagalung, MzMzMjAwMDZAbWFoYXNpc3dhLml0Yi5hYy5pZA==; Deddy Kurniadi, a3VybmlhZGlAaXRiLmFjLmlk
Disclaimer: All claims expressed in this article are solely those of the authors and do not necessarily represent those of their affiliated organizations, or those of the publisher, the editors and the reviewers. Any product that may be evaluated in this article or claim that may be made by its manufacturer is not guaranteed or endorsed by the publisher.
Research integrity at Frontiers
Learn more about the work of our research integrity team to safeguard the quality of each article we publish.