
95% of researchers rate our articles as excellent or good
Learn more about the work of our research integrity team to safeguard the quality of each article we publish.
Find out more
METHODS article
Front. Environ. Sci. , 20 April 2023
Sec. Environmental Informatics and Remote Sensing
Volume 11 - 2023 | https://doi.org/10.3389/fenvs.2023.1152450
This article is part of the Research Topic Hyperspectral Imaging in Environmental Monitoring and Analysis View all 5 articles
 Anastasia Zolotukhina1,2
 Alexander Machikhin1
 Anastasia Guryleva1,2*
 Valeriya Gresis2,3Victoriya Tedeeva4
Remote mapping of chlorophyll concentration in leaves is highly important for various biological and agricultural applications. Multiple spectral indices calculated from reflectance at specific wavelengths have been introduced for chlorophyll content quantification. Depending on the crop, environmental factors and task, indices differ. To map them and define the most accurate index, a single multi-spectral imaging system with a limited number of spectral channels is insufficient. When the best chlorophyll index for a particular task is unknown, hyperspectral imager able to collect images at any wavelengths and map multiple indices is in need. Due to precise, fast and arbitrary spectral tuning, acousto-optic imagers provide highly optimized data acquisition and processing. In this study, we demonstrate the feasibility to extract the distribution of chlorophyll content from acousto-optic hyperspectral data cubes. We collected spectral images of soybean leaves of 5 cultivars in the range 450–850 nm, calculated 14 different chlorophyll indices, evaluated absolute value of chlorophyll concentration from each of them via linear regression and compared it with the results of well-established spectrophotometric measurements. We calculated parameters of the chlorophyll content estimation models via linear regression of the experimental data and found that index CIRE demonstrates the highest coefficient of determination 0.993 and the lowest chlorophyll content root-mean-square error 0.66 μg/cm2. Using this index and optimized model, we mapped chlorophyll content distributions in all inspected cultivars. This study exhibits high potential of acousto-optic hyperspectral imagery for mapping spectral indices and choosing the optimal ones with respect to specific crop and environmental conditions.
Chlorophyll is responsible for capturing light energy and transferring it to other molecules that drive the synthesis of organic compounds. This pigment plays a vital role in maintaining the balance of oxygen and carbon dioxide in the atmosphere, making it essential for the survival of plants and many other organisms. Chlorophyll content (CC) indicates multiple physiological and ontogenetic characteristics at vegetative and generative developmental stages (Judkins & Wander, 1950; Zhang et al., 2009; Dai et al., 2016). Molecules of chlorophyll foster conversion of absorbed solar radiation into chemical energy by collecting photons and supplying electrons to the transport chain that results in the production of NADPH for Calvin-Benson cycle reactions (Blankenship, 2008). CC is defined by the plants’ productivity and stress from biotic and abiotic factors (Houborg et al., 2015). Thus, CC is a quantitative merit of photosynthetic capacity (Croft et al., 2017) and plant growth (Hotta et al., 1997). This information is necessary for timely and accurate decision-making regarding fertilization, irrigation and other agricultural activities. Moreover, CC correlates with nitrogen, which is an essential component of all proteins and nucleic acids (Liu et al., 2020; Sage et al., 1987) and plays an important role in development of new plant cells, crop growth, and plant metabolic activity.
Well-established techniques for CC measurements such as chromatography and spectrophotometry require an extract of plants and are quite time-consuming (Chappelle et al., 1992; Dhanapal et al., 2016). With accurate calibration, they provide concentrations of individual photosynthetic pigments and suit well for laboratory measurements (Pinckney et al., 1994). For field experiments, portable fluorescence spectrometers and colorimeters have been developed (Linder, 1974; Gitelson et al., 1999). These devices enable CC evaluation in individual plants in natural environmental conditions but are barely applicable to monitoring large areas with high spatial and temporal resolution.
For precision agriculture, variable deficit irrigation and many more agricultural tasks, mapping chlorophyll concentrations over large areas is necessary. That is why remote and high-throughput imaging modalities are in demand. Reflectance spectroscopy seems the most promising for fast and non-destructive evaluation of CC distribution among them. Spectral image acquisition and processing allows non-contact detection and quantification of multiple substances (Buddenbaum et al., 2015; Couture et al., 2016; Arellano et al., 2017). Rather low spectral and spatial resolution of remote spectral imaging systems and their sensitivity to environmental factors lead to inability of direct chemical composition measurements. To overcome these challenges and characterize foliage state and properties quantitatively, multiple vegetation indices (VI) have been introduced.
VIs are mathematical combinations of plant’s reflectance in a few spectral bands (Koh et al., 2022). Depending on the application, they normally involve two or three bands in visible and infrared ranges, and do not require the whole hyperspectral data cube. Thus, VIs deliver a simple and fast approach to extraction of multiple parameters of plant growth, phenology stress symptoms, photosynthetic activity, nutrient composition, etc. (Basso et al., 2004; Sharifi, 2020; Zhao et al., 2020). For CC evaluation, VIs are also widely in use (Haboudane et al., 2002; Wu et al., 2008; Qiao et al., 2022). Accurate calculation of chlorophyll concentration often requires exhaustive research on spectral reflectance for each plant and introduction of plant-specific models and indices (Daughtry et al., 2000a; Kooistra & Clevers, 2016; Cui et al., 2019). Even for one plant, chlorophyll indices (CIs) may differ depending on its type, vegetation stage, growing region, etc. (Lu et al., 2018; Wu et al., 2008). To map them and define the most accurate index, a single multi-spectral imaging system with a limited number of spectral channels is insufficient. When the best CI for a particular task is unknown, hyperspectral imaging (HSI) is preferrable. HSI data allows estimating multiple indices and weighing whether it makes sense to apply them for CC mapping under given environmental conditions.
Multiple whiskbroom (Green et al., 1998; Whiting et al., 2006; Perry & Roberts, 2008; Oppelt & Mauser, 2010) and pushbroom (Vane et al., 1983; Patel et al., 2010; Lucieer et al., 2014; Martín et al., 2023) hyperspectral systems have been proposed for CC monitoring in various crops. They require spatial scanning for HSI data cube acquisition and therefore are not optimal with respect to VI mapping applications when only several images at selected wavelengths are required. Hyperspectral imagers based on spectral scanning are able to collect images right in the spectral bands included in required chlorophyll indices (CIs) and thus enable data volume reduction as well as faster data acquisition and processing. The main approaches to the implementation of spectrally tunable imaging modality include Fabry-Perot (Pölönen et al., 2013), liquid crystal (Chen et al., 2008) or acousto-optical (Calpe-Maravilla et al., 2006) tunable filters.
In this study, we demonstrate the applicability of spectral-scanning hyperspectral imagery for selecting the optimal CI and extraction of accurate chlorophyll concentrations. We assembled the imager based on acousto-optical (AO) tunable filters (AOTFs) which are able to address assigned spectral bands randomly and rather fast (Hagen & Kudenov, 2013; Lu & Fei, 2014), and suit well for this task.
For the experiments, we chose soybeans. Soybean is the most important seed legume as well as a valuable ingredient in formulated feeds for poultry and fish (Agarwal et al., 2013). Soybeans are rich source of essential nutrients including manganese, phosphorus and iron for both farm animal feed and human consumption (Latifinia & Eisvand, 2022). Increasing the yield potential of soybeans is highly important due to growing demand in soyfood products. Soybean production sustainability is an important factor for food security and people’s quality of life (da Silva et al., 2021). The increased demand for soy driven by a growing need for meat, dairy, oil and aquaculture leads to the necessity of its productivity management and timely physiological diagnosis. Chlorophyll concentration in soybean foliage is an important indicator of the crop growth and health (Buttery & Buzzell, 1977; Brennan et al., 1987). Monitoring and immediate responding to CC temporal and spatial variability is one of the main ways to improve soybean production sustainability (Hesketh et al., 1981; Ma et al., 1995; Wang et al., 2020; Shi et al., 2023).
In our study, we selected soybean leaves of five different cultivars (Table 1). They are adapted to North Caucasus region, which is one of the major soybean planting territories in Russia (Sinegovskii et al., 2018) and one of the most perspective areas for extending soybean production in southern Europe (Nendel et al., 2023) due to mild climate similar to Central European weather conditions. These cultivars are resistant to lodging and diseases, and respond well to fertilizers and irrigation. Though these cultivars differ in plant height, vegetation period, ripeness group, protein content and yield, they all are successfully cultivated and possess rather high productivity (Table 1). In practice, they are often grown at the same fields, which means that CI and CI-based model for CC evaluation should suit all of them. Such a wide variety of properties within one plant allowed us to check the proposed strategy of choosing the optimal index for accurate CC extraction from spectral-scanning HSI imagery.
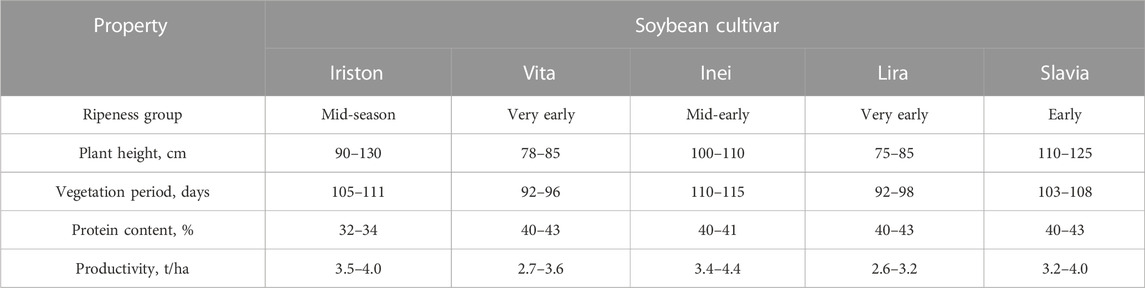
TABLE 1. Main features of the experimental plants.
Location, orientation, dimensions and appearance of the experimental field are shown in Figure 1. Its total area is 964 m2. It consists of 15 equal plots, i.e., 3 plots per each of 5 selected soybean cultivars. The seeding rate is 500,000 germinating soybean seeds per ha−1. The natural background of mineral fertilizers is N30P45K45. We sowed all plants on 6 May 2022 and carried out the presented spectrophotometric and HSI studies on 30 August 2022.
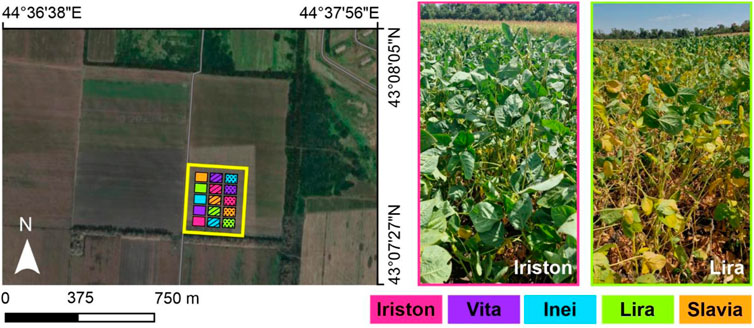
FIGURE 1. Image of the experimental field (left) with the region involved in the study (yellow rectangle). Colors of 15 plots correspond to five selected soybean cultivars. Three types of plot hatching designate the duplicate number. Right part of the figure illustrates the images of two plots with Iriston and Lira soybean cultivars.
The field is located in the forest-steppe zone on the Ossetian sloping plain. The average annual temperature is 8.4°C. Yearly mean relative humidity is 77%. Mean annual precipitation is 670 mm and is distributed unevenly over the seasons. In winter (from December to March), the precipitation is just about 120 mm. Rains in the warm season are mostly short and intense. Dry periods in summer may last 18–20 days.
The soil of the field is leached chernozem characterized by a high content of nitrogen and phosphorus. Granulometric composition of the soil includes 25%–30% of sand (0.05–1.00 mm) and 30%–40% of dust (0.001–0.05 mm) fractions. Hydrolytic acidity is low and does not exceed 2.4–3.0 meq/100 g soil in the upper horizon. Degree of saturation is about 95%. Total porosity is 47%–57%. Ph value of the soil is 6.5. The topsoil layer contains 3.3%–4.7% of humus.
For the experiments, we assembled the laboratory setup shown in Figure 2. It includes 150 W halogen light source (Dedolight DLH4) LS and AOTF-based HSI system. Optical system includes two AO cells AOC1 and AOC2. Each of them is driven from PC via control unit CU and operates as an AOTF. Tandem AO filtration ensures absence of chromatic shift between the spectral images (Machikhin et al., 2015) and simplifies setup calibration and data processing. By varying the ultrasound frequency applied to AOC1 and AOC2, one can obtain the image of the sample at any wavelength within 450–850 nm range with spectral bandwidth 5 nm (at 632 nm), field of view 5° × 5° and spatial resolution 500 × 500 pixels (Pozhar et al., 2018).
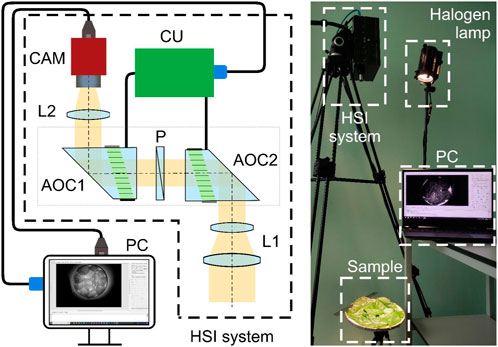
FIGURE 2. Scheme (left) and appearance (right) of the experimental setup. It consists of the light source (LS) for sample illumination, AOTF-based HSI system for data acquisition and PC for data processing and storage. HSI system includes two acousto-optical crystals AOC1 and AOC2 with polarizer P located between them, optical couplers L1 and L2, AOTF control unit CU and monochrome camera CAM.
To obtain reference CC values, we carried out a well-established spectrophotometric analysis. Measurement procedure is illustrated in Figure 3. To prepare solution, we cut the leaves manually and mixed them (3 g) with 96% ethanol (25 mL) and crushed glass (5 g), shook this mixture in a conical flask within 90 min and then filtered through paper filter. Solution’s absorbance spectrum measured by spectrophotometer (SF-2000) allows accurate estimation of the optical density D at the red peaks of chlorophyll a (Chl a) and chlorophyll b (Chl b), i.e., at the wavelengths 649 nm and 665 nm. To get reliable reference values of D649 and D665, we repeated the measurements three times and averaged the obtained CC values.
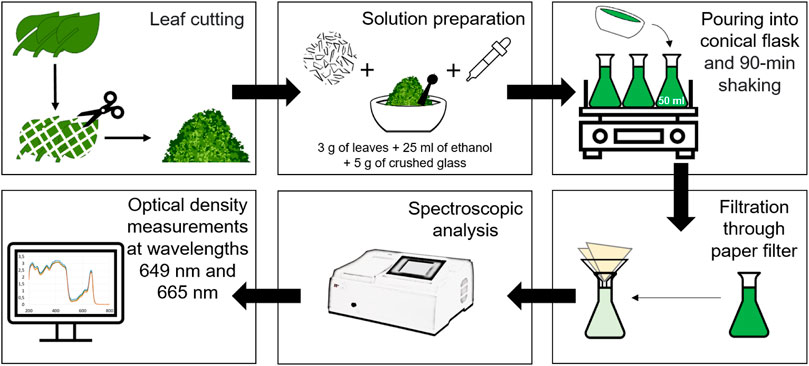
FIGURE 3. Protocol of spectrophotometric analysis applied for reference CC measurements.
The relationships between the optical densities D649 and D665 and chlorophyll Chl a and Chl b concentrations are given by the following equations (Wintermans & de Mots, 1965):
Values of Chl a and Chl b in these equations are volumetric and expressed in mg/L. To transform them to μg/cm2 and get area-averaged values Chls, we applied the formula given in (Datt, 1998):
where
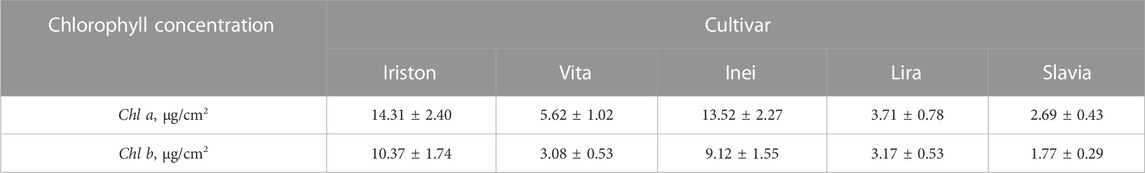
TABLE 2. Reference СС values obtained from three (spectrophotometric) measurements.
Inspected leaves were placed in 25 cm white plate with uniform spectral reflectivity (Figure 2). For radiometric calibration of the setup, reflectance spectrum of the plate ISP_REF(λ) and LS illumination spectrum ISP_LS(λ) were measured by spectrometer (Ocean Insight Flame-T-UV-VIS). To correct spatio-spectral distortion caused by illumination non-uniformity, optical vignetting, wavelength-dependent sensor’s quantum efficiency and transmittance of the optical components (Yu et al., 2015; Henriksen, 2019), 401 spectral images of the empty plate IHSI_REF(x,y,λ) in the range 450–850 nm with 1 nm step at exposure time 50 m were collected.
In the experiments, we acquired five hyperspectral data cubes IHSI_SAM(x,y,λ) of the soybean leaves of each cultivar at the same wavelengths λ as IHSI_REF(x,y,λ). After high-frequency noise smoothing by median and Gauss filtration, spatial distribution of spectral reflectivity R(x,y,λ) of the inspected sample may be calculated as
Since the leaves may not cover the entire plate, we filtered out the leaf-free pixels using the spectral angle mapping (SAM) classification method (Padma & Sanjeevi, 2014). To implement it, we calculated spectral angle map to mark pixels in which the dependence R(λ) differs greatly from typical foliage reflectivity. As soon as hyperspectral cube R(x,y,λ) is calculated, we may evaluate and map any CIs. Complete hyperspectral data processing pipeline implemented in MATLAB is shown in Figure 4.
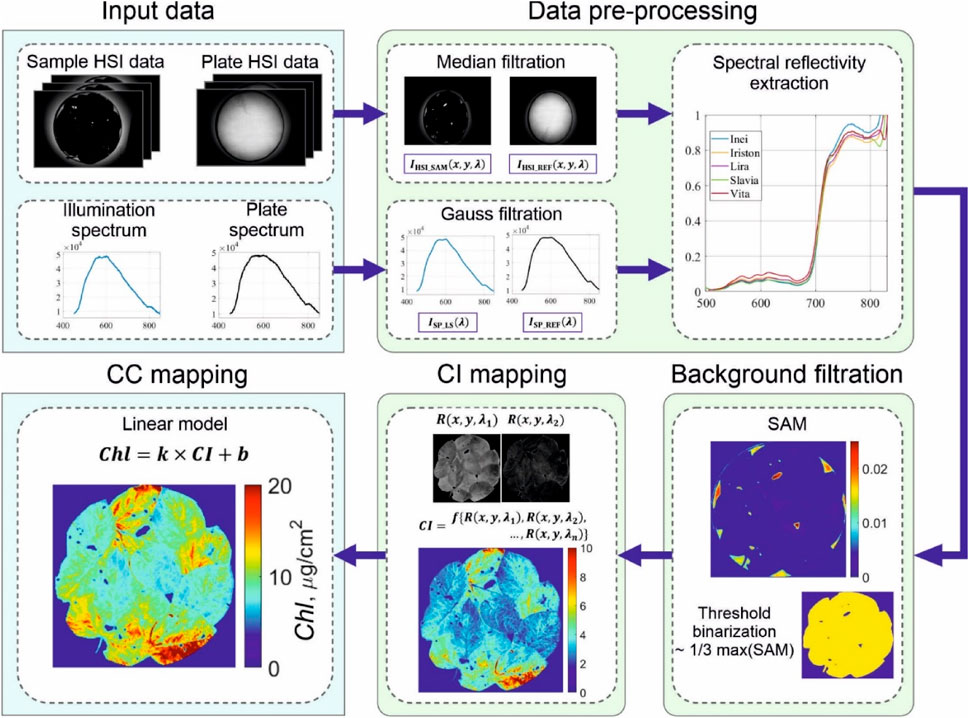
FIGURE 4. Data processing pipeline implemented for chlorophyll concentration mapping. It requires light source illumination and plate reflectance spectra as well as spectral images of the sample and an empty plate. Joint processing of these data allows accurate measuring the spectral reflectivity R (x,y,λ) of the sample and background removal. After R (x,y,λ) is obtained, any CI may be evaluated and then converted to chlorophyll concentration Сhl via linear model.
We selected 14 indices reported as effective for chlorophyll concentration measurements in certain conditions. All these CIs are calculated from the sample’s reflectivity values in the wavelength range 500–800 nm available in our experimental setup. Table 3 presents their definitions, reported applications, achieved coefficients of determination R2 and reference sources.
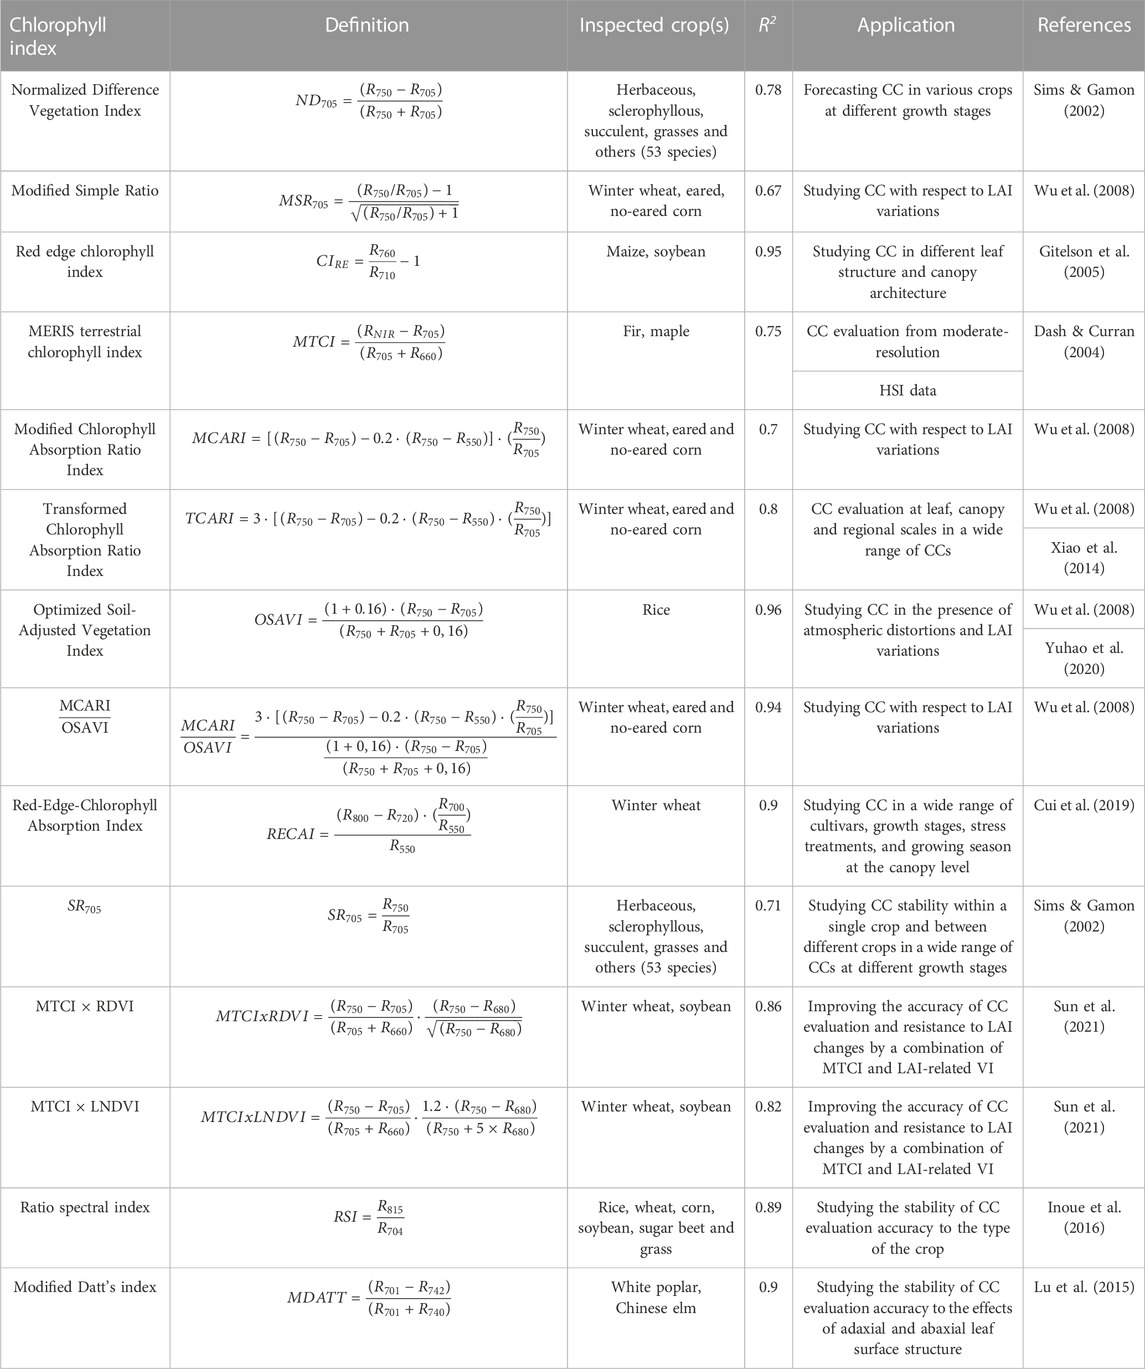
TABLE 3. Selected CIs, their definitions, reported applications and reference sources.
The index-based models for CC evaluation are mainly linear (Dorigo et al., 2007). To establish how well selected СIs (Table 3) calculated from HSI data and averaged over the samples area fit the reference CC values (Table 2), we calculated coefficient of determination R2 (Figure 5).
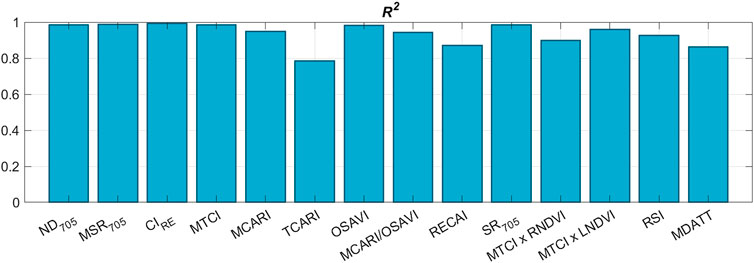
FIGURE 5. Coefficient of determination R2 of linear correlation between average values of calculated CIs and reference CCs for all experimental plants.
We may see that almost all CIs have high linear correlation with spectroscopic CC measurements. To proceed with data processing and CC mapping, six CIs were selected based on two criteria. Firstly, they needed to have a high R2 value. Secondly, they should be applicable for СС measurements on individual leaves without requiring the introduction of leaf area index (LAI) to the mathematical model or the need for experimental retrieval of LAI (Zheng & Moskal, 2009). As a result, the following indices were selected: ND705, MSR705, CIRE, MCARI/OSAVI, MCARI, and OSAVI. The LAI-free CC measurement capability has been previously validated for all of these indices on certain crops (Table 4).
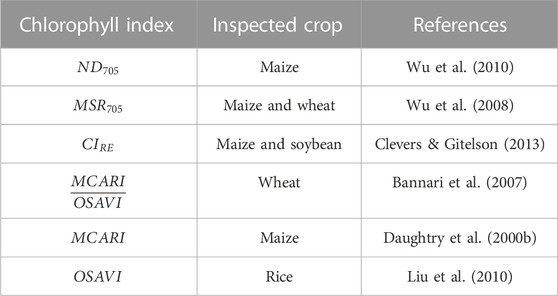
TABLE 4. CIs with the highest R2 values (Figure 5) and LAI-free CC measurement capability demonstrated for different crops.
Model for measurement of chlorophyll concentration, CC is largely predetermined by location, growing season length and other factors specific for plant cultivation in a particular region (Li et al., 2018). Though the selected CIs demonstrate high correlation with reference measurements (Figure 5), reported models (Table 4) based on these indices may be inefficient for CC measurements in our soybean experiment. Thus, we calculated parameters of the models Chl = k × CI – b via linear regression of the experimental data for 6 selected CIs. Parameters k and b as well as coefficient of determination R2 and CC root-mean-square error (RMSE) for all obtained models are presented in Table 5.
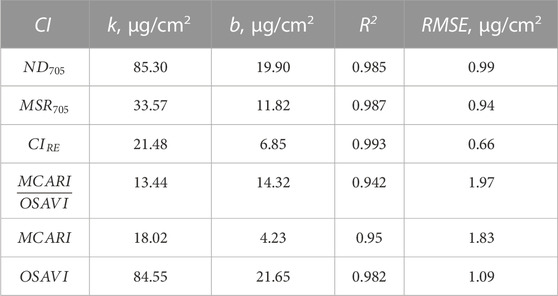
TABLE 5. Calculated parameters k and b of linear models Chl = k × CI – b used to evaluate chlorophyll concentrations Chl from various CIs, and the corresponding values of the error functions (R2 and RMSE).
All 6 models have R2 close to 1 and rather low RMSE. To compare CIs and obtained CI-based models in terms of HSI CC measurements, we calculated CC distributions with each of them. Table 6 shows CC values in different soybean cultivars averaged over the area covered with the leaves. All obtained models deliver similar results close to the reference values with maximal error less than 3.78 μg/cm2. To proceed with CC mapping, we chose index ClRE, which provides the smallest RMSE (Table 5).

TABLE 6. Average chlorophyll concentrations obtained from reference spectrophotometric (ChlREF) and CI-based (ChlINDEX) measurements.
After we identified ClRE as the best CI for our experimental data and optimized the parameters of CC calculation model based on this index, we may demonstrate CC mapping capability of our AOTF-based HSI system. CIRE includes reflectivity at just two wavelengths, i.e., 710 nm and 760 nm. Thus, after 14 selected CIs were analyzed, we found that CC maps in our experiment may be calculated from just two spectral images. All other images in the acquired hyperspectral cubes turned out to be excessive in our particular case. Figure 6 illustrates the examples of CIRE and CC distributions across the inspected leaves of five soybean cultivars. Histograms in Figure 6D represent the frequency distributions of CC values in these maps. Mean values in the histograms are close to the reference CC values for the same cultivars presented in Table 2. This fact confirms the correctness of the chlorophyll concentration evaluation.
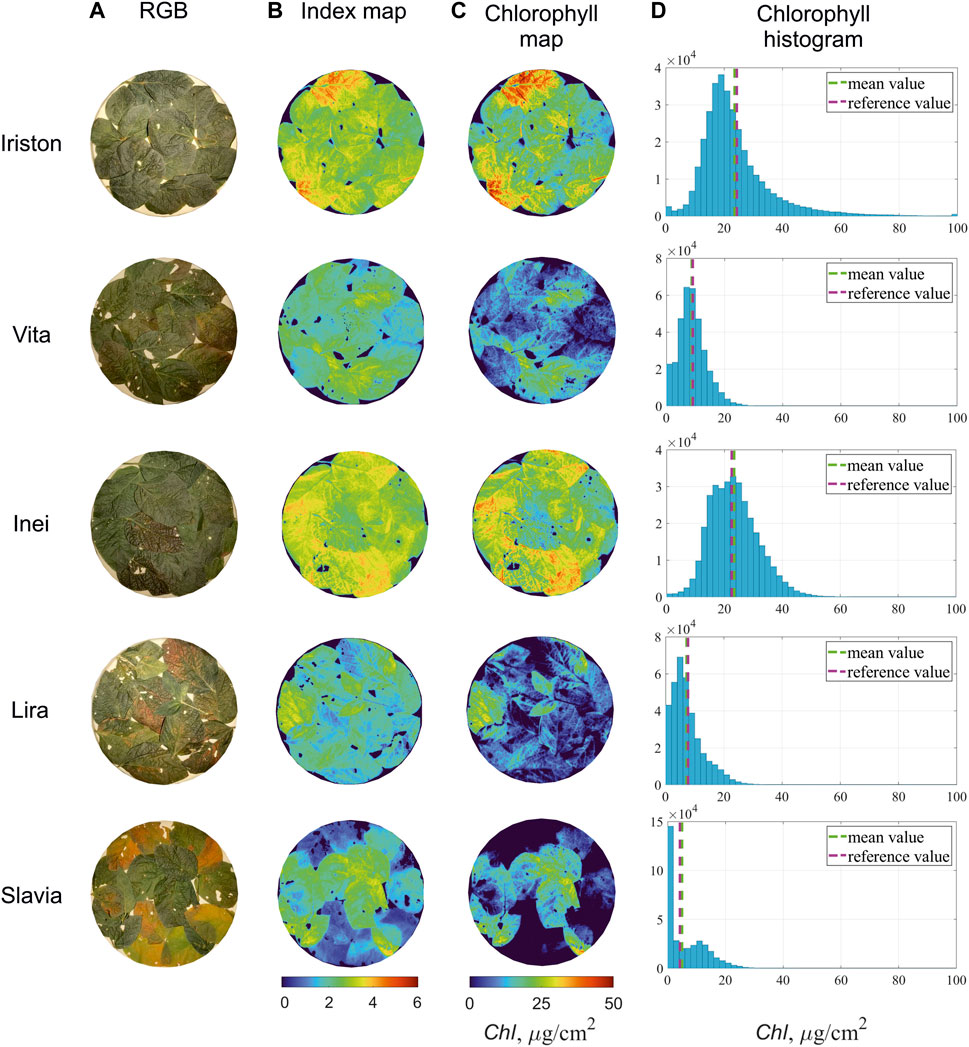
FIGURE 6. Color images of inspected soybean leaves (A) and calculated maps of the index CIRE (B). Chlorophyll concentration distributions (C) are evaluated from CIRE maps (B) using linear model presented in Table 5. Chlorophyll histograms (D) illustrate frequency distributions of CC values in (C) and shows that their mean values (green dashed line) are close to the reference ones (pink dashed line).
Precise two-dimensional distribution of chlorophyll concentration indicates the efficiency of the photosynthesis process as well as sheds the light on the properties and state of the plants. CC is dependent on multiple soil-climate conditions and thus is non-constant in time and space. Development of temporal and spatial patterns for CC dynamics even for a specific field requires big statistical data collection and leads to inevitable inaccuracies due to barely predictable environmental factors. For precise chlorophyll concentration measurements, any index-based model has to be verified with respect to current reference measurements.
When a well-proven CI for specific crop and field is unknown, CC evaluation becomes even more difficult. In this case, it is necessary to define the most suitable CI first, then specify the CC estimation model and apply it to calculate CC distribution. That is why it is important to have the system able to collect spectral images in the wavelength bands involved in the indices that may suit. For this application, the entire HSI data cube is excessive in terms of data volume and acquisition time, and thus spectrally tunable systems seem much more effective than pushbroom imagers.
We demonstrated the flexibility of AO imagery by calculating and comparing well-known CIs for extraction CC distribution in soybean leaves. We showed experimentally that AOTF-based hyperspectral imager allows CC mapping in a few soybean cultivars without a priori information on the proper CI. We selected 14 potential CI candidates, then chose six of them with suitable reported models and finally left only one, which had the highest correlation with reference measurements. In fact, we could limit the number of spectral images to 16 that were necessary for evaluating 14 CIs or then to 5 to compare 6 indices with LAI-free models. As soon as the proper CI and CC calculation model are specified, the imager can switch between just two wavelengths involved in CIRE and map CC very fast. Wavelength scanning often considered as the drawback of such systems is almost insignificant in this mode. Further periodic reference measurements and correction of the model will lead to reliable spatio-temporal dynamics of measured CC distribution. If we considered more than 14 CI candidates, we would need more than 16 spectral images but the discussed strategy for choosing the best CI would stay the same.
Though we demonstrated the proposed approach to the best CI selection and CC mapping with AOTF-based HSI system, it is applicable to any spectral-scanning hyperspectral imager. Due to ability to tune precisely to the required wavelengths, such imager may be efficient for various VI-related mapping tasks and is a good all-in-one alternative to multiple devices with fixed amount and positions of spectral channels.
Further research may be related to field CC mapping experiments with respect to LAI, recognition of symptomatic stress and disease signatures using machine-learning algorithms and long-term in-lab studies of photosynthetic features.
AO spectral imaging systems deliver a good compromise in terms of spectral bandwidth, tuning range, aperture and switching time. Being compact, solid state and electronically controlled, AOTFs seem attractive for building reliable and versatile devices. Ability to address rapidly and accurately any wavelengths eliminates the need to collect the entire hyperspectral data cube and thus fosters fast data collection and processing. This feature is especially important with regard to VI mapping tasks. When the index is predefined, AOTF-based system enables immediate acquisition of images in the required spectral bands and mapping any parameters calculated from the index. In this study, we demonstrated the efficiency of AO imager when it is necessary to compare VIs and VI-based models and estimate whether they make sense for particular task. We validated this approach on CC mapping, i.e., found the most suitable CI and calculated chlorophyll maps of five soybean cultivars. This study exhibits high potential of AO hyperspectral imaging for precise chlorophyll mapping as well as for many more index-related biological and agricultural applications.
The main data generated and analyzed during this study are included in this article. MATLAB source code of the algorithm and test datasets are available at https://drive.google.com/drive/folders/1hpK2kc1_xT2l-qIPOfueM-c7oG5sc_24?usp=share_link and from the corresponding author upon reasonable request.
Conceptualization, AM; methodology, AG and VG; software, AZ; validation, AM; investigation, AG, AZ, VG, and VT; resources, AG, AM, VG, and VT; writing—original draft preparation, AM and AZ; review and editing, AZ, AM, VG, and VT; visualization, AZ and AG; supervision, AM; project administration, AG and AM; funding acquisition, AG All authors have read and agreed to the published version of the manuscript.
This study is supported by the Ministry of Science and Higher Education of the Russian Federation through Priority 2030 program (Bauman GoGreen strategic project #PRIOR/SN/NU/22/SP1/7). The experimental setup and image acquisition software were developed within Federal State Task Program of Scientific and Technological Center of Unique Instrumentation of the Russian Academy of Sciences (project #FFNS-2022-0010).
This study was performed using the equipment of the Shared Research Facilities of the Scientific and Technological Centre of Unique Instrumentation of the Russian Academy of Sciences.
The authors declare that the research was conducted in the absence of any commercial or financial relationships that could be construed as a potential conflict of interest.
All claims expressed in this article are solely those of the authors and do not necessarily represent those of their affiliated organizations, or those of the publisher, the editors and the reviewers. Any product that may be evaluated in this article, or claim that may be made by its manufacturer, is not guaranteed or endorsed by the publisher.
Agarwal, D. K., Billore, S. D., Sharma, A. N., Dupare, B. U., and Srivastava, S. K. (2013). Soybean: Introduction, improvement, and utilization in India-problems and prospects. Agric. Res. 2 (4), 293–300. doi:10.1007/S40003-013-0088-0
Arellano, P., Tansey, K., Balzter, H., and Tellkamp, M. (2017). Plant family-specific impacts of petroleum pollution on biodiversity and leaf chlorophyll content in the amazon rainforest of Ecuador. PLOS ONE 12 (1), e0169867. doi:10.1371/JOURNAL.PONE.0169867
Bannari, A., Khurshid, K. S., Staenz, K., and Schwarz, J. W. (2007). A comparison of hyperspectral chlorophyll indices for wheat crop chlorophyll content estimation using laboratory reflectance measurements. IEEE Trans. Geoscience Remote Sens. 45 (10), 3063–3074. doi:10.1109/TGRS.2007.897429
Basso, B., Cammarano, D., and De Vita, P. (2004). Remotely sensed vegetation indices: Theory and applications for crop management. Riv. Ital. Di Agrometeorol. 1, 36–53.
Blankenship, R. E. (2008). Molecular mechanisms of photosynthesis. Molecular mechanisms of photosynthesis. New Jersey, OH, USA: Wiley-Blackwell. doi:10.1002/9780470758472
Brennan, E., Leone, I., Greenhalgh, B., and Smith, G. (1987). Chlorophyll content of soybean foliage in relation to seed yield and ambient ozone pollution. JAPCA 37, 1429–1433. doi:10.1080/08940630.1987.10466338
Buddenbaum, H., Stern, O., Paschmionka, B., Hass, E., Gattung, T., Stoffels, J., et al. (2015). Using VNIR and SWIR field imaging spectroscopy for drought stress monitoring of beech seedlings. Int. J. Remote Sens. 36 (18), 4590–4605. doi:10.1080/01431161.2015.1084435
Buttery, B. R., and Buzzell, R. I. (1977). The relationship between chlorophyll content and rate of photosynthesis in soybeans. Can. J. Plant Sci. 57 (1), 1–5. doi:10.4141/CJPS77-001
Calpe-Maravilla, J., Vila-Francés, J., Ribes-Gómez, E., Durán-Bosch, V., Muñoz-Mari, J., Amorós-Lopez, J., et al. (2006). 400– to 1000–nm imaging spectrometer based on acousto-optic tunable filters. J. Electron. Imaging 15 (2), 023001. doi:10.1117/1.2201057
Chappelle, E. W., Kim, M. S., and McMurtrey, J. E. (1992). Ratio analysis of reflectance spectra (RARS): An algorithm for the remote estimation of the concentrations of chlorophyll A, chlorophyll B, and carotenoids in soybean leaves. Remote Sens. Environ. 39 (3), 239–247. doi:10.1016/0034-4257(92)90089-3
Chen, C. T., Chen, S., Wang, C. Y., Yang, I. C., Hsiao, S. C., and Tsai, C. Y. (2008). Evaluation of nitrogen content in cabbage seedlings using hyper-spectral images. Sens. Instrum. Food Qual. Saf. 2 (2), 97–102. doi:10.1007/S11694-008-9041-5
Clevers, J. G. P. W., and Gitelson, A. A. (2013). Remote estimation of crop and grass chlorophyll and nitrogen content using red-edge bands on Sentinel-2 and -3. Int. J. Appl. Earth Observation Geoinformation 23 (1), 344–351. doi:10.1016/J.JAG.2012.10.008
Couture, J. J., Singh, A., Rubert-Nason, K. F., Serbin, S. P., Lindroth, R. L., and Townsend, P. A. (2016). Spectroscopic determination of ecologically relevant plant secondary metabolites. Methods Ecol. Evol. 7 (11), 1402–1412. doi:10.1111/2041-210X.12596
Croft, H., Chen, J. M., Luo, X., Bartlett, P., Chen, B., and Staebler, R. M. (2017). Leaf chlorophyll content as a proxy for leaf photosynthetic capacity. Glob. Change Biol. 23 (9), 3513–3524. doi:10.1111/GCB.13599
Cui, B., Zhao, Q., Huang, W., Song, X., Ye, H., and Zhou, X. (2019). A new integrated vegetation index for the estimation of winter wheat leaf chlorophyll content. Remote Sens. 11, 974. doi:10.3390/rs11080974
da Silva, R. F. B., Viña, A., Moran, E. F., Dou, Y., Batistella, M., and Liu, J. (2021). Socioeconomic and environmental effects of soybean production in metacoupled systems. Sci. Rep. 11, 18662. doi:10.1038/s41598-021-98256-6
Dai, W., Girdthai, T., Huang, Z., Ketudat-Cairns, M., Tang, R., and Wang, S. (2016). Genetic analysis for anthocyanin and chlorophyll contents in rapeseed. Ciência Rural. 46 (5), 790–795. doi:10.1590/0103-8478CR20150564
Dash, J., and Curran, P. J. (2004). The MERIS terrestrial chlorophyll index. Int. J. Remote Sens. 25 (23), 5403–5413. doi:10.1080/0143116042000274015
Datt, B. (1998). Remote sensing of chlorophyll a, chlorophyll b, chlorophyll a+b, and total carotenoid content in Eucalyptus leaves. Remote Sens. Environ. 66 (2), 111–121. doi:10.1016/S0034-4257(98)00046-7
Daughtry, C. S. T., Walthall, C. L., Kim, M. S., de Colstoun, E. B., and McMurtrey, J. E. (2000). Estimating corn leaf chlorophyll concentration from leaf and canopy reflectance. Remote Sens. Environ. 74 (2), 229–239. doi:10.1016/S0034-4257(00)00113-9
Dhanapal, A. P., Ray, J. D., Singh, S. K., Hoyos-Villegas, V., Smith, J. R., Purcell, L. C., et al. (2016). Genome-wide association mapping of soybean chlorophyll traits based on canopy spectral reflectance and leaf extracts. BMC Plant Biol. 16, 174. doi:10.1186/S12870-016-0861-X
Dorigo, W. A., Zurita-Milla, R., de Wit, A. J. W., Brazile, J., Singh, R., and Schaepman, M. E. (2007). A review on reflective remote sensing and data assimilation techniques for enhanced agroecosystem modeling. Int. J. Appl. Earth Observation Geoinformation 9 (2), 165–193. doi:10.1016/J.JAG.2006.05.003
Gitelson, A. A., Buschmann, C., and Lichtenthaler, H. K. (1999). The chlorophyll fluorescence ratio F735/F700 as an accurate measure of the chlorophyll content in plants. Remote Sens. Environ. 69 (3), 296–302. doi:10.1016/S0034-4257(99)00023-1
Gitelson, A. A., Viña, A., Ciganda, V., Rundquist, D. C., and Arkebauer, T. J. (2005). Remote estimation of canopy chlorophyll content in crops. Geophys. Res. Lett. 32 (8), 1–4. doi:10.1029/2005GL022688
Green, R. O., Eastwood, M. L., Sarture, C. M., Chrien, T. G., Aronsson, M., Chippendale, B. J., et al. (1998). Imaging spectroscopy and the airborne visible/infrared imaging spectrometer (AVIRIS). Remote Sens. Environ. 65 (3), 227–248. doi:10.1016/S0034-4257(98)00064-9
Haboudane, D., Miller, J. R., Tremblay, N., Zarco-Tejada, P. J., and Dextraze, L. (2002). Integrated narrow-band vegetation indices for prediction of crop chlorophyll content for application to precision agriculture. Remote Sens. Environ. 81 (2), 416–426. doi:10.1016/S0034-4257(02)00018-4
Hagen, N. A., and Kudenov, M. W. (2013). Review of snapshot spectral imaging technologies. Opt. Eng. 52 (9), 090901. doi:10.1117/1.OE.52.9.090901
Henriksen, M. B. (2019). Hyperspectral imager calibration and image correction. dissertation/master's thesis (Trondheim, Norway: Norwegian University of Science and Technology).
Hesketh, J. D., Ogren, W. L., Hageman, M. E., and Peters, D. B. (1981). Correlations among leaf CO2-exchange rates, areas and enzyme activities among soybean cultivars. Photosynth. Res. 2, 21–30. doi:10.1007/BF00036162
Hotta, Y., Tanaka, T., Takaoka, H., Takeuchi, Y., and Konnai, M. (1997). New physiological effects of 5-aminolevulinic acid in plants: The increase of photosynthesis, chlorophyll content, and plant growth. Biosci. Biotechnol. Biochem. 61 (12), 2025–2028. doi:10.1271/BBB.61.2025
Houborg, R., McCabe, M. F., Cescatti, A., and Gitelson, A. A. (2015). Leaf chlorophyll constraint on model simulated gross primary productivity in agricultural systems. Int. J. Appl. Earth Observation Geoinformation 43, 160–176. doi:10.1016/J.JAG.2015.03.016
Inoue, Y., Guérif, M., Baret, F., Skidmore, A., Gitelson, A., Schlerf, M., et al. (2016). Simple and robust methods for remote sensing of canopy chlorophyll content: A comparative analysis of hyperspectral data for different types of vegetation. Plant, Cell and Environ. 39 (12), 2609–2623. doi:10.1111/PCE.12815
Judkins, W. P., and Wander, I. W. (1950). Correlation between leaf color, leaf nitrogen content, and growth of apple, peach, and grape plants. Plant Physiol. 25 (1), 78–85. doi:10.1104/PP.25.1.78
Koh, J. C. O., Banerjee, B. P., Spangenberg, G., and Kant, S. (2022). Automated hyperspectral vegetation index derivation using a hyperparameter optimisation framework for high-throughput plant phenotyping. New Phytol. 233 (6), 2659–2670. doi:10.1111/NPH.17947
Kooistra, L., and Clevers, J. G. P. W. (2016). Estimating potato leaf chlorophyll content using ratio vegetation indices. Remote Sens. Lett. 7 (6), 611–620. doi:10.1080/2150704X.2016.1171925
Latifinia, E., and Eisvand, H. R. (2022). Soybean physiological properties and grain quality responses to nutrients, and predicting nutrient deficiency using chlorophyll fluorescence. J. Soil Sci. Plant Nutr. 22 (2), 1942–1954. doi:10.1007/S42729-022-00785-0
Li, Y., Apiolaza, L. A., and Altaner, C. (2018). Genetic variation in heartwood properties and growth traits of Eucalyptus bosistoana. Eur. J. For. Res. 137 (4), 565–572. doi:10.1007/S10342-018-1125-0
Linder, S. (1974). A proposal for the use of standardized methods for chlorophyll determinations in ecological and eco-physiological investigations. Physiol. Plant. 32 (2), 154–156. doi:10.1111/J.1399-3054.1974.TB03743.X
Liu, M., Liu, X., Li, M., Fang, M., and Chi, W. (2010). Neural-network model for estimating leaf chlorophyll concentration in rice under stress from heavy metals using four spectral indices. Biosyst. Eng. 106 (3), 223–233. doi:10.1016/J.BIOSYSTEMSENG.2009.12.008
Liu, T., Pan, Y., Lu, Z., Ren, T., and Lu, J. (2020). Canopy light and nitrogen distribution are closely related to nitrogen allocation within leaves in Brassica napus L. Field Crops Res. 258, 107958. doi:10.1016/J.FCR.2020.107958
Lu, G., and Fei, B. (2014). Medical hyperspectral imaging: A review. J. Biomed. Opt. 19 (1), 010901. doi:10.1117/1.JBO.19.1.010901
Lu, S., Lu, F., You, W., Wang, Z., Liu, Y., and Omasa, K. (2018). A robust vegetation index for remotely assessing chlorophyll content of dorsiventral leaves across several species in different seasons. Plant Methods 14 (1), 15. doi:10.1186/S13007-018-0281-Z
Lu, S., Lu, X., Zhao, W., Liu, Y., Wang, Z., and Omasa, K. (2015). Comparing vegetation indices for remote chlorophyll measurement of white poplar and Chinese elm leaves with different adaxial and abaxial surfaces. J. Exp. Bot. 66 (18), 5625–5637. doi:10.1093/JXB/ERV270
Lucieer, A., Malenovský, Z., Veness, T., and Wallace, L. (2014). HyperUAS—imaging spectroscopy from a multirotor unmanned aircraft system. J. Field Robotics 31 (4), 571–590. doi:10.1002/ROB.21508
Ma, B. L., Morrison, M. J., and Voldeng, H. D. (1995). Leaf greenness and photosynthetic rates in soybean. Crop Sci. 35 (5), 1411–1414. doi:10.2135/CROPSCI1995.0011183X003500050025X
Machikhin, A., Pozhar, V., and Batshev, V. (2015). Double-AOTF-based aberration-free spectral imaging endoscopic system for biomedical applications. J. Innovative Opt. Health Sci. 8, 1541009. doi:10.1142/S1793545815410096
Martín, M. P., Ponce, B., Echavarría, P., Dorado, J., and Fernández-Quintanilla, C. (2023). Early-season mapping of johnsongrass (sorghum halepense), common cocklebur (Xanthium strumarium) and velvetleaf (abutilon theophrasti) in corn fields using airborne hyperspectral imagery. Agronomy 13 (2), 528. doi:10.3390/AGRONOMY13020528
Nendel, C., Reckling, M., Debaeke, P., Schulz, S., Berg-Mohnicke, M., Constantin, J., et al. (2023). Future area expansion outweighs increasing drought risk for soybean in Europe. Glob. Change Biol. 29 (5), 1340–1358. doi:10.1111/GCB.16562
Oppelt, N., and Mauser, W. (2010). Hyperspectral monitoring of physiological parameters of wheat during a vegetation period using AVIS data. Int. J. Remote Sens. 25 (1), 145–159. doi:10.1080/0143116031000115300
Padma, S., and Sanjeevi, S. (2014). Jeffries matusita-spectral angle mapper (JM-SAM) spectral matching for species level mapping at bhitarkanika, muthupet and pichavaram mangroves. Int. Archives Photogrammetry, Remote Sens. Spatial Inf. Sci. 8 (8), 1403–1411. doi:10.5194/ISPRSARCHIVES-XL-8-1403-2014
Patel, N. K., Patnaik, C., Dutta, S., Shekh, A. M., and Dave, A. J. (2010). Study of crop growth parameters using Airborne Imaging Spectrometer data. Int. J. Remote Sens. 22 (12), 2401–2411. doi:10.1080/01431160117383
Perry, E. M., and Roberts, D. A. (2008). Sensitivity of narrow-band and broad-band indices for assessing nitrogen availability and water stress in an annual crop. Agron. J. 100 (4), 1211–1219. doi:10.2134/AGRONJ2007.0306
Pinckney, J., Papa, R., and Zingmark, R. (1994). Comparison of high-performance liquid chromatographic, spectrophotometric, and fluorometric methods for determining chlorophyll a concentrations in estaurine sediments. J. Microbiol. Methods 19 (1), 59–66. doi:10.1016/0167-7012(94)90026-4
Pölönen, I., Saari, H., Kaivosoja, J., Honkavaara, E., and Pesonen, L. (2013). Hyperspectral imaging based biomass and nitrogen content estimations from light-weight UAV. Remote Sens. Agric. Ecosyst. Hydrology 8887, 141–149. doi:10.1117/12.2028624
Pozhar, V. E., Machikhin, A. S., Gaponov, M. I., Shirokov, S. v., Mazur, M. M., and Sheryshev, A. E. (2018). AOTF based hyperspectrometer for UAV. Light and Eng. 4, 47–50.
Qiao, L., Tang, W., Gao, D., Zhao, R., An, L., Li, M., et al. (2022). UAV-based chlorophyll content estimation by evaluating vegetation index responses under different crop coverages. Comput. Electron. Agric. 196, 106775. doi:10.1016/J.COMPAG.2022.106775
Sage, R. F., Pearcy, R. W., and Seemann, J. R. (1987). The nitrogen use efficiency of C(3) and C(4) plants: III. Leaf nitrogen effects on the activity of carboxylating enzymes in Chenopodium album (L.) and Amaranthus retroflexus (L.). Plant Physiol. 85 (2), 355–359. doi:10.1104/PP.85.2.355
Sharifi, A. (2020). Remotely sensed vegetation indices for crop nutrition mapping. J. Sci. Food Agric. 100 (14), 5191–5196. doi:10.1002/JSFA.10568
Shi, H., Guo, J., An, J., Tang, Z., Wang, X., Li, W., et al. (2023). Estimation of chlorophyll content in soybean crop at different growth stages based on optimal spectral index. Agronomy 13 (3), 663. doi:10.3390/AGRONOMY13030663
Sims, D. A., and Gamon, J. A. (2002). Relationships between leaf pigment content and spectral reflectance across a wide range of species, leaf structures and developmental stages. Remote Sens. Environ. 81 (2), 337–354. doi:10.1016/S0034-4257(02)00010-X
Sinegovskii, M., Yuan, S., Sinegovskaya, V., and Han, T. (2018). Current status of the soybean industry and research in the Russian Federation. 大豆通報 37 (1), 1–7.
Sun, Q., Jiao, Q., Qian, X., Liu, L., Liu, X., and Dai, H. (2021). Improving the retrieval of crop canopy chlorophyll content using vegetation index combinations. Remote Sens. 13 (3), 470. doi:10.3390/RS13030470
Vane, G., Goetz, A. F. H., and Wellman, J. B. (1983). Airborne imaging spectrometer: A new tool for remote sensing. IEEE Trans. Geoscience Remote Sens. GE- 22 (6), 546–549. doi:10.1109/TGRS.1984.6499168
Wang, L., Conteh, B., Fang, L., Xia, Q., and Nian, H. (2020). QTL mapping for soybean (Glycine max L.) leaf chlorophyll-content traits in a genotyped RIL population by using RAD-seq based high-density linkage map. BMC Genomics 21, 739. doi:10.1186/S12864-020-07150-4
Whiting, M. L., Ustin, S. L., Zarco-Tejada, P., Palacios-Orueta, A., and Vanderbilt, V. C. (2006). Hyperspectral mapping of crop and soils for precision agriculture. Remote Sens. Model. Ecosyst. Sustain. 6298, 84–98. doi:10.1117/12.681289
Wintermans, J. F. G. M., and de Mots, A. (1965). Spectrophotometric characteristics of chlorophylls a and b and their phenophytins in ethanol. Biochimica Biophysica Acta (BBA) - Biophysics Incl. Photosynth. 109 (2), 448–453. doi:10.1016/0926-6585(65)90170-6
Wu, C., Han, X., Niu, Z., and Dong, J. (2010). An evaluation of EO-1 hyperspectral Hyperion data for chlorophyll content and leaf area index estimation. Int. J. Remote Sens. 31 (4), 1079–1086. doi:10.1080/01431160903252335
Wu, C., Niu, Z., Tang, Q., and Huang, W. (2008). Estimating chlorophyll content from hyperspectral vegetation indices: Modeling and validation. Agric. For. Meteorology 148 (8), 1230–1241. doi:10.1016/J.AGRFORMET.2008.03.005
Xiao, Y., Zhao, W., Zhou, D., and Gong, H. (2014). Sensitivity analysis of vegetation reflectance to biochemical and biophysical variables at leaf, canopy, and regional scales. IEEE Trans. Geoscience Remote Sens. 52 (7), 4014–4024. doi:10.1109/TGRS.2013.2278838
Yu, X., Sun, Y., Fang, A., Qi, W., and Liu, C. (2015). Laboratory spectral calibration and radiometric calibration of hyper-spectral imaging spectrometer. Int. Conf. Syst. Inf. ICSAI, 871–875. doi:10.1109/ICSAI.2014.7009407
Yuhao, A., Norasma, N., Ya, C., Roslin, A., and Ismail, M. R. (2020). Rice chlorophyll content monitoring using vegetation indices from multispectral aerial imagery. Pertanika J. Sci. Technol 28 (3), 779–795.
Zhang, K., Zhang, Y., Chen, G., and Tian, J. (2009). Genetic analysis of grain yield and leaf chlorophyll content in common wheat. Cereal Res. Commun. 37 (4), 499–511. doi:10.1556/CRC.37.2009.4.3
Zhao, H., Yang, C., Guo, W., Zhang, L., and Zhang, D. (2020). Automatic estimation of crop disease severity levels based on vegetation index normalization. Remote Sens. 12, 1930:12, doi:10.3390/RS12121930
Keywords: chlorophyll mapping, hyperspectral imaging (HSI), remote sensing, acousto-optic filtration, data processing
Citation: Zolotukhina A, Machikhin A, Guryleva A, Gresis V and Tedeeva V (2023) Extraction of chlorophyll concentration maps from AOTF hyperspectral imagery. Front. Environ. Sci. 11:1152450. doi: 10.3389/fenvs.2023.1152450
Received: 27 January 2023; Accepted: 03 April 2023;
Published: 20 April 2023.
Edited by:
Keshav Singh, Agriculture and Agri-Food Canada (AAFC), CanadaReviewed by:
Nasem Badreldin, University of Manitoba, CanadaCopyright © 2023 Zolotukhina, Machikhin, Guryleva, Gresis and Tedeeva. This is an open-access article distributed under the terms of the Creative Commons Attribution License (CC BY). The use, distribution or reproduction in other forums is permitted, provided the original author(s) and the copyright owner(s) are credited and that the original publication in this journal is cited, in accordance with accepted academic practice. No use, distribution or reproduction is permitted which does not comply with these terms.
*Correspondence: Anastasia Guryleva, Z3VyeWxldmEuYXZAbnRjdXAucnU=
Disclaimer: All claims expressed in this article are solely those of the authors and do not necessarily represent those of their affiliated organizations, or those of the publisher, the editors and the reviewers. Any product that may be evaluated in this article or claim that may be made by its manufacturer is not guaranteed or endorsed by the publisher.
Research integrity at Frontiers
Learn more about the work of our research integrity team to safeguard the quality of each article we publish.