 K. D. Bal
 V. Louw3
 K. K. Ayisi
 J. Schoelynck
- 1Department of Biodiversity, University of Limpopo, Sovenga, South Africa
- 2Risk and Vulnerability Science Centre (RVSC), University of Limpopo, Sovenga, South Africa
- 3Department of Biology, Ecosphere Research Group, University of Antwerp, Antwerp, Belgium
- 4DSI/NRF SARChI Chair in Ecosystem Health, Department of Biodiversity, University of Limpopo, Sovenga, South Africa
- 5Department of Communication, Media and Information Studies, University of Limpopo, Sovenga, South Africa
Anthropogenic land use alters soil properties and influences biological transformations in the root zone, thereby affecting the distribution and supply of soil nutrients. It is generally acknowledged that human land-use activities such as intensive cattle farming and cultivation of citrus products lead to a homogenization of soil nutrients. This research aims at investigating the heterogeneity in soil nutrient stocks and BSi stocks (a beneficial plant element) within the Savannah biome of South Africa. In this study, C-N-Si stocks and their ratios were quantified in the soil of five different land use types, common in South Africa. The five different land use types are i) bush savannahs, ii) mopane-dominated woodlands, iii) annually burned land, iv) communal grazing land and v) citrus orchards. Empirical research however could not fully validate this hypothesis. In particular fire management and game farming (natural land use type) led to more variability in nutrient pools, with occasional occurrences of C-N-Si hotspots. Our results suggest that when ecosystem analysis of soil nutrient and carbon stocks is handled as a homogeneous unit potentially large mistakes are made, even in anthropogenic landscapes previously hypothesized with uniform nutrient distributions.
Introduction
Anthropogenic influences have the potential to alter the spatial distribution of soil nutrients at manifold scales (Fraterrigo et al., 2005). Land use directly alters soil properties and influences biological transformations in the root zone, thereby affecting the distribution and supply of soil nutrients (Fraterrigo et al., 2005). The presence of monocultures and mechanical soil mixing, which is synonymous with cultivated systems, leads to the homogenization of soil resources (Robertson et al., 1993; Fraterrigo et al., 2005). A big setback in understanding the interaction of anthropogenic factors and ecosystem stoichiometry is the lack of knowledge on the variability of soil nutrients at a spatial level. In semi-arid ecosystems, a sudden land use change, such as the conversion of fallow land to arable land, has a large effect on landscape stability, erosion patterns and erosion rates, since these ecosystems are characterized by slow vegetation growth and extreme rainfall events (Govers et al., 2006). In these ecosystems land conversion usually leads to a loss of nutrients as mineral horizons are disrupted and the input of organic material is reduced (Fraterrigo et al., 2005). In general it is hypothesized that soil management by humans leads to a more homogenous nutrient distribution. This is an important topic for researchers interested in comparing nutrient dynamics between different land use types. On the other side livestock has been shown to reduce nutrient contents of savannah pastures up to 10% for P and 6% for N (Edwards et al., 2022). In these grazed systems, nutrient redistribution may cause a shift in soil heterogeneity because animal excretion can increase the nutrient concentration locally (le Roux et al., 2020). In this manner, animal presence and associated excretion behaviour can enhance nutrient heterogeneity of the soil. In cattle pastures, it is shown that excrement patterns are enhanced or attenuated by pasture properties (fences, resting areas, … ) (Auerswald et al., 2010). Similarly in natural systems, animals such as rhinoceros excrete dung at the same location on dung piles, also known as middens (Tatman et al., 2000) potentially creating nutrient hotspots.
Several mechanisms can cause nutrient redistribution in human land use types. A study by Fromm et al. (1993) found that soil microbial biomass and carbon stores present in an agroecosystem show a highly significant correlation. However, the carbon content of the soil as well as the microbial biomass showed no significant relationship with soil type but was significantly related to land use type present in a specific sampling area. The study also suggests that any correlation that would have been present between the microbial biomass and soil type was homogenized by human field management practices: for example, agrarian monocultures, plantations and orchards (Fromm et al., 1993). The spatial variability of the microbial biomass found in managed areas is low (Fromm et al., 1993). Thompson et al. (2001), pointed out the need to assess how our scales of information, such as resolution in space, influence knowledge and understanding of ecological processes. A lack of a spatial context limits researchers’ ability to explain ecological processes and the consequences thereof.
This research aims at investigating the heterogeneity in soil nutrient and Si stocks within the Savannah Biome of South Africa. This biome is the largest in southern Africa and occupies over one-third of the area of South Africa (Low and Rebelo, 1996). The Savannah Biome is characterised by a grass ground layer and a wood plant upper layer. A major factor delimiting this biome is high rainfall or the lack thereof, with the upper wood layer not dominant due to a lack of water. The Savanna Biome in South Africa is located mostly in the northeastern part of the country. The geology is dominated by a stable block of ancient continental crust (Kaapvaal Craton). In South Africa, the iconic Kruger National Park is situated in this biome and as such, this biome is an important economic and ecologic area.
Since sampling effort is strongly dependent on heterogeneity, it is essential to understand whether results sampled at smaller scales can be scaled up to entire bioregions or even biomes. Currently, large-scale land units are often characterised for instance by one nitrogen or carbon stock in the analysis of ecosystem services and thus handled as a homogeneous unit (Batjes, 1996; Driver et al., 2005; Ptacnik et al., 2005; Egoh et al., 2009). In the same way, one land use type or physical characteristic e.g., lithology is often considered uniform regarding the storage and cycling of elements such as C, N and biogenic Si (BSi) (Egoh et al., 2008; Egoh et al., 2009; Melzer et al., 2012). BSi is amorphous Si that rapidly recycles and is therefore ecologically relevant contrary to mineral Si (Struyf and Conley, 2012). The hypothesis was tested that internal variability in C, N and BSi stocks is larger in natural than in anthropogenic land use types. While often studies only target C, N or BSi stocks individually (Ptacnik et al., 2005) we specifically targeted all three together to investigate whether the different elements showed alternate heterogeneity patterns. Therefore, C-N-BSi stocks were quantified in the soil of five different land use types, common in semi-arid South Africa within the savannah biome region. The five different land use types investigated were i) bush savannahs, ii) mopane-dominated woodlands, iii) annually burned land, iv) communal grazing land and v) citrus groves, since these are common land use types in this region.
Materials and methods
The study area is in the Olifants River basin in the Limpopo province of South Africa, near the towns of Hoedspruit, Phalaborwa and Polokwane (Figure 1A). The regional climate condition of the study area is sub-tropical with an average annual rainfall throughout the Olifants catchment area of 500–800 mm (McCartney and Arranz, 2007). The study area has a summer rainfall pattern with the most rain occurring between October and April (McCartney and Arranz, 2007). Due to the temperature and rain climate, a broad variety of agricultural activities take place: there are large fruit plantations, grasslands and croplands. Samples were collected in July and August 2013. At each sampling site, five soil cores to a depth of 10 cm were taken within close vicinity of each other (approximately 10 m) to have a representative subset sample of the area. Each soil core was divided into a sample of 0–5 cm and a sample of 5–10 cm below the surface. This was done to determine if there is a depth-specific pattern. Soil cores were retrieved from the soil by hammering a cylinder (32 mm in diameter) into the soil. The samples were dried at 70°C for 48 h. Samples were stored at room temperature. In total, 220 sliced core samples from all sites were taken (Figure 1B):
i) Bushveld savannah (Polokwane Nature Reserve): This area has high quartz deposits and adjacent to the chosen area is a silicon smelter, mining these deposits. Three different sub-regions were selected. Sub-region 1 (bushveld savannah 1) was chosen to represent a “pristine” natural site. It is characterized by an open Acacia vegetation community with an Enneapogon sp. grass understory. In total 4 plots were selected (40 samples). A second site named bushveld savannah 2 was chosen as a “pristine” natural site; the vegetation community found across this area is Acacia tortilis open woodland. In total 4 plots were selected (40 samples). Bushveld savannah 3 is characterized by a dense mixed Acacia vegetation community. In Figure 1B the region is ascribed a higher disturbance impact because the area is closer at the periphery of the reserve and the presence of heavy land use at the other side of the reserve fence. In total 4 plots were selected (40 samples).
ii) Mopane-dominated woodlands:4 plots (40 samples) (Grietjie Private Nature Reserve). This reserve is 2,800 ha and is included in the Greater Kruger National Park allowing free movement of wildlife.
iii) Annually burned: Soil samples were taken near Hoedspruit (10 samples) and Polokwane Nature Reserve (10 samples), shortly after the areas were burned. Their natural vegetation would be respectively Mopane-dominated woodlands and Bush savannah.
iv) Communal grazing land: Two plots (20 samples) were sampled at communal grazed land near Diphuti. The natural vegetation would be Mopani-dominated woodlands.
v) Citrus groves: Two plots were sampled (20 samples) in a citrus plantation outside the town of Hoedspruit. The original vegetation in this area would be Mopani-dominated woodlands.
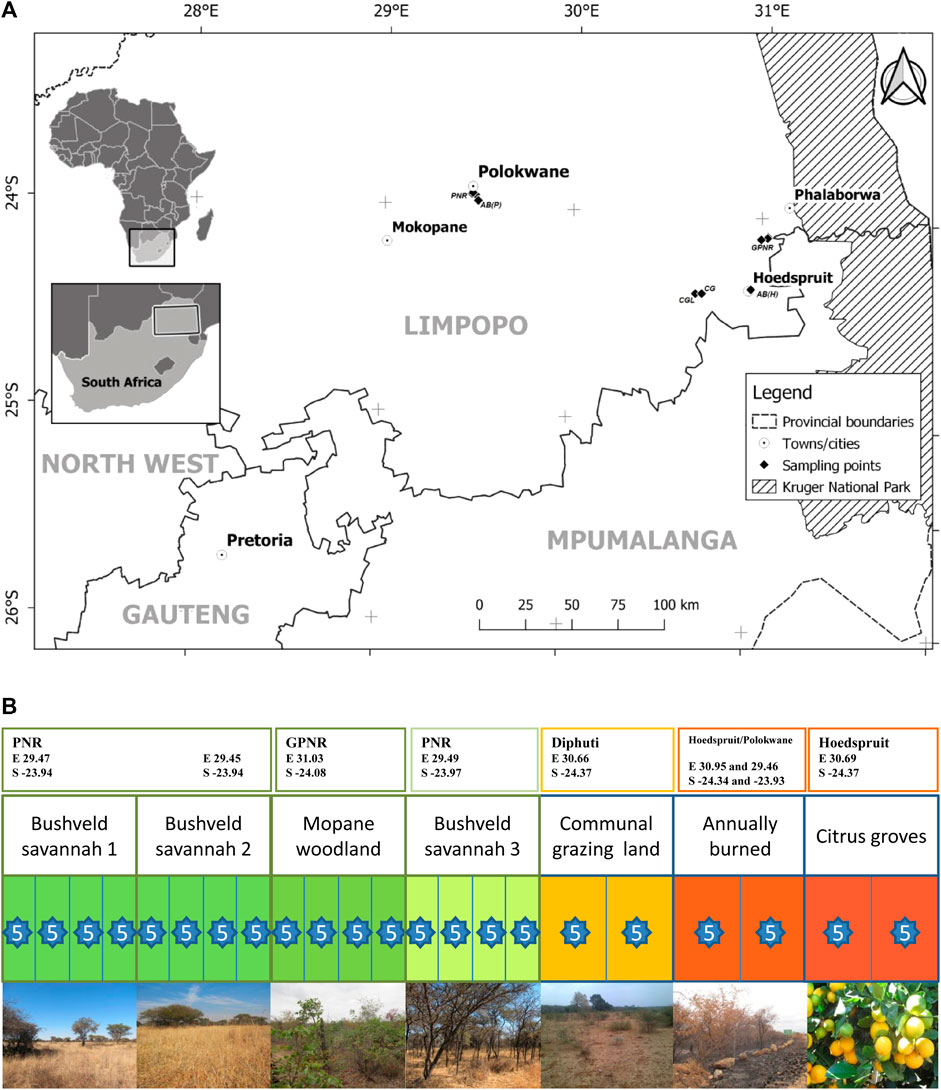
FIGURE 1. (A) Map showing the location of the various sites sampled within the Limpopo province, South Africa where the letters PNR indicate Polokwane Nature Reserve, GPNR indicate Grietjie Private Nature Reserve, AB being annually burned, CG being citrus groves and CGL being communal grazing lands. (B) Sampling setup representing a gradient of land use, ranging from pristine nature areas (dark green) to intensively managed areas (dark red). The blocks with their divisions are indicative of a sampling area with the amount of sampling plots being represented by the amount of divisions in the block and the number in each star indicated how many soil cores where taken within a sampling plot. GPS coordinates are given for the middle of the area where the different plots were sampled.
Specifically, the internal variability (intra-variability) of C, N and BSi percentages within each land use type were examined and then investigated whether differences exist between (inter-variability) different land use types, that are larger than internal variability.
Sample analysis
The extraction of BSi from the samples (dried at 70°C until constant mass, homogenised and sifted over 710 µm) was done based on the sequential alkaline method of De Master (1981). Three subsamples of 25–30 mg sediment were weighed and placed in a polypropylene tube with 25 mL of a 1% Na2CO3 -solution. The samples were incubated in a water bath (85°C) and at time intervals of 3, 4, 5 h an amount of 6 mL was extracted and filtered through a 0.45 μm pore size (Chromafil® A-45/25) filter. This fluid was then fed into a continuous flow analyser (Skalar SAN++) and analysed for Si using the spectrophotometric molybdate–blue method (Grasshoff et al., 1983). To determine the biogenic silica content a dissolution curve is formed, based on the quick dissolution of biogenic silica and the slower release of silica from the soil material. Carbon (organic and inorganic) and nitrogen concentrations were analysed by using the FLASH 2000 Organic Elemental Analyzer, based on Flash Dynamic Combustion (Thermo Fisher Scientific, 2014). An amount of 30 mg of soil from each sample was weighed into a pressed tin cup and placed into the autosampler. All analyses were performed in the laboratory of the ECOSPERE group at the University of Antwerp.
Statistical analysis
The test used for statistical analysis is the Mann-Whitney U test, also known as an unpaired Wilcoxon rank sum test. This is a non-parametric method (assuming no specific distribution) appropriate for examining the differences between two groups (McKnight and Najab, 2010). The statistical analysis was performed in R 3.0.2 (RStudio). All sampled plots were compared to one another to determine if there were significant differences in C, N and BSi stocks between them. The correlations between the different elements were tested and then the most suited trend lines were determined. Only significant correlations between elements, where the regression line had a strong fit (R2 > 0.8) were added to the results section.
Results
Inter-variability between sites
To study which land use had the highest variation in soil carbon (C) content the coefficient of variance (standard deviation divided by the average) was calculated for the entire soil depth (0–10 cm). It was observed that the highest C variation was detected in the annually burned plots (63%) and the lowest C variation in the citrus groves (12%) (Figure 2A). For N, the highest variation in soil content was observed in the bushveld savannah 1 plots (69%) closely followed by the annually burned sites (66%). The lowest variation in N content was seen in the citrus groves (12%). For BSi soil variation, again the citrus groves had the lowest variation with 7% and bushveld savannah 2 had a variation of 85% around the average values.
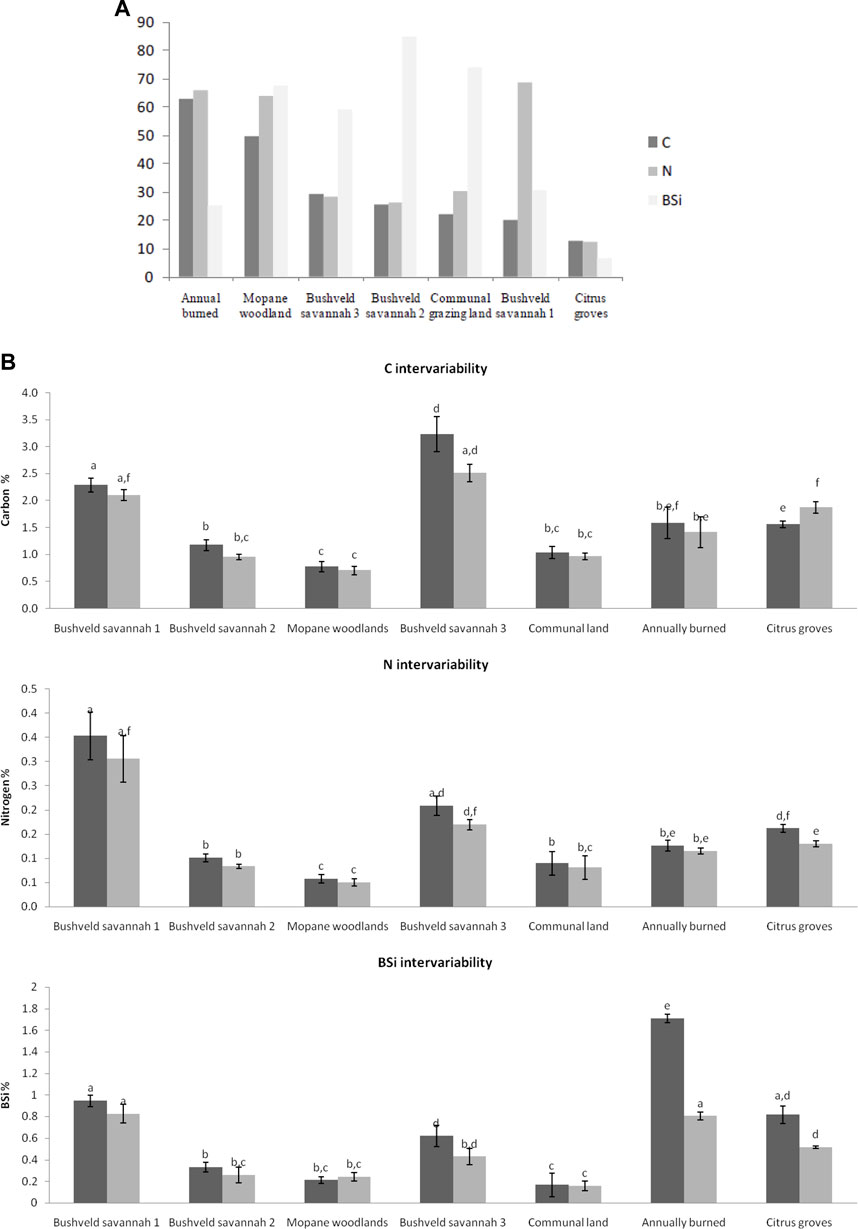
FIGURE 2. (A) coefficient of variation of the soil samples (pooled 0–10 cm) for the different land use types and elements analysed. (B) (a) Carbon % (b) Nitrogen % (c) BSi % at the different land use types and depths within the sites (dark grey = 0–5 cm, light grey = 5–10 cm). Error bars represent standard deviations. Above the bars the results of a Wilcoxon rank test are inserted (level of significance: p < 0.05).
The average value of C (%) in the different land use types is shown in Figure 2B. Most of the inter-variability between the land use types is apparent since the C % differs significantly between numerous plots. The C found in the first 5 cm of soil at the bushveld savannah 3, differs significantly from all the other land use types. When comparing the average amount of C present in the soil pools it is clear that the highest presence of C, with an average value of 3.2%, can be found at a soil depth of 0–5 cm in the bushveld savannah 3 plots. The lowest average of 0.7% can be found in the Mopane woodland soil pool at a depth of 5–10 cm. Trends with maximum and minimum C values are the same at both depths. When comparing the differences in C between the soil depth of 0–5 and 5–10 cm, the C % was consistently higher in the top 5 cm, except for the C in the soil samples taken at the citrus groves.
The average values of N (%) in the different land use types are shown in Figure 4. The highest amount of N was found at the bushveld savannah 1 site, with an average of 0.34% at a depth of 0–5 cm. There is a great standard deviation from the mean at the bushveld savannah 1 site which indicates that the intra-variability within this land use type varies to a high degree. The lowest average amount of N (0.05%) was found at the Mopane site at a depth of 5–10 cm. Trends with maximum and minimum N values are the same at both depths. The Mopane site had the lowest values, of all sites, for both C and N. There is a high amount of inter-variability in N between the different land uses with most sites differing significantly from each other. When comparing the differences in N between the soil depth of 0–5 and 5–10 cm the N % was always the highest in the top 5 cm.
The average value of BSi (%) between the different land use types was determined and represented in Figure 4. A high average of BSi, which is 1.71%, was found in the first 5 cm of the burned sites, this differs significantly from all the sites, including the 5–10 cm layer of the burned sites. The lowest average amount (0.16%) of BSi was present in the deeper soil layer of the communal grazing land. When comparing the differences in BSi between the soil depth of 0–5 and 5–10 cm, the BSi % was always higher in the top 5 cm of soil, except for the BSi in the Mopane-dominated woodlands. The amounts of BSi in the communal grazing lands were almost equal between the different depths.
Intra-variability within sites
Variation
Within a certain land use, the different sites showed a high degree of lateral variation. A high amount of intra-variability can be seen in the N% between the sampling plots in the first bushveld savannah site (Figure 3), with relatively smaller variation observed for C and BSi. Plot 1 in general has a high C and BSi content, and low N content. The most striking feature is the relatively high N % in plots 2 and 3.
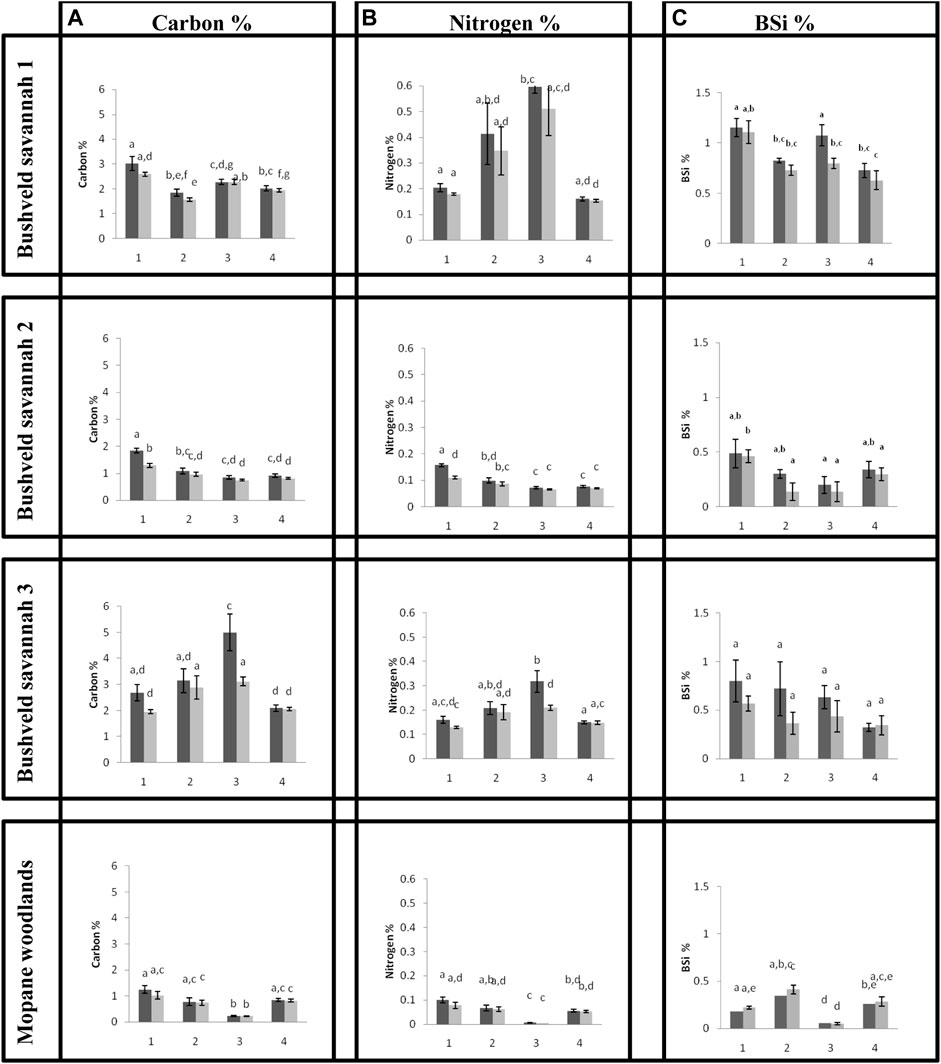
FIGURE 3. (a) Carbon % (b) Nitrogen % (c) BSi %, at the different sampling plots (1–4) and depths within the plot (dark grey = 0–5 cm, light grey = 5–10 cm) for the three bushveld savannah and the mopane dominated sites. Error bars represent standard deviations (n = 5). Above the bars the results of a Wilcoxon rank test are inserted (level of significance: p < 0.05).
Whereas there was no correlation between C and N for the first bushveld savanna site, variation in C and N content in the second bushveld savannah site (Figure 3) was very similar, with BSi showing a similar but very weak correlation. There is a significant linear correlation (p < 0.05) between C and N for both 0–5 cm (R2 = 0.98) and 5–10 cm (R2 = 0.96). The first plot value, for both C and N, differs significantly from most of the other three plots within the site. The BSi % for the bushveld savannah 2 site has large standard errors of the mean which suggests a lot of variance between the replicas of each plot, but not many of the plots differ significantly from one another. The C, N and BSi values are much higher at bushveld savannah 1 than at bushveld savannah 2. At both sites, the soil depth was less important compared to spatial variability. No relation was found between C and BSi and between N and BSi at the two sites.
At the bushveld savannah 3 site (Figure 3) one plot (plot 3) differed strongly from all the other plots for both C and N, but not for BSi. None of the BSi % plots differs significantly from one another, but most plots show a great standard deviation from the mean. There is a significant linear correlation (p < 0.05) between C and N for both 0–5 cm (R2 = 0.98) and 5–10 cm (R2 = 0.98). No relation was found between C and BSi, nor between N and BSi.
In the Mopane woodland, there was one plot that differed strongly from the other plots (plot 3). Variation in C and N content was very similar (Figure 3). This site has higher percentages of BSi in the 5–10 cm soil layer than in the 0–5 cm soil layer. There is a significant linear correlation (p < 0.05) between C and N at both 0–5 cm (R2 = 0.97) and 5–10 cm (R2 = 0.96) depths. All other relations were not significant.
There is no intra-variability between the plots for both C and BSi in the communal grazing land site (Figure 4) with none of the plots differing significantly from one another. There is some intra-variability between the N% in the plots, but it is very small. There is a significant linear correlation (p < 0.05) between C and N for both 0–5 cm (R2 = 0.99) and 5–10 cm (R2 = 0.95). No relation was found between C and BSi and between N and BSi.
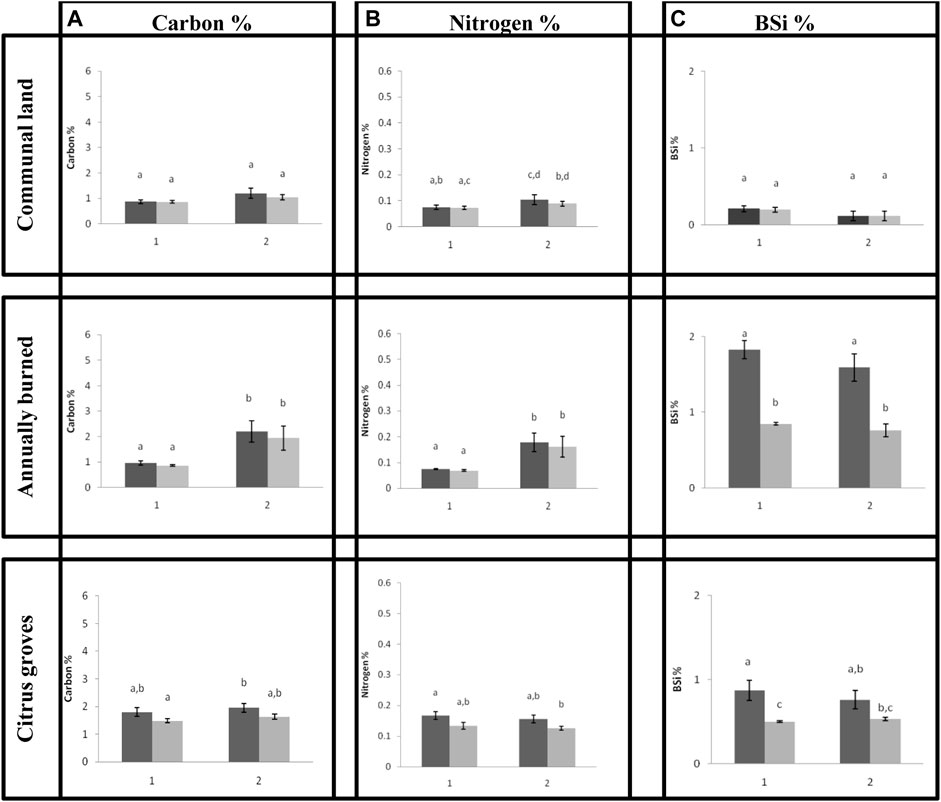
FIGURE 4. (a) Carbon % (b) Nitrogen % (c) BSi %, at the different sampling plots (1 and 2) and depths within the plot (dark grey = 0–5 cm, light grey = 5–10 cm) for the communal land, burned land and citrus grove sites. Error bars represent standard deviations (n = 5). Above the bars the results of a Wilcoxon rank test are inserted (level of significance: p < 0.05).
There is a strong variation within the burned site (Figure 4) for both C and N. BSi between the burned plots does not differ significantly, but the BSi % differs significantly with depth. There is a significant linear correlation (p < 0.05) between C and N at both 0–5 cm (R2 = 0.98) and 5–10 cm (R2 = 0.99). The relationship between C and BSi and between N and BSi was not significant.
There is a low variability for all three elements within the citrus groves, with some variability between depths for BSi. All the relationships were not significant.
Land use
To show how much variability exists between land use types, two scenarios (Figure 5A) where the average C between two land use types does not differ significantly are presented. When looking at the individual plots the differences are significant. The first example is based on the bushveld savannah 2 and the burned site. The average C % of bushveld savannah 2 is similar and does not differ significantly from the average of the burned site (Figure 4), but in a situation where the two most divergent plots would have been the only plots sampled (by chance), the difference between them is significant. This is also the case for the burned site and communal grazing land.
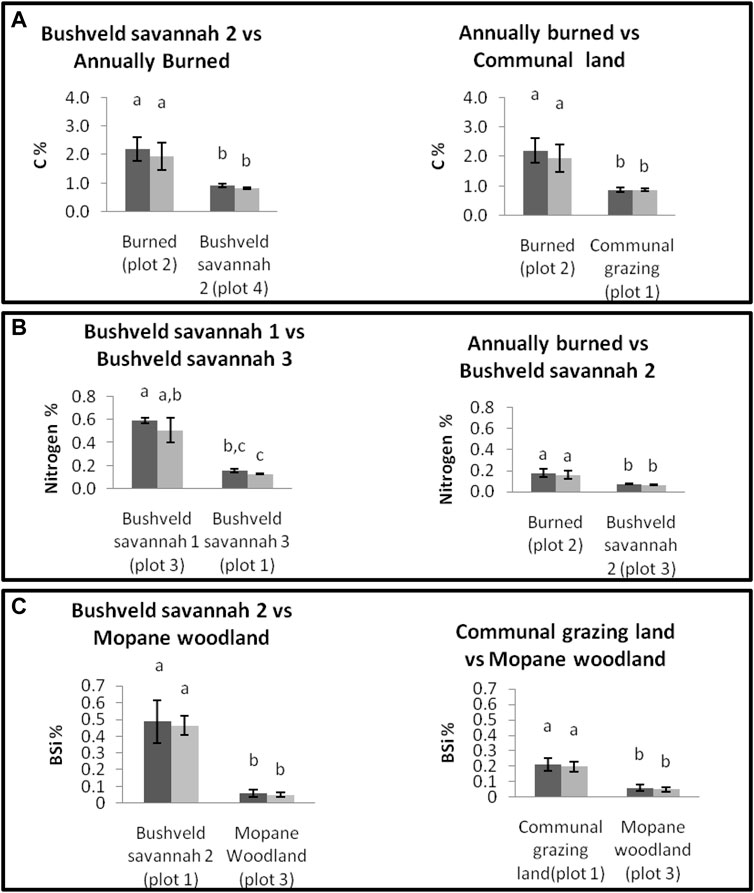
FIGURE 5. Carbon %, Nitrogen % and BSi % of plots from different land use types at two different depths (dark grey = 0–5 cm, light grey = 5–10 cm). Error bars represent standard deviations. Above the bars the results of a Wilcoxon rank test are inserted.
Two scenarios are presented where the average N between two land use types does not differ significantly but when looking at the individual plots the differences are significant. The first example is based on the bushveld savannah 1 and bushveld savannah 3 plots (Figure 5B). The average N % of bushveld savannah 1 is similar and does not differ significantly from the average of the bushveld savannah 3 (Figure 4), but in the case when the two most divergent plots would have been the only plots sampled, the difference between them is significant. This is also the case between the annually burned sites and bushveld savannah 2 (Figure 5B).
Two scenarios are presented where the average BSi between two land use types does not differ significantly but when looking at the individual plots the differences are significant. The first example is based on the bushveld savannah 2 and Mopane woodland site. The average BSi % at bushveld savannah 2 is similar and does not differ significantly from the average of the Mopane woodland site (Figure 4), but in the case when the two most divergent plots would have been the only plots sampled, the difference between them is significant. This is also the case between the communal grazing land site and the Mopane woodland site (Figure 5C).
Discussion
This study shows a high degree of variability in C%, N% and BSi% between and within different land use types in the South African bushveld. It also shows that human land use activities, such as the cultivation of citrus groves and intensive cattle grazing, potentially lead to a homogenization of soil nutrients, whereas the soil nutrient pools in areas with natural land use types are predominantly heterogeneous. The study also shows that other anthropogenic influences such as fire do not necessarily have a similar homogenizing effect on different soil nutrients but could instead lead to more variability in specific nutrient pools. Similar results were previously shown in riparian ecosystems where specific anthropogenic influences such as dams and reservoirs also cause spatial variation upstream and downstream of the dam, which is different for N, P and BSi (Struyf et al., 2012).
The results will be discussed according to the different land use types.
Bushveld savannah (Polokwane Nature Reserve)
At the first bushveld savannah site, a relatively high N % (0.12%–0.79%) compared to all other locations was observed. Both plots with a high N% were open landscapes characterized by dried grasses, with a single Acacia tree present in plot 2. McClain et al. (2003), define biogeochemical hotspots as “Patches that show disproportionately high reaction rates relative to the surrounding matrix”. It is a common occurrence for biogeochemical hotspots to be present at the boundaries between two features in a landscape, for example, areas in a landscape can be altered by groundwater concentration (McClain et al., 2003).
South African soils are known to have low organic matter levels (58% of the topsoils contain lower than 0.5% C) with only a small fraction comprising more than 2% organic carbon (Du Preez et al., 2011). Therefore, it was expected that all the natural sites would have low levels of soil C.
The second bushveld savannah site had a lot less C (0.64%–2.06%) and N (0.06%–0.17%) than its neighbouring sites. The site is located close to the first bushveld savannah site (with a C range of 1.39%–3.92% and N range of 0.12%–0.79%) as well as site 3 (with a C range of 1.73%–7.41% and N range of 0.11%–0.47%) but has much lower C and N percentages. Even though the values are lower it is still within the common range for South African soil C and N. It is possible that the values found at the second site are the norm of the area and that the soil C% found at site 1 (1.39%–3.92%) and 3 (1.73%–7.41%) is higher than it would have been in its original state. When a certain land use activity promotes an increase in organic matter, this usually leads to an increase in soil C (Mills and Fey, 2004). Overflows of water from neighbouring land use could act as a fertilizer for the vegetation at the Polokwane Nature Reserve, thereby creating denser vegetation, which would lead to an increase in organic matter and consequently a higher C% in the soil.
Grassland ecosystems are well known to accumulate large reservoirs of BSi (Struyf et al., 2009; Melzer et al., 2012; Struyf et al., 2012). Consequently, it was expected the first bushveld savannah and second bushveld savannah sites to have a similar high average of BSi in the soil however, this was not the case. The first bushveld savannah site had a BSi content of 0.45%–1.4%, which was significantly higher than the second bushveld savannah site with 0%–0.76% content. The vegetation between these two sites appeared to be very similar with a high abundance of grasses but differed in vegetation communities (authors’ observations). The first bushveld savannah site has A. tortilis/Enneapogon grass vegetation and the second bushveld savannah site has A. tortilis open woodland vegetation. Therefore, the greater abundance of Enneapogon grass at the first bushveld savannah site could have resulted in a higher BSi soil pool since species from the grass family (Poaceae) are notorious silica accumulators (Hodson et al., 2005).
A high amount of BSi was also present in the first 5 cm of soil at the bushveld savannah 3 (0.18%–1.73%). This site had less grass present and is characterized by mixed Acacia woodland according to the reserve map. It could be that adjacent land use causes a shift in the weathering of silicates by adding acids for weathering. The main external source of Si in ecosystems is attributed to the mineral weathering of silicates (Struyf and Conley, 2012).
Mopane-dominated woodlands (Grietjie Private Nature Reserve)
The site dominated by Mopane woodland had remarkably low C (0.19%–1.56%), N (0.004%–0.13%) and BSi (0.05%–0.53%) in the soil. Nevertheless, the soil nutrient pool was still quite heterogeneous. Plants tend to use nutrients efficiently in nutrient-poor ecosystems (Hobbie, 1992) and it has been found that plants have the highest nutrient resorption in dry climates (Köppen B) along climatic gradients (Vergutz et al., 2012). The Köppen-Geiger climate classification of the Mopane woodlands is BSk (steppe, mid-latitude dry), so the reason for the low nutrient % could be the result of effective nutrient recycling at this site. Another possible reason for the low C and N levels is that the reserve was previously used for extensive agriculture carrying approximately 150 cows and 120 goats. In a previous study focusing on a different vegetation type, in the Eastern Cape of South Africa, goat farming was shown to have transformed a dense thicket into an open savannah, resulting in 40% less soil C, compared to adjacent sites with intact dense thicket (Mills and Fey, 2004). Robles and Burke (1998) found that the restoration of soil C stocks in degraded ecosystems in semi-arid areas, is a slow process and after 6 years of conservation soil C and N have only shown a slight increase. It could be that even though the vegetation looks healthy, the soil C and N at the Mopane-dominated woodland site is still recovering from cultivation.
Throughout the other land use types, the BSi concentration was always highest in the first 0–5 cm and less at 5–10 cm, but not so at the Mopane site. This could be due to the high presence of termite heaps in the Grietjie Nature Reserve. BSi values in undisturbed soils are usually highest at the soil surface and decrease with depth, but deviations from this pattern can occur when soils are influenced by bioturbation, exposed to erosion or vertical translocation of phytoliths (Gol’eva and Aleksandrovskii, 1999; Hart and Humphreys, 1997). Phytoliths are rigid, microscopic plant structures made of silica which often remain after the plants’ decay (Piperno, 2006).
Annually burned
A study was done by Melzer et al. (2010) on an area, within the Coast Hinterland bushveld of South Africa, focusing on annually burned-, intermediately burned- and unburned areas in the presence and absence of grazers. At grazed sites, annually burned and unburned sites had the highest soil BSi values but no significant differences were found between them. However, on ungrazed sites, the highest soil BSi was found in the intermediately burned and annually burned sites, but the difference between burned and unburned was still not significant. Since the annually burned roadsides sites sampled in this study are also not grazed it was expected that the BSi % could follow this trend and be higher than other unburned sites, but the difference was not expected to be very big. However, from the results, it became clear that the burned site had the highest BSi (0.6%–2.09%) of all the land use types. This is in accordance with the findings of Unzué-Belmonte et al. (2016) that say burned soils provide an immediate source of Si. During the loss of organic elements by charring, N is lost first, followed by oxygen, hydrogen and lastly C (Almendros et al., 2003). The relative proportion of the main inorganic constituents such as calcium, magnesium, potassium and silicon increased with an increase in combustion temperature, while the other elements decrease in proportion since their volatilization temperature is lower (Bodi et al., 2014). After a burning event, the available nutrients are expected to be highly heterogeneous across the landscape (Pereira, 2010; Pereira et al., 2012). This could be the reason for the high heterogeneity within the annually burned sites. Unlike hypothesized the soil nutrient pool at the burned sites was heterogeneous and not made homogeneous by the human management thereof.
Communal grazed cattle land
Low soil C (<1.69%) and N (<0.15%) were found at the communally grazed cattle land. This was expected since the removal of vegetation by grazing has been found to reduce soil C (Mills and Fey, 2004). This is the result of lower biomass production which then leads to the loss of organic matter found in the soil (Du Preez et al., 2011). The amount of BSi present in this site (0%–0.36%) was the lowest compared to the other land use types. In these degraded lands, vegetation is extremely poor so the occurrence of less grass, acting as “silica factories” as described by Street-Perrott and Barker (2008), would mean fewer BSi present in the soil. BSi could also be lost to the adjacent Olifants river. Grazing conditions increase the potential turnover of BSi and leaching from terrestrial areas towards aquatic systems (Vandevenne et al., 2012; Vandevenne et al., 2013). Higher rates of DSi dissolution have been found in cattle faeces compared to grass litter/hay in experiments using CaCl2 and rainwater as extracting agents. Vandevenne et al. (2013), hypothesise that this high dissolution potential is due to the physical accessibility of BSi after it has been transported through the herbivore guts. After the mechanical breakage of grass cells by digestion, the organic matrix is removed which makes the BSi more accessible to dissolution since the surface-to-volume ratio is increased.
Citrus groves
This study also shows that citrus groves lead to a homogenization of soil nutrient pools. When compared to other land use types, citrus groves had a relatively high amount of soil C (1.27%–2.41%). A study focusing on the carbon balance of citrus plantations in Eastern Spain found carbon fixation rates of higher than 10 Mg C ha−1 yr−1 (Iglesias et al., 2013). The authors also found that soil and fruit respiration only played a minor role in C losses. Fertilization with N, which is highly likely in the citrus groves, is also likely to increase C sequestration, due to greater plant productivity (Mills and Fey, 2004). Furthermore, tree growth is the factor leading to a net positive C balance (Hoosbeeket al., 2018). It is known that N fertilizing can sometimes be too high in farmlands in an attempt to acquire high fruit and other yields (Zhu and Chen, 2002). In Florida and most likely other parts of the world, the application of fertilizers to citrus groves consists of applying a uniform amount of fertilizer over large areas (Qamar uz and Schumann, 2006). Therefore, high N % was expected within the citrus groves, but this was not the case with N ranging from 0.11% to 0.2%. Nitrogen runoff through the surface or groundwater could be redistributing N from the citrus groves towards the nearby Olifants river. Nevertheless, it could also be that the farmer is complying with the concept of precision farming and is applying N fertilization in a responsible efficient way.
BSi production in citrus groves is a topic which has not been studied much. The citrus groves had relatively high BSi amounts (0.46%–1.3%). It is known that BSi provides many benefits to plants such as increasing resistance to pathogens, grazing insects etc., and assists plants in retaining e.g., upright structure (Fauteux et al., 2005; Street-Perrott and Barker, 2008). It has also been found that BSi plays a crucial part in citrus development and growth (Matichenkov et al., 1999). Healthy trees have a higher amount of BSi present in their leaves compared to their unhealthy counterparts. Tree leaves also have a higher amount of BSi present in their leaves when they are exposed to biotic stresses and with increased age (Matichenkov et al., 1999). Data collected by Matichenkov et al. (1999), showed a connotation between the BSi in the leaves and the BSi found in the soil. Since the citrus groves at the study site are healthy adult trees it could have been expected that they should have a relatively high BSi soil pool.
Conclusion
This study has quantified the C-N-BSi stocks and their ratios in five different land use types dominating the South African bushveld. It shows that a high degree of variability exists within these land use types. As hypothesized, it shows that human land use activities such as intensive cattle farming and cultivation of citrus products lead to a homogenization of soil nutrients. However, anthropogenic influences such as fire management do not necessarily have a similar homogenizing effect on soil nutrients, but could instead lead to more variability in nutrient pools. Natural land use types were found to be predominantly heterogeneous with the potential occurrence of a nutrient hotspot. Alterations to the soils could have potential consequences for C, N and BSi totals and in response thereto on the local biodiversity. The results suggest that a few samples are not always representative of the nutrient status of larger areas and should be scaled up with care to larger bioregions or biomes. This could lead to misconceptions about our knowledge and understanding of ecological processes.
Data availability statement
The raw data supporting the conclusion of this article will be made available by the authors, without undue reservation.
Author contributions
All authors listed have made a substantial, direct, and intellectual contribution to the work and approved it for publication.
Funding
The authors would like to thank the VLIR-UOS project at the University of Limpopo for funding the fieldwork (Grant No ZIUS2016AP021). Part of this work was done in the framework of a Master’s dissertation by Vivo Louw. In this regard, the authors would like to thank the Erasmus Mundus: EUROSA scholarship for personal Master funding. The fieldwork was partly supported by the South African Research Chairs Initiative of the Department of Science and Innovation and National Research Foundation of South Africa through the DSI-NRF SARChI Chair (Ecosystem Health, Grant No 101054). KB would like to thank RVSC at the University of Limpopo for its continued support. JS is grateful to the Research Foundation–Flanders (FWO) for funding the Scientific Research Network: Zoogeochemistry, Alchemists of the Wild (project No. W001522N) and the Bijzonder Onderzoeksfonds of the University of Antwerp for research funding (project No. 44158).
Acknowledgments
The authors would also like to thank Vincent Egan for his assistance with generating the map using Quantum Geographic Information System (QGIS) software. Any opinion, finding and conclusion for recommendation expressed in this material is that of the authors and the DSI-NRF does not accept any liability in this regard.
Conflict of interest
The authors declare that the research was conducted in the absence of any commercial or financial relationships that could be construed as a potential conflict of interest.
Publisher’s note
All claims expressed in this article are solely those of the authors and do not necessarily represent those of their affiliated organizations, or those of the publisher, the editors and the reviewers. Any product that may be evaluated in this article, or claim that may be made by its manufacturer, is not guaranteed or endorsed by the publisher.
References
Almendros, G., Knicker, H., and González-Vila, F. J. (2003). Rearrangement of carbon and nitrogen forms in peat after progressive thermal oxidation as determined by solid-state 13C- and 15N-NMR spectroscopy. Org. Geochem. 34, 1559–1568. doi:10.1016/s0146-6380(03)00152-9
Auerswald, K., Mayer, F., and Schnyder, H. (2010). Coupling of spatial and temporal pattern of cattle excreta patches on a low intensity pasture. NutrCyclAgroecosyst 88, 275–288. doi:10.1007/s10705-009-9321-4
Augustine, D. J. (2003). Long-term, livestock-mediated redistribution of nitrogen and phosphorus in an East African savanna. J. Appl. Ecol. 40, 137–149. doi:10.1046/j.1365-2664.2003.00778.x
Batjes, N. H. (1996). Total carbon and nitrogen in the soils of the world. Eur. J. Soil Sci. 47, 151–163. doi:10.1111/j.1365-2389.1996.tb01386.x
Bodí, M. B., Martin, D. A., Balfour, V. N., Santín, C., Doerr, S. H., Pereira, P., et al. (2014). Corrigendum to “Wildland fire ash: Production, composition and eco-hydro-geomorphic effects”. Earth-Science Rev. 138, 503. doi:10.1016/j.earscirev.2014.07.005
De Master, D. J. (1981). The supply and accumulation of silica in the marine environment. Geochimica Cosmochimica Acta 45, 1715–1732. doi:10.1016/0016-7037(81)90006-5
Driver, A., Maze, K., Rouget, M., Lombard, A. T., Nel, J., Turpie, J. K., et al. (2005). National spatial biodiversity assessment (2004) priorities for biodiversity conservation in South Africa. Pretoria: South African National Biodiversity Institute. Strelitzia 17.
Du Preez, C. C., Van Huyssteen, C. W., and Mnkeni, P. N. (2011). Land use and soil organic matter in South Africa 2: A review on the influence of arable crop production. South Afr. J. Sci. 107, 35–42. doi:10.4102/sajs.v107i5/6.358
Edwards, P., Cech, P. G., Sitters, J., and Olde Venterink, H. (2022). Long-Term effects of cattle ranching on soil nitrogen and phosphorus balances in a savanna ecosystem. Rangel. Ecol. Manag. 84, 54–62. doi:10.1016/j.rama.2022.05.006
Egoh, B., Reyers, B., Rouget, M., Bode, M., and Richardson, D. M. (2009). Spatial congruence between biodiversity and ecosystem services in South Africa. Biol. Conserv. 142, 553–562. doi:10.1016/j.biocon.2008.11.009
Egoh, B., Reyers, B., Rouget, M., Richardson, D. M., Le Maitre, D. C., and van Jaarsveld, A. S. (2008). Mapping ecosystem services for planning and management. Agric. Ecosyst. Environ. 127, 135–140. doi:10.1016/j.agee.2008.03.013
Fauteux, F., Rémus-Borel, W., Menzies, J. G., and Bélanger, R. R. (2005). Silicon and plant disease resistance against pathogenic fungi. FEMS Microbiol. Lett. 249, 1–6. doi:10.1016/j.femsle.2005.06.034
Fraterrigo, J. M., Turner, M. G., Pearson, S. M., and Dixon, P. (2005). Effects of past land use on spatial heterogeneity of soil nutrients in southern Appalachian forests. Ecol. Monogr. 75, 215–230. doi:10.1890/03-0475
Fromm, H., Winter, K., Filser, J., Hantschel, R., and Beese, F. (1993). The influence of soil type and cultivation system on the spatial distributions of the soil fauna and microorganisms and their interactions. Geoderma 60, 109–118. doi:10.1016/0016-7061(93)90021-c
Gol'eva, A., and Aleksandrovskii, A. (1999). The application of phytolith analysis for solving problems of soil genesis and evolution. Eurasian soil Sci. 32, 884–891.
Govers, G., Van Oost, K., and Poesen, J . (2006). Responses of a semi-arid landscape to human disturbance: A simulation study of the interaction between rock fragment cover, soil erosion and land use change. Geoderma133, 19–31.
Grasshoff, K., Ehrhardt, M., and Kremling, K. (1983). Methods of seawater analysis. Germany: Wiley VCH.
Hart, D. M., and Humphreys, G. S. (1997). “The mobility of phytoliths in soils: Pedological considerations,” in First European meeting on phytolith research (Madrid: Centro de CienciasMedioambientales del Con sejo Superior de InvestigacionesCientificas Serrano), 93–100.
Hobbie, S. E. (1992). Effects of plant species on nutrient cycling. Trends Ecol. Evol. 7, 336–339. doi:10.1016/0169-5347(92)90126-v
Hodson, M. J., White, P. J., Mead, A., and Broadley, M. R. (2005). Phylogenetic variation in the silicon composition of plants. Ann. Bot. 96, 1027–1046. doi:10.1093/aob/mci255
Hoosbeek, M., Remme, R. P., and Rusch, G. M. (2018). Trees enhance soil carbon sequestration and nutrient cycling in a silvopastoral system in south-western Nicaragua. AgroforestSyst 92, 263–273. doi:10.1007/s10457-016-0049-2
Iglesias, D. J., Quiñones, A., Font, A., Martínez-Alcántara, B., Forner-Giner, M. A., Legaz, F., et al. (2013). Carbon balance of citrus plantations in Eastern Spain. Agric. Ecosyst. Environ. 171, 103–111. doi:10.1016/j.agee.2013.03.015
le Roux, E., van Veenhuizen, L. S., Kerley, G. I. H., and Cromsigt, J. P. G. M. (2020). Animal body size distribution influences the ratios of nutrients supplied to plants. PNAS 117 (36), 22256–22263. doi:10.1073/pnas.2003269117
A. B. Low, and A. G. Rebelo (Editors) (1996). Vegetation of South Africa, Lesotho and Swaziland (Pretoria: DEAT). Available at: http://www.ngo.grida.no/soesa/nsoer/Data/vegrsa/vegstart.htm.
Matichenkov, V., Calvert, D., and Snyder, G. (1999). “Silicon fertilizers for citrus in Florida,” in Proceedings-Florida state horticultural society, 5–8.
McCartney, M. P., and Arranz, R. (2007). Evaluation of historic, current and future water demand in the Olifants River catchment, South Africa. Colombo, Sri Lanka: IWMI. 42p. (IWMI Research Report 118). doi:10.3910/2009.118
McClain, M. E., Boyer, E. W., Dent, C. L., Gergel, S. E., Grimm, N. B., Groffman, P. M., et al. (2003). Biogeochemical hotspots and hot moments at the interface of terrestrial and aquatic ecosystems. Ecosystems 6, 301–312. doi:10.1007/s10021-003-0161-9
Melzer, S. E., Chadwick, O. A., Hartshorn, A. S., Khomo, L. M., Knapp, A. K., and Kelly, E. F. (2012). Lithologic controls on biogenic silica cycling in South African savanna ecosystems. Biogeochemistry 108, 317–334. doi:10.1007/s10533-011-9602-2
Melzer, S., Knapp, A., Kirkman, K., Smith, M., Blair, J., and Kelly, E. (2010). Fire and grazing impacts on silica production and storage in grass dominated ecosystems. Biogeochemistry 97, 263–278. doi:10.1007/s10533-009-9371-3
Mills, A. J., and Fey, M. V. (2004). SOIL carbon and nitrogen in five contrasting biomes of South Africa exposed to different land uses. South Afr. J. Plant Soil 21, 94–103. doi:10.1080/02571862.2004.10635030
Pereira, P. (2010). Effects of fire intensity in ash chemical and physical characteristics of Mediterranean species and their impact in water quality. Ph.D thesis. University of Barcelona.
Pereira, P., Úbeda, X., and Martin, D. A. (2012). Fire severity effects on ash chemical composition and water-extractable elements. Geoderma 191, 105–114. doi:10.1016/j.geoderma.2012.02.005
Piperno, D. R. (2006). Phytoliths: A comprehensive guide for archaeologists and paleoecologists. Lanham, New York, Toronto, Oxford: AltaMira Press.
Ptacnik, R., Jenerette, G. D., Verschoor, A. M., Huberty, A. F., Solimini, A. G., and Brookes, J. D. (2005). Applications of ecological stoichiometry for sustainable acquisition of ecosystem services. Oikos 109, 52–62. doi:10.1111/j.0030-1299.2005.14051.x
Qamar uz, Z., and Schumann, A. W. (2006). Nutrient management zones for citrus based on variation in soil properties and tree performance. Precis. Agric. 7, 45–63. doi:10.1007/s11119-005-6789-z
Robertson, G. P., Crum, J. R., and Ellis, B. G. (1993). The spatial variability of soil resources following long-term disturbance. Oecologia96 96, 451–456. doi:10.1007/bf00320501
Robles, M. D., and Burke, I. C. (1998). Soil organic matter recovery on conservation reserve program fields in southeastern Wyoming. Soil Sci. Soc. Am. J. 62, 725–730. doi:10.2136/sssaj1998.03615995006200030026x
Street-Perrott, F. A., and Barker, P. A. (2008). Biogenic silica: A neglected component of the coupled global continental biogeochemical cycles of carbon and silicon. Earth Surf. Process. Landforms 33, 1436–1457. doi:10.1002/esp.1712
Struyf, E., Bal, K. D., Backx, H., Vrebos, D., Casteleyn, A., De Deckere, E., et al. (2012). Nitrogen, phosphorus and silicon in riparian ecosystems along the Berg River (South Africa): The effect of increasing human land use. Water sa. 38, 597–606. doi:10.4314/wsa.v38i4.15
Struyf, E., and Conley, D. J. (2012). Emerging understanding of the ecosystem silica filter. Biogeochemistry 107, 9–18. doi:10.1007/s10533-011-9590-2
Struyf, E., Smis, A., Van Damme, S., Meire, P., and Conley, D. (2009). The global biogeochemical silicon cycle. Silicon 1, 207–213. doi:10.1007/s12633-010-9035-x
Tatman, S. C., Stevens-Wood, B., and Smith, V. B. T. (2000). Ranging behaviour and habitat usage in black rhinoceros, Dicerosbicornis, in a Kenyan sanctuary. Afr. J. Ecol. 38, 163–172. doi:10.1046/j.1365-2028.2000.00235.x
Thompson, J. N., Reichman, O. J., Morin, P. J., Polis, G. A., Power, M. E., Sterner, R. W., et al. (2001). Frontiers of Ecology: As ecological research enters a new era of collaboration, integration, and technological sophistication, four frontiers seem paramount for understanding how biological and physical processes interact over multiple spatial and temporal scales to shape the earth's biodiversity. BioScience 51, 15–24. doi:10.1641/0006-3568(2001)051[0015:foe]2.0.co;2
Unzué-Belmonte, D., Struyf, E., Clymans, W., Tischer, A., Potthast, K., Bremer, M., et al. (2016). Fire enhances solubility of biogenic silica. Sci. Total Environ. 572, 1289–1296. doi:10.1016/j.scitotenv.2015.12.085
Vandevenne, F. I., Barão, A. L., Schoelynck, J., Smis, A., Ryken, N., Van Damme, S., et al. (2013). Grazers: Biocatalysts of terrestrial silica cycling. Proc. R. Soc. B Biol. Sci. 280, 20132083. doi:10.1098/rspb.2013.2083
Vandevenne, F., Struyf, E., Clymans, W., and Meire, P. (2012). Agricultural silica harvest: Have humans created a new loop in the global silica cycle? Front. Ecol. Environ. 10, 243–248. doi:10.1890/110046
Vergutz, L., Manzoni, S., Porporato, A., Novais, R. F., and Jackson, R. B. (2012). Global resorption efficiencies and concentrations of carbon and nutrients in leaves of terrestrial plants. Ecol. Monogr. 82, 205–220. doi:10.1890/11-0416.1
Keywords: savannah, land use, soil, nutrients, anthropogenic influence
Citation: Bal KD, Louw V, Struyf E, Sara JR, Le Roux J, Ayisi KK and Schoelynck J (2023) Effect of land use on carbon-, nitrogen- and silica soil stocks in the South African bushveld. Front. Environ. Sci. 11:1152182. doi: 10.3389/fenvs.2023.1152182
Received: 27 January 2023; Accepted: 21 August 2023;
Published: 25 September 2023.
Edited by:
Dominika Lewicka-Szczebak, University of Wrocław, PolandReviewed by:
Rafael Ferreira Barreto, São Paulo State University, BrazilArkadiusz Artyszak, Warsaw University of Life Sciences, Poland
Copyright © 2023 Bal, Louw, Struyf, Sara, Le Roux, Ayisi and Schoelynck. This is an open-access article distributed under the terms of the Creative Commons Attribution License (CC BY). The use, distribution or reproduction in other forums is permitted, provided the original author(s) and the copyright owner(s) are credited and that the original publication in this journal is cited, in accordance with accepted academic practice. No use, distribution or reproduction is permitted which does not comply with these terms.
*Correspondence: K. D. Bal, a3Jpc2RpcmsuYmFsQGdtYWlsLmNvbQ==