 Mulinga Narcisse
 Shiyun Zhang1*
 Muhammad Sadiq Shahid
 Khurram Shehzad
94% of researchers rate our articles as excellent or good
Learn more about the work of our research integrity team to safeguard the quality of each article we publish.
Find out more
ORIGINAL RESEARCH article
Front. Environ. Sci., 03 April 2023
Sec. Environmental Economics and Management
Volume 11 - 2023 | https://doi.org/10.3389/fenvs.2023.1149507
This article is part of the Research TopicLow-Carbon Transformation for Sustainable DevelopmentView all 14 articles
Since the industrial revolution, the concentration of greenhouse gases (GHGs)has been increasing steadily. It is to be noted that China emitted 27% of the world’s GHGs in 2019, making it the world’s most significant contributor to climate degradation. The key objectives of this investigation are to ascertain the N-shaped association between CO2 emissions and economic growth in the presence of energy use and domestic government health expenditures. In addition, the research inspected the role of Belt and Road Initiative through economic globalization in China. This study utilized the autoregressive distributed lag model and found that an N-shaped environmental Kuznets curve exists in China. Furthermore, the study discovered that economic globalization improves ecological excellence in the short run. Nonetheless, energy consumption and health expenditures considerably amplify the intensity of CO2 emanation in China in the long run. The research suggested that installing green industries through economic globalization can imperatively lessen environmental degradation. Moreover, installing technological firms will be more beneficial in the long run to overcome environmental degradation rather than importing from other countries. The study elaborated momentous causation effects among the study variables through the Granger causality test.
Climate change engenders an increasing threat to survival and human growth, including food scarcity, loss of species, and extreme weather conditions (Wang et al., 2020). Since the industrial revolution, the concentration of greenhouse gases (GHGs) has continued to rise, and the average global temperature has increased by 0.85°C from 1980 to 2012 (Pathak, 2021). Mainly, China emitted 27% of the globe’s GHGs in 2019, ranking first in the world (BBC, 2021). Therefore, ecological dilapidation and climate change are among the main debatable and discussed topics in the 21st century. In light of the 2015 Paris Climate Agreement (PCA), countries worldwide are designing their policies to limit global warming below 1.5°C above the pre-industrial level, which requires rapid, far-reaching, and unprecedented changes in all aspects of society. It is to be noted that immediate changes in lifestyles, technology, consumption patterns, and production methods have elevated environmental problems (Yilanci and Gorus, 2020; Ahmad et al., 2021a; Ahmad et al., 2022; Ekeocha, 2021; Shehzad et al., 2021; Arif et al., 2022). Moreover, it is commonly believed that many countries have prioritized economic development regardless of the consequences, leading to the problems of high fossil fuel energy consumption and environmental pollution (Bertinelli et al., 2012).
In recent decades, China has accredited sudden economic development to the enormous utilization of its resources. This nations have faced structural transformation from agricultural to industrial and service-based economies. Hence, this development is not without cost, and environmental quality is the price. This region is in the initial phase of industrialization, which has incalculably increased the demand of energy. Indeed, electricity consumption in China has almost doubled from 2010 to 2021, i.e., from 4199.9 to 8310 TW h. Moreover, burning up of total energy has been augmented by 2.2% recently in comparison with 2019 (Wong, 2021). The studies of various authors such as Belke et al. (2011) and Tang et al. (2016) reported that energy plays a vital role in boosting economic growth. In addition, Zeraibi et al. (2020) declared that the use of energy directly impacts the economic growth, while indirectly effecting the environmental excellence. Thus, there is an urgent need to develop the most promising economic and energy strategies to accomplish the sustainable development goals (SDGs). Furthermore, Arouri et al. (2012) and Arif et al. (2022) revealed the direct impact of economic growth on environmental degradation. Consequently, the environmental nexus of energy consumption and economic development raise questions about sustainable economic growth, and it becomes indispensable to maintain a balance between economic development, energy use, and ecological sustainability. Numerous studies examined the relationship between economic growth and environmental degradation through the environmental Kuznets curve (EKC) theory introduced by Kuznets (1955), which documented that economic expansion and environmental degradation have a non-linear relationship that can be characterized by an inverted U-shaped curve. As per the EKC theory, an economic boost increases environmental degradation at the initial level but improves environmental excellence after attaining a specific point. Hence, despite significant changes, society will maintain environmental protection, and people will enjoy healthy lives (Stern, 2004; Ahmad et al., 2021b).
The EKC concept is attributed to three approaches, i.e., scale, component, and the technique effect through which economic growth can affect the environmental excellence in a country (Grossman and Krueger, 1995). In the first stage, a scale effect occurs where natural resources are extracted and valuable resources are put into the manufacturing cycle. When a manufacturing cycle begins, various toxic chemicals are produced, and the by-products of this manufacturing process drastically increase environmental degradation. In order to enhance the economic conditions, the government neglects the destructive aspects of this expansion which, as a result, affects environmental sustainability. At this stage, the use of energy and wages are increasing, and the country’s economic system is experiencing constant change; thus, the market framework begins to transform (Stern, 2004). This is the level where compositional impact occurs on environmental management, and the impact of socioeconomic development on environmental sustainability becomes positive. During this progression, additional markets develop , and the industry moves toward using sustainable technologies (Bagliani et al., 2008). Moreover, this variation upgrades the lifestyle and urges the desire for a healthier society. At this stage, industries adopt clean technologies that augment efficiency without harming environmental sustainability, and the economic system becomes information intensive instead of wealth intensive. At this moment, the government expenditure on innovations and pollutant technology is replaced (Tunç et al., 2009). This whole process is known as the EKC theory. However, some studies have shown that this relationship can sometimes be N shaped (Shehzad et al., 2022) documenting that environmental dilapidation will increase again shortly after the income levels rise above the appropriate level (Figure 1).
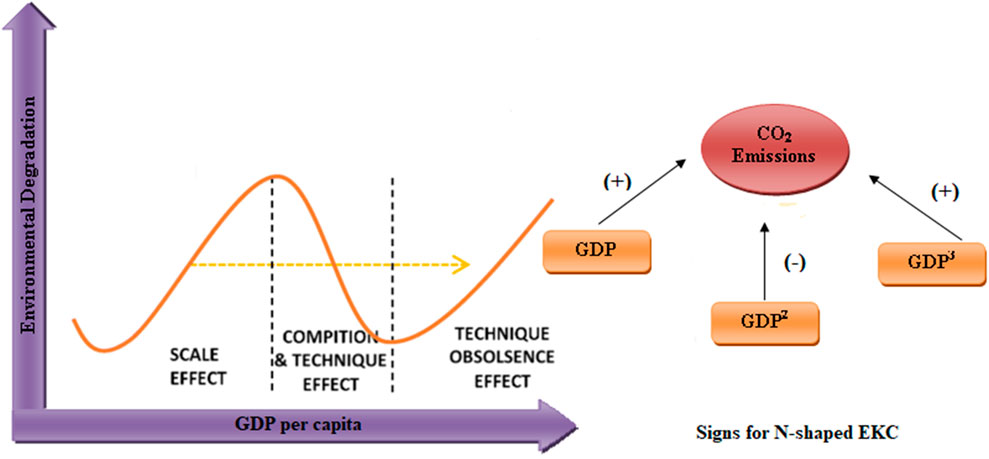
FIGURE 1. Stages of the N-shaped EKC
Torras and Boyce (1998) proclaimed that the N-shaped EKC occurs when technological transition transpires. The effectiveness of linkage depends on the small scale and extent of the enhanced classification of industries.
Additionally, China has stoutly built the economic relationship to the world through its Belt and Road Initiative (BRI). The BRI aims to improve China’s underdeveloped regions, particularly its western regions, and to broaden China’s opportunities for cooperation and collaboration with other nations in order to improve connectivity and integration. An integrated logistics layout, a new trade route and fresh trade possibilities, cross-border trade by eliminating cross-border uncertainty, entrepreneurship in developing nations, and this global initiative ultimately increased China’s GDP (Akbar et al., 2020; Lee and Shen, 2020; Han et al., 2022). In addition, by increasing cooperation and mutual benefits, deepening relations and connecting diverse nations, and promoting global economic infrastructure, this initiative promotes global economic infrastructure. Likewise, partner nations and Europe’s global presence could grow as a result of the BRI, and China and Europe could work together more in markets such as those in West Africa, the Indian Ocean, and Central Asia (Haggai, 2016). It is anticipated that trade between One Belt One Road (OBOR) nations will rise from $5 billion to $135 billion (Enderwick, 2018). Accordingly, it is essential to ascertain the environmental concerns of economic globalization. Moreover, recent studies reported that environmental pollution was the major cause of the spread of novel coronavirus (COVID-19) (Bashir et al., 2020; Fattorini and Regoli, 2020; Travaglio et al., 2021). Furthermore, Wu et al. (2020) acknowledged that carbon emissions and COVID-19 cases had a bidirectional impact on each other. Thus, it becomes significant to include domestic government health expenditures in the nexus of economic growth, energy use, economic globalization, and environmental degradation so that constructive strategies can be constructed.
After taking into account the impact of energy use, the primary objectives of this study are to determine the N-shaped association between economic growth and environmental degradation in China. In addition, the investigation examined the connection between environmental degradation in China and BRI (through economic globalization) and domestic government health expenditures. The subsequent reservations of policymakers, academics, researchers, and government officials are dispelled by the study. First, what is the nature of the economic growth, energy use, and ecological dilapidation nexus for the long term era, and does the N-shaped EKC hypothesis exist? Second, can domestic government health expenditures reduce the level of CO2 emissions? Third, does economic globalization benefit environmental sustainability? The reason to choose these variables is highly based on the study objectives. This study significantly analyzed the impact of economic growth on the environmental pollution in China through the N-shaped EKC. The sudden economic growth in China has raised many questions relevant to environmental excellence and health level. Hence, exploring the linkage between environmental pollution, health expenditures, and economic growth becomes essential. This study contributes to the literature in three ways. First, this investigation explored the nexus of economic growth, energy use, and environmental degradation through the N-shaped EKC theory. Second, this study evaluated how spending budget in health facilities effects environmental pollution. Third, this study reported the imperious role of the Belt and Road Initiative in terms of environmental excellence in China. As per the author’s best knowledge, this is the first examination that evaluates the energy–growth–environmental degradation nexus in a single model. Moreover, it is the first study that measured the impact of the BRI through economic globalization.
The rest of this study is organized as follows. The second section exhibits the recent literature published in environmental economics. The third section discusses the methods applied in this study. The fourth section specifies the results and discussion. Last, the fifth section nominates the conclusion derived from the study’s findings.
The EKC explains the involvement of a state’s economic expansion and its related environmental degradation level. It portrays how a country’s environmental excellence will progress if the development level of a nation goes up (Chenghu et al., 2021). Grossman and Krueger (1991) argued that the connection between environmental quality and economic growth was not linear and varied along the development level of an individual nation. In other words, every nation has its own specific EKC based on the use of resources, economic activities, and social background of that country. Various researchers (Ozcan, 2013; Narayan et al., 2016; Arif et al., 2022) reported an inverted U-shaped relationship between economic growth and environmental degradation. However, some researchers reported that an inverted U-shaped relationship does not always exist. Brajer et al. (2008) analyzed the city-wise EKC in China using panel data models. The study stated that an inverted U-shaped and N-shaped EKC exists in China after controlling the health benefits given to the public. The study used SO2 to nominate the environmental degradation in China. Moreover, Zeraibi et al. (2022) scrutinized the role of broad money supply and government expenditures on environmental degradation in China. The study reported that an inverted U-shaped EKC does not exist in China, though the N-shaped relationship between economic growth and CO2 emissions was significant. However, Etokakpan et al. (2021) examined the N-shaped EKC in China in the presence of urbanization and natural gas consumption from 1971 to 2018. The study documented that the N-shaped EKC does not exist in China, while confirming that a reversed N-shaped EKC was present. The research reported that natural gas consumption and urbanization directly impact CO2 emissions. Barış-Tüzemen et al. (2020) investigated the EKC in turkey after indicating the impact of ICT on CO2 emissions. The study utilized the data from 1980 to 2017 and employed the autoregressive distributed lag (ARDL) model. The findings revealed that ICT has a positive impact on CO2 emissions and an inverted significant N-shaped EKC exists in Turkey. However, the study verified these findings through the Quantile regression method and reported that an insignificant inverted N-shaped EKC was evident. Additionally, Park and Lee, (2011) scrutinized the EKC hypothesis in 16 regions of Korea. The study utilized the panel data of 16 years and employed SO2, NO2, and CO2 to nominate the air pollution. The study revealed that each region in Korea has its own specific shape of EKC by using SO2 and NO2. However, the study noted a possible subsistence of the U-shaped and N-shaped EKC. Moreover, using CO2 emissions, the study found evidence of the U-shaped EKC in most regions across Korea. Moreover, the study mentioned that energy consumption was the highest factor determining the level of environmental degradation in Korea. Rashdan et al. (2021) inspected the EKC hypothesis by using the capture fisheries production (CFP). The research utilized data from 14 nations and employed panel data modeling. The examination discovered the N-shaped affiliation between economic growth and capture fisheries product. Moreover, the study argued that financial development and imports negatively impact the capture fisheries production, while exports positively impact the CFP. Furthermore, Bisset (2022) used the panel data of 41 SSA nations classified into three income classes from 1996 to 2018. The study used the panel data model of SSA states and found that an EKC of the N-shaped exists merely in upper-middle-income groups. The study achieved these findings in the presence of three key governance indicators, i.e., government effectiveness, political and institutional governance, and economic governance.
Khan et al. (2020) examined the ramifications of renewable energy use and health expenditures on CO2 emissions in BRI countries. The study employed the data from 1995 to 2016 and panel data models, i.e., fully modified ordinary least square (FMOLS) and generalized method of moments (GMM). The study found that renewable energy imperatively reduces CO2 emanation. However, the study noted that health expenditures and economic expansion significantly diminish the environmental excellence in BRI states. In addition, Gövdeli (2019) examined the nexus among economic growth, health expenditures, and CO2 emissions in Organization for Economic Co-operation and Development (OECD) nations. The study used secondary data from 1992 to 2014 and applied the panel data models. The study’s results exposed that economic growth imperatively surges environmental degradation. The outcomes of the Granger causality model tested by the vector error correction model (VECM) showed momentous causality in a row from CO2 emissions to health expenditures. Likewise, Ullah et al. (2020) examined the correlations among health expenditures, renewable energy use, trade, and CO2 emissions for the nation of Pakistan by using annual data from 1998 to 2017. The study made known that trade increases environmental degradation, resulting in a major upsurge in health expenditures. However, the study discovered that renewable energy improves environmental quality, which, as a result, significantly diminishes health expenditures. Also, Chaabouni et al. (2016) analyzed the data from 51 nations from 1995 to 2013. The study used panel data techniques and discovered that health expenditures and CO2 emissions have a unidirectional causality relationship, whereas economic growth and health expenditures divulged bidirectional causation.
The Belt and Road Initiative of China has strong potential to increase its per capita income. Moreover, other developing nations can also benefit its economy through the BRI project of China. You and Lv (2018) investigated the spatial impact of economic globalization on environmental degradation. The study used data from 83 nations through 1985 to 2013 and depicted that CO2 emissions and economic globalization have a negative relationship. Hence, the study suggested that highly globalized nations have better environmental quality. Additionally, Shahbaz et al. (2017) applied the ARDL model to ascertain the impact of globalization on environmental degradation in China. The study verified that globalization significantly decreases environmental degradation in China; nevertheless, the use of coal significantly upsurges CO2 emissions. The Granger causality upshots showed that CO2 emissions appreciably cause globalization. Liu et al. (2020) explored the sway of G7 state’s globalization by employing panel data techniques. For this reason, the KOF globalization indicator was utilized. The study documented that globalization and CO2 emissions have an upturned U-shaped association, which proves the existence of the EKC hypothesis. Moreover, the study stated that economic growth increases environmental pollution while renewable energy helps to reduce it.
Energy use imperatively boosts the economic growth of a nation (Zeraibi et al., 2020). However, it has also environmental consequences, which cannot be ignored to achieve sustainable development. The investigation by Zhang and Lin (2012) used data from 1995 to 2010 and analyzed the impact of energy consumption on CO2 emissions at the provincial level of China. The investigation applied the STIRPAT technique and discovered that energy use has a significant nexus with CO2 emissions and urbanization. Similarly, Wang et al. (2016) explored the nexus among energy consumption, CO2 emissions, and economic growth. The study made known that a unidirectional causality was moving from energy use to CO2 emissions; however, the examination also accounted that CO2 emissions had a momentous effect on energy use. Shafiei and Salim (2014) exposed the role of energy use when utilizing the STIRPAT model for OECD territories. The study compared the impact of renewable and non-renewable energy use on CO2 emissions and stated that non-renewable energy has a direct impact while renewable energy has an indirect impact on CO2 emissions. Also, Khan et al. (2019) utilized the time series technique by employing the secondary data from 1971 to 2016. The consequences inspected that energy consumption significantly heightens the level of greenhouse gas emissions in Pakistan. The study also argued that economic globalization, urbanization, and economic growth have direct association with CO2 emissions in china. In addition, the study by Zhang et al. (2023) verified that environmental policies imperatively reduced the air pollution. Moreover, Hou et al. (2023) stated that environmental sustainability is highly connected to renewable energy use. However, the study of Jun et al. (2020) argued that trade openness significantly increases the environmental pollution due to more usage of energy in industry. Hence, the abovepresented literature review shows the significance of testing the N-shaped EKC in China. Moreover, it can also be seen that no research has already investigated the N-shaped relationship between CO2 emissions and economic growth in China after considering the energy use and domestic government health expenditures. Moreover, no study has evaluated the impact of the BRI through economic globalization in China.
The fundamental purpose of this investigation is to analyze the N-shaped association of economic growth with environmental degradation in China. Second, the study revealed the importance of the OBOR project in China measured through economic globalization for environmental excellence in China. Moreover, the study examined the role of energy use on CO2 emissions in the presence of the EKC. For the defined aim, the on-hand research used the quarter data from 2000 to 2019. This selected duration is based on the availability of the data. The study converted the annual data into the quarter form using the methodology of Shehzad et al. (2019). To ascertain the N-shaped EKC in China, the study employed GDP, a square form of GDP, and a cubic form of GDP. Particularly, the proxies used in the study are mentioned in Table 1.
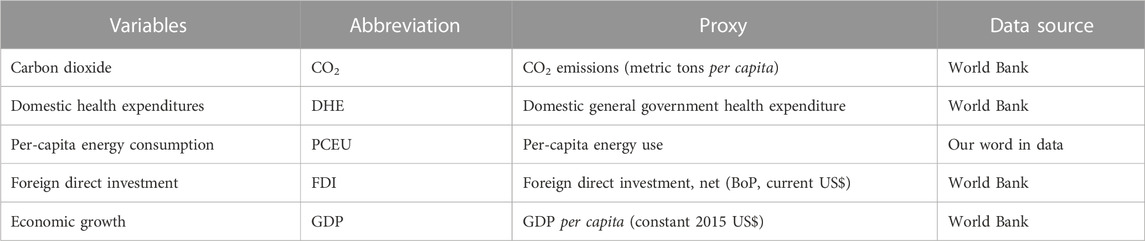
TABLE 1. Description of the study variables.
Our model defines the functional equation as follows:
Here, CO2 nominates the CO2 emissions used to evaluate the environmental degradation in China. Moreover, DHE, ECG, and PCEU indicate the domestic general government health expenditures, economic globalization, and per capita energy use, respectively. In addition, GDP, GDP2, and GDP3 symbolize the economic growth, square of economic growth, and cubic form of economic growth, respectively, to evaluate the N-shaped EKC in China. We utilized the autoregressive distributed lag model to estimate the study factors’ long- and short-run dynamics (Pesaran et al., 2001). We employed the ARDL model for the following reasons: ARDL is the best fit for a small dataset. Additionally, this approach does not bound the data to be stationary at the same level of integration, i.e., I (0) or I (1), and can be applied to mixed co-integrated data. Furthermore, the ARDL model diagnoses the behavior of the dependent variable in terms of its own and prior values of the independent factor (Cherni and Essaber Jouini, 2017; Shehzad et al., 2020). The ARDL co-integration model based on a bound testing approach can be written as follows:
Here,
Here, ECTt-1 nominates the error correction term, which measures the adjustment speed of the dependent variable to gain an equilibrium level. The study engaged the Bruesch–Godfrey serial correlation heteroskedasticity in the model. Furthermore, the cumulative sum of recursive residuals (CUSUM) and its square (CUSUMSQ) techniques are utilized to measure the stability of the ARDL model. At last, the study applied the canonical integration regression technique for robustness testing of the long-run results of the ARDL model.
This investigation has employed the Phillips–Perron (PP) and Augmented Dickey–Fuller (ADF) test (Dickey, D. and Fuller, W., 1979) to ascertain the stationary level of the study factors. The findings of these tests are given in Table 2, which state that complete elements are stationary at the 1st difference level. However, ECG is also stationary at the level, which specified that the stationary order of the study elements is mixed, and the ARDL approach is best to deal with this kind of data. This study used the bound test approach based on the F-test to evaluate the long-run co-integration in the data. The upshots of the bound test are exhibited in Table 3, which shows that the null hypothesis of no co-integration has been rejected at a 5% significance level. Hence, the ARDL model can be utilized to examine the long- and short-run dynamics.
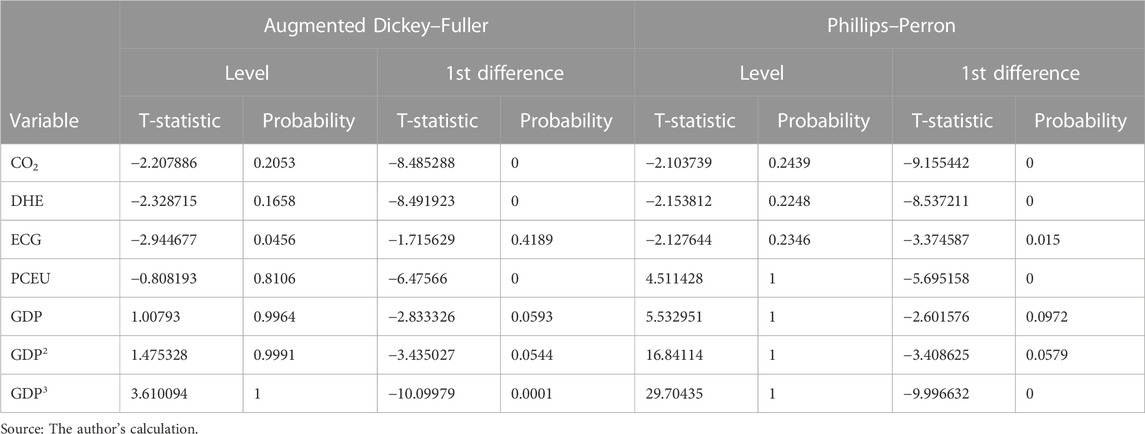
TABLE 2. Unit root testing results.
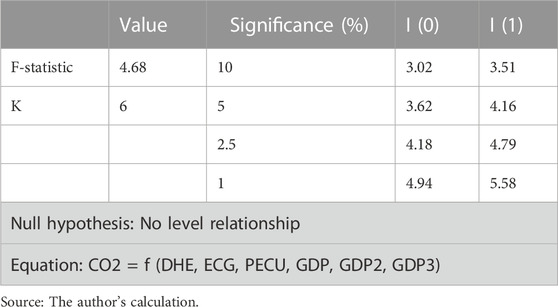
TABLE 3. Results of the bound test.
Table 4 displays the long-run and short-run dynamics among the study variables. The study demonstrated that one unit increase in GDP significantly increases the CO2 emissions by 0.89 units implying that GDP positively effects the environmental degradation in China. However, after achieving the threshold level, the square of GDP (GDP2) revealed that one unit increase in GDP2 lessens the CO2 emission. Moreover, again, when GDP exceeds the threshold level, it increases environmental degradation as one unit increase in GDP3 upsurges the CO2 emissions by 0.909 units. Thus, as per the concept of Narayan and Narayan (2010), these findings demonstrated that there is a long-term N-shaped relationship between economic growth and environmental degradation in China (see Figure 2). Additionally, in the short run, economic growth variables (GDP, GDP2, and GDP3) do not reveal a significant N-shape association with CO2 emissions. Brajer et al. (2008) analyzed the city-wise data of China and documented that both an inverted U-shaped and N-shaped relationship exist between GHGs and economic growth in China. The study used SO2 as a proxy for GHGs. Moreover, the study by Liu et al. (2021) also verified the existence of the EKC hypothesis in China in the presence of agricultural development. However, these findings do not match those of Etokakpan et al. (2021). In addition, the findings expressed that one unit increase in domestic general government health expenditures considerably improves the CO2 emanation for the long period. Nevertheless, for the short-term era, DHE indicated a harmful and noteworthy influence on China’s CO2 emissions. These findings documented that action taken by the general government to improve health conditions also improves the environmental quality and discourages carbon dioxide emissions in China. These findings matched with the study of Chaabouni et al. (2016), Zeeshan (2021), and Bilgili et al. (2021).
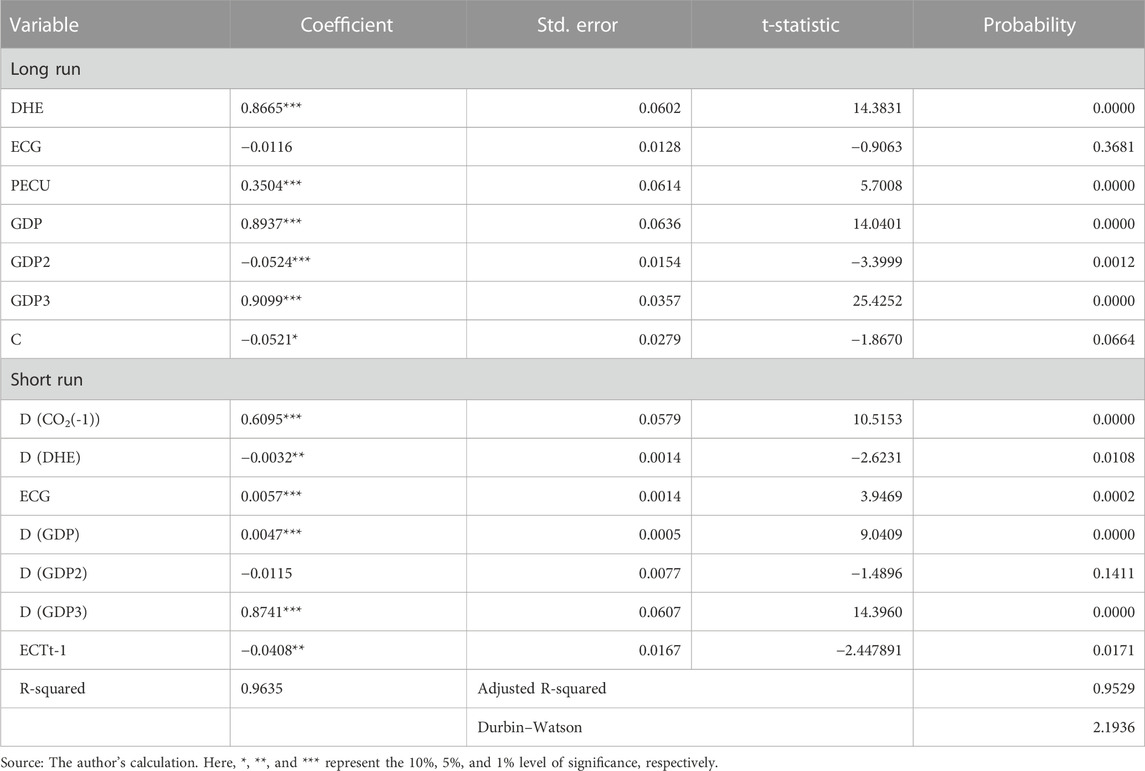
TABLE 4. Long-run and short-run dynamics of the study variables.
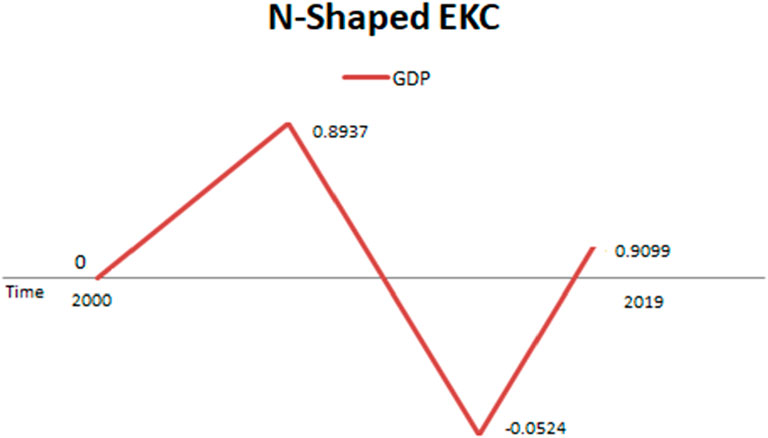
FIGURE 2. N-shaped EKC based on the coefficients calculated through the ARDL model.
This analysis inspected the effects of economic globalization on CO2 emissions, which showed a negative but insignificant liaison with CO2 emissions in the long run. Nonetheless, in the short run, it confirmed the positive association with CO2 emissions. These findings imply that increasing the economic affiliation of China with other countries needs strict policies and strategies that can immensely control the import of polluted goods and services. These results are harmonized with the study of Ahmad M. et al. (2021). The results of PCEU stated that enlarging the energy consumption puts a significant burden on the environmental quality in China. Zhang and Lin (2012) and Wang et al. (2016) also explored the impact of energy consumption on CO2 emissions in the presence of urbanization and economic growth and documented its imperious role for environmental degradation. The error correction term (ECTt-1) specified a negative indication with a value of −0.040 at a significance of a 1% level, implying that divergence occurred in the equilibrium of CO2 emissions because of the independent elements engaged in the study will be accurate with the velocity of 4% in a quarter. Furthermore, the model signified that 96.3% of changes in CO2 emissions are due to the study variables and 95.2% are because of significant factors among them. The Durbin–Watson value is 2.193, entailing that model is free from serial correlation.
The study also applied the canonical co-integrating regression (CCR) model for the robustness of the ARDL upshots. Table 5 illustrates the findings of the CCR model, which also confirms the existence of the N-shaped EKC in China. Hence, it discloses that the results generated through the ARDL model are correct and reliable. However, CCR showed an insignificant impact of PCEU.
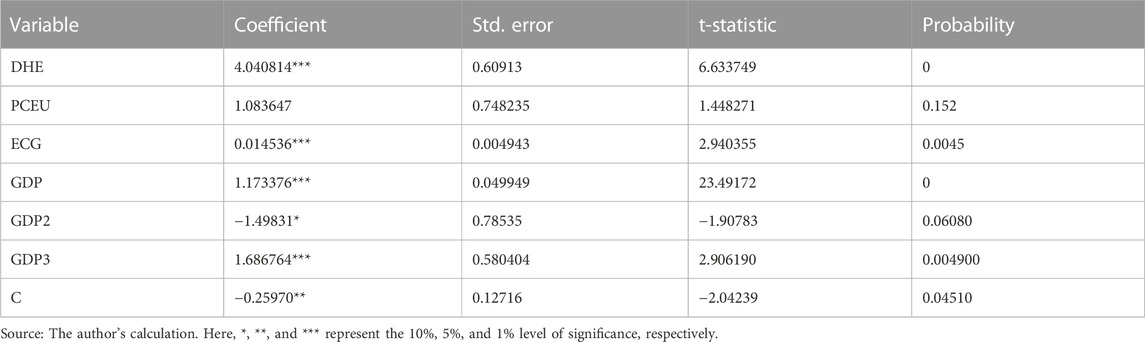
TABLE 5. Robustness testing through the CCR model.
In the analysis, we found that GDP has an encouraging effect on environmental degradation. However, GDP2 designated a negative effect on environmental degradation, which documented that achieving a specific level of economic growth helps improve environmental quality. However, the excess of economic growth again degrades the environmental quality in China as GDP3 represents a positive connection with CO2 emissions. Consequently, it verifies the existence of an N-shaped EKC in China (see Figure 2). In addition, this investigation demonstrated that an increase in energy consumption adversely affects environmental quality and human health. Various studies such as those by Belke et al. (2011); Tang et al. (2016); and Ren et al. (2022) also confirmed that the increase in energy consumption boosts the economic activities and per capita income. In this situation, the study suggested that the government should focus on sustainable development through the installation of the green industry with the help of economic globalization. Moreover, the government should import the green technologies, improving the production process and discouraging pollutant technology use. Moreover, domestic investment in advanced technologies can also boost the final products’ energy efficiency and effectiveness, enhancing environmental excellence. Short-term CO2 emissions were also negatively impacted by domestic general government health expenditures. As a result, the government ought to spend more money on activities that boost health and directly discourage rising CO2 emissions. In order to build institutes that improve health facilities and can advance environmental excellence, the government ought to make it easier for foreign companies to construct such facilities by providing tax breaks and duties.
Table 6 explains the findings of heteroskedasticity and serial correlation evaluation. The outcomes showed that the ARDL approach implemented in this investigation is unoccupied from heteroskedasticity and serial correlation. Moreover, CUSUM and CUSUMSQ lines are also under the limit of a 5% level of significance, meaning that the model is stable and consistent (Figure 3).
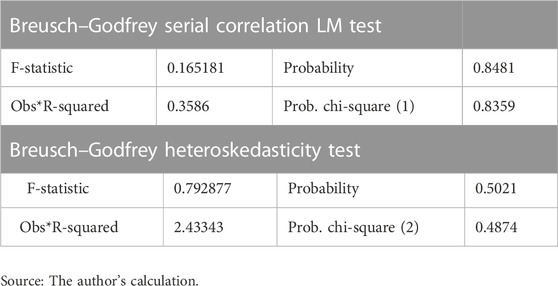
TABLE 6. Outcomes of the stability testing.
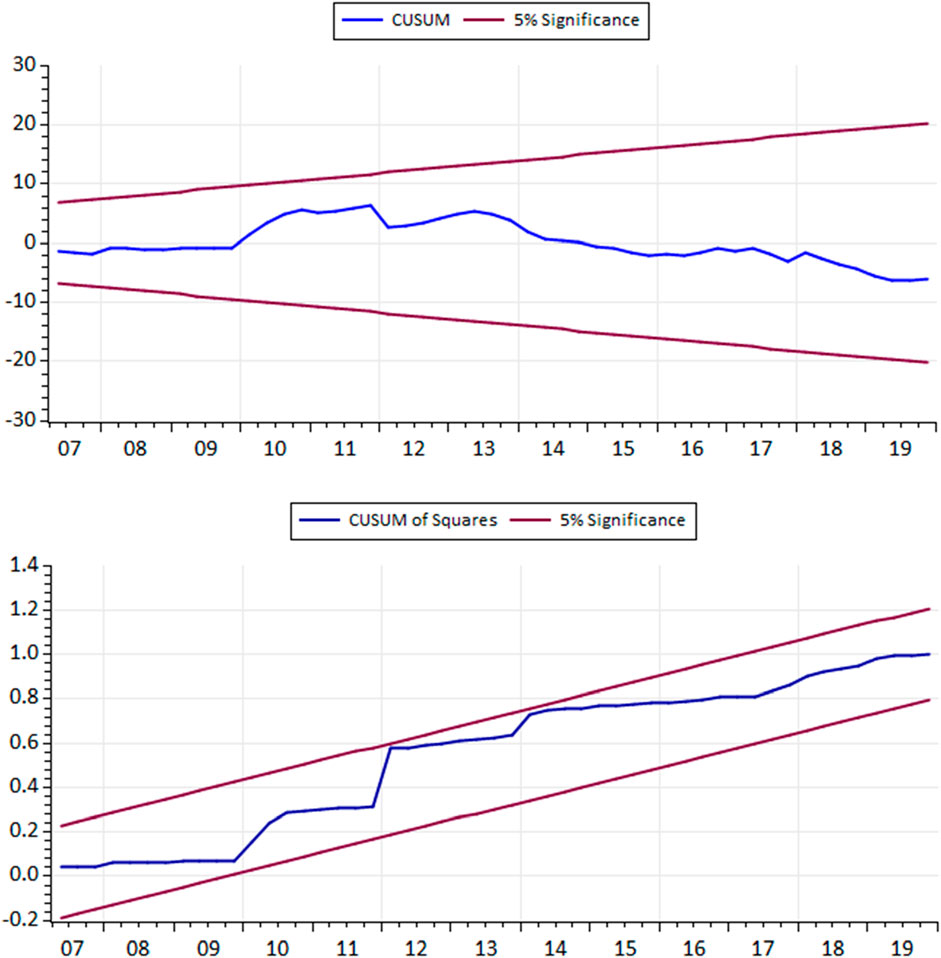
FIGURE 3. CUSUM and CUSUMSQ graph with a 5% level of significance.
Table 7 shows the causality test results, which declare that DHE and CO2 emissions have a bidirectional causation relationship with each other. It entails that a policy focusing the domestic general health expenditures will also impact the environmental excellence in China and vice versa. Moreover, the causality findings of economic growth made known that a remarkable causality effect is moving from CO2 emissions to GDP2 and GDP3, confirming that environmental excellence has a strong bond with economic growth and strategies regarding to control CO2 emissions can improve economic activities. The examination carried out by Esso and Keho (2016) used the panel causality model and showed that a reverse causality was running from GDP to CO2 emissions in several countries of Africa, although the study reported that GDP Granger caused the level of carbon emission in Nigeria. The outcomes of our causality test for economic growth are also in line with the study of Gorus and Aydin (2019). Furthermore, a unidirectional causality attachment of PCEU was documented in the examination, which corroborates that the use of energy causes the CO2 emission augmentation. Mirza and Kanwal (2017) also employed the Granger causality model and highlighted that energy use and CO2 emissions have a bi-variate causality affiliation. On the other hand, Nain et al. (2017) argued that the nature of causality affiliation between energy use and CO2 emissions varies for different sectors.
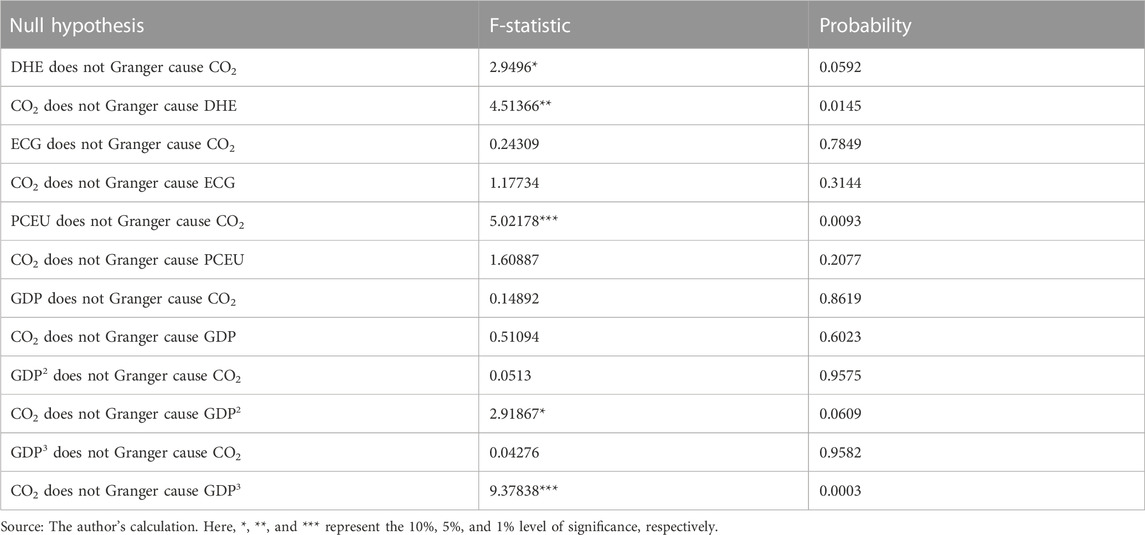
TABLE 7. A causality analysis.
This study’s critical objective is to analyze the N-shaped EKC in China in the presence of domestic general government health expenditures. Moreover, the investigators evaluated the role of OBOR by using the proxy variable of economic globalization on environmental degradation in China. Moreover, the investigation ascertained the impact of energy use on CO2 emissions. The study utilized the quarter data from 2000 to 2019 and employed the autoregressive distributed lag model. Moreover, for the robustness of the findings, the study engaged the CCR model.
The findings of the ARDL model discovered that an N-shaped relationship exists between economic growth and CO2 emissions in China. Moreover, domestic general government health expenditures illustrated a negative impact on CO2 emissions in the short run. However, in the long run, it showed a constructive bonding with CO2 emissions. Also, energy usage illustrated a direct impact on CO2 emissions. The results of the CCR model also confirm the N-shaped EKC in China. Hence, these results successfully answered the queries mentioned in Introduction.
The investigation revealed that amplification in the energy usage heightens the environmental degradation in China. In addition, the study established that China’s economic intensification and CO2 discharge have an N-shaped association, implying that excess economic growth considerably discourages environmental excellence. Therefore, the study suggested that the Chinese government should promote the green industry through economic globalization in order to achieve sustainable development. In a similar vein, the Chinese government must encourage nations along the One Belt One Road to invest in and set up technological businesses that can clean the manufacturing process and improve environmental excellence. Green energy use, which directly reduces environmental degradation, should also be encouraged. The study found that health-promoting activities reduce carbon dioxide emissions. Hence, the Chinese government should increase the health budget and collaborate internationally to improve health-related activities in the country. This study also defines some limitations to achieving these outcomes; i.e., first, the data used in the study are from 2000 to 2019. Second, CO2 emission is utilized to nominate the environmental deprivation. Furthermore, future studies can be conducted by including carbon and ecological footprints to represent the environmental deprivation. Furthermore, urbanization, financial development, environmental innovations, financial globalization, overall globalization, and ICT can be included in the model to verify these findings.
The data used in the study is online available at https://data.worldbank.org/.
MN, MS, and KS: Conceptualization, methodology, software, formal analysis, investigation, resources, writing—original draft, and writing—review and editing. SZ: Supervision and funding.
This study was supported by the National Natural Science foundation of China, 71873004.
The authors declare that the research was conducted in the absence of any commercial or financial relationships that could be construed as a potential conflict of interest.
All claims expressed in this article are solely those of the authors and do not necessarily represent those of their affiliated organizations, or those of the publisher, the editors, and the reviewers. Any product that may be evaluated in this article, or claim that may be made by its manufacturer, is not guaranteed or endorsed by the publisher.
Ahmad, F., Draz, M. U., Chandio, A. A., Ahmad, M., Su, L., Shahzad, F., et al. (2022). Natural resources and environmental quality: Exploring the regional variations among Chinese provinces with a novel approach. Resour. Policy 77, 102745. doi:10.1016/j.resourpol.2022.102745
Ahmad, F., Draz, M. U., Chandio, A. A., Su, L., Ahmad, M., and Irfan, M. (2021a). Investigating the myth of smokeless industry: Environmental sustainability in the ASEAN countries and the role of service sector and renewable energy. Environ. Sci. Pollut. Res. 28, 55344–55361. doi:10.1007/s11356-021-14641-8
Ahmad, F., Draz, M. U., Chang, W.-Y., Yang, S.-C., and Su, L. (2021b). More than the resource curse: Exploring the nexus of natural resource abundance and environmental quality in northwestern China. Resour. Policy 70, 10190. doi:10.1016/j.resourpol.2020.101902
Ahmad, M., Jiang, P., Murshed, M., Shehzad, K., Akram, R., Cui, L., et al. (2021c). Modelling the dynamic linkages between eco-innovation, urbanization, economic growth and ecological footprints for G7 countries: Does financial globalization matter? Sustain. Cities Soc. 70, 102881. doi:10.1016/j.scs.2021.102881
Akbar, A., Rehman, A., Ullah, I., Zeeshan, M., and Afridi, F. E. A. (2020). <p>Unraveling the dynamic nexus between trade liberalization, energy consumption, CO<sub>2</sub> emissions, and health expenditure in southeast asian countries</p>. Risk Manag. Healthc. Policy Vol. 13, 1915–1927. doi:10.2147/rmhp.s272801
Arif, M., Chenghu, Z., Olah, J., Shehzad, K., and Ahmad, M. (2022). Specifying the domineering role of governance in the long term environmental excellence: A case study of Pakistan. SAGE OPEN. New York. doi:10.1177/21582440221121731
Arouri, M. E. H., Ben Youssef, A., M’henni, H., and Rault, C. (2012). Energy consumption, economic growth and CO 2 emissions in Middle East and North African countries. Energy Policy 45, 342–349. doi:10.1016/j.enpol.2012.02.042
Bagliani, M., Bravo, G., and Dalmazzone, S. (2008). A consumption-based approach to environmental Kuznets curves using the ecological footprint indicator. Ecol. Econ. 65, 650–661. doi:10.1016/j.ecolecon.2008.01.010
Barış-Tüzemen, Ö., Tüzemen, S., and Çelik, A. K. (2020). Does an N-shaped association exist between pollution and ICT in Turkey? ARDL and quantile regression approaches. Environ. Sci. Pollut. Res. 27, 20786–20799. doi:10.1007/s11356-020-08513-w
Bashir, M. F., Jiang, B., Komal, B., Bashir, M. A., Farooq, T. H., Iqbal, N., et al. (2020). Correlation between environmental pollution indicators and COVID-19 pandemic: A brief study in californian context. Environ. Res. 187, 109652. doi:10.1016/j.envres.2020.109652
Bbc, (2021). Report: China emissions exceed all developed nations combined. BBC News. Available at: https://www.bbc.com/news/world-asia-57018837 (Accessed October 20, 2022).
Belke, A., Dobnik, F., and Dreger, C. (2011). Energy consumption and economic growth: New insights into the cointegration relationship. Energy Econ. 33, 782–789. doi:10.1016/j.eneco.2011.02.005
Bertinelli, L., Strobl, E., and Zou, B. (2012). Sustainable economic development and the environment: Theory and evidence. Energy Econ. 34, 1105–1114. doi:10.1016/j.eneco.2011.09.007
Bilgili, F., Kuşkaya, S., Khan, M., Awan, A., and Türker, O. (2021). The roles of economic growth and health expenditure on CO2 emissions in selected asian countries: A quantile regression model approach. Environ. Sci. Pollut. Res. 28, 44949–44972. doi:10.1007/s11356-021-13639-6
Bisset, T. (2022). N-Shaped EKC in sub-saharan Africa: The three-dimensional effects of governance indices and renewable energy consumption. Environ. Sci. Pollut. Res. 30, 3321–3334. doi:10.1007/s11356-022-22394-1
Brajer, V., Mead, R. W., and Xiao, F. (2008). Health benefits of tunneling through the Chinese environmental Kuznets curve (EKC). Ecol. Econ. 66, 674–686. doi:10.1016/j.ecolecon.2007.11.002
Chaabouni, S., Zghidi, N., and Ben Mbarek, M. (2016). On the causal dynamics between CO2 emissions, health expenditures and economic growth. Sustain. Cities Soc. 22, 184–191. doi:10.1016/j.scs.2016.02.001
Chenghu, Z., Arif, M., Shehzad, K., Ahmad, M., and Oláh, J. (2021). Modeling the dynamic linkage between tourism development, technological innovation, urbanization and environmental quality: Provincial data analysis of China. Int. J. Environ. Res. Public Health 18, 8456–8521. doi:10.3390/ijerph18168456
Cherni, A., and Essaber Jouini, S. (2017). An ARDL approach to the CO2 emissions, renewable energy and economic growth nexus: Tunisian evidence. Int. J. Hydrogen Energy 42, 29056–29066. doi:10.1016/j.ijhydene.2017.08.072
Dickey, D., A., and Fuller, W., A. (1979). Distribution of the estimators for autoregressive time series with a unit root. JJournal Am. Stat. Assoc. 74, 427–431. doi:10.2307/2286348
Ekeocha, D. O. (2021). Urbanization, inequality, economic development and ecological footprint: Searching for turning points and regional homogeneity in Africa. J. Clean. Prod. 291, 125244. doi:10.1016/j.jclepro.2020.125244
Enderwick, P. (2018). The economic growth and development effects of China’s One Belt, One Road Initiative. Strateg. Chang. 27, 447–454. doi:10.1002/jsc.2229
Esso, L. J., and Keho, Y. (2016). Energy consumption, economic growth and carbon emissions: Cointegration and causality evidence from selected African countries. Energy 114, 492–497. doi:10.1016/j.energy.2016.08.010
Etokakpan, M. U., Akadiri, S. Saint, and Alola, A. A. (2021). Natural gas consumption-economic output and environmental sustainability target in China: An N-shaped hypothesis inference. Environ. Sci. Pollut. Res. 28, 37741–37753. doi:10.1007/s11356-021-13329-3
Fattorini, D., and Regoli, F. (2020). Role of the chronic air pollution levels in the Covid-19 outbreak risk in Italy. Environ. Pollut. 264, 114732. doi:10.1016/j.envpol.2020.114732
Gorus, M. S., and Aydin, M. (2019). The relationship between energy consumption, economic growth, and CO2 emission in MENA countries: Causality analysis in the frequency domain. Energy 168, 815–822. doi:10.1016/j.energy.2018.11.139
Gövdeli, T. (2019). Sağlık harcamaları, ekonomik büyüme ve CO2 emisyonu: OECD ülkelerinden kanıtlar. Adıyaman Üniversitesi Sos. Bilim. Enstitüsü Derg., 488–516. doi:10.14520/adyusbd.477571
Grossman, G., and Krueger, A. (1991). Environmental impacts of a north American free trade agreement. Natl. Bur. Econ. Res., 1–57. doi:10.3386/w3914
Grossman, G. M., and Krueger, A. B. (1995). Economic growth and the environment. Q. J. Econ. 110, 353–377. doi:10.2307/2118443
Haggai, K. (2016). One Belt One Road strategy in China and economic development in the concerning countries. World J. Soc. Sci. humanit. 2, 10–14.
Han, J., Zeeshan, M., Ullah, I., Rehman, A., and Afridi, F. E. A. (2022). Trade openness and urbanization impact on renewable and non-renewable energy consumption in China. Environ. Sci. Pollut. Res. 29, 41653–41668. doi:10.1007/s11356-021-18353-x
Hou, H., Lu, W., Liu, B., Hassanein, Z., Mahmood, H., and Khalid, S. (2023). Exploring the role of fossil fuels and renewable energy in determining environmental sustainability: Evidence from OECD countries. Sustainability 15, 2048. doi:10.3390/su15032048
Jun, W., Mahmood, H., and Zakaria, M. (2020). IMPACT OF TRADE OPENNESS ON ENVIRONMENT IN CHINA, 21, 1185–1202.
Khan, A., Hussain, J., Bano, S., and Chenggang, Y. (2020). The repercussions of foreign direct investment, renewable energy and health expenditure on environmental decay? An econometric analysis of B&RI countries. J. Environ. Plan. Manag. 63, 1965–1986. doi:10.1080/09640568.2019.1692796
Khan, M. K., Teng, J.-Z., Khan, M. I., and Khan, M. O. (2019). Impact of globalization, economic factors and energy consumption on CO2 emissions in Pakistan. Sci. Total Environ. 688, 424–436. doi:10.1016/j.scitotenv.2019.06.065
Lee, H. L., and Shen, Z.-J. M. (2020). Supply chain and logistics innovations with the belt and road initiative. J. Manag. Sci. Eng. 5, 77–86. doi:10.1016/j.jmse.2020.05.001
Liu, M., Ren, X., Cheng, C., and Wang, Z. (2020). The role of globalization in CO2 emissions: A semi-parametric panel data analysis for G7. Sci. Total Environ. 718, 137379. doi:10.1016/j.scitotenv.2020.137379
Liu, Y., Mabee, W., and Zhang, H. (2021). Conserving fertilizer in China’s rural-agricultural development: The reversal shifts and the county-specific EKC evidence from Hubei. Clean. Environ. Syst. 3, 100050. doi:10.1016/j.cesys.2021.100050
Mirza, F. M., and Kanwal, A. (2017). Energy consumption, carbon emissions and economic growth in Pakistan: Dynamic causality analysis. Renew. Sustain. Energy Rev. 72, 1233–1240. doi:10.1016/j.rser.2016.10.081
Nain, M. Z., Ahmad, W., and Kamaiah, B. (2017). Economic growth, energy consumption and CO2 emissions in India: A disaggregated causal analysis. Int. J. Sustain. Energy 36, 807–824. doi:10.1080/14786451.2015.1109512
Narayan, P. K., and Narayan, S. (2010). Carbon dioxide emissions and economic growth: Panel data evidence from developing countries. Energy Policy 38, 661–666. doi:10.1016/j.enpol.2009.09.005
Narayan, P. K., Saboori, B., and Soleymani, A. (2016). Economic growth and carbon emissions. Econ. Model. 53, 388–397. doi:10.1016/j.econmod.2015.10.027
Ozcan, B. (2013). The nexus between carbon emissions, energy consumption and economic growth in Middle East countries: A panel data analysis. Energy Policy 62, 1138–1147. doi:10.1016/j.enpol.2013.07.016
Park, S., and Lee, Y. (2011). Regional model of EKC for air pollution: Evidence from the Republic of Korea. Energy Policy 39, 5840–5849. doi:10.1016/j.enpol.2011.06.028
Pathak, M. (2021). Working group iii contribution to the ipcc sixth assessment report (Ar6) technical summary. Mitig. Clim. Chang. doi:10.1017/9781009325844.009
Pesaran, M. H., Shin, Y., and Smith, R. J. (2001). Bounds testing approaches to the analysis of level relationships. J. Appl. Econom. 16, 289–326. doi:10.1002/jae.616
Rashdan, M. O. J., Faisal, F., Tursoy, T., and Pervaiz, R. (2021). Investigating the N-shape EKC using capture fisheries as a biodiversity indicator: Empirical evidence from selected 14 emerging countries. Environ. Sci. Pollut. Res. 28, 36344–36353. doi:10.1007/s11356-021-13156-6
Ren, X., Tong, Z., Sun, X., and Yan, C. (2022). Dynamic impacts of energy consumption on economic growth in China: Evidence from a non-parametric panel data model. Energy Econ. 107, 105855. doi:10.1016/j.eneco.2022.105855
Shafiei, S., and Salim, R. A. (2014). Non-renewable and renewable energy consumption and CO2 emissions in OECD countries: A comparative analysis. Energy Policy 66, 547–556. doi:10.1016/j.enpol.2013.10.064
Shahbaz, M., Khan, S., Ali, A., and Bhattacharya, M. (2017). The impact of globalization on CO2 emissions in China. Singap. Econ. Rev. 62, 929–957. doi:10.1142/s0217590817400331
Shehzad, K., Liu, X., Rauf, A., Arif, M., Mazhar, S., Sohail, N., et al. (2019). Revolutionising tourism development in China: An effective role of ICT and western silk road project. Asia Pac. J. Tour. Res. 24, 965–977. doi:10.1080/10941665.2019.1653334
Shehzad, K., Xiaoxing, L., Sarfraz, M., and Zulfiqar, M. (2020). Signifying the imperative nexus between climate change and information and communication technology development: A case from Pakistan. Environ. Sci. Pollut. Res. 27, 30502–30517. doi:10.1007/s11356-020-09128-x
Shehzad, K., Zaman, U., Ahmad, M., and Liu, X. (2021). Asymmetric impact of information and communication technologies on environmental quality: Analyzing the role of financial development and energy consumption. Environ. Dev. Sustain. 24, 1761–1780. doi:10.1007/s10668-021-01506-w
Shehzad, K., Zeraibi, A., and Zaman, U. (2022). Testing the N-shaped environmental Kuznets Curve in Algeria: An imperious role of natural resources and economic globalization. Resour. Policy 77, 102700. doi:10.1016/j.resourpol.2022.102700
Stern, D. I. (2004). The rise and fall of the environmental Kuznets curve. World Dev. 32, 1419–1439. doi:10.1016/j.worlddev.2004.03.004
Tang, C. F., Tan, B. W., and Ozturk, I. (2016). Energy consumption and economic growth in Vietnam. Renew. Sustain. Energy Rev. 54, 1506–1514. doi:10.1016/j.rser.2015.10.083
Torras, M., and Boyce, J. K. (1998). Income, inequality, and pollution: A reassessment of the environmental Kuznets curve. Ecol. Econ. 25, 147–160. doi:10.1016/s0921-8009(97)00177-8
Travaglio, M., Yu, Y., Popovic, R., Selley, L., Leal, N. S., and Martins, L. M. (2021). Links between air pollution and COVID-19 in England. Environ. Pollut. 268, 115859. doi:10.1016/j.envpol.2020.115859
Tunç, G. I., Türüt-Asik, S., and Akbostanci, E. (2009). The relationship between income and environment in Turkey: Is there an environmental Kuznets curve. J. Energy Policy 37, 861–867. doi:10.1016/j.enpol.2008.09.088
Ullah, I., Rehman, A., Khan, F. U., Shah, M. H., and Khan, F. (2020). Nexus between trade, CO2 emissions, renewable energy, and health expenditure in Pakistan. Int. J. Health Plann. Manage. 35, 818–831. doi:10.1002/hpm.2912
Wang, L., Vo, X. V., Shahbaz, M., and Ak, A. (2020). Globalization and carbon emissions: Is there any role of agriculture value-added, financial development, and natural resource rent in the aftermath of COP21? J. Environ. Manage. 268, 110712. doi:10.1016/j.jenvman.2020.110712
Wang, S., Li, Q., Fang, C., and Zhou, C. (2016). The relationship between economic growth, energy consumption, and CO2 emissions: Empirical evidence from China. Sci. Total Environ. 542, 360–371. doi:10.1016/j.scitotenv.2015.10.027
Wu, X., Nethery, R. C., Sabath, M. B., Braun, D., and Dominici, F. (2020). Air pollution and COVID-19 mortality in the United States: Strengths and limitations of an ecological regression analysis. Sci. Adv. 6, eabd4049. doi:10.1126/sciadv.abd4049
Yilanci, V., and Gorus, M. S. (2020). Does economic globalization have predictive power for ecological footprint in mena counties? A panel causality test with a fourier function. Environ. Sci. Pollut. Res. 27, 40552–40562. doi:10.1007/s11356-020-10092-9
You, W., and Lv, Z. (2018). Spillover effects of economic globalization on CO2 emissions: A spatial panel approach. Energy Econ. 73, 248–257. doi:10.1016/j.eneco.2018.05.016
Zeeshan, M. (2021). Nexus between foreign direct investment, energy consumption, natural resource, and economic growth in Latin American countries. Int. J. Energy Econ. Policy.
Zeraibi, A., Ahmed, Z., Shehzad, K., Murshed, M., Nathaniel, S. P., and Mahmood, H. (2022). Revisiting the EKC hypothesis by assessing the complementarities between fiscal, monetary, and environmental development policies in China. Environ. Sci. Pollut. Res. 29, 23545–23560. doi:10.1007/s11356-021-17288-7
Zeraibi, A., Balsalobre-Lorente, D., and Shehzad, K. (2020). Examining the asymmetric nexus between energy consumption, technological innovation, and economic growth; does energy consumption and technology boost economic development? Sustain 12, 8867. doi:10.3390/su12218867
Zhang, C., and Lin, Y. (2012). Panel estimation for urbanization, energy consumption and CO2 emissions: A regional analysis in China. Energy Policy 49, 488–498. doi:10.1016/j.enpol.2012.06.048
Keywords: N-shaped EKC, economic growth, energy use, economic globalization, CO2, health expenditures, BRI, ARDL
Citation: Narcisse M, Zhang S, Shahid MS and Shehzad K (2023) Investigating the N-shaped EKC in China: An imperious role of energy use and health expenditures. Front. Environ. Sci. 11:1149507. doi: 10.3389/fenvs.2023.1149507
Received: 22 January 2023; Accepted: 09 March 2023;
Published: 03 April 2023.
Edited by:
Fayyaz Ahmad, Lanzhou University, ChinaReviewed by:
Hamid Mahmood, Xi’an Jiaotong University, ChinaCopyright © 2023 Narcisse, Zhang, Shahid and Shehzad. This is an open-access article distributed under the terms of the Creative Commons Attribution License (CC BY). The use, distribution or reproduction in other forums is permitted, provided the original author(s) and the copyright owner(s) are credited and that the original publication in this journal is cited, in accordance with accepted academic practice. No use, distribution or reproduction is permitted which does not comply with these terms.
*Correspondence: Shiyun Zhang, c2hpeXVuamZAYWhhdS5lZHUuY24=
Disclaimer: All claims expressed in this article are solely those of the authors and do not necessarily represent those of their affiliated organizations, or those of the publisher, the editors and the reviewers. Any product that may be evaluated in this article or claim that may be made by its manufacturer is not guaranteed or endorsed by the publisher.
Research integrity at Frontiers
Learn more about the work of our research integrity team to safeguard the quality of each article we publish.