 Ying Wei1
 Chang Yu
94% of researchers rate our articles as excellent or good
Learn more about the work of our research integrity team to safeguard the quality of each article we publish.
Find out more
ORIGINAL RESEARCH article
Front. Environ. Sci., 19 June 2023
Sec. Environmental Economics and Management
Volume 11 - 2023 | https://doi.org/10.3389/fenvs.2023.1149492
This article is part of the Research TopicLow-Carbon Transformation for Sustainable DevelopmentView all 14 articles
Introduction: Timber and its products are key carriers of carbon stocks and can cause a hysteresis effect of carbon release in the carbon cycle of forest ecosystems. The literature regarding the cross-regional flow of timber carbon stock mainly pays attention to production- and consumption-based perspectives, which cannot reflect how the primary inputs drive timber carbon stock flow. The income-based perspective accounting can identify the influence of primary input suppliers and supplement research on timber carbon stock embodied in trade. The goal of this paper is to explore the cross-regional flow of global timber carbon stock and identify the critical countries from an income-based perspective.
Methods: We used the Ghosh-multi-regional input-output (MRIO) model to calculate the income-based timber carbon stock flow among 190 countries. Furthermore, combined with the Leontief-MRIO model, a comparative analysis is carried out to analyze the different results of the income-based, production-based, and consumption-based methods.
Results: The results showed that the income-based timber carbon stock of the United States and China were among the top countries in imports and exports simultaneously. However, their export volumes were significantly larger, meaning that these countries have invested more primary resources in timber products. The timber carbon stock of the United States mainly flows into Canada and Brazil. In China, the largest flow went to Canada. Furthermore, the flow to the United States increased significantly. Moreover, comparing the three perspectives shows that the United States’ primary inputs have a greater impact on the global timber production chain than their production- and consumption-based roles. Brazil and Russia, as main primary resource suppliers of timber carbon stock, are more important than as final consumers.
Discussion: The research can contribute to clarify the flow of forest resources embodied in global trade activities. Furthermore, it also provides a scientific basis to fairly account for carbon offset shares to achieve better the goal of forest resource protection agreed upon in COP26.
Global climate change has seriously endangered the living environments of human beings. As the largest ecosystem on land, forests play an important role in mitigating climate change by fixing carbon dioxide through photosynthesis (Abderrahmane et al., 2021). The ecological functions of forests are critical for maintaining biosphere stability (Winjum et al., 1992; Köhl et al., 2015; Zhang L. et al., 2020; Girona et al., 2023). According to the 15th Sustainable Development Goal proposed by the United Nations, deforestation and desertification caused by human activities and climate change have brought challenges to sustainable development. It also affects the livelihoods of millions of people and poverty alleviation goals. Furthermore, the twenty-sixth session of the Conference of the Parties (COP26) to the United Nations Framework Convention on Climate Change (UNFCCC) held in Glasgow, UK, in 2021 announced “Glasgow Leaders’ Declaration on Forests and Land Use,” committing to halt and reverse deforestation and land degradation by 2030. They also committed to providing $19 billion for protecting and restoring 13 million square miles of forest. All these international actions have shown the significance of forests in global sustainable development and climate change. Furthermore, they have determined how to manage forests and combat deforestation.
Timber and timber products, as key carriers of carbon stock (Beamesderfer et al., 2020), can cause a hysteresis effect of carbon release in the carbon cycle of forest ecosystems (Backéus et al., 2005; Lal, 2005; Jasinevičius et al., 2018; Johnston and Radeloff, 2019). Moreover, timber is one of the most critical production factors and raw materials in the processing industry, and the direct or indirect demand for timber in different sectors of various countries inevitably leads to the cross-regional flow of timber and timber carbon stock. We analyze global timber carbon stock from three perspectives: income-based perspective (enabled by the primary input, e.g., labor, land, and fixed assets) of a certain sector in a country), production-based perspective (directly produced by a certain sector in a country), consumption-based perspective (caused by the final demand of a certain sector in a country). These three perspectives are studied from different stages of the production chain. They can clarify the role of different countries in the production chain and provide a decision-making basis for promoting the timber production process. Studies have explored the cross-regional flow of timber carbon stock from production- and consumption-based perspectives. Zhang Q. et al. (2020) calculated the volume and flow of timber carbon stock in the main nations of the world from production and consumption perspectives, respectively. The results showed that developed nations consumed much carbon stock from undeveloped nations through international trade. Taking the countries of the Belt and Road as the research object; Li et al. (2022a) studied consumption-based timber carbon stock and pointed out the main factors having effects on the change of the timber carbon stock. They identified that final demand (products that have been finally processed or consumed in the region) has a positive effect. However, the production- and consumption-based perspectives cannot clearly bring out the supply-driven effect of upstream production chains, that is, the driving role of primary inputs (e.g., labor, land, and factory buildings) (Steininger et al., 2016; Li J. et al., 2021). The income-based perspective considers pollution emissions or resource consumption in subsequent production caused by production factor suppliers that obtain income by providing primary factors (Yan et al., 2016; Zhang et al., 2019; Zhang et al., 2022). For example, Liang et al. (2016) revealed the relative contribution of changes in primary supply-side inputs to greenhouse gases (GHG) in the United States. Changes in the primary input level (i.e., the amount of primary inputs per capita) were the largest contributor to GHG emissions from 1995 to 2009. Li et al. (2022b) investigated the global flows of trade-embodied polycyclic aromatic hydrocarbons (PAH) from consumption- and income-based perspectives. Our results showed that, in 2014, 16.8% and 10.1% of global PAH emissions were transferred through international trade by consumption and primary inputs, respectively. From an income-based perspective, India and the rest of Asia experienced a significant increase in net income-based outflows, indicating leakage of income-based emissions from emerging markets. These studies show that international trade not only separates the production and consumption sides in geographic space. Additionally, it also separates the primary input on the global supply chain. The analysis from primary suppliers perspective can complement production- and consumption-based studies to thoroughly understand the driving forces of the global transfer of pollution and resource consumption. However, research on the global flow of timber carbon stock has not been conducted from an income-based perspective. As a critical primary input, timber can influence downstream production; thus, income-based analysis can show the timber carbon stock embodied in trade driven by primary suppliers.
This study aims to identify the crucial primary suppliers that drive the transfer of timber carbon stock embodied in trade. Moreover, we analyze the various results by comparing income-based, production-based, and consumption-based analyses, emphasizing the significant role of primary input countries in the timber supply chain. The organization of this article is as follows. In Section 2, it presents the research methods and data sources. This study used the Ghosh-multi-regional input-output (MRIO) model to calculate the income-based timber carbon stock flow among 190 countries. Furthermore, combined with the Leontief-MRIO model, a comparative analysis is carried out to analyze the different results of the income-based, production-based, and consumption-based methods. Section 3 demonstrates the results of imports and exports as well as the net trade distribution of global timber carbon stock driven by primary inputs. It also demonstrates the patterns of the global flow of timber carbon stock from three perspectives. Finally, Section 4 concludes the study. The research results can help clarify the flow of forest resources embedded in global trade activities. Furthermore, it also provides a scientific basis to fairly account for carbon offset shares to achieve better the goal of forest resource protection agreed upon in COP26.
The MRIO model reveals interdependent relationships between sectors across countries (Malik et al., 2018; Wiedmann and Lenzen, 2018; Xu et al., 2020). Production-based methods have been used to study resource consumption or environmental pollution caused by direct producers (Pan et al., 2008). However, they cannot reflect the pollution or resource consumption embodied in the cross-regional supply chain; thus, the consumption-based method is proposed to quantify the resource use and emissions caused by final demand (Rodrigues and Domingos, 2008). Numerous studies have been conducted to account for carbon emissions (Mi et al., 2017; Lenzen et al., 2018; Liang et al., 2020; Lu et al., 2020; Yang et al., 2020), energy consumption (Soulier et al., 2018; Ezici et al., 2020; Wang and Ge, 2020), particulate matter 2.5 emissions (Liang et al., 2017a), and water resource use (Lenzen et al., 2013; Yang et al., 2021). However, these two methods fail to capture the driving role of primary input at the beginning of the supply chain. Income-based methods can reflect resource consumption and pollution emissions driven by primary suppliers (Qi et al., 2019; Wang et al., 2020; Li R. et al., 2021; Yang et al., 2022). Income-based timber carbon stock accounting indicates timber carbon stock caused by income from wages, profits, and rents (payments for primary factors). The principle of income-based analysis is that the production factor suppliers provide primary factors to producers that use the factors to manufacture goods or provide services. Furthermore, the final products and services are supplied to downstream producers and consumers (Lenzen and Murray, 2010; Miller and Temurshoev, 2017). The income-based perspective states that although primary factor suppliers do not directly generate pollution emissions or resource degradation, they cause emissions by providing production factors for downstream producers. In this process, primary input suppliers obtain income from wages, profits, or rent from the production factors. Such economic benefits drive the generation of emissions in the production chain (Marques et al., 2012; 2013; Yuan et al., 2018). Liang et al. (2017b) found that the income-based accounting method can reveal new critical countries and sectors of GHG emissions by comparing production- and consumption-based analyses. Xie et al. (2017) estimated the amount of interprovincial carbon emissions transferred in China from a supply-side perspective. The results show that central and western regions mainly transferred their carbon emissions to eastern coastal regions. They put forward that the central and western regions should select downstream enterprises with low carbon emission intensity and high resource utilization to achieve low-carbon production goal. Chen et al. (2019) compared the CO2 emissions of 30 provinces in China from three perspectives based on production, consumption, and income. In previous studies, they found that the tertiary industry, generally considered a low-carbon industry, was the main contributor to China’s income-based carbon emissions, accounting for 31% of China’s total income-based carbon dioxide emissions. These studies show obvious differences between income-based, production-based, and consumption-based pollution and resource consumption transfer methods. Therefore, an income-based perspective can provide a new scientific reference for cross-regional pollution and resource transfer. We compare the differences between production-based, consumption-based and income-based in order to observe the role of different countries in the timber supply chain from the three perspectives, to better explore the income-based research findings and highlight the primary suppliers of timber carbon stock to provide a basis for the decision-making.
We integrated the MRIO model and the accounting method for timber carbon stock to trace the global transfer of timber carbon stock embodied in trade. The Ghosh-MRIO model traces the global flow driven by primary suppliers. Furthermore, the Leontief-MRIO model reveals the characteristics from a consumption-based perspective. Previous studies have provided the basis for timber carbon stocks accounting methods (Zhang L. et al., 2020; Li et al., 2022a), the MRIO extended matrix of timber carbon stock was calculated using the carbon conversion factors released by the Intergovernmental Panel on Climate Change (IPCC) and timber harvest volume from the Food and Agriculture Organization of the United Nations (FAO) database1. We used the Global Trade Analysis Project (GTAP) database2 for the MRIO analysis and selected 141 nations (regions) for data acquisition.
According to the Ghosh-MRIO model,
Introduce the direct sales factor:
Eq. 2 is expressed as a matrix:
E is the coefficient matrix of the timber carbon stock, and E′ indicates the transpose of the matrix E.
The total output X can be expressed based on the row balance of the input-output table and the Leontief-MRIO model principles as:
Where A indicates consumption coefficient matrix and Y represents the final demand matrix. Eq. 6 can be transformed into:
Where
Our previous study (Zhang Q. et al., 2020) derived a calculation method for the carbon stock of timber on the production and consumption sides as follows:
Where
In this study, the MRIO data were obtained from the 10th edition of the GTAP database. The research objects included 141 countries and regions worldwide. Additionally, the time series data included 2004, 2007, 2011, and 2014. The timber harvesting data was obtained from the FAO, and we used the carbon conversion factor parameter from “the 2006 IPCC Guidelines for National Greenhouse Gas Inventories” to calculate timber carbon stock. Referring to our previous research method (Zhang L. et al., 2020; Li et al., 2022a), only the forestry logging sector has the primary input of timber carbon stock to calculate. Furthermore, other sectors do not conduct logging. Thus, the input coefficient of the timber carbon stock is zero in other sectors. Due to the differences in the carbon conversion factors of timber harvested in different climatic zones, we classified the countries according to the different climatic zones to improve the accuracy of the timber carbon stock (Zhang Q. et al., 2020)
Figure 1 reports the main importers and exporters of income-based timber carbon stock in 2014. It can be found that the top 5 countries in terms of export volume are the United States, China, Germany, Russia, and France. Among them, the United States, China, and Germany import and export timber carbon stock simultaneously. However, they export more, meaning that they are major suppliers of primary timber carbon stock products. China had a large population, and the cost of human resources was relatively low from 2004 to 2014. Therefore, more human capital is invested in timber production. With a rich forest resource endowment, the United States has a high per capita forest allocation. It has invested more primary resources (such as labor and land, among others) in timber products. Additionally, it has provided the world with more timber carbon stock (Zhang L. et al., 2020). Notably, Figure 1 shows that the import volume of Canada’s income-based timber carbon stock is much higher than its export volume, indicating that Canada is a major country of importing income-based timber carbon stock. This result is the opposite of that of the United States (see Figure 2), although they are both developed forestry countries located in North America. A large part of Canada’s domestic timber carbon stock comes from importing forest resources from other countries instead of its domestic primary input (Gilani et al., 2020). Thus, Canada obtained higher factor payments in the timber supply chain. Compared to the United States, Canada’s population is one-tenth the size of the United States (according to the data from WorldBank3). This could be related to a relatively higher human resource cost, as previous studies have reported (Jones G. W., 1992). The wood-processing industry in the United States is more developed than in Canada (Das et al., 2005). The United States has produced approximately twice as many wood-processed products in the last decade (Hu et al., 2015). The climate in the United States is relatively better for tree growth (Peichl et al., 2006), especially in the South where trees grow much faster. In contrast, except for the west coast, the climate in other places in Canada is colder, where the timber grows more slowly (Tardif et al., 2006). Thus, the previous findings could be related to Canada’s forests having a lower carbon stock capacity in Canadian forests in comparison with those from the United States. In addition, Canada’s deforestation rate is low and the area of forest used for production only accounts 6% of the total forest area (Gilani and Innes, 2020). Thus, Canada’s income-based timber carbon stock imports are affected by population, climate, and forests factors. In addition, they import more compared to the export volume of timber carbon stock in Brazil and India, indicating that they get more timber carbon stock processed products from abroad.
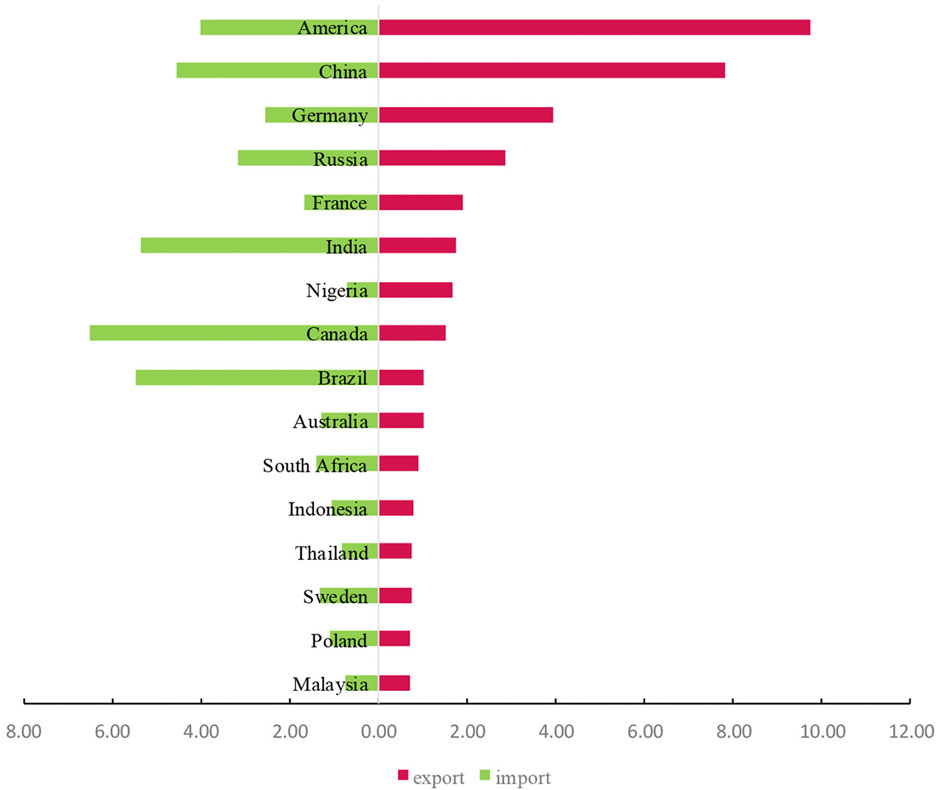
FIGURE 1. Income-based timber carbon stock in 16 main countries in the world in 2014 (unit: 104 tons).
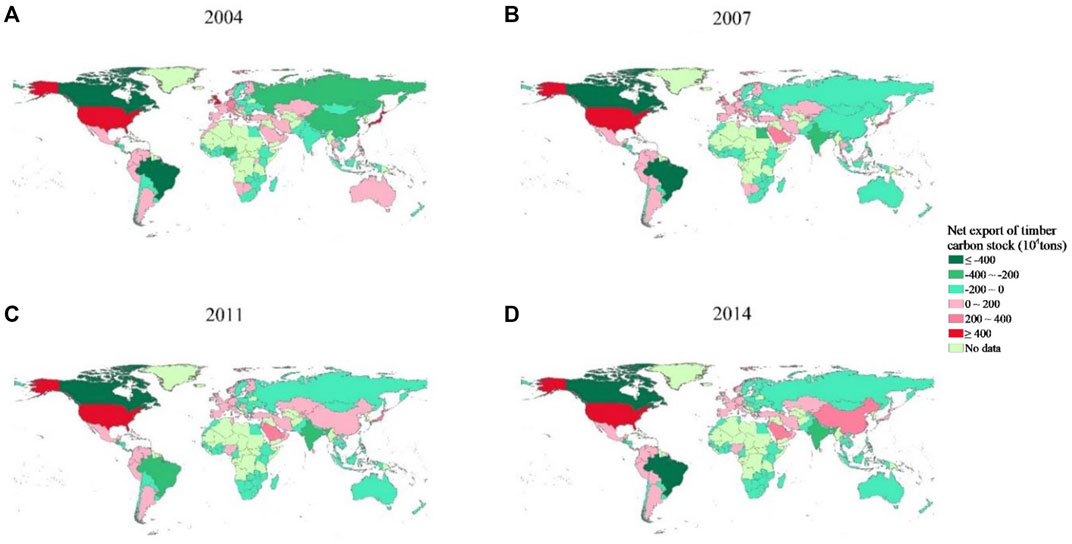
FIGURE 2. Global net exports of income-based timber carbon stock in 2004 (A), 2007 (B), 2011 (C), and 2014 (D) (unit:104 tons). Note: The green represents net importers and the red represents net exporters.
Global net exports and imports of timber carbon stock from the income-based perspective from 2004 to 2014 are shown in Figure 2. Bounded by 4 million tons, from the point of view of the net importing country, Canada and Brazil are large net importers of timber carbon stock. The other net importers mostly reveal a low volume of timber carbon stock. In the aspect of the net exporters, the nation with the large volume of timber carbon stock is the United States, and its net export value is much higher than that of China, which ranks second. From the perspective of the time change trend, compared with 2004, the regional distribution of the global net trade timber carbon stock in 2014 has changed greatly. Russia’s imports of timber carbon storage have always been greater than exports from 2004 to 2014. However, the difference between imports and exports is narrowing. Notably, China’s net trade in timber carbon stocks changed significantly between 2004 and 2014. China changed from a net importer to a net exporter after 2007. This change indicates that from 2004 to 2014, China provided an increasing primary input for processing timber products and gradually shifted from exporting simple processed timber to exporting high-value-added timber processing products.
In terms of outflows, as Figure 3 shows, the United States had the largest outflow of income-based timber carbon stock from 2004 to 2014. The largest volume of timber carbon stock of the United States flowed into Canada. Additionally, the flow from the United States to Brazil showed an evident upward trend. The outflow of China’s income-based timber carbon stock increased significantly, with the most volume flow going to Canada in 2004 and 2007. The flow from China to the United States increased by 38.7%, from 493,600 tons in 2004 to 684,700 tons in 2014. Japan’s income-based timber carbon stock has mainly flowed to China, Canada, and the United States. However, the total outflow has been declining annually. In terms of inflows, Canada, Brazil, Russia, and India were net inflow countries from 2004 to 2014. Furthermore, most of their income-based timber carbon stocks were from the United States and China. However, the total timber carbon stock from the United States to these four countries have dropped by 31.68% in 2014 compared to 2004. In addition, China was a net importer before 2007. Furthermore, China was a net exporter in 2011 and 2014. The largest inflow source was the United States. However, from 2004 to 2014, the outflow of timber carbon stock from the United States to China decreased by 50.77%, from 951,200 tons to 468,300 tons, reflecting the US restrictions on the export of China’s income-based timber carbon stock. To summarize the global trend of income-based timber carbon stock, it can be seen that from 2004 to 2014, the outflows of timber carbon stock enabled by the primary supply from the United States and Japan showed a downward trend, while that of China showed an upward trend.
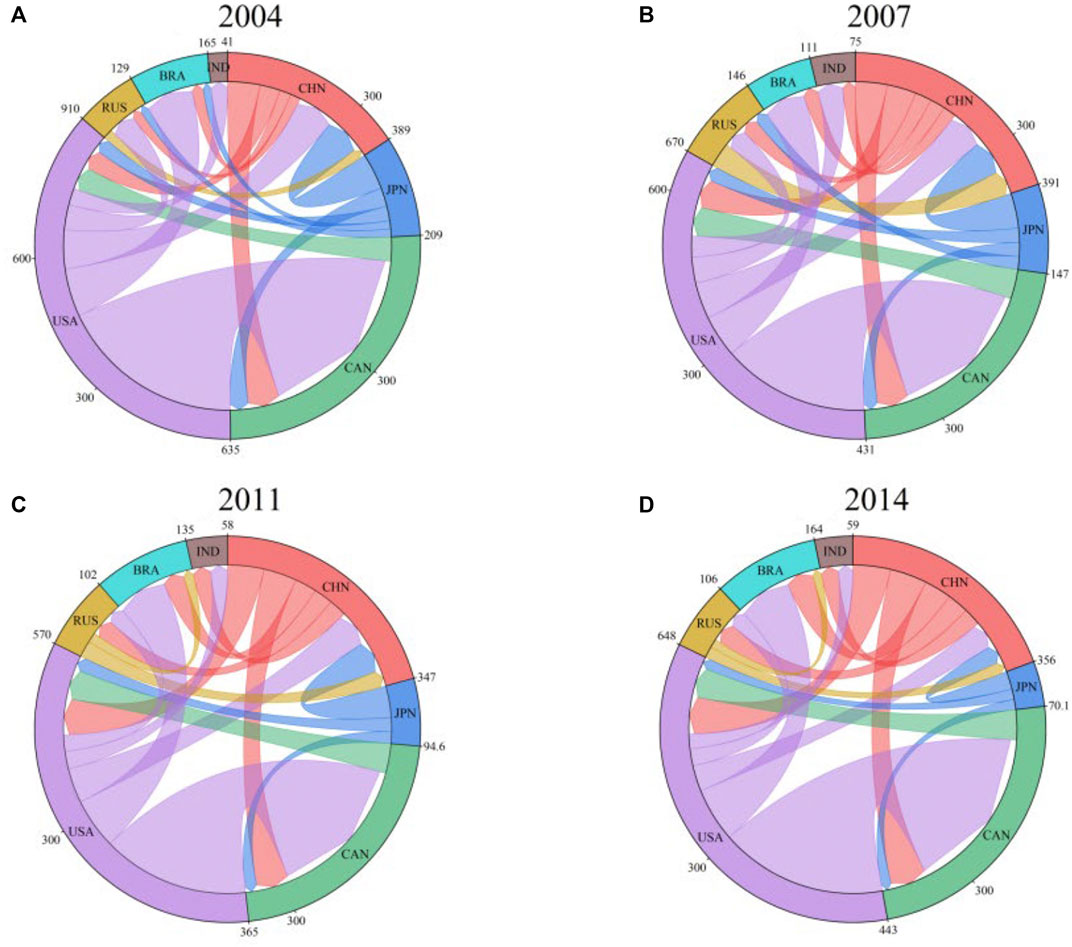
FIGURE 3. Income-based timber carbon stock flows among major countries in 2004 (A), 2007 (B), 2011 (C) and 2014 (D) (unit:104 tons).
Income-based accounting revealed a different profile of global timber carbon stocks compared to consumption- and production-based perspectives. This profile reflects the effect of primary input factors in the global timber production chain. This section compares these three perspectives. From the income-based perspective (Figure 4A), the top ten countries’ timber carbon stocks, including the United States, India, China, Brazil, and Russia, account for 55.77% of the global total. From 2004 to 2014, the United States ranked first in income-based timber carbon stocks. Meanwhile, its income-based result is much larger than the consumption- and production-based results. These statistics imply that processed wood products containing primary resources from the U.S. have a significant implication for the global timber production chain. Brazil, Russia, and Indonesia, as the main suppliers of the primary input of timber carbon stock, are more important as primary resource suppliers of timber carbon stock than as final consumers. During 2004–2014, the cumulative income-based timber carbon stocks of Brazil, Russia, and Indonesia were 21%, 54%, and 42% higher than their consumption-based cumulative carbon stocks, respectively (Figure 4A). China is a major importer of raw timber and a large exporter of processed wood products. Notably, the income-based results show that China’s role as a primary input supplier is as important as that of a direct producer in the global timber supply chain. From 2004 to 2014, China was the third-largest contributor to income-based timber carbon stocks (Figure 4A). China ranks high because, in the midstream and downstream positions of the timber industry, China imports raw timber materials and exports intermediate products to other countries for subsequent processing. These actions have put in a great deal of workforce and land factors during manufacturing. Therefore, by comparing the three accounting methods, we find that the income-based perspective emphasizes the key role of primary resource inputs in the global timber carbon stock.
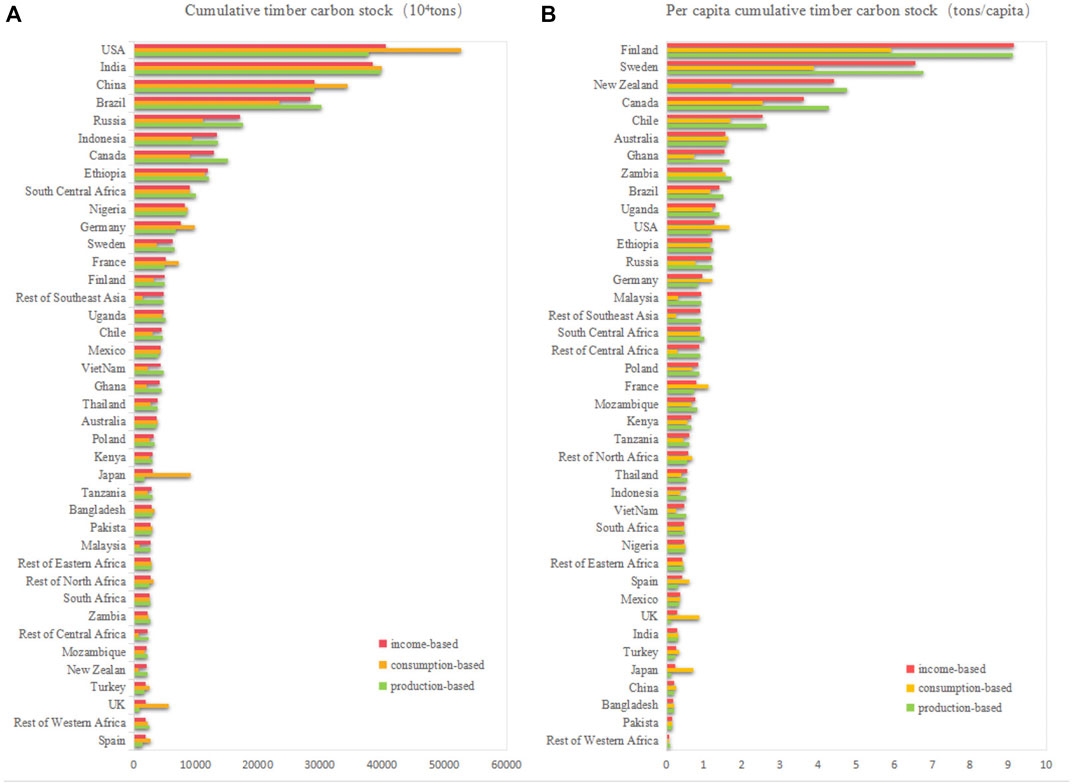
FIGURE 4. (A) Cumulative timber carbon stock. (B) Per capita cumulative timber carbon stock. Note: Cumulative timber carbon stock of nations is the sum of the results during 2004–2014. Per capita cumulative timber carbon stock of a nation is equal to its cumulative timber carbon stock during 2004–2014 divided by its population in 2014.
Regarding the per capita results of income-based, production-based, and consumption-based economies, the top-ranking countries from 2004 to 2014 mainly include Finland, Sweden, New Zealand, and Canada, which are developed economies with small populations. The per capita income-based timber carbon stock in developed nations is larger compared to developing nations, implying that developed nations own larger endowments of per capita natural resources (Figure 4B). In addition, China ranks 37th in per capita timber carbon stock, down 34 places compared to the cumulative result. A comparison of the three perspectives shows that the per capita income-based and production-based timber carbon stocks are remarkably larger than the consumption-based results because of the high resource per capita rate.
In Figure 5, income-based carbon stocks in developing countries (Nigeria, Ethiopia, Indonesia, Russia, Brazil, China and India) continued to grow during 2004–2014 because land and labor costs were relatively low. Furthermore, to promote the timber industry, developing countries put in a large amount of primary production factors resulting in a further increase in the income-based timber carbon stock. In 2014, income-based timber carbon stocks in China, Russia, and Brazil increased by 20.65%, 20.93%, and 9% (Figure 5), respectively, compared to their 2004 levels. The primary inputs they produce enable substantial downstream timber carbon stock flow. On the other hand, income-based timber carbon stocks in developed countries have remained relatively stable from 2004 to 2014 (e.g., the United States), while Germany and Canada have experienced obvious changes. Income-based timber carbon stock of Germany showed an upward trend from 2004 to 2007 and a sharp decline after 2007 due to the global economic crisis in 2008. With a relatively high export dependence, Germany was greatly influenced by the economic recession because of the sharp decrease in overseas orders due the economic recession. The decline in the German economy in 2009 exceeded the average level in other countries and further reduced the economic recovery. From 2004 to 2014, Canada’s income-based timber carbon stocks showed a downward trend, consistent with the decline in production-based results. Most of Canada’s exported timber consists of logs and primarily processed products. In 2014, Canada’s income-based timber carbon stocks decreased by 23.6% compared with 2004 due to Canada’s timber harvesting and export restrictions (Gilani and Innes, 2020).
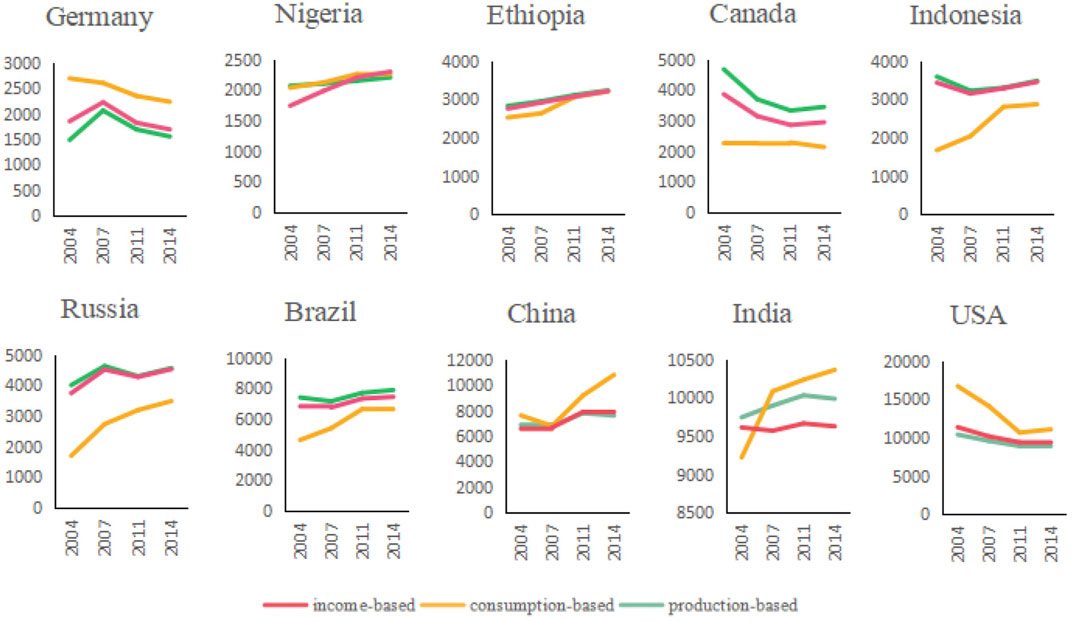
FIGURE 5. Temporal trend of income-based, consumption-based and production-based timber carbon stock of nations during 2004–2014 (unit:104 tons).
Income-based perspective can reveal new changing trends of time in timber carbon stocks that consumption- and production-based perspective cannot present. Specifically, the rapid growth of labor and primary product exports in China, India, Indonesia, Brazil, and Russia has driven income-based timber carbon stock flows. In India and Brazil, income-based timber carbon stocks were lower than production-based ones from 2004 to 2014 (Figure 5). Germany’s primary inputs had a greater impact on the flow of timber carbon stocks than direct harvesting activities. Moreover, production- and income-based timber carbon stocks present similar trends in China, Russia, and Indonesia, indicating that these countries not only process timber products but also invest a large amount of primary inputs such as labor and land production factors. In addition, income-based timber carbon stocks in Nigeria showed a sharp upward trend between 2004 and 2014 (Figure 5). In the early stages of industrialization, Nigeria’s economy developed rapidly during the study period and became the largest economy in Africa. Nigeria’s abundant resources and steady population growth have dramatically increased income-based timber carbon stocks. Overall, the above research results show that consumption- and production-based accounting cannot sufficiently reveal the drivers of the global flow of timber carbon stocks. Accounting from income-based perspective can be used to explore the effect of primary resource inputs in the global timber production chain.
This study uses an MRIO model to analyze the income-based timber carbon stock of 141 countries from 2004 to 2014. We also compare the differences from the production-, consumption-, and income-based perspectives to comprehensively clarify the cross-regional transfer of timber carbon stock and key driving countries. This research draws the following conclusions: 1) The top five countries in terms of export volume of income-based timber carbon stock were the United States, China, Germany, Russia, and France in 2014. The primary inputs to their production enable substantial downstream timber carbon stock flow. Among them, the United States and China were among the top in both imports and exports simultaneously. However, their export volumes were significantly larger, meaning that these countries have invested more primary resources in timber products and provided more timber carbon stock for the world. 2) The United States had the largest outflow of timber carbon stock from income-based perspective from 2004 to 2014, mainly flowed into Canada and Brazil. In China, the largest flow went to Canada. Furthermore, the flow to the United States increased significantly. Japan’s income-based timber carbon stock has mainly moved to China, Canada, and the United States. However, the total outflow has been declining. 3) A comparison of the three perspectives shows that the United States’ primary inputs have a greater impact on the global timber production chain than their consumption-and production-based roles. Brazil, Russia, and Indonesia, as main primary resource suppliers of timber carbon stock, are more important than as final consumers.
The strict policy of restricting deforestation has made Canada’s forest area stable, which is conducive to Canada becoming an income-side timber carbon stock net-importer. Germany’s income-based and consumption-based timber carbon stock was higher than directly produced timber carbon stock, which also shows the effectiveness of Germany’s forest management policy. Forest management has become an effective way to achieve rational forest harvesting and cope with climate change. Therefore, countries should formulate corresponding management measures according to the different stages of timber production. Optimizing the allocation of primary factors from the source of the production chain is conducive to the rational utilization of forest resources, and promotes the achievement of carbon neutrality targets.
Our research reveals the pattern of income-based timber carbon stock, highlighting the important role of primary resource input in the global timber carbon stock. The research findings can contribute to identifying the driving countries of the cross-regional flow of timber carbon stock from the entire timber production chain. It also helps to understand better the role of timber carbon stock as an ecological resource in related countries, which can bring attention to forest quality and the ecological impact of forest product trade. Aguilar et al., 2022, Gauthier et al., 2023, Li Y. et al., 2022.
Publicly available datasets were analyzed in this study. This data can be found here: https://www.gtap.agecon.purdue.edu/databases/v10/index.aspx https://www.fao.org/faostat/en/.
YW and CY contributed to conception and design of the research. YW wrote the manuscript. MY, YY and YY organized the data analysis and wrote the sections of the manuscript. WZ, RL and SW performed the data curation and visualization. CY and SW contributed funding acquisition. All authors contributed to the article and approved the submitted version.
This research was supported by the grant from the National Natural Science Foundation of China (52270174) and National Social Science Fund of China (21BJY247).
We are indebted to reviewers and editors.
The authors declare that the research was conducted in the absence of any commercial or financial relationships that could be construed as a potential conflict of interest.
All claims expressed in this article are solely those of the authors and do not necessarily represent those of their affiliated organizations, or those of the publisher, the editors and the reviewers. Any product that may be evaluated in this article, or claim that may be made by its manufacturer, is not guaranteed or endorsed by the publisher.
1https://www.fao.org/faostat/en/#data/ FO
2https://www.gtap.agecon.purdue.edu/databases/
3https://data.worldbank.org.cn
Abderrahmane, A., Bergeron, Y., Valeria, O., MontoroGirona, M., and Cavard, X. (2021). Forest carbon management: A review of silvicultural practices and management strategies across boreal, temperate and tropical forests. Curr. Rep. 7 (4), 245–266. doi:10.1007/s40725-021-00151-w
Aguilar, F. X., Sudekum, H., McGarvey, R., Knapp, B., Domke, G., and Brandeis, C. (2022). Impacts of the US southeast wood pellet industry on local forest carbon stocks. Sci. Rep. 12, 19449. doi:10.1038/s41598-022-23870-x
Backéus, S., Wikström, P., and Lämås, T. (2005). A model for regional analysis of carbon sequestration and timber production. For. Ecol. Manag. 216, 28–40. doi:10.1016/j.foreco.2005.05.059
Beamesderfer, E. R., Arain, M. A., Khomik, M., Brodeur, J. J., and Burns, B. M. (2020). Response of carbon and water fluxes to meteorological and phenological variability in two eastern North American forests of similar age but contrasting species composition – a multiyear comparison. Biogeosciences 17, 3563–3587. doi:10.5194/bg-17-3563-2020
Chen, W., Lei, Y., Feng, K., Wu, S., and Li, L. (2019). Provincial emission accounting for CO2 mitigation in China: Insights from production, consumption and income perspectives. Appl. Energ. 255, 113754. doi:10.1016/j.apenergy.2019.113754
Das, G. G., Alavalapati, J. R. R., Carter, D. R., and Tsigas, M. E. (2005). Regional impacts of environmental regulations and technical change in the US forestry sector: A multiregional cge analysis. For. Policy Econ. 7, 25–38. doi:10.1016/S1389-9341(03)00004-2
Ezici, B., Eğilmez, G., and Gedik, R. (2020). Assessing the eco-efficiency of U.S. manufacturing industries with a focus on renewable vs. non-renewable energy use: An integrated time series MRIO and DEA approach. J. Clean. Prod. 253, 119630. doi:10.1016/j.jclepro.2019.119630
Gauthier, S., Kuuluvainen, T., and Macdonald, S. E., (2023). “Ecosystem management of the boreal forest in the era of global change,” in Boreal forests in the face of climate change: Sustainable management. Editors M. M. Girona, H. Morin, S. Gauthier, and Y. Bergeron (Berlin, Germany: Springer International Publishing), 3–49.
Gilani, H. R., and Innes, J. L. (2020). The state of Canada's forests: A global comparison of the performance on montréal process criteria and indicators. For. Policy Econ. 118, 102234. doi:10.1016/j.forpol.2020.102234
Girona, M. M., Aakala, T., Aquilué, N., Bélisle, A. C., Chaste, E., Danneyrolles, V., et al. (2023). Challenges for the sustainable management of the boreal forest under climate change. Berlin, Germany: Springer, 773–837.
Hu, Y., Perez-Garcia, J., Robbins, A. S., Liu, Y., and Liu, F. (2015). China's role in the global forest sector: How will the US recovery and a diminished Chinese demand influence global wood markets? Scand. J. For. Res. 30, 13–29. doi:10.1080/02827581.2014.967288
Jasinevičius, G., Lindner, M., Cienciala, E., and Tykkyläinen, M. (2018). Carbon accounting in harvested wood products: Assessment using material flow analysis resulting in larger pools compared to the IPCC default method: Carbon accounting in harvested wood products. J. Industrial Ecol. 22, 121–131. doi:10.1111/jiec.12538
Johnston, C. M. T., and Radeloff, V. C. (2019). Global mitigation potential of carbon stored in harvested wood products. Proc. Natl. Acad. Sci. U. S. A. 116, 14526–14531. doi:10.1073/pnas.1904231116
Jones, G. W. (1992). Population and human resources development. Asia-Pacific Popul. J. 7 (2), 1–13. doi:10.18356/43101D1D-EN
Köhl, M., Lasco, R., Cifuentes, M., Jonsson, Ö., Korhonen, K. T., Mundhenk, P., et al. (2015). Changes in forest production, biomass and carbon: Results from the 2015 UN FAO global forest resource assessment. For. Ecol. Manag. 352, 21–34. doi:10.1016/j.foreco.2015.05.036
Lal, R. (2005). Forest soils and carbon sequestration. For. Ecol. Manag. 220, 242–258. doi:10.1016/j.foreco.2005.08.015
Lenzen, M., Moran, D., Bhaduri, A., Kanemoto, K., Bekchanov, M., Geschke, A., et al. (2013). International trade of scarce water. Ecol. Econ. 94, 78–85. doi:10.1016/j.ecolecon.2013.06.018
Lenzen, M., and Murray, J. (2010). Conceptualising environmental responsibility. Ecol. Econ. 70, 261–270. doi:10.1016/j.ecolecon.2010.04.005
Lenzen, M., Sun, Y., Faturay, F., Ting, Y., Geschke, A., and Malik, A. (2018). The carbon footprint of global tourism. Nat. Clim. Change. 8, 522–528. doi:10.1038/s41558-018-0141-x
Li, J., Huang, G., Li, Y., Liu, L., and Sun, C. (2021a). Unveiling carbon emission attributions along sale chains. Environ. Sci. Technol. 55, 220–229. doi:10.1021/acs.est.0c05798
Li, R., Hua, P., and Krebs, P. (2022b). Global trends and drivers in consumption- and income-based emissions of polycyclic aromatic hydrocarbons. Environ. Sci. Technol. 56, 131–144. doi:10.1021/acs.est.1c04685
Li, R., Wei, Y., Yi, M., Zhang, L., Cheng, B., and Yu, C. (2022a). Timber carbon stocks and influencing factors in the "Belt and Road Initiative" region. J. Clean. Prod. 359, 132026. doi:10.1016/j.jclepro.2022.132026
Li, R., Zhang, J., and Krebs, P. (2021b). Consumption- and income-based sectoral emissions of polycyclic aromatic hydrocarbons in China from 2002 to 2017. Environ. Sci. Technol. 55, 3582–3592. doi:10.1021/acs.est.0c08119
Li, Y., Zhong, Q., Wang, Y., JetashreeWang, H., and Li, H., (2022c). Scarcity-weighted metal extraction enabled by primary suppliers through global supply chains. J. Clean. Prod. 371, 133435. doi:10.1016/j.jclepro.2022.133435
Liang, S., Qu, S., Zhu, Z., Guan, D., and Xu, M. (2017b). Income-based greenhouse gas emissions of nations. Environ. Sci. Technol. 51, 346–355. doi:10.1021/acs.est.6b02510
Liang, S., Stylianou, K. S., Jolliet, O., Supekar, S., Qu, S., Skerlos, S. J., et al. (2017a). Consumption-based human health impacts of primary PM2.5: The hidden burden of international trade. J. Clean. Prod. 167, 133–139. doi:10.1016/j.jclepro.2017.08.139
Liang, S., Wang, H., Qu, S., Feng, T., Guan, D., Fang, H., et al. (2016). Socioeconomic drivers of greenhouse gas emissions in the United States. Environ. Sci. Technol. 50, 7535–7545. doi:10.1021/acs.est.6b00872
Liang, S., Yang, X., Qi, J., Wang, Y., Xie, W., Muttarak, R., et al. (2020). CO2 emissions embodied in international migration from 1995 to 2015. Environ. Sci. Technol. 54, 12530–12538. doi:10.1021/acs.est.0c04600
Lu, Q., Fang, K., Heijungs, R., Feng, K., Li, J., Wen, Q., et al. (2020). Imbalance and drivers of carbon emissions embodied in trade along the Belt and Road Initiative. Appl. Energ. 280, 115934. doi:10.1016/j.apenergy.2020.115934
Malik, A., Mcbain, D., Wiedmann, T., Lenzen, M., and Murray, J. (2018). Advancements in input-output models and indicators for consumption-based accounting: MRIO models for consumption-based accounting. J. Ind. Ecol. 23, 300–312. doi:10.1111/jiec.12771
Marques, A., Rodrigues, J., and Domingos, T. (2013). International trade and the geographical separation between income and enabled carbon emissions. Ecol. Econ. 89, 162–169. doi:10.1016/j.ecolecon.2013.02.020
Marques, A., Rodrigues, J., Lenzen, M., and Domingos, T. (2012). Income-based environmental responsibility. Ecol. Econ. 84, 57–65. doi:10.1016/j.ecolecon.2012.09.010
Mi, Z., Meng, J., Guan, D., Shan, Y., Song, M., Wei, Y. M., et al. (2017). Chinese CO2 emission flows have reversed since the global financial crisis. Nat. Commun. 8, 1712. doi:10.1038/s41467-017-01820-w
Miller, R. E., and Temurshoev, U. (2017). Output upstreamness and input Downstreamness of industries/countries in world production. Int. Reg. Sci. Rev. 40, 443–475. doi:10.1177/0160017615608095
Pan, J., Phillips, J., and Chen, Y. (2008). China's balance of emissions embodied in trade: Approaches to measurement and allocating international responsibility. Oxf. Rev. Econ. Pol. 24, 354–376. doi:10.1093/oxrep/grn016
Peichl, M., Thevathasan, N., Gordon, A., Huss, J., and Abohassan, R. (2006). Carbon sequestration potentials in temperate Tree-Based intercropping systems, southern ontario, Canada. Agroforest Syst. 66, 243–257. doi:10.1007/s10457-005-0361-8
Qi, J., Wang, Y., Liang, S., Li, Y., Li, Y., Feng, C., et al. (2019). Primary suppliers driving atmospheric mercury emissions through global supply chains. One Earth 1, 254–266. doi:10.1016/j.oneear.2019.10.005
Rodrigues, J., and Domingos, T. (2008). Consumer and producer environmental responsibility: Comparing two approaches. Ecol. Econ. 66, 533–546. doi:10.1016/j.ecolecon.2007.12.010
Soulier, M., Pfaff, M., Goldmann, D., Walz, R., Geng, Y., Zhang, L., et al. (2018). The Chinese copper cycle: Tracing copper through the economy with dynamic substance flow and input-output analysis. J. Clean. Prod. 195, 435–447. doi:10.1016/j.jclepro.2018.04.243
Steininger, K. W., Lininger, C., Meyer, L. H., Muñoz, P., and Schinko, T. (2016). Multiple carbon accounting to support just and effective climate policies. Nat. Clim. Change. 6, 35–41. doi:10.1038/nclimate2867
Tardif, J. C., and Conciatori, F. (2006). Influence of climate on tree rings and vessel features in red oak and white oak growing near their northern distribution limit, southwestern Quebec, Canada. Can. J. For. Res. 36, 2317–2330. doi:10.1139/x06-133
Wang, Q., and Ge, S. (2020). Uncovering the effects of external demand on China's coal consumption: A global input-output analysis. J. Clean. Prod. 245, 118877. doi:10.1016/j.jclepro.2019.118877
Wang, Y., Yang, H., Liu, J., Xu, Y., Wang, X., Ma, J., et al. (2020). Analysis of multiple drivers of air pollution emissions in China via interregional trade. J. Clean. Prod. 244, 118507. doi:10.1016/j.jclepro.2019.118507
Wiedmann, T., and Lenzen, M. (2018). Environmental and social footprints of international trade. Nat. Geosci. 11, 314–321. doi:10.1038/s41561-018-0113-9
Winjum, J. K., Dixon, R. K., and Schroeder, P. E. (1992). Estimating the global potential of forest and agroforest management practices to sequester carbon. Water Air Soil Pollut. 64, 213–227. doi:10.1007/BF00477103
Xie, R., Hu, G., Zhang, Y., and Liu, Y. (2017). Provincial transfers of enabled carbon emissions in China: A supply-side perspective. Energ. Policy. 107, 688–697. doi:10.1016/j.enpol.2017.04.021
Xu, Z., Li, Y., Chau, S. N., Dietz, T., Li, C., Wan, L., et al. (2020). Impacts of international trade on global sustainable development. Nat. Sustain. 3, 964–971. doi:10.1038/s41893-020-0572-z
Yan, J., Zhao, T., and Kang, J. (2016). Sensitivity analysis of technology and supply change for CO2 emission intensity of energy-intensive industries based on input-output model. Appl. Energ. 171, 456–467. doi:10.1016/j.apenergy.2016.03.081
Yang, X., Liang, S., Qi, J., Feng, C., Qu, S., and Xu, M. (2021). Identifying sectoral impacts on global scarce water uses from multiple perspectives. J. Industrial Ecol. 25, 1503–1517. doi:10.1111/jiec.13171
Yang, X., Zhong, Q., Liang, S., Li, Y., Wang, Y., Zhu, X., et al. (2022). Global supply chain drivers of agricultural antibiotic emissions in China. Environ. Sci. Technol. 56, 5860–5873. doi:10.1021/acs.est.1c07110
Yang, Y., Qu, S., Cai, B., Liang, S., Wang, Z., Wang, J., et al. (2020). Mapping global carbon footprint in China. Nat. Commun. 11, 2237. doi:10.1038/s41467-020-15883-9
Yuan, R., Behrens, P., and Rodrigues, J. F. D. (2018). The evolution of inter-sectoral linkages in China's energy-related CO2 emissions from 1997 to 2012. Energ. Econ. 69, 404–417. doi:10.1016/j.eneco.2017.11.022
Zhang, J., Zhong, Q., Yu, Y., JetashreeYang, X., and Feng, C., (2022). Supply-side drivers of phosphorus emissions from phosphorus supply chains in China. Ecosyst. Health Sustain. 8. doi:10.1080/20964129.2022.2107578
Zhang, L., Yu, C., Cheng, B., Yang, C., and Chang, Y. (2020a). Mitigating climate change by global timber carbon stock: Accounting, flow and allocation. Renew. Sustain. Energy Rev. 131, 109996. doi:10.1016/j.rser.2020.109996
Zhang, Q., Li, Y., Yu, C., Qi, J., Yang, C., Cheng, B., et al. (2020b). Global timber harvest footprints of nations and virtual timber trade flows. J. Clean. Prod. 250, 119503. doi:10.1016/j.jclepro.2019.119503
Keywords: timber carbon stock, income-based, MRIO, trade, consumption-based, production-based
Citation: Wei Y, Yi M, Yu Y, You Y, Zhang W, Li R, Yu C and Wang S (2023) Global drivers of timber carbon stock from income-based perspective. Front. Environ. Sci. 11:1149492. doi: 10.3389/fenvs.2023.1149492
Received: 22 January 2023; Accepted: 05 June 2023;
Published: 19 June 2023.
Edited by:
Fayyaz Ahmad, Lanzhou University, ChinaReviewed by:
Qian Zhang, Tsinghua University, ChinaCopyright © 2023 Wei, Yi, Yu, You, Zhang, Li, Yu and Wang. This is an open-access article distributed under the terms of the Creative Commons Attribution License (CC BY). The use, distribution or reproduction in other forums is permitted, provided the original author(s) and the copyright owner(s) are credited and that the original publication in this journal is cited, in accordance with accepted academic practice. No use, distribution or reproduction is permitted which does not comply with these terms.
*Correspondence: Chang Yu, Y2hhbmd5dUBiamZ1LmVkdS5jbg==; Siyi Wang, d2FuZy5zaXlpQGNyYWVzLm9yZy5jbg==
Disclaimer: All claims expressed in this article are solely those of the authors and do not necessarily represent those of their affiliated organizations, or those of the publisher, the editors and the reviewers. Any product that may be evaluated in this article or claim that may be made by its manufacturer is not guaranteed or endorsed by the publisher.
Research integrity at Frontiers
Learn more about the work of our research integrity team to safeguard the quality of each article we publish.