 Asif Khan
 Sughra Bibi
 Hanliang Li1*
- 1International School of Cultural Tourism, Zhejiang University City College, Hangzhou, China
- 2Department of Tourism and Hotel Management, School of Management, Zhejiang University, Hangzhou, China
- 3Department of Tourism and Hospitality, Hazara University, Mansehra, Pakistan
- 4School of Economics and Management, Zhejiang Sci-Tech University, Hangzhou, China
- 5College of Humanities and Law, Zhejiang Agriculture and Forestry University, Hangzhou, China
- 6Department of Economics, Hazara University, Mansehra, Pakistan
The tourism and travel industry (TTI) has become a vital developmental tool for boosting economic growth globally; however, this economic thriving is adversely connected to the environment. This study examines the impacts of eight TTI subsectors on economic growth and environmental pollution in the United States of America by contextualizing energy consumption and globalization. We applied the ARDL bounds test and Granger causality approach on time-series data (2005 1st quarter–2019 4th quarter). Granger causality uncovers TLGH, GLTH, and feedback hypotheses between TT subindustries. The subindustries supporting TLGH’s proposal that long-term investment in these sectors could enhance economic growth. In addition, industries supporting GLTH indicate that a strong economy would be beneficial for these industries. Maximum subindustries indicate a significant positive association with energy consumption. The long-run dynamics show that TT subindustries have different influences on greenhouse gases (CO2, CH4, N2O) and air pollutants (CO, NH3, NOx, SO2, VOC, and PM2.5). Long-run dynamics show that food and drinking places emit more GHG than other entertainment and hospitality subsectors. Amusement, gambling, and entertainment contribute more to air pollutants among the entertainment and hospitality subsectors. Road and railway transportation contribute more to GHG emissions than other travel sectors in the long run. Air transportation in the travel subsector is responsible for high air pollutants. The Granger causality results reveal that art, gambling and recreation in entertainment and hospitality industries, and ground transportation contribute the most to environmental pollution. Globalization has varying effects on economic growth, energy consumption, and environmental pollution indicators. We have provided sustainable policy implications for reducing GHG emissions and air pollutants.
1 Introduction
Tourism development has become a policy agenda in developed and developing economies to enhance economic growth by generating new jobs, increasing tax money, and opening new venues for entrepreneurship opportunities. However, at the same time, unplanned tourism increases environmental vulnerabilities by escalating waste, GHG emissions, and air pollutants (Khan et al., 2020a; Khan et al., 2020b). Sustainable tourism development assures the economic and social sustainability of the host country through related events and activities such as entertainment, cultural exchange, food and beverage production and services, transportation, accommodation, and tourist and resident interactions (Khan et al., 2020d). Tourism development provides a comprehensive framework for economic development as well as that of other paradigms. However, tourism development sustainability depends on the sustainable development of transportation, food and beverage production facilities, entertainment and events sustainability, and the introduction of innovations in each subsector to minimize environmental vulnerabilities. Therefore, tourism development needs to be connected proportionally to economic, environmental, and social policies to achieve sustainability.
Millions of tourists visit the United States for pleasure, to meet friends and family, and to do business each year, drawn by the promise of extraordinary destinations and experiences. The natural wonders, cultural heritage, technology, and business opportunity make the United States a unique nation. Tourists bring immense economic benefits to the US, directly and indirectly contributing to the resident’s wellbeing. The US natural and cultural attractions, business environment, healthcare amenities, and entertainment facilities attract millions of international tourists from different parts of the world (Khan et al., 2020d). The diverse nature of TTI services makes the US one of the most rivalrous competitors among the world’s tourism and travel players. The US TTI comprises two major components: the tourism-related services and travel industries. These two industries are divided into various subsectors: accommodation, food and beverages, gambling, art and entertainment, road, railway, air transportation, and many others (Aratuo and Etienne, 2019). The Tourism and Travel Competitiveness Index ranked US TTI as fifth in the world (Khan et al., 2020d). The mega size of the US TT industry undoubtedly contributes significantly to economic growth and brings environmental vulnerabilities by consuming a large amount of fossil fuel energy.
International travel and tourism play a critical role in the US economy. Before the COVID-19 pandemic, 79.4 million tourists experienced the United States and spent $233.5 billion in 2019. The TTI injected 640 million dollars a day into the US economy and supported 9.5 million jobs accounting for 2.9% of US GDP in 2019 (ITA, 2022c). However, international visitation in 2020 was recorded at 19.4 million, which decreased by 75.5% compared to 2019. It is the smallest number of international tourist arrivals in the US in 43 years (ITA, 2020a).
The American Hotel and Lodging Association (AHLA) and US Bureau of Economic Analysis (BEA) have categorized the US TT industry into 25 + subsectors, whereas accommodation, air travel, and food services sectors account for more than half of the total output produced by the US TT industry (SelectUSA, 2021). The accommodation subsectors make up the largest category of the three mentioned subsectors in terms of total goods and services produced. The air travel subsector accounts for approximately 17% of traveler spending on TT-related activities. This sector supports nearly 900,000 US citizen jobs and traveler spending of more than $270 billion (SelectUSA, 2020).
The third-largest subsector of the US TT industry is food services, supporting 1.2 million US jobs and accounting for traveler spending of 254 billion dollars in 2017 (SelectUSA, 2021). Travelers spent $279 billion in 2019 on food services, including drinking places, restaurants, fast food, and groceries, which accounted for 25% of the total traveler spending in the US (UStravel, 2019a). Trends show that travelers’ spending on lodging, including hotels, motels, bed and breakfasts, vacation homes, and campgrounds, reached approximately $242 billion in 2019 (UStravel, 2019b).
Except for a few studies—for instance, Aratuo and Etienne (2019) and Tang and Jang (2009)—the remainder have used total tourist arrivals or receipts to measure tourism industry performance. It is of great importance for policymakers, investors, entrepreneurs, and the business community to conduct a subindustry-level analysis of the TT industry for better decision-making and policy initiatives. Each TT subindustry operates distinctively and its contribution to economic development varies within the same business settings. The facts mentioned above tell the story and indicate that the TT industry is a critical driver of the US economy. However, we cannot turn a blind eye to the environmental damages and vulnerabilities of TTI development at the expense of economic growth.
TT industries consume different types of energy for performing various functions and transporting goods and services, which cause GHG emissions and environmental pollutants. Energy is vital for economic growth and contemporary society, enabling systems to generate employment, accommodation facilities, entertainment, food, businesses, and transportation. The demand for energy consumption showed that the US consumes 16% of the world’s energy resources with less than 5% of the world population (EIA, 2021a). The supply side of energy production revealed that 76% of the US energy comes from fossil fuels, which is are highly inconsistent with the Intergovernmental Panel on Climate Change (IPCC) carbon reduction targets (Systems, 2021). The travel and tourism industry is one of the biggest energy consumers in the US. The US travel sector comprises air, land, and sea transportation, which have consumed energy resources of 35,603 trillion Btu in 2020 (EIA, 2022a). It is estimated that across the US, in 47,000 hotels, the average guest room consumes $2200 worth of energy annually (DOE, 2022). The combustion of fossil fuels in the US TT industry results in various air emissions and causes environmental impacts; for instance, carbon dioxide (CO2), sulfur dioxide (SO2), compounds, mercury (Hg), particulate matter (PM2.5), volatile organic compounds (VOCs), nitrogen oxides (NOx), and others.
Therefore, it becomes vital to examine TTI economic growth in connection with environmental vulnerabilities to develop more sustainable, green, and environmentally friendly policies. More than 100,000 US citizens die each year of heat strokes, heart attacks, breathing problems, chronic diseases, and other diseases caused by air pollution (Neuhauser, 2019). The various greenhouse emissions (CO2, CH4, N2O) and air pollutants (CO, NH3, VOCs, SO2, PM2.5, and NOx) are harmful to citizens’ health. Besides, environmental pollution is a nightmare for the tourism industry itself (Khan et al., 2020a). The US is one of the substantial greenhouse gas emitters globally and uses a significant amount of the world's energy resources (EIA, 2021b). Trends reveal that TT industries are responsible for environmental degradation in the US to some extent (EPA, 2020c).
This study intended to examine the nexuses of US TTI, economic growth, and environmental pollution by using subindustry-level data for sustainable policy development. Tourism policy is an official document containing various processes, procedures, guidelines, rules and regulations, and practices driven by state, provincial, and local governments to achieve targeted objectives through tourism development. The existing literature focuses on the overall operations of the tourism industry (the total number of visitors or overall tourism receipts) and only takes into account CO2 emissions to measure the environmental impacts caused by tourism developments, while other prominent environmental pollutants such SO2, NH3, VOC, N2O, and PM 2.5 have been ignored. Xiong et al. (2022) is the sole study investigating the US industry’s subindustry-level economic growth and environmental pollution. However, this study only explores the environmental impacts of leisure and hospitality subindustries and ignores the travel sector. The author noted that it is a significant limitation of their research. Besides, Xiong et al. (2022) considered real GDP in each equation as a control variable, while the leisure and hospitality sector variables are also measured as a contribution to real GDP, which may lead to multicollinearity issues and inflated or deflated findings. Thus, we intended to investigate the US TTI as a whole by considering both tourism and travel subindustries to address the deficiencies of previous studies and open a new chapter on TTI’s economic growth and environmental degradation.
This study used a multivariate framework to examine the relationship between eight TTI subindustries, one economic growth indicator globalization, energy consumption, three greenhouse gas emissions, and six environmental pollutants. Literature trends reveal that authors ignored potential factors influencing economic growth; we included globalization in our empirical framework to neutralize the findings. This study contributes to the literature in several ways: first, we considered all the sectors of the travel and tourism industry that are relevant to economic growth and environmental pollution, which provided a more sophisticated and broad picture for sustainable policy development. For instance, ACC, AR, and FDP sectors in the entertainment and hospitality industry and AT, WT, and TPT sectors in the travel industry support the tourism-led growth hypothesis (TLGH). Therefore, more investment in these sectors will lead to high economic growth. Second, the PM sector in the EH industry and RT in the travel industry support the growth-led tourism hypothesis (GLTH), indicating that high economic growth will make these sectors more productive. Third, EH and the travel industry’s impacts on GHG emissions and air pollutants help policymakers to determine which sectors contribute more to GHG emissions and air pollutants. For instance, the FDP sector in the EH industry contributes more to GHG emissions and RT and TPT in the travel industry. Fourth, all the EH and travel sectors establish a positive relationship with EC, indicating energy dependence. Therefore, policymakers need to shift toward green energy to minimize environmental vulnerabilities.
Our findings will help investors, practitioners, and policymakers in designing sustainable policies by readjusting the economic, globalization, and energy production and consumption policies. Bringing together economic growth, energy consumption, globalization, travel developments, and environmental pollutants in a single framework will help to design a more comprehensive policy agenda to minimize environmental degradation and save humans from the vulnerabilities of climatic changes. TT subindustry-level analysis of economic growth and environmental degradation is a more sound approach than the aggregate industry-level analysis for assessing environmental damages and designing policies at the grassroots level.
2 Literature review
A wide range of research has assessed the connections between tourism development, economic growth, and environmental pollution in different countries. These studies’ findings often vary depending on the time period, country of investigation, and estimation methods. Tourism-led economic growth has become an interesting phenomenon for countries worldwide due to its multiplier effects and low developmental cost (Tang and Jang, 2009). Literature trends reveal that this stream of research either supports the tourism-led growth hypothesis (TLGH) or the economy-driven growth-led tourism hypothesis (GLTH) or is inconclusive (Lin et al., 2019; Khan et al., 2020b). TLGH retains that sustained tourism development of a country enhances economic growth (Khan et al., 2020c). For instance, tourism increases resident per capita income by providing extra income opportunity. Tourism also improves government revenues through tax collection and tourism exports. GLTH claims that sustained growth in the county support and facilitates tourism development (Khan et al., 2020e). For instance, the availability of resources for tourism infrastructure development, favorable business environment, trade openness, positive economic conditions, encouraging tourism and hospitality entrepreneurship, and providing funds for new startups and ventures. There is another stream of studies that supports both TLGH and GLTH (named as feedback hypothesis); for instance, these include Perles-Ribes et al. (2017) for Spain and Lee and Chien (2008) for Taiwan. These studies provide significant knowledge; however, our study is focused on the US TTI at the sub-sector level; hence, it is necessary to discuss various US policy instruments utilized to enhance tourism-led economic growth.
Travel and tourism play a significant role in the US economy. The TTI is considered an essential driver of the US’s economic growth and employment engine (Khan et al., 2020d). The effective TTI promotional strategies and policies have increased economic activities, well-paid jobs, and tax revenue, which help support required public services. Trends indicate that approximately 80 million foreign tourists visited the US in 2019 (OECD, 2020). One out of nine jobs in the US, directly and indirectly, rely on the TT industry. The US TTI output in 2019 was $2.6 trillion, supporting 15.8 million American jobs (UStravel, 2019a). The TTI created greater employment opportunities than other industries, whereas every 1 million dollar sale of goods and services directly generated eight jobs in the industry and supported nine million jobs in 2019 in the US (UStravel, 2019b).
The TTI is highly decentralized in the US. Every state and individual destination organizes and manages TT activities for their jurisdictions; however, the federal government provides immense support for all the activities (OECD, 2020). The National Travel and Tourism Office (NTTO) serves as a hub to coordinate all the activities at the federal government level (Xiong et al., 2022). The US tourism policy continuously encompasses changes, and new laws are regularly adapted to meet the tourists’ demands and enhance tourists’ growth.
“The federal government plays a unique and essential role in promoting the American tourism product to potential travelers. Federal employees manage iconic destinations, facilitate and regulate travel systems, implement programs and policies that impact the travel and hospitality industry, monitor and regulate passage across our borders, and directly serve visitors at federally owned and managed tourist attractions. The federal government’s depth and breadth of engagement in travel and tourism confer a special opportunity to communicate with potential visitors using a consistent marketing message and a broad spectrum of media” (ITA, 2020b).
The major goals of 2019 updated National Travel and Tourism Strategy focus on US tourism promotion by increasing TT exports, coordinating BrandUSA, providing user-friendly planning and resources, lowering barriers to travel, streamlining the visa process, and improving customer services and transportation infrastructure (ITA, 2020b). The prominent legislation to enhance TT’s economic impacts includes the Travel Promotion Act of 2009 (TPA) and the Travel Promotion, Enhancement, and Modernization Act of 2014 (SelectUSA, 2021). The Brand USA activities are actively managed worldwide in more than 30 potential markets with an entire marketing campaign to increase international visitation to the USA (SelectUSA, 2021). “The federal role in promoting tourism is distinct and additive to that of Brand USA, which promotes travel and tourism to the United States by international visitors and assists the federal government in communicating travel requirements and policies” (ITA, 2020b). Trends reveal that Brand USA drove 1.13 million visitors to the US and supported 52,000 jobs in 2018; it provided a massive return on investment to the US economy, returning $25 for each $1 spent since 2013 (UStravel, 2019a).
The Biden-Harris Administration has taken necessary steps to support TT industries, communities, and families relying on the tourism and travel sectors. For instance, Biden’s rollout of COVID-19 vaccines and relaxation of international and domestic travel restrictions help the TT industries to begin recovery. The NTTO provides export assistance services to TT suppliers, from small to large tourism destinations (ITA, 2022b). These services help to enhance the US TT industries’ competitiveness and increase international visitations. The National Travel and Tourism Strategy 2022 focuses on promoting the US as a premier tourism destination by fostering TT industries as economic growth agents, bolstering conservation, and enhancing sustainability (ITA, 2022b). Besides, this strategy aims to increase the number of tourists (volume) and the value of tourism. The Travel and Tourism Advisory Board (TTAB) emphasizes retaining workforce diversity and supporting recreation and tourism business development and entrepreneurship venues to maximize travel and tourism benefits. The National Travel and Tourism Strategy 2022 accentuates supporting and funding local workforce and enrepreneurship development, creating sustained paying quality jobs and enhancing local skills. The mentioned facts and discussion indicate that the TT industry is one of the major players in the US economy.
Undoubtedly, the TT industry is an essential pillar of economic growth and prosperity domestically and worldwide (Khan et al., 2021). However, the TT industry is energy-dependent and significantly contributes to GHG emissions and environmental pollutants (Gao and Zhang, 2019). The significant sources of greenhouse gases in the TT industry are accommodations, food facilities, airlines, water, and ground transportation (Gössling and Hall, 2006). The TTI generates air pollution (Gössling, 2002), fragments the ecosystem (Davenport and Davenport, 2006), and causes land degradation (Markwick, 2000) and water pollution (Lamb et al., 2014). Most tourism and environmental degradation literature focus on the positive or negative econometrics relationships; we will restrain ourselves from this trend and discuss policy perspectives. Besides, previous studies focus on CO2 emissions and neglect a wide range of air pollutants, for instance, CO, NOx, NH3, SO2. The role of tourism policy and its integration with the national environmental, climate, waste management, and economic policies is vital to optimizing the economic benefits and moderating or minimizing environmental costs (UNWTO, 2018).
Tourism directly benefits the entire US economy through tourist spending on goods and services during travel and, indirectly, the businesses that use materials and services to produce them (Khan et al., 2020d). Due to its multiplier effects, the TTI impact on GHG emissions and air pollutants is higher than the other industries. For instance, fruits and vegetables purchased by hotels and restaurants all have effects on GHG and air pollutants at different levels; for example, agriculture CO2 emissions, storing and freezing emissions, cooking emissions, and emissions through waste. The US economy produces millions of tons of GHG and air pollutants by using energy through discrete sources; for instance, transportation, power plants, households, hotels, restaurants, gaming and sports, and industrial facilities are among the many (Shouse, 2021). The US Environmental Protection Agency (EPA) reported that human activities in the TT industries generate various GHG and air pollutants, including CO2, CH4, N2O, SO2, chlorofluorocarbons (CFCs), PM10, and PM2.5, VOCs, and tropospheric ozone pollutions (O3) (EPA, 2020a). The US emissions trends reveal that the transportation sector accounted for 29%, the electricity sector for 25%, and the industrial sector for 23% of total US GHG emissions (Shouse, 2021). The US also accounts for 30% of energy consumption and 28% of carbon emissions of the total global consumption and emissions (Zulinski, 2018).
The US government has demonstrated multiple approaches to address GHG emissions and air pollutants at the international and domestic levels, for instance, participation in the United Nations Framework Convention on Climate Change 1992 (UNFCCC) and adopting the Paris Agreement 2015. Besides, the US government has taken a range of actions and legislations to limit GHG emissions and control air pollution, including Climate Change Policy 2021 (standards, taxes, investments, technological innovations, programs, and initiatives to reduce emissions), Pollution Prevention Act, Greenhouse Gas Reporting Program (GHGRP), Energy Act of 2020, Clean Air Act, American Innovation and Manufacturing (AIM) Act of 2020, and National Environmental Policy Act, are important among many to mitigate environmental degradation. However, the US's history of climatic issues is haunted by discontinuation due to its economic policies and other global interests and faces criticism worldwide (Yeganeh et al., 2020). There is also a lack of coordination and consensus between states and the federal-level governments’ approaches to mitigating emissions (Pitt, 2010).
The growing environmental pressure from the TT consumer market and modern laws and regulations has heightened concerns about the industry’s environmental vulnerabilities. The TT sub-industries collectively emit 8% of the total global emissions. Travel infrastructure, casinos, gaming facilities, hotels, fast food facilities, restaurants, museums, event facilities, and others need huge investments, materials, and energy during their development stage and later on in operations which cause GHG emissions and air pollutants. The travel sector contributes to poor air quality and smog, negatively influencing US citizens’ health and welfare (EPA, 2020b). NOx, VOCs, and PM pollutants contribute to poor air quality. The US travel sector is responsible for approximately 55% of NOx, 10% of VOCs, and 10% of PM2.5 and PM10 emissions out of the US’s total inventory (EPA, 2022b). The travel sector also contributes to air toxics, including formaldehyde, benzene, and diesel particulate matter. The hospitality sector is both a victim and a contributor to climatic change. The hotel and restaurant sector is responsible for 21% of the total tourism industry’s ecological footprint (dos Santos et al., 2020). The hotel, entertainment, sports, event, and other related industries, through inappropriate waste management, have led to biodiversity loss and various emissions (Pan et al., 2018). The hotel industry in the US generates 60 million tonnes of CO2 emissions, spends energy of $7.5 billion, creates 1.9 billion lbs of waste, and uses 219 billion gallons of water each year (Technologies, 2019).
Restaurants, hotels, fast food facilities, supermarkets, and other consumer businesses generate 40% of all food waste in the US, equal to $376 billion (WWF, 2018). Food waste and loss are estimated to be approximately one-third of human consumption in the US. Food waste exacerbates environmental issues with significant GHG emissions. Food waste decomposition generates CO2 emissions, methane, nitrous oxide, and hydrofluorocarbons. EAP reported that food waste embodies 170 million metric tons of CO2 emissions, equal to the annual CO2 emission of 42 coal-fired power plants, enough to supply water and energy to more than 50 million homes (Buzby, 2022).
Furthermore, globalization is considered one of the prominent determinants of economic growth, tourism development, and environmental pollution. Globalization encourages growth, technology transfer, trade openness, employment generation, labor migration, education, energy consumption, and foreign direct investment inflows (Saint Akadiri et al., 2019). Globalization inspires mobility and the division of tourism services such as entertainment, catering, heritage, transportation, leisure, and natural resources (Nowak et al., 2010). The literature trends show conflicting findings on globalization, economic growth, and CO2 emissions. Globalization in China has been found to have reduced the level of CO2 emissions (Shahbaz et al., 2017); however, few other studies have suggested that tourism development, globalization, and their potential to increase CO2 emissions cause environmental degradation (Raza et al., 2017). The relationship between tourism, globalization, and the environment is unclear. Thus, it is assumed that globalization boosts mobility, trade openness, and tourism activities, and globalization also depends on energy consumption; hence, globalization is a critical element in determining environmental pollution.
3 Research method
The US TTI comprises twenty-five sub-sectors (Khan et al., 2020d). Only a few studies are available about a part subsector of TTI contributions to economic growth; however, literature is scarce regarding TTI contributions to GHG emissions and air pollutants at the subsector level. Besides, due to a long time lapse, these studies are outdated. Trends reveal that most studies on the association between tourism development and environmental degradation/pollution (Khan et al., 2020a; Balsalobre-Lorente et al., 2020) have considered only CO2 emissions as an environmental pollutant while overlooking other significant pollutants.
This study considered eight subindustries related to TTI. We divide the TTI into two groups (the entertainment and hospitality industry and the travel industry); each group has its subsectors. The entertainment and hospitality industry subsectors include accommodation establishments (ACC), food and drinking places (FDP), performing arts, spectator sports, and the museum sector (PM), amusement, gambling, and recreation facilities (AR). Travel subindustries include air transportation (AT), rail transportation (RT), water transportation (WT), and transit and passenger transportation (TPT).
This study uses a set of environmental pollutants in relation to different TTI subsectors. The environmental pollutants have been categorized as greenhouse gases (CO2, CH4, and N2O) and air pollutants (CO, NH3, NOx, SO2, VOC, and PM2.5). Economic growth is represented by real domestic products (RGDP). Globalization is considered one of the critical factors for growth; therefore, we include globalization (G) in our model. Economic growth and environmental pollution are mainly caused by energy consumption in everyday life; hence, we also incorporate energy consumption (EC) in our model. Quarterly data have been used from 2005 1st to 2019 4th quarter. Variables’ detailed description, notation, measure, unit, and data sources are given in Table 1. All the monetary variables are seasonally adjusted for inflation at each quarter at annual rates. The analysis of variable trends along with diagrammatic representation, is given in the supplementary material; we cannot demonstrate them here due to word limitations.
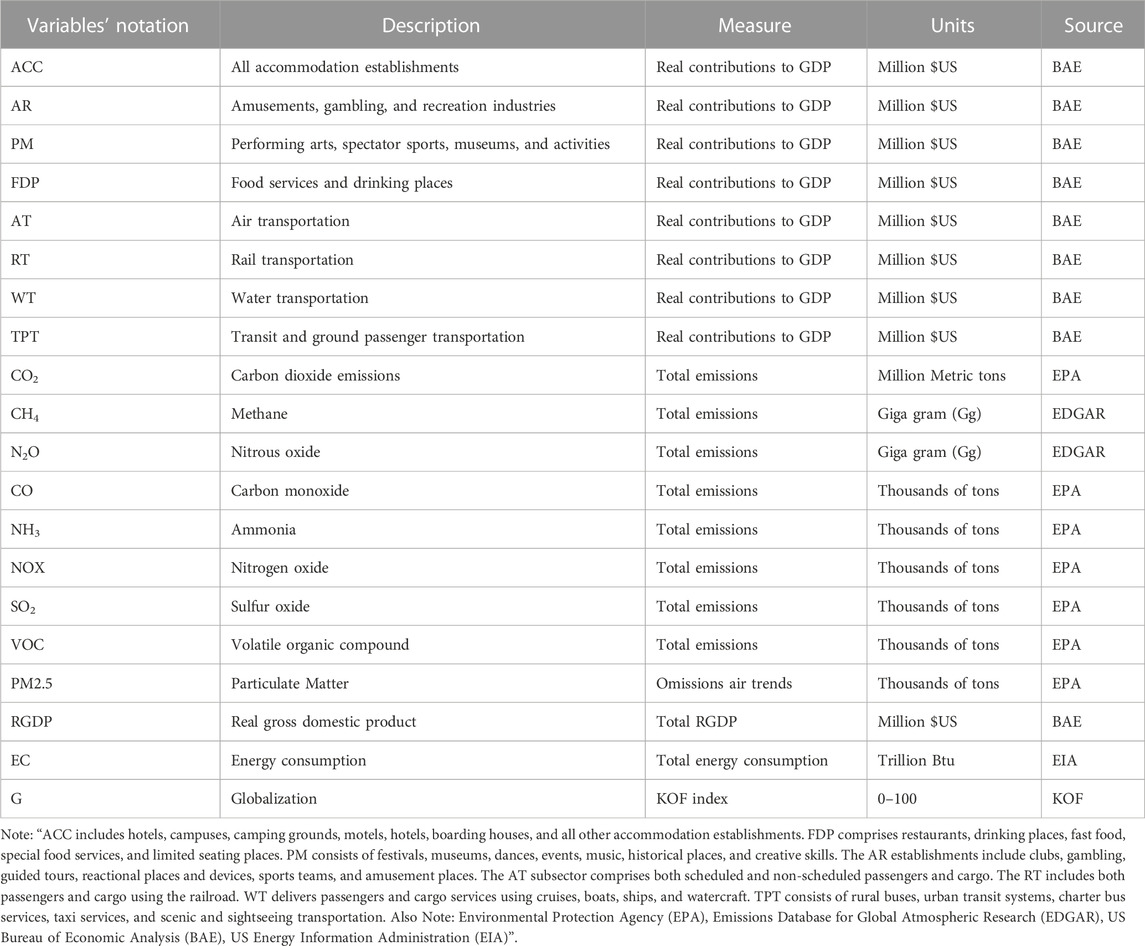
TABLE 1. Variables description.
3.1 Estimation method
This study used the autoregressive distributed lag (ARDL) bounds test cointegration approach to examine the dynamics of TTI subsectors with economic growth, energy consumption, GHG emissions, and air pollutants. ARDL model is an ordinary least square-based model applicable to non-stationary and mixed-order integrated time series data. “This model takes sufficient numbers of lags to capture the data generating process in a general-to-specific modeling framework” (Shrestha and Bhatta, 2018). The ARDL bounds test cointegration approach has several advantages over traditional econometrics models. First, this approach accommodates both level and first difference stationary variables and provides flexibility in various empirical settings. Second, ARDL rectifies endogeneity and serial correlation issues by choosing the appropriate lag length and can be applied to sample size. This cointegration method estimates short- and long-run dynamics (Khan et al., 2020a). We choose ARDL because it permits flexibility to I (0) and I (1) stationary variables or a combination of both. We have designed a general multivariate linear regression equation for the ARDL model as follows:
where Yi represents dependent variables, for instance, greenhouse gases, economic growth, air pollutants, and energy consumption, and X1i, X2i …… Xni denotes independent variables, for instance, TTI subsectors, energy consumption, economic growth, and globalization. The α is a constant and α1, α2, ………… αn shows parameters coefficients. Eq. 1 can be written for GHG emissions by contextualizing entertainment and hospitality industry (EH) subsectors, G and EC, as shown in Eqs 2–4.
Similarly, air pollutants equations can be expressed in terms of EH subsectors by contextualizing economic growth, energy consumption, and globalization, however, to save time and space, we ignored them. We expressed equations for air pollutants (CO, NH3, NOx, SO2, VOC, PM2.5) by contextualizing travel subsectors EC and G as follows:
We can express equations for GHG emissions like the same in terms of travel subsectors in combination with other variables of interest, however, to save time and space, we ignored them. We can express equations for RGDP and EC randomly in terms of EH and travel subsectors as follows:
A unit root test is a statistical procedure to determine the stationarity of a series. There are various stationarity tests, for instance, Phillips Perron, Augmented Dickey-Fuller, and other tests. If the bounds test estimated F-value is greater than the tabulated value, the equation will be considered cointegrated and vice versa not cointegrated (Pesaran et al., 2001). An error correction model (ECM) can be derived from an autoregressive distributed model through a simple linear transformation. “The error correction model integrates the short-run dynamics with the long-run equilibrium without losing any long-run information and avoids spurious problems resulting from non-stationary time series data” (Shrestha and Bhatta, 2018). The error correction version of the ARDL model in Eq. 1 is given as follows:
The first part of Eq. 13 with α1, α2, ……… αn presents the short-run dynamics of the given ARDL model. The second part with λ1, λ2, ……… λn represents the long-run dynamics, and μt denotes the error terms in time t. The null hypothesis of Eq. 13 says that λ1 + λ2s + ……… + λn = 0, which means that there is no cointegration relationship between the variables in the long-run. The error correction model for GHG emissions, air pollutants, economic growth, and energy consumption can be defined as under in Eq. 14 (note: we developed an error correction model only for CO2 emissions in terms of EH subsectors, EC, and G, besides, we ignored the others to save space and time. Other equations can be developed the same)
We also applied Granger causality tests to determine the direction of the relationship between the variables of interest. “If two variables Y and X are cointegrated, then any of the 3 relationships may exist: a) X affects Y, b) Y affects X and c) X and Y affect each other. The first two show unidirectional relationships, while the third shows the bidirectional relationship” (Shrestha and Bhatta, 2018). The Granger causality model can be defined as follows:
The null hypothesis of Eqs 15, 16 holds that the values of
4 Empirical estimations
We transformed all the variables to a logarithmic format to induce normality. Two unit root tests (Phillips-Perron and Augmented Dickey-Fuller) were used to assess the stationarity characteristics of variables. We found that our variables were stationary at level I (0) or at the first difference I (1). The descriptive statistics and unit root results are given in Tables 2 and 3. The unit root test confirms that ARDL bound test estimation is suitable for our variables. The ARDL method is susceptible to lag structure; therefore, lag length was calculated for all the equations (a lag length of 6 was noted for all the proposed models, the lag length results will be provided on request). As mentioned earlier, we have divided the TTI industry into two big categories (a) entertainment and hospitality and (b) travel subindustries; each of these categories was further divided into relevant subsectors for a comprehensive analysis. We calculated twenty-two equations in total; RGDP, EC, GHG emissions, and air pollutants were treated as endogenous variables (entertainment and hospitality and travel subsectors were treated as exogenous variables). A bounds test cointegration approach was applied to all twenty-two equations. Table 4 shows that the F-statistic values estimated for each equation are greater than the upper limit of F-tabulated values either at 1%, 5%, or 10%, indicating that all the equations were cointegrated at different significance levels.
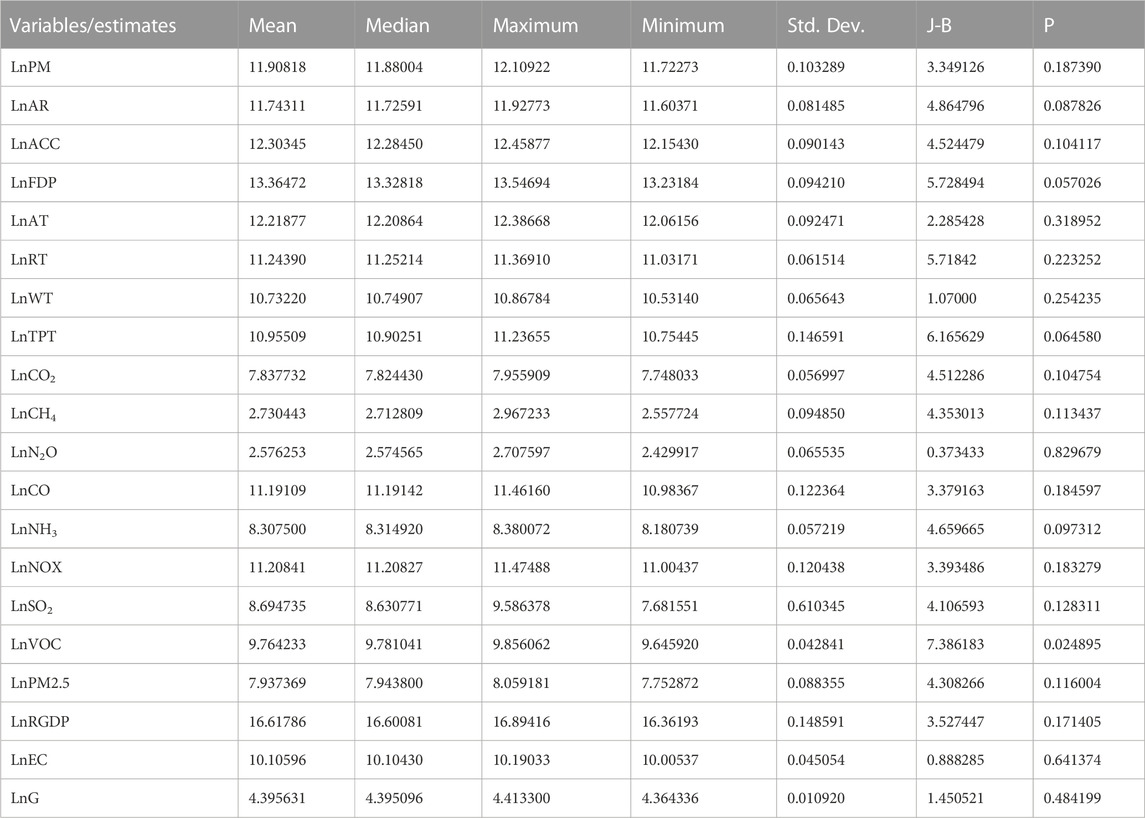
TABLE 2. Descriptive statistics.
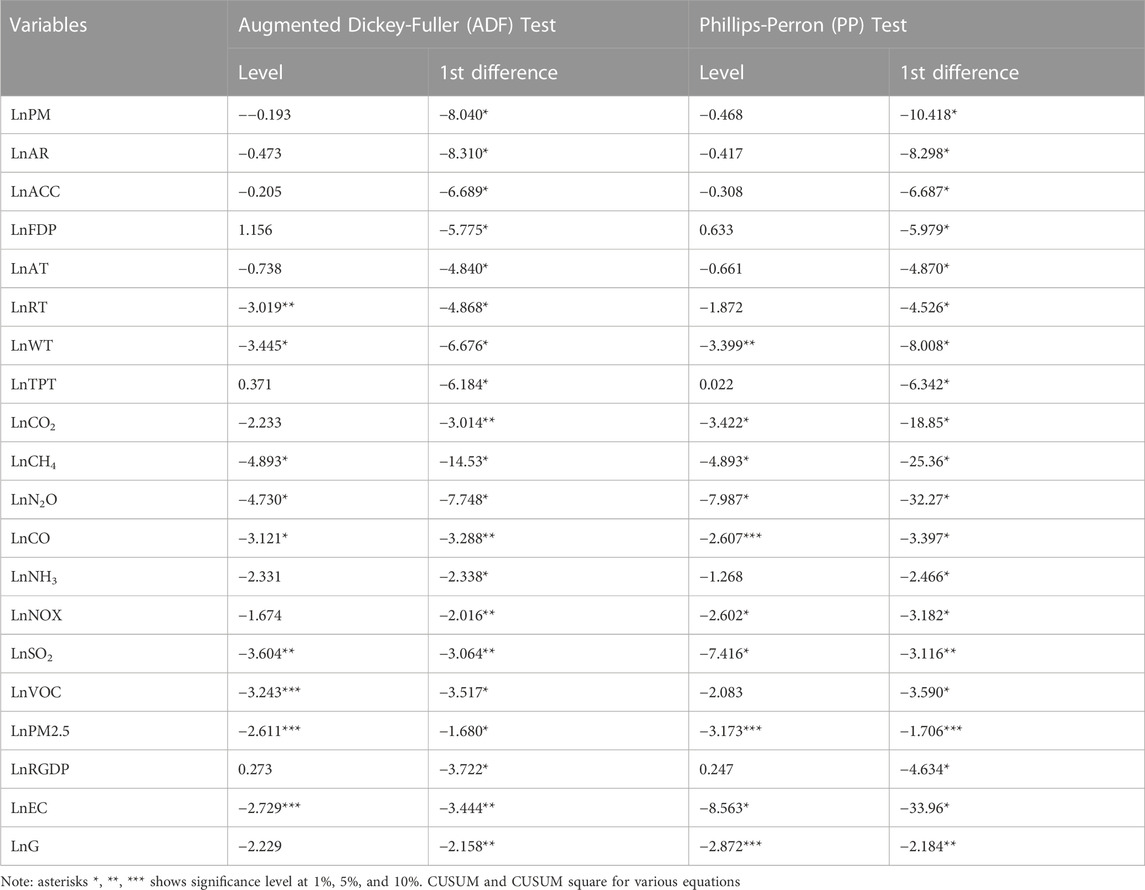
TABLE 3. Unit root -ADF and PP tests- results.
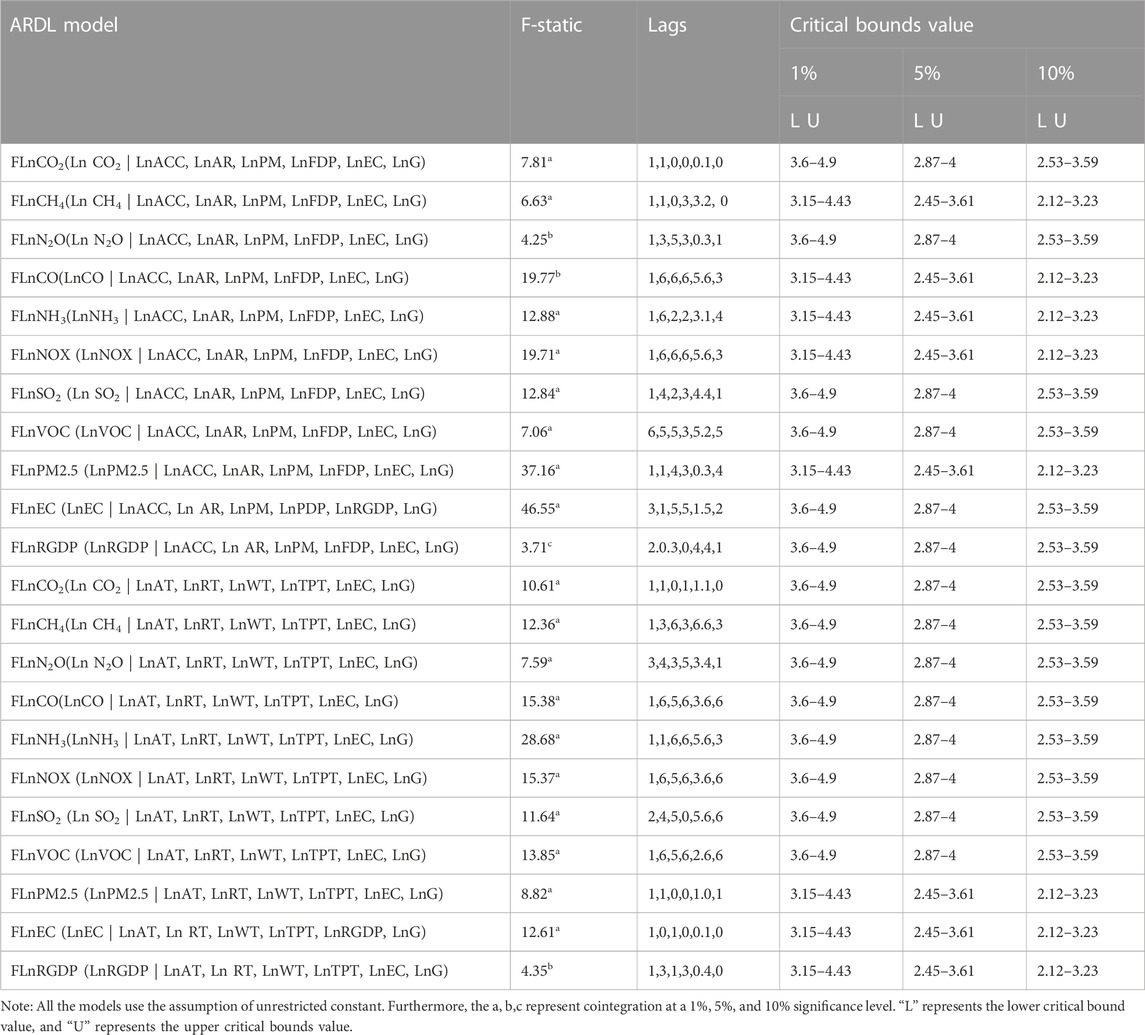
TABLE 4. The results of the bounds test for cointegration.
4.1 Long and short-run dynamics
The bounds test results in Table 4 permit us to estimate the long and short-run dynamics for the proposed equations. We employed a multivariate framework to reach logical findings. The results of long and short-run dynamics are given in Tables 5, 6 because the results for twenty-two equations were not adjustable in a single table for space reasons. Four ARDL models were calculated for economic growth and energy consumption, as given by equations in Table 4. The results (Table 5) indicate that a 1% increase in ACC, AR, and FDP enhanced RGDP by 0.21%, 0.32%, and 0.21% in the long-run. Similarly, ACC, AR, and FDP positively impact short-term economic growth. Note, we will confine the description of the results only to the long-run because we are interested in policy implications and, second, to save space and time (for short-run details, see Tables 5, 6). Travel subsectors results (Table 6) show that AT, AR, and TPT positively influence economic growth by 0.71%, 0.48%, and 0.97% by a 1% increase in the respective variables in the long-run. We can also note that energy consumption in the travel subsector has a significant positive impact on RGDP.
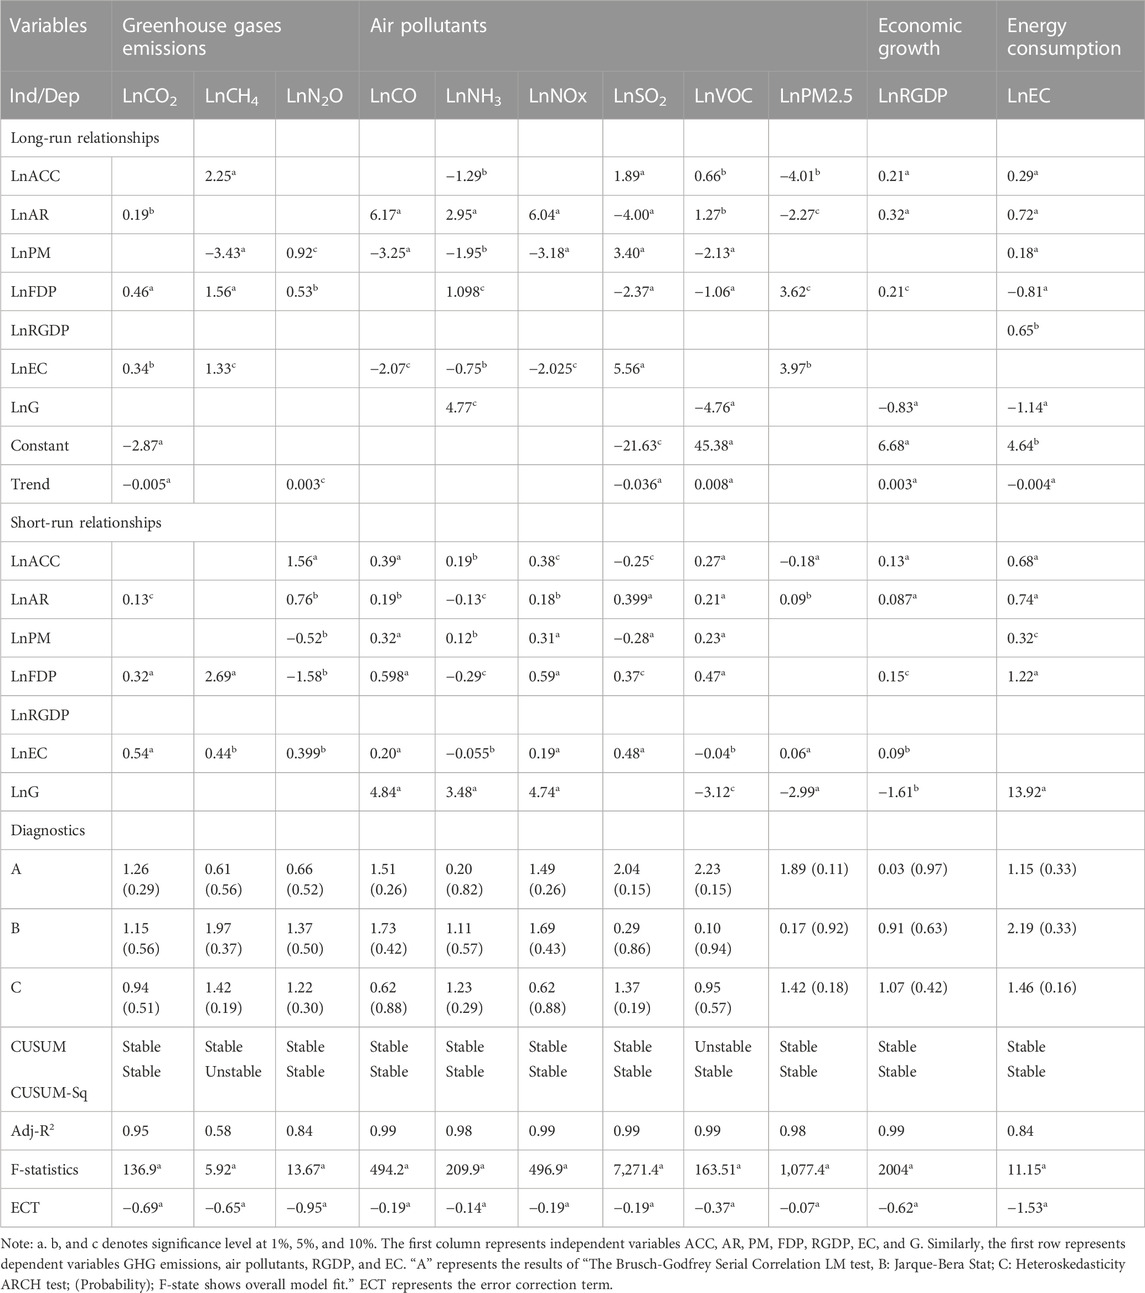
TABLE 5. Entertainment and hospitality subsectors long and short-run dynamics.
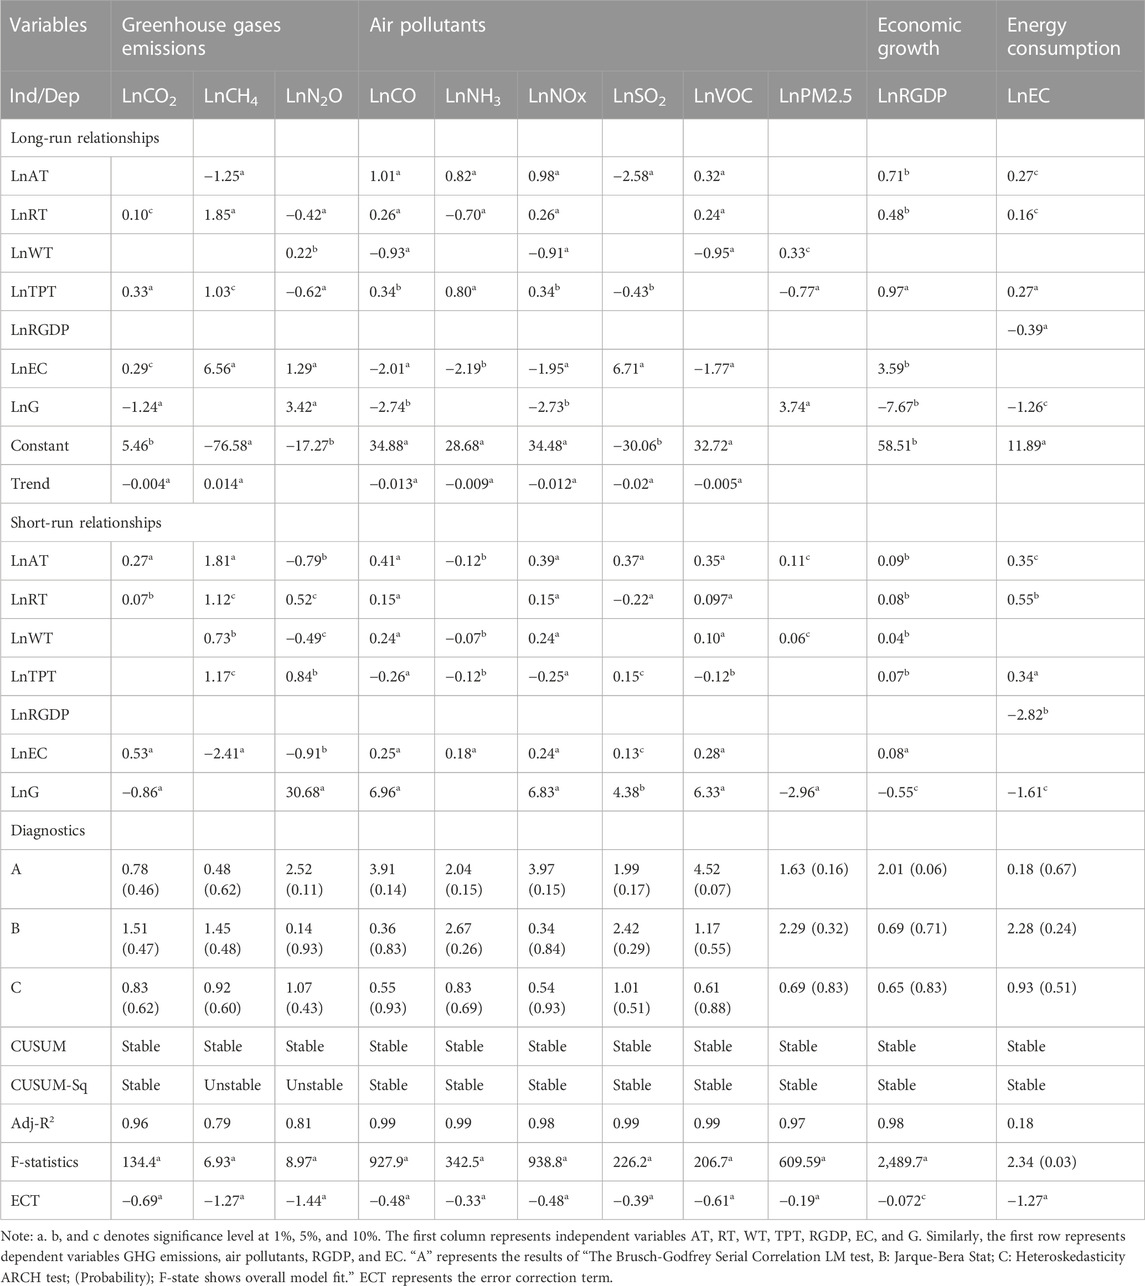
TABLE 6. travel subsectors long and short-run dynamics.
Table 5 indicates that a 1% increase in ACC, AR, and PM sectors increases energy consumption by 0.29%, 0.72%, and 0.18% in the long-run, and a 1% increase in RGDP increases EC by 0.65%. AT, RT, and TPT travel subsectors also significantly influence EC in the long run by 0.27%, 0.16%, and 0.27%. It is observed that an increase in the RGDP negatively influences EC in the travel industry. Besides, globalization shows significant negative impacts on RGDP and EC both in the EH and travel sectors in the log-run.
Moreover, Table 5 reveals that a 1% increase in EH subsectors AR and FDP increases CO2 emissions by 0.19% and 0.46% in the long-run. Similarly, a 1% increase in travel subsectors RT and TPT increases CO2 emissions by 0.10% and 0.33%, as shown in Table 6. The long-run relationships for CH4 show that a 1% increase in ACC and FDP increases CH4 concentration by 2.25% and 1.56%; however, PM indicates a negative impact. A growth of 1% in the AR and TPT sectors reveals a positive influence on CH4 by 1.85% and 1.03% in the long-run.
Table 5 reveals that a 1% increase in PM and FDP sectors enhances N2O emissions by 0.92% and 053%; however, the same increase in WT and TPT increases N2O emissions by 0.22% and 0.62%, as shown in Table 6.
The long-run dynamics of air pollutant CO indicate that a 1% increase in the AR subsector increases the concentration of CO by 6.17%. Besides, a 1% growth in the travel subsectors AT, RT, and TPT enhanced CO concentration by 1.01%, 0.26%, and 0.34% in the long-run. Table 5 also reveals that a 1% increase in AR and FDP increases NH3 concentration by 2.95% and 1.09%; the same percentage of growth in travel subsectors AT and TPT increases NH3 intensification by 0.82% and 0.80%. A 1% improvement in the AR increases NOx by 6.04%. The same amount of growth in AT, RT, and TPT increases the concentration of NOx by 0.98%, 0.26%, and 0.34% (see, Table 6). ACC and PM subsectors increase the growth of SO2 positively and significantly by 1.89% and 3.40%; however, travel subsectors show no positive contribution to SO2, as shown in Table 6. The EH subsectors ACC and AR significantly increase VOC by 0.66% and 1.27%; similarly, travel subsectors RT and WT increase VOC by 0.32% and 0.24%. Only FDP significantly influences PM2.5 concentration in EH subsectors by 3.62%; however, the travel subsector WT is responsible for PM2.5 concentration by 0.33%.
The long-run dynamics of EC in the EH subsector show that EC significantly increases CO2, CH4, SO2, and PM2.5 by 0.34%, 1.33%, 5.56%, and 3.97%. Similarly, the EC long-run dynamic in travel subsector settings significantly enhances the concentration of CO2, CH4, N2O, and SO2 by 0.29%, 6.56%, and 6.71%. Besides, energy consumption positively influences economic growth with travel subsectors. The long-run dynamics of globalization significantly affect NH3 in the EH subsector setting; however, G increases N2O and PM2.5 in the travel subsector setting. Furthermore, G negatively influences RGDP and EC in the long-run both in the EH and travel subsectors. For more details about the long-run results, please see Tables 5, 6.
We conducted various diagnostics tests to evaluate estimated models’ misspecification problems. Tables 5, 6 bottom panels show the results for Jarque-Bera normality, Breusch-Godfrey Serial Correlation LM test, Hetroskedasticity test, and adjusted R2. Jarque-Bera statistic indicates that all twenty-two equations were normally distributed. Breusch-Godfrey LM test reveals that our models were free of serial correlation. The Breusch-Pagan Godfrey test results indicate that estimated models were free of heteroskedasticity problems. The F-statistic indicates that all the models were well fitted to the data at a 5% significance level. Adjusted R2 values indicate the explained variance in the endogenous variables and show how well the independent variables explain the dependent variable in the model. The Cusum and Cusum-square plots show that most of the estimated models are stable except for a few that are partially unstable (plots are given in the supplementary material). The error correction term (ECT), which shows the speed of adjustment, assumes that it should be negative at a 5% significance level and its value should not be less than −2 within the stable dynamic range of unit circle root (Adeleye et al., 2018). ECT’s high value in absolute terms shows a faster adjustment process. Tables 5, 6 indicate that all the ECT’s values are negative and within the threshold value range, thus, meeting the ARDL assumption.
4.2 Granger causality
We conducted the Granger causality test to determine causality directions. Table 7 reveals that EH subsectors ACC, AR, and FDP cause RGDP [tourism-led economic growth hypothesis (TLGH)]; however, RGDP causes PM [growth-led tourism hypothesis (GLTH)]. Similarly, travel subsectors AT, WT, and TPT cause RGDP; however, RGDP causes RT. All travel subsectors cause EC and except FDP, all the EH subsectors cause EC. AR, PM, RT, WT, and TPT cause CO2 emissions; however, CO2 causes ACC. There is bidirectional causality between RGDP, EC, and G with CO2 emissions. ACC, PM, and RT establish a unidirectional relationship with NH4. Similarly, AR, FDP, AT, TPT, EC, and RGDP have a unidirectional causality with N2O. All the EH subsectors establish unidirectional relationships except a few (bidirectional) with air pollutants CO, NH3, NOx, SO2, VOC, and PM2.5. Similarly, travel subsectors have unidirectional (except for a few bidirectional) relationships with air pollutants. Energy consumption and RGDP also formed mixed causal relationships with GHG emissions and air pollutants. Please see Table 7 for the details of causal relationships between EH subsectors, travel subsectors, RGDP, EC, G, GHG emissions, and air pollutants.

TABLE 7. Granger causality.
5 Discussion
The TTI industry undoubtedly is a driver of economic development and job creation in the US (Khan et al., 2020d). The TTI’s contribution to economic growth and long-lasting social impacts is immense; however, without a healthy and clean environment, the industry and planet’s survival is impossible. The increased understanding of TTI’s damaging environmental impacts demands a sector-wise analysis of TTI to find sustainable economic growth solutions and protect the environment. Literature indicates that previous studies mostly researched tourism’s impact on economic growth by proxying tourism receipts or tourist arrivals and considered only CO2 emissions to evaluate the environmental impacts. However, the TTI subsectors operate differently in the same business environment, use different levels of the energy mix, and are responsible for varying levels of emissions. Hence, diverse strategies and policy guidelines are required to achieve maximum economic output with a lesser level of environmental degradation. Our discussion is confined to long-run dynamics and Granger’s causal direction to recommend long-run policy initiatives.
This study’s findings reveal that EH subsectors ACC, AR, and FDP contribute to the US economic growth; the causalities run from all EH subsectors to RGDP, except FDP. Except for RT, all the other transportation sectors developed a sector-led growth relationship with RGDP. Before the COVID-19 pandemic, TTI supported 9.5 million citizen jobs and generated an output of $1.9 trillion in 2019 (ITA, 2022c). Nearly 80 million foreign tourists’ visited the US, contributing approximately $240 billion to the economy, making the US a global leader in earning the highest revenue from international tourism (Commerce, 2022). We identified that ACC, AR, and PM subsectors in the EH industry exhibit the potential to influence economic growth; however, expansion in the economic growth support FDP sector development. The ACC subsector in the EH industry accounted for 19% of the total TTI output and supported 1.4 million employees’ jobs (SelectUSA, 2021). The food services and drinking places industry (FDP) attracted $44.7 in foreign direct investment in the US and employed 9 million people in 2019 (SelectUSA, 2022). The AT, RT, and TPT demonstrate the capability to enhance economic growth in the US. Air transportation in the travel sector nearly accounted for 17% of the total TTI output. Besides, the US is also leading the world in TTI-related exports, accounting for $239 billion in 2019, which ranks TTI as the third largest export sector in the US (ITA, 2022a). These facts and figures from international bodies reflect our findings and retain that most of the subsectors in the EH and travel industries support economic growth; however, the FDP subsector shows growth-led behavior, which is evident from its FDI attraction. Mostly the EH and travel subsectors demonstrate positive long-run dynamics with energy consumption, and the causalities are run from EH and travel sectors to EC. This shows TTI’s high dependency on energy consumption which significantly contributes to GHG emissions and air pollutants.
The findings show that EH subsectors AR, FDP, and travel subsectors RT and TPT significantly contribute to CO2 emissions. FDP and TPT contribute to CO2 emissions more than the other subsectors. Similarly, ACC, FDP, RT, and TPT significantly influence CH4 emissions. ACC and RT contributions to CH4 are higher than the other subsectors. PM, FDP, and WT are the major contributors to N2O. Besides, EC positively influenced all GHG emissions in both EH and travel subsectors. Recreation, lodging, events, concerts, food and beverages, and other EH-related industries consume varying energy mixes to perform their routine functions leading to emissions. The travel subsectors accounted for 28% of total energy consumption. Gasoline is a commonly used energy source for transportation in the US. The transportation energy consumption mix in the US indicates petroleum usage at 58%, diesel at 24%, jet fuel at 11%, natural gas at 4%, biofuel at 5%, and electricity and other 3% (EIA, 2022b). The EH industry is the fifth largest energy consumer in the US (Xiong et al., 2022). Travel subsectors accounted for 27% of US GHG emissions and are the largest contributor to emissions. The TPT subsector, which includes cars, trucks, and other light, medium, and heavy-duty vehicles, cause 83% of GHG emissions (EPA, 2022a).
A bidirectional relationship exists between FDP, RGDP, EC, G and CO2 emissions. This implies that they are necessary for each other growth; for instance, when there are more economic activities in a country, a high level of energy is consumed, which results in high CO2 emissions. The CO2 emissions cause economic growth. Studies suggest that a 1% increase in CO2 emissions increases economic growth by 2.18% (Acheampong, 2018). The food and drinking places also have a double edge relationship with CO2, for instance, CO2 is used in various types of food and beverage preparation; however, these facilities also emit CO2 by consuming energy, waste, or in the preparation process. Travel subsectors impact trade and jobs throughout the economy directly and indirectly. Every day, goods and services are transported to ACC, FDP, PM, and AR subsectors for developing new facilities, food production, exhibitions, conferences, organized events and concerts, the US hotel accommodation, participant transportation, tourist transportation, refrigeration, air conditioning, and waste disposal leading to a high volume of emissions (EPA, 2018).
The TTI subsector’s operations need energy for lighting, heating, refrigeration, transportation, storage, boiling, conservation, and preservation which causes air pollution. TTI contributes to air pollutants through industrial gases, stationary, landfills, and waste disposal. EH subsector AR and travel subsectors AT, RT, and TPT contribute positively to CO air pollutants. AR contribution to CO air pollutants is higher than other EH and travel subsectors. Casinos contribute to CO through smoking, insulation, boilers, cooling, and electric generators in the AR sectors. Gaming and indoor sports facilities, indoor climbing and gymnasium, ice hockey, indoor golf, and ice skating are the primary sources of CO air pollutants in the AR sectors (Salonen et al., 2020). Besides leaking chimneys, kerosene and gas heaters, stoves, and furnaces release CO. CO is produced by incomplete fossil fuels combustion; transportation accounts for approximately 61% of CO emissions in the US (Statista, 2022). Trucks, cars, machinery, and other vehicles are the primary source of CO in outdoor air.
The EH subsectors AR and FDP and travel subsectors AT and TPT positively contribute to NH3, and FDP and TPT have a bidirectional causality with NH3. The main causes of NH3 in EH subsectors are waste disposal, cleaning agents, agriculture products, livestock, animal feeds, landfills, and water leakages. NH3 bidirectional causality with EH sectors indicates that the EH sector causes NH3 and NH3 causes them; for instance, the accommodation and food sectors depend on water, agriculture, and livestock. However, ACC and FDA sectors produce NH3 through waste disposal and landfills. Studies reveal that vehicles are the main source of airborne ammonia and stimulate the formation of PM10, and PM2.5, which contribute to air pollution and harm human health (Farren et al., 2020). The NH3 in road vehicles comes from the catalyst-equipped petrol and selective catalyst reduction both in light and heavy-duty vehicles.
Our findings indicate that AR in the EH industry and AT, RT, and TPT in the travel industry are responsible for significant NOx emissions. Heated swimming pools, cooking on natural gas, food boiling, washroom water heating, toxic supplies, nitric acid utilization, and energy consumption in various forms cause NOx emissions in the EH industry. Nitrogen is used in beer production in restaurants, bars, and casinos. Furthermore, nitrogen is also used in food packing for preservation and freshness, to prevent microbial growth, and to protect the nutrients. Air pollutants emitted from transportation contribute to soot, smog, and poor air quality. Pollutants that highly contribute to poor air quality include VOCs, NOx, and PM2.5. Transportation is responsible for 55% of NOx emissions in the US (EPA, 2022b). ACC and PM sectors in the EH industry are observed to be positive contributors to SO2 air pollutants. We failed to establish a positive relationship between FDP, WT, and TPT with SO2 in the long-run; however, causality runs from these subsectors to SO2. Fossil fuel burning by power plants and industrial facilities is the largest source of SO2 emissions. Besides, ships, volcanoes, locomotives, heavy equipment, and vehicles consume fuel with sulfur contents contributing to SO2 air pollutants. A high concentration of SO2 in the air leads to SOx formation, which reacts with other compound form PM10 and PM2.5 (EPA, 2022c). ACC and PM sectors’ SO2 emissions are attributed to boilers, natural gas cooking, the use of coal, and electric heat pumps.
This study’s findings also reveal that ACC, AR, and FDP subsectors in EH, AT, and RT in the travel industries contribute to VOCs in the long-run. Most of the subsectors establish a unidirectional causality running from EH and travel subsectors to VOCs. Consumption of consumer products in the entertainment and hospitality industry contributes to VOCs; for instance, furnishings, wine, lacquers, disinfectants, copiers, printers, stationery, dry cleaning, air fresheners, paints, varnishes, etc. The PM subsector’s personal care products, cosmetics, and hobby supplies contribute significantly to VOCs. All the travel subsectors consume fossil fuels for energy leading to a high level of VOCs and PM2.5 pollutants. Besides, all the EH and travel industry subsectors establish a unidirectional causality running from these sectors to PM2.5, indicating that all these sectors are responsible for PM2.5 air pollution. US transport is responsible for approximately less than 10% of each of VOC, PM2.5, and PM10 emissions (EPA, 2022b).
Furthermore, the EC established unidirectional causalities with all EH and travel subsectors. EC also formed a unidirectional causal relationship with N2O, SO2, and PM2.5 and established bidirectional causalities with RGDP, CO2 emissions, and globalization. It can be argued that all the EH and travel subsectors consume various types of energy in their operations, leading to economic growth, which results in different kinds of emissions and air pollution. Our findings reveal that globalization establishes a few long-run positive relationships with GHG emissions and air pollutants in combination with EH and travel subsectors; however, globalization indicates mostly unidirectional causalities with GHG emissions, air pollutants, RGDP, and EC. Thus, we argued that globalization increases the need for travel and EH facilities, leading to high energy demand that enhances economic growth and causes higher GHG emissions and air pollutants.
5.1 Conclusion and policy implications
This study followed an integrated and holistic approach to investigating causal relationships between EH and travel subsectors with economic growth, energy consumption, GHG emissions, and air pollutants. Previous studies attempted to examine these relationships in an individual setting, for instance, economic growth and CO2 emissions, tourism arrivals and CO2, tourism and economic growth, leisure industry, and environmental pollution. However, few studies examine tourism subsector level environmental pollution, for instance, Xiong et al. (2022). These studies undoubtedly provide good information on the subject matter; however, there are some limitations. For instance, Xiong et al. (2022) neglected the travel sector, a major tourism actor contributing to economic growth and environmental degradation. They also ignore the subsector-level economic contribution. EH and travel subsectors, economic growth, GHG emissions, and air pollutants work in a cyclical form; therefore, an integrated approach is of utmost importance to initiate concrete policy implications and solve misconceptions.
TTI’s subsectors ACC, AR, FDP, AT, WT, and TPT support a tourism-led economic hypothesis in the US, indicating its potential to enhance economic growth in the country. The US TTI exports decreased by 65% in 2020 compared to 2019. To support and ensure TTI resilience, equitability, economic benefits, and sustainability, the US government needs to stimulate international tourist demand by easing travel and trade restrictions. The NTTO needs to create a positive TT business environment by welcoming international travel by minimizing travel restrictions, offering diverse products, addressing the financial needs of the TTI, support for tourism communities, and delivering world-class tourist experiences. Thereby TTI will create more employment and economic growth. The government also needs to leverage the existing resources to promote the US to international tourists by broadening marketing efforts to encourage visitation to deserving communities. The federal government must coordinate and work closely with the state, local, and tribal governments and the private sector to support collaborative marketing and offer them opportunities to showcase their tourism products to attract tourists. Brand US and destination management organizations can promote US cultural diversity by providing authentic and unique products such as music, heritage, foodways, and cultural histories to attract tourists. The US government can increase tourist demand by leveraging large-scale events, for instance, the 2028 Olympics, solar eclipses in 2024, EXPO 2027, and FIFA World Cup 2026.
The US federal government needs to make more effort to rebuild TT industries on more resilient, sustainable, and equitable grounds, which ensures the economic, social, and cultural benefits reach all the communities regardless of size and location across the US. A holistic approach to tourism development policy needs to be adopted by incorporating community-based management, development, and sustainability strategies. This approach will enhance tourism economic growth and address the accompanying challenges, for instance, environmental carrying capacity, physical carrying capacity, and sociocultural carrying capacity. Developing diverse tourism products will extend TT industries’ benefits to underserved communities. The government needs to leverage financial support and workplace requirements to motivate destination communities to expand their tourism economies by showcasing the US’s assets while protecting future generations. Federal government and agencies need to work closely with the private sector to reduce TT industries’ negative contribution to the ecosystem and rebuild a more resilient TT industry that can protect public health and have fewer impacts on the climate. This is only possible by integrating environmental, social, cultural, agriculture, public health, and economic policies with tourism policy. A sustainable tourism policy will ensure nature and culture protection, peace, environmental equity, a strong economy, and equitable development.
The negative environmental impacts are not caused by economic development but by the absence of concrete public policy and lack of effective implementation to reduce GHG emissions and minimize air pollution. Economic growth is compatible with environmental protection, where rules are in place to control tourism products and services’ negative impacts. Environmental safety itself contributes to economic growth, for instance, air pollution technologies, water treatment facilities, solar cells, electric cars, and windmills. There is no doubt that TTI operations depend on energy consumption; however, other factors of TTI contribute to GHG emissions and air pollutants, for instance, cooking, food waste, detergents, wastewater, cleaning agents, and the use of gases in food production. The EH industry stakeholders can play a critical role in reducing GHG emissions and air pollutants by initiating LEED certification, reducing water consumption, recycling soap waste, recycling food waste, and increasing renewable energy production. The government needs to address and collaborate with the private sector on financial needs to encourage investments in anaerobic digestion. This will transform organic waste into biomethane, which can produce sustainable energy and address the energy crisis and waste disposal. The US government should encourage investments and actions to prevent food waste by keeping food in the human supply chain to minimize GHG emissions. It is also recommended to allocate financial resources to states and cities to develop organic waste recycling infrastructure, research food waste reduction, and conduct public talks to encourage sustainable and responsible behavioral change. This will mitigate various emissions, for instance, CO2, VOCs, PM2.5, NOx, and SO2.
The lodging, restaurants, fast food facilities, casinos, and other food facilities can reduce GHG emissions by serving more climate-friendly foods. For instance, in more than 500 hotels in 100 countries, Hilton group offers reduced meat options such as “The Blended Burger” to lower GHG emissions by 30%. The company increased vegetarian menu items and trained employees on food sustainability to raise awareness among guests. The ACC, PM, FDP, and AR subsectors can reduce GHG emissions and air pollution by minimizing energy use, for instance, using daylight, installing timers, and using the energy management system (EMS). To avoid NH4, N2O, and CO, these facilities need routine maintenance of boilers, heating and cooling systems, and the use of organic paints and cleaning agents. Further, GHG emissions and air pollutants can be reduced through adequate filtration, sustainable cleaning practices, limiting the number of occupants in the gymnasiums and fitness centers, using electric resurfacers in ice hockey arenas, regulating temperature and chlorine in the indoor swimming pools, ventilation, and personal hygiene.
The US government has several legislations to protect the environment and control GHG emissions and air pollution. Examples of the many include Clean Air Act, Clean Water Act, Beaches Environmental Assessment and Coastal Health (BEACH) Act, Energy Policy Act, Pollution Prevention Act. Instead of these laws, the US has no comprehensive federal control over GHG emissions; besides, there is always conflict on such legislation among the stakeholders to protect their personal and organizational interests. For instance, consumer organizations and local governments filed petitions against EPA SAFE Vehicles Rule. Similarly, the Clean Power Plan (CPP) was the first subject to litigation, and later Trump administration repealed the CPP. The different laws and rules come under the jurisdiction of separate administrations subject to different interpretations and raise questions about the potential approach for implementation. Therefore, the US government needs to pass legislation that authorizes and empowers the Environmental Protection Agency (EPA) to develop various coordination councils for coordination and collaboration with stakeholders to implement these laws. Further, the government needs to consider sectoral level carbon pricing framework and approaches, for instance, clean energy standards, GHG abating technologies deployment, and tax policies to reduce air pollution. US policy on international conventions, programs, and policies have always been inconsistent; for instance, Obama signed the Paris Agreement, Trump withdrew, and Biden rejoined. Therefore, the US must consistently implement and respect international sustainable climate policies and programs to become a global climate protection leader.
Every study has some limitations, and this study is not an exception. This research calculated some missing values through interpolation, which is only guesswork, and the findings may be inflated or deflated. Second, we have ignored toxic air pollutants, such as mercury Hg emissions, Hg_D emissions, Hg_G emissions, and Hg_P emissions; therefore, future studies should consider them while investigating the tourism impacts on the environment. Third, we tried our best to discuss as many policies as possible; however, we restrained ourselves to a certain extent because of the word limits. There are hundreds of studies on tourism economic growth and environmental issues for different countries; however, there is a minute focus on policy issues. Therefore, future research should focus more on the existing policies to lead to innovation through logical recommendations.
Data availability statement
The data analyzed in this study is subject to the following licenses/restrictions: The data is available on the provided sources while some of the data has been purchased. Requests to access these datasets should be directed to https://data.worldbank.org/indicator; https://ourworldindata.org/; https://www.bea.gov/data/special-topics/travel-and-tourism.
Author contributions
AK and SB contributed to the conceptualization, writing the original draft, methodology, and formal analysis. HL helped with the literature review, methodology, and editing. XF and SH helped with the data curation, investigation, revision, and editing. SJ contributed to validation, discussion, and revision. All authors have read and agreed to the published version of the manuscript.
Funding
This research is supported by: 1. Research on the Mediation's Consent Formation Mechanism in the Post-Pandemic Era, supported by Zhejiang Provincial Philosophy and Social Sciences Planning Project (23NDJC198YB). 2. Research on the Incentive Mechanism of China's Environmental Credit Rating System, funded by the Ministry of Justice (20SFB4070).
Conflict of interest
The authors declare that the research was conducted in the absence of any commercial or financial relationships that could be construed as a potential conflict of interest.
The reviewer HH declared a past co-authorship with the author(s) AK and SB to the handling editor.
Publisher’s note
All claims expressed in this article are solely those of the authors and do not necessarily represent those of their affiliated organizations, or those of the publisher, the editors and the reviewers. Any product that may be evaluated in this article, or claim that may be made by its manufacturer, is not guaranteed or endorsed by the publisher.
References
Acheampong, A. O. (2018). Economic growth, CO2 emissions and energy consumption: What causes what and where? Energy Econ. 74, 677–692. doi:10.1016/j.eneco.2018.07.022
Adeleye, N., Osabuohien, E., Bowale, E., Matthew, O., and Oduntan, E. (2018). Financial reforms and credit growth in Nigeria: Empirical insights from ARDL and ECM techniques. Int. Rev. Appl. Econ. 32, 807–820.
Aratuo, D. N., and Etienne, X. L. (2019). Industry level analysis of tourism-economic growth in the United States. Tour. Manag. 70, 333–340. doi:10.1016/j.tourman.2018.09.004
Balsalobre-Lorente, D., Driha, O. M., Shahbaz, M., and Sinha, A. (2020). The effects of tourism and globalization over environmental degradation in developed countries. Environ. Sci. Pollut. Res. 27, 7130–7144. doi:10.1007/s11356-019-07372-4
Buzby, J. (2022). Food waste and its links to greenhouse gases and climate change. USA: US Department of Agriculture. (USDA). Available at: https://www.usda.gov/media/blog/2022/01/24/food-waste-and-its-links-greenhouse-gases-and-climate-change (Accessed June 13, 2022).
Commerce, U. D. O. (2022). 1401 constitution ave NW Washington, DC 20230. Washington, DC: US Department of Commerce. Available at: https://www.commerce.gov/news/fact-sheets/2022/06/fact-sheet-2022-national-travel-and-tourism-strategy (Accessed June 9, 2022).
Davenport, J., and Davenport, J. L. (2006). The impact of tourism and personal leisure transport on coastal environments: A review. Estuar. Coast. shelf Sci. 67, 280–292. doi:10.1016/j.ecss.2005.11.026
DOE (2022). Hotel energy consumption statistics and lessons learned. USA: United States Department of Energy. Available at: https://betterbuildingssolutioncenter.energy.gov/sectors/hospitality (Accessed Jan 12, 2022).
Dos Santos, R. A., Mexas, M. P., Meirino, M. J., Sampaio, M. C., and Costa, H. G. (2020). Criteria for assessing a sustainable hotel business. J. Clean. Prod. 262, 121347. doi:10.1016/j.jclepro.2020.121347
EIA (2022a). March 2022 monthly energy review USA. Washington, DC: US Energy Information Administeration.
EIA (2022b). Use of energy explained: Energy use for transportation. USA: US Energy Information Administration. Available at: https://www.eia.gov/energyexplained/use-of-energy/transportation.php (Accessed June 1, 2022).
EPA (2020a). Air pollutant emissions trends data. USA. Available at: https://www.epa.gov/air-emissions-inventories/air-pollutant-emissions-trends-data (Accessed March 17, 2020).
EPA (2020b). Air quality - national summary. USA: U.S. Environmental Protection Agency. Available at: https://www.epa.gov/air-trends/air-quality-national-summary (Accessed May, 2021).
EPA (2022a). Fast facts on transportation greenhouse gas emissions. USA: United States Environmental Protection Agency. Available at: https://www.epa.gov/greenvehicles/fast-facts-transportation-greenhouse-gas-emissions#:∼:text=According%20to%20the%20Inventory%20of,U.S.%20GHG%20emissions%20in%202020 (Accessed July 20, 2022).
EPA (2018). Greenhouse gas inventory guidance, indirect emissions from events and conferences. USA: United States Environmental Protection Agency.
EPA (2020c). Smog, soot, and other air pollution from transportation . USA: United States Environmental Protection Agency. Available at: https://www.epa.gov/transportation-air-pollution-and-climate-change/smog-soot-and-local-air-pollution (Accessed June 20 2020).
EPA (2022b). Smog, soot, and other air pollution from transportation . US: Unite States Environmental Protection Agency. Available at: https://www.epa.gov/transportation-air-pollution-and-climate-change/smog-soot-and-other-air-pollution-transportation#:∼:text=Air%20pollution%20emitted%20from%20transportation,volatile%20organic%20compounds%20. (Accessed 13 June 2022).
EPA (2022c). Sulfur dioxide basics. US: Unite States Environmental Protection Agency. Available at: https://www.epa.gov/so2-pollution/sulfur-dioxide-basics (Accessed August 21, 2022).
Farren, N. J., Davison, J., Rose, R. A., Wagner, R. L., and Carslaw, D. C. (2020). Underestimated ammonia emissions from road vehicles. Environ. Sci. Technol. 54, 15689–15697. doi:10.1021/acs.est.0c05839
Gao, J., and Zhang, L. (2019). Exploring the dynamic linkages between tourism growth and environmental pollution: New evidence from the mediterranean countries. Curr. Issues Tour. 24, 49–65. doi:10.1080/13683500.2019.1688767
Gössling, S. (2002). Global environmental consequences of tourism. Glob. Environ. change 12, 283–302. doi:10.1016/s0959-3780(02)00044-4
Gössling, S., and Hall, C. M. (2006). Tourism and global environmental change: Ecological, social, economic and political interrelationships. Taylor and Francis.
ITA (2020a). Factsheet international visitation to US 2020. US: International Trade Administeration United States of America.
ITA (2022a). National travel and tourism Office: Travel exports key terms. US: National Travel and Tourism Office: Travel Exports.
ITA (2022b). National travel and tourism strategy 2022. Washington, USA: International Trade Administration, U.S. Department of Commerce.
ITA (2022c). Travel and tourism industry. USA: International Trade Administeration US. Available at: https://www.trade.gov/travel-tourism-industry (Accessed Jan 16, 2022).
Khan, A., Bibi, S., Ardito, L., Lyu, J., Hayat, H., and Arif, A. M. (2020a). Revisiting the dynamics of tourism, economic growth, and environmental pollutants in the emerging economies—sustainable tourism policy implications. Sustainability 12, 2533. doi:10.3390/su12062533
Khan, A., Bibi, S., Lorenzo, A., Lyu, J., and Babar, Z. U. (2020b). Tourism and development in developing economies: A policy implication perspective. Sustainability 12, 1618. doi:10.3390/su12041618
Khan, A., Bibi, S., Lyu, J., Alam, M., Khan, M. M., and Nurunnabi, M. (2020c). The quest of tourism and overall well-being: The developing economy of Pakistan. PSU Res. Rev. 5, 120–140. doi:10.1108/prr-07-2019-0022
Khan, A., Bibi, S., Lyu, J., Babar, Z. U., Alam, M., and Hayat, H. (2021). Tourism development and well-being: The role of population and political stability. Fudan J. Humanit. Soc. Sci. 15, 89–115. doi:10.1007/s40647-021-00316-8
Khan, A., Bibi, S., Lyu, J., Latif, A., and Lorenzo, A. (2020d). COVID-19 and sectoral employment trends: Assessing resilience in the US leisure and hospitality industry. Curr. Issues Tour. 24, 952–969. doi:10.1080/13683500.2020.1850653
Khan, A., Bibi, S., Lyu, J., Raza, A., Hayat, H., and Meo, M. S. (2020e). Unraveling the nexuses of tourism, terrorism, and well-being: Evidence from Pakistan. J. Hosp. Tour. Res. 44, 974–1001. doi:10.1177/1096348020917742
Lamb, J. B., True, J. D., Piromvaragorn, S., and Willis, B. L. (2014). Scuba diving damage and intensity of tourist activities increases coral disease prevalence. Biol. Conserv. 178, 88–96. doi:10.1016/j.biocon.2014.06.027
Lee, C.-C., and Chien, M.-S. (2008). Structural breaks, tourism development, and economic growth: Evidence from Taiwan. Math. Comput. Simul. 77, 358–368. doi:10.1016/j.matcom.2007.03.004
Lin, V. S., Yang, Y., and Li, G. (2019). Where can tourism-led growth and economy-driven tourism growth occur? J. Travel Res. 58, 760–773. doi:10.1177/0047287518773919
Markwick, M. C. (2000). Golf tourism development, stakeholders, differing discourses and alternative agendas: The case of Malta. Tour. Manag. 21, 515–524. doi:10.1016/s0261-5177(99)00107-7
Neuhauser, A. (2019). 100,000 Americans die from air pollution, study finds. New York, NY: US News and World Report.
Nowak, J.-J., Petit, S., and Sahli, M. (2010). Tourism and globalization: The international division of tourism production. J. Travel Res. 49, 228–245. doi:10.1177/0047287509336334
OECD (2020). OECD tourism trends and policies 2020. France: OECD. Available at: https://www.oecd-ilibrary.org/sites/7af173ce-en/index.html?itemId=/content/component/7af173ce-en (Accessed Jan 14, 2022).
Pan, S.-Y., Gao, M., Kim, H., Shah, K. J., Pei, S.-L., and Chiang, P.-C. (2018). Advances and challenges in sustainable tourism toward a green economy. Sci. total Environ. 635, 452–469. doi:10.1016/j.scitotenv.2018.04.134
Perles-Ribes, J. F., Ramón-Rodríguez, A. B., Rubia, A., and Moreno-Izquierdo, L. (2017). Is the tourism-led growth hypothesis valid after the global economic and financial crisis? The case of Spain 1957–2014. Tour. Manag. 61, 96–109. doi:10.1016/j.tourman.2017.01.003
Pesaran, M. H., Shin, Y., and Smith, R. J. (2001). Bounds testing approaches to the analysis of level relationships. J. Appl. Econ. 16, 289–326. doi:10.1002/jae.616
Pitt, D. (2010). The impact of internal and external characteristics on the adoption of climate mitigation policies by US municipalities. Environ. Plan. C Gov. Policy 28, 851–871. doi:10.1068/c09175
Raza, S. A., Sharif, A., Wong, W. K., and Karim, M. Z. A. (2017). Tourism development and environmental degradation in the United States: Evidence from wavelet-based analysis. Curr. Issues Tour. 20, 1768–1790. doi:10.1080/13683500.2016.1192587
Saint Akadiri, S., Alola, A. A., and Akadiri, A. C. (2019). The role of globalization, real income, tourism in environmental sustainability target. Evidence from Turkey. Sci. total Environ. 687, 423–432. doi:10.1016/j.scitotenv.2019.06.139
Salonen, H., Salthammer, T., and Morawska, L. (2020). Human exposure to air contaminants in sports environments. Indoor Air 30, 1109–1129. doi:10.1111/ina.12718
SELECTUSA. 2022. Industry overview . US: international trade administration, U.S. Department of Commerce. Available at: https://www.trade.gov/selectusa-travel-tourism-hospitality-industry (Accessed August 24 2022).
SelectUSA (2021). The travel, tourism and hospitality industry in the United States. USA: SelectUSA. Available at: https://www.selectusa.gov/travel-tourism-and-hospitality-industry-united-states (Accessed Jan 15, 2022).
SelectUSA (2020). Travel facts and figures. New York: U.S. Travel Association. Available at: https://www.ustravel.org/research/travel-facts-and-figures (Accessed March 23, 2020).
Shahbaz, M., Khan, S., Ali, A., and Bhattacharya, M. (2017). The impact of globalization on CO2 emissions in China. Singap. Econ. Rev. 62, 929–957. doi:10.1142/s0217590817400331
Shrestha, M. B., and Bhatta, G. R. (2018). Selecting appropriate methodological framework for time series data analysis. J. Finance Data Sci. 4, 71–89. doi:10.1016/j.jfds.2017.11.001
STATISTA (2022). Carbon monoxide emissions from transportation in the United States from 1990 to 2021. by source . Statista. Available at: https://www.statista.com/statistics/999680/us-carbon-monoxide-emissions-from-storage-and-transport/#:∼:text=Carbon%20monoxide%20emissions%20from%20highway,110%20million%20tons%20of%20CO (Accessed August 20, 2022).
Tang, C.-H. H., and Jang, S. S. (2009). The tourism–economy causality in the United States: A sub-industry level examination. Tour. Manag. 30, 553–558. doi:10.1016/j.tourman.2008.09.009
Technologies, A. H. (2019). 7 ways hotels can reduce their impact on the environment. USA: Advanced Hospitality Technologies. Available at: http://blog.advhtech.com/hotels-impact-on-the-environment/(Accessed June 13, 2022).
UNWTO (2018). Tourism and the sustainable development goals: Good practices in the americas madrid. Madrid: World Tourism Organization UNWTO.
USTRAVEL (2019a). Brand USA. USA: U.S. Travel Association. Available at: https://www.ustravel.org/issues/brand-usa (Accessed Jan 24, 2022).
WWF (2018). USA: Reducing food waste in hotels. USA: World Wide Fund for Nature. Available at: https://wwf.exposure.co/usa-reducing-food-waste-in-hotels (Accessed June 13, 2022).
Xiong, C., Khan, A., Bibi, S., Hayat, H., and Jiang, S. (2022). Tourism subindustry level environmental impacts in the US. Curr. Issues Tour. 26, 903–921. doi:10.1080/13683500.2022.2043835
Yeganeh, A. J., Mccoy, A. P., and Schenk, T. (2020). Determinants of climate change policy adoption: A meta-analysis. Urban Clim. 31, 100547. doi:10.1016/j.uclim.2019.100547
Zulinski, J. (2018). U.S. Leads in greenhouse gas reductions, but some states are falling behind. Washington DC, USA: Environmental and Energy Study Institute. Available at: https://www.eesi.org/articles/view/u.s.-leads-in-greenhouse-gas-reductions-but-some-states-are-falling-behind (Accessed May 20, 2020).
Keywords: entertainment and hospitality, travel, economic growth and energy consumption, GHG and air pollutants, globalization, sustainable policy
Citation: Khan A, Bibi S, Li H, Fubing X, Jiang S and Hussain S (2023) Does the tourism and travel industry really matter to economic growth and environmental degradation in the US: A sustainable policy development approach. Front. Environ. Sci. 11:1147504. doi: 10.3389/fenvs.2023.1147504
Received: 18 January 2023; Accepted: 24 February 2023;
Published: 14 March 2023.
Edited by:
Sikandar Ali Qalati, Jiangsu University, ChinaCopyright © 2023 Khan, Bibi, Li, Fubing, Jiang and Hussain. This is an open-access article distributed under the terms of the Creative Commons Attribution License (CC BY). The use, distribution or reproduction in other forums is permitted, provided the original author(s) and the copyright owner(s) are credited and that the original publication in this journal is cited, in accordance with accepted academic practice. No use, distribution or reproduction is permitted which does not comply with these terms.
*Correspondence: Hanliang Li, bGloYW5sQHp1Y2MuZWR1LmNu; Shaoping Jiang, anNoYW9wQHphZnUuZWR1LmNu
†These authors share first authorship