 Junyou Liu
 Haifang Tang2
94% of researchers rate our articles as excellent or good
Learn more about the work of our research integrity team to safeguard the quality of each article we publish.
Find out more
ORIGINAL RESEARCH article
Front. Environ. Sci. , 09 May 2023
Sec. Atmosphere and Climate
Volume 11 - 2023 | https://doi.org/10.3389/fenvs.2023.1146801
This article is part of the Research Topic Impact of Climate Change on the Human Living Environment View all 24 articles
Under the background of global warming, the thermal comfort in summer in historical conservation areas in China has also been significantly negatively affected. How to optimize the spatial pattern of the street space of historical conservation areas to improve the thermal comfort in summer in these areas undoubtedly deserves the consideration of scholars. In this study, Taiping Street, a historical conservation area in Changsha, China was taken as an example. Combined with the actual conditions of Taiping Street, the models with different street interface densities, different sizes and positions of open space, and different D/H (the ratio between the width of a street and the height of its surrounding buildings) were built through ENVI-met. The measured meteorological data from 10:00 to 20:00 on July 12, 2022 in Changsha are used as the initial meteorological data for simulation. The effects of the difference in the above factors on the thermal comfort of street space of historical conservation areas were explored through simulation analysis and comparison of the thermal comfort in different models. In the study, it was found that the thermal comfort of street space in such a historical street space with narrow roads was significantly affected by architectural shadows. As a result, among the simulated models, the higher the street interface density in the street in the east-west direction is, the better the overall thermal comfort of the area is. The lower the street interface density of the street in the north-south direction is, the better the overall thermal comfort of the area is. by adding a small open space in the middle of the north-side of the building, the thermal comfort of the area can be improved. The higher the D/H ratio is, the better the thermal comfort of the model is. During the renewal of historical conservation areas, people should make full use of the architectural shadows in such historical blocks to improve the thermal comfort of the area. Besides, the commonly-used method of constructing ventilation corridors to improve the thermal comfort of the block did not have an obvious effect in this study and might not make obvious improvements in similar street spaces of historical conservation areas.
During the urbanization of China in the past, there existed an unignorable contradiction between urban development and the conservation of historic conservation areas; the preservation of these areas had been ignored to some extent amidst the rapid development of cities. New construction of buildings had been carried out inside and outside of the historic conservation areas. As a consequence, the internal texture and historical style of these areas had been negatively influenced. In recent years, China has paid increasing attention to the preservation and inheritance of history and culture. Preserving and activating historic conservation areas have become one of China’s primary focuses, but preservation does not mean fully preserving the current conditions as they are (Wan, 2017).
Climate change is one of the most important global environmental phenomena faced by mankind in this century (Seto and Shepherd, 2009). Global surface temperature has increased by 0.99°C since the beginning of the 21st century and by 1.09°C since 2011 compared to the 1960s to the end of the 20th century, and the global surface temperature increasing from year to year makes the human body increasingly uncomfortable (IPCC, 2021; Qiao et al., 2022). Meanwhile, outdoor comfort is of great importance for historic conservation areas that serve as important activity places for urban residents and tourists. A good outdoor microclimate can attract flow of personnel, increase the vitality of historic conservation areas, and perpetuate urban cultural connotations. In existing reconstruction of these areas, more emphasis is placed on the activating styles and functions of historic conservation areas than on the comfort of an outdoor microclimate. Therefore, it is necessary to carry out the micro-reform of historic conservation areas, aiming to continue the city’s vitality, by adapting and activating these areas to the needs of the times.
Most of the existing research has paid more attention to the impact of urban buildings, city underlying surface, greenery, interactions between buildings and trees and other factors on urban surface temperature. At a city or larger regional scale, much research has been conducted on how surface temperature can be influenced by retrieving surface temperature through remote sensing and analyzing some surface features, in particular, the differences between green space and building-related features. For example, research was conducted on the optimization of green space form by analyzing the correlation between green space landscape layout index and surface temperature (Fan et al., 2015; Masoudi and Tan, 2019; Gherraz et al., 2020). The influence of urban land coverage changes on surface temperature was also investigated (Ashwinian Sil, 2022; Hashim et al., 2022; Moisa et al., 2022). When studying the microclimate in small areas such as plazas, parks, and residential communities, some researchers conducted research based on the measured data and proposed suggestions for improving thermal comfort (Liu et al., 2020; Jiang et al., 2022). Some scholars have explored how to optimize urban spaces to improve urban thermal comfort at the micro-level by Urban canopy models, Urban energy balance models, combined advection-diffusion equations, and Navier-Stokes equations (Bruse and Fleer, 1998; Huttner, 2012; Wang et al., 2013; Wang et al., 2021). Ansys Fluent, ENVI-met, and other software developed based on computational fluid dynamics have been widely used in microclimate simulation at small and micro scales in urban settlements. The spatial layout, ground materials, vegetation coverage, water body, and other factors were considered to simulate the impact on the microclimate environment (temperature, humidity, wind direction, wind speed, radiant temperature, etc.). Based on relevant microclimate simulation research, many researchers have put forward targeted improvement strategies for spatial layout, vegetation coverage, water body, different impervious/permeable surfaces and interactions between buildings and trees in different microenvironments within a city to improve thermal comfort of microenvironments (Tsoka et al., 2018; Jänicke et al., 2021; Liu et al., 2021; Hu et al., 2022).
Many researchers have attached importance to improving the thermal comfort in historic buildings while protecting them (Stolow, 1994; Silva, and Henriques, 2014; Marcelli et al., 2020; Hu et al., 2022). However, few of them have focused on the thermal comfort of streets in historic conservation areas. At the same time, although they have highlighted the thermal comfort of old residential communities and explored the optimization of the microclimate of old urban areas by changing the spatial form of these communities during the process of urban renewal (Gaspari and Fabbri, 2017; Renard et al., 2019; Wang and Sun, 2020; Nardino et al., 2021), very few of them have focused their research on historic conservation areas. Historic conservation areas tend to have longer histories and stricter preservation requirements than ordinary old communities. Street spaces are the most important outdoor space in historic conservation areas. Great importance should be attached to researching the microclimate of the street space of these areas. This study on the microclimate in the street space of historic conservation areas focuses on spatial layouts of buildings and street spaces.
Changsha is an important central city in central China and the capital of Hunan Province, located at latitude 27°51′to 28°40′N and longitude 111°53′to 114°15′E. By the end of 2021, the total land area of Changsha was 11,815.96 square kilometers, of which the built-up area was 700 square kilometers. The population of Changsha has reached 10.2393 million (Changsha Bureau of Industry and Information Technology, 2022). Changsha has a typical climate characterized by hot summers and cold winters. Some researchers have conducted studies on how to optimize the spatial pattern of Changsha to reduce summer temperatures in the city (Li, et al., 2019; Xiong and Zhang, 2021; Tang et al., 2022; Xiang and Zheng, 2022; Chen et al., 2023). Changsha is one of the first 24 famous historic and cultural cities announced by the State Council of China, and Taiping Street is the only historic conservation area that has been preserved to date (Long, 2021). For this reason, Taiping Street is studied in this paper. The Taiping Street Area is situated in the Wuyi Business District, the center of the bustling Changsha City, and borders Wuyi Avenue to the north, Jiefang West Road to the south, Weiguo Street to the west, and Sanxing Street to the east.
A simplified study of the texture relationship of the Taiping Street Area revealed that it has an architectural layout of the plate layout. This means that the street interfaces along streets are short, forming many branch streets (Cui, 2020). The fishbone-shaped streets are composed of Taiping Street, Majia Lane, Fujia Lane, Jinxian Street, Xipailou Road, Taifuli Lane, and several other branch streets (Figure 1).
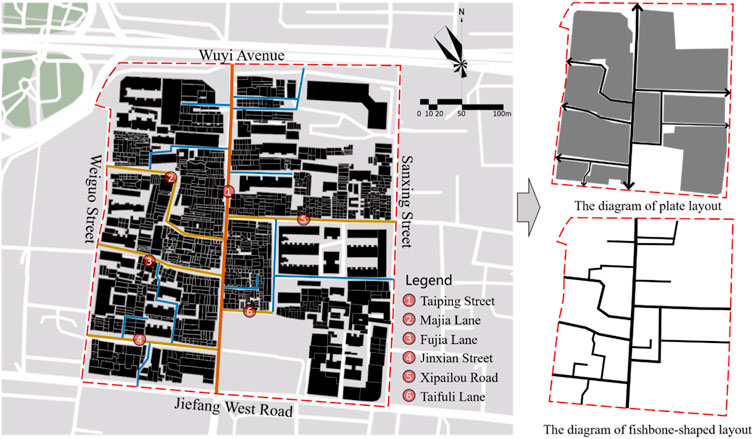
FIGURE 1. Taiping street area.
In view of the fact that Changsha’s summer has a very high temperature and lower number of tourists than the other three seasons, it was selected as the season for research in this paper, and the research indicator selected is the physiological equivalent temperature (PET), which can be used to estimate the human body’s feeling in summer.
PET is defined as the air temperature at which the core temperature and skin temperature of the human body reach equilibrium, in typical indoor conditions and under complex outdoor conditions that need to be evaluated. The higher the PET value, the hotter the weather. Indoor reference climates are made based on the following assumption: Mean Radiant Temperature equal air temperature, Air velocity(v) = 0.1, Water vapor pressure (VP) = 12 hPa。 It is an indicator of thermal comfort that describes body feelings and can be used to evaluate the thermal environment in a physiological sense. It is derived using the Munich Energy Balance Model for Individuals (MEMI) and takes into account the impact of various meteorological indicators, human activities, human clothing, and personal body parameters on environmental comfort (Höppe, 1999; Lee et al., 2016; Hang et al., 2021). The principle of the MEMI model is based on the human heat balance equation (Eq. 1), the equation for heat transfer from the core of the body to the skin (Eq. 2), and the equation for heat transfer from the skin surface to the clothing surface (Eq. 3). The combination of these three equations can be used to solve the three key indicators that determine human thermal sensation: clothing surface temperature, skin surface temperature, and core body temperature, and thus predict human thermal sensation (Höppe, 1999; Krüger and Drach, 2017; Ji et al., 2022).
In the equation,
In Eq. 2,
In Eq. 3,
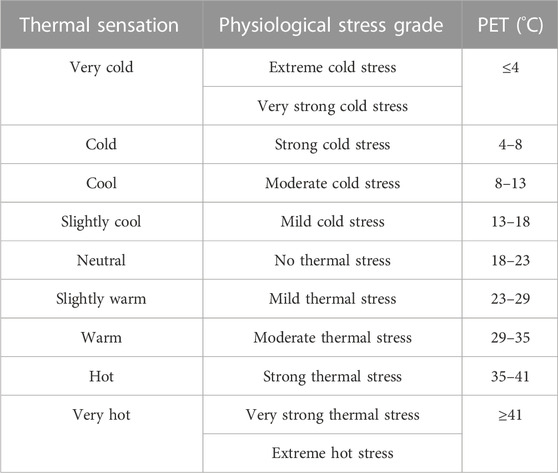
TABLE 1. Thermal sensation and physiological reaction corresponding to PET (Jendritzky et al., 1990; Matzarakis and Mayer, 1997; Matzarakis et al., 1999).
ENVI-met is a dynamic numerical simulation software designed by German scholars Bruse et al. in the 1990s based on hydrodynamics, thermodynamics, urban meteorology, and other related theories to reproduce the overall impact factors of the urban microclimate environment and is widely used for calculating outdoor microclimate research indicators (Yu and Hien, 2006; Li and Wang, 2016). The research time segment selected by researchers is from 10:00 to 20:00 on 12 July 2022. The initial conditions required for software simulation are derived from the China Meteorological Data Network (http://data.cma.cn), as listed in Table 2. Researchers input the hourly temperature and humidity as indicated in Table 2 as the original weather parameters for initial simulation per hour. With regard to the wind direction and speed, researchers chose the average wind direction and speed of the 11 h as the feature of the initial wind environment, of which the wind direction is 178° and the wind speed is 3.7 m/s. The prevailing wind direction of Changsha city in summer is south wind (Ministry of Housing and Rural-Urban Development of the People’s Republic of China, 2014), while the simulated wind direction is south wind which is in line with the actual summer prevailing wind. The wind direction is typical and can properly reflect the wind environment feature of Changsha city in summer.
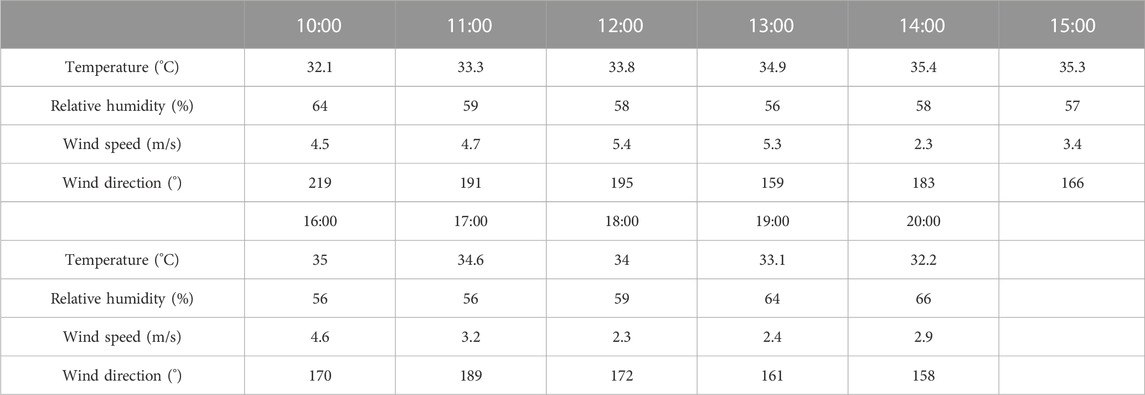
TABLE 2. Initial simulation conditions (Source: China Meteorological Data Network).
The measured meteorological data used as input in the modeling process came from the Changsha Station (No. 57687) of the China National Meteorological Science Data Center, and the data measured from 10:00 to 20:00 on 12 July 2022 were used for simulation. The temperature, humidity, and average wind direction and speed for 11 h (from 10:00 to 20:00 on July 12) were input as relevant meteorological parameters for the simulation. The researchers collected hourly data using a JT2020 multifunctional tester from Beijing JANTYTECH (BJJT) in an area of Taiping Street between 10:00 and 20:00 on 12 July 2022. The temperature and humidity sensor component of this instrument was used to measure the temperature and humidity of the environment on an hourly basis. The temperature range of the sensor is from −20°C to 125°C, with an accuracy of ±0.5°C, and the humidity range is from 0% to 100% RH, with an accuracy of ±3% RH. The researchers constructed an actual model based on the actual conditions in an area of Taiping Street and used meteorological data from the Changsha Station of the China National Meteorological Science Data Center for simulation. The number of grids in the Taiping Street model was 252 (length) × 213 (width) × 25 (height), with a length, width, and height of 2 m for each grid. The actual volume simulated by the model was 504 m (length) × 426 m (width) × 50 m (height). The researchers compared simulated values of temperature and humidity for each hour in the study area with measured values to analyze the errors in the simulation data.
The researchers mainly analyzed the simulated values for each time period between 10:00 am and 8:00 pm on 12 July 2022. The idealized model grid for the east-west street was 136 (length) × 86 (width) × 15 (height), with each grid measuring 2 m in length, width, and height. The actual volume of the east-west street idealized model simulated was 272 m (length) × 172 m (width) × 30 m (height). The idealized model grid for the north-south street was 91 (width) × 211 (length) × 15 (height), with each grid measuring 2 m in length, width, and height. The actual volume of the north-south street idealized model simulated was 181 m (width) × 422 m (length) × 30 m (height). Because there was sufficient distance between the buildings in the east-west and north-south street models and the model boundaries, the model did not produce negative effects on the entire simulation result due to the buildings being too close to the boundaries. In both models, the researchers did not add nested grids to the boundaries of the models.
When simulating using ENVI-met, the temperature and humidity distribution within the study area are simulated based on the combined advection-diffusion equation (Bruse and Fleer, 1998; Huttner, 2012)
where
In which
Wind speed and wind direction is caculated based on Navier-Stokes Equations 6–8 (Bruse and Fleer, 1998; Huttner, 2012).
In which f is Coriolis parameter,
In ENVI-met, the soil is treated as a vertical column, and its temperature and humidity are calculated using the following equation (Bruse and Fleer, 1998; Huttner, 2012):
In which T represents heat,
The turbulent fluxes of momentum, vapor, heat at the wall and ground surface are calculated based on the similarity law from Monin and Obhukov (Asaeda and Ca, 1993; Stull, 1994; Bruse and Fleer, 1998; Huttner, 2012):
Where
Temperature and humidity at surface and wall are calculated from (Deardorff, 1978; Stull, 1994):
Where
Researchers simulated the microclimate of various idealized models using ENVI-met and then calculated the PET values of each model using Bio-met in ENVI-met. The principle of PET calculation is explained in detail in Section 2.2, including formulas (1), formulas (2), formulas (3) and related text descriptions. The height at which PET is simulated is usually chosen to be the centroid height of a person whose height equals the average height. This better reflects the overall thermal comfort of the human body (Matzarakis et al., 1999). According to the average height of Chinese men and women, which is 171.8 cm and 159.7 cm, respectively, and the fact that the center of gravity of the human body is located at around 56% of the height (Chi and Dan, 2016; NCD Risk Factor Collaboration, 2016; Guo, 2017; Lu et al., 2022), the simulated height of PET in this study is 1 m. The human factors in the study include gender, age, height, weight, Total Metabolic Rate, and clothing parameters, which are male, 35 years old, 175 cm tall, 70 kg, 86.21 W/m2, and 0.9 clo, respectively.
The ENVI-met model includes a one-dimensional boundary model and a three-dimensional boundary model. The one dimensional model includes vertical profile of different meteorological parameters like temperature, humidity, wind speed and wind direction. In addition, the ENVI-met model also includes a three-dimensional co-model which consists atmosphere, soil and buildings. At its bottom, the 3-dimensional model links to a 3-dimensional soil model. The one-dimensional model generates one-dimensional profile for meteorological parameters. The boundary model extends to a height of 2,500 m (average height of the planetary boundary layer). With simple forcing, the values of one-dimensional model are coped to the border (Bruse, 2004; Huttner, 2012; ENVI-met, 2023).
The parameters used in studying the relationship between buildings and streets in this paper are primarily street interface density (length of buildings along the street/street length), the open space of the street, and D/H; the indicator system composed of these three parameters can better reflect the form characteristics of the street space in historic conservation areas. The street length, average street width, average building height, the length of buildings along the street, and the average length of building blocks were obtained through the extraction of the form elements of main streets in the Taiping Street Area. Then, the idealized model was extracted to study the microclimate environment characteristics of different street street interface densities, space layouts, and D/H values.
It was found through field observation that the flow of personnel is mainly gathered on the main street Taiping Street and secondary streets Majia Lane, Fujia Lane, Jinxian Street, Xipailou Road, and Taifuli Lane, with less flow of personnel on the branch streets. Researchers established different idealized scenario models according to the street characteristics summarized in the table below to explore how different street characteristics influence the street microclimate.
The main street Taiping Street measures 364 m in length, and since the majority of buildings on both sides of the street are not aligned horizontally, resulting in an uneven street width, has an average width of 12.4 m. The D/H value of the street ranges from 0.77 to 3.75, and the density of the street interface is 90% on the east of the street and 89.01% on the west. Secondary streets include Majia Lane, Fujia Lane, Jinxian Lane, Xipailou Road, and Taifuli Lane. These streets range in length from 57 m to 216 m, with an average value of 156.2 m; in width from 6 m to 11.6 m, with an average value of 7.86 m; in D/H values from 0.52 to 2.17; in density of the frontage interfaces of streets from 86.77% to 100%. In the Taiping Street Area, the main street runs from the north to south, while the secondary streets run predominantly from the east to west; the different street directions result in varying relationships between building shadows and streets, and different microclimate environments of streets. To comprehensively explore the microclimate environment of the street space, the main street in the north-south direction and the secondary streets in the east-west direction were studied separately in this paper. Based on the relevant conditions of Taiping Street in Mainland China as described in Table 3, researchers constructed idealized scenario models. After determining the street length, width, building length, width, and height in the idealized model based on the actual length, width, and characteristics of buildings along the streets of Taiping Street, researchers reserved enough space between the building and the model boundary to ensure that the simulation results were not negatively affected by the building model being too close to the model boundary. All north-south model sizes are set to 181 m (width) × 422 m (length) × 30 m (height). The buildings on both sides of Taiping Street are mostly three stories high (about 9 m). To better study the different effects of D/H values on the microclimate of the neighborhood, the building height in the scenario model is uniformly set to 9 m. The distance between the buildings on both sides of Taiping Street is about 12 m. The width of all scenario models is set to 12 m. The density of the street interface in the current Taiping Street area is between 86.77% and 100%. Researchers first set the density of the street interface as a single variable and created four scenario models with densities of 85%, 90%, 95%, and 100%, respectively. Researchers attempted to explore the impact of increasing the open space area within different areas of the historic district by demolishing some buildings on the thermal comfort of the neighborhood. They created three groups of models: increasing the open space area at both ends of the street, increasing the open space area in the middle of the street, and increasing the open space area in both the middle and ends of the street. Using 9-m-tall buildings, 12-m-wide streets, and a streetstreet interface density of 85% as the microclimate baseline conditions, the microclimate environment characteristics of open spaces under different conditions were studied. According to Table 3, the D/H values in the Taiping neighborhood range from 0.52 to 3.75. Researchers have attempted to explore the differences in street thermal comfort under different street aspect ratios. Using 12-m-wide street and a street interface density of 85% as the baseline conditions, the microclimate environment characteristics when D/H was 0.5, 1.0, 1.5, 2.0, and 3.0, as well as when there is a combination of multiple D/H values were studied. Figure 2 shows the diagrams of the models.
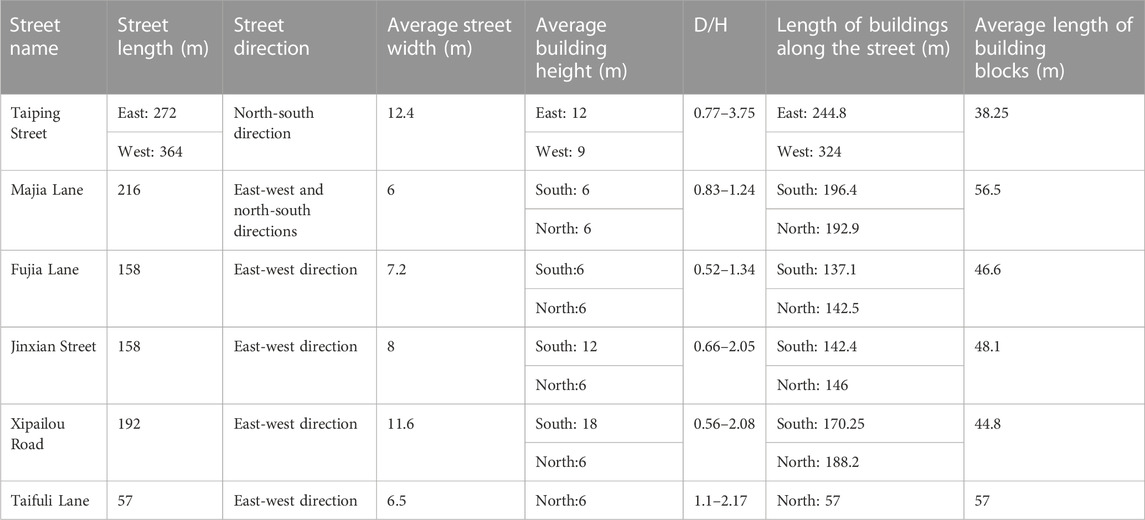
TABLE 3. Form element extraction results of streets in the Taiping Street Area.
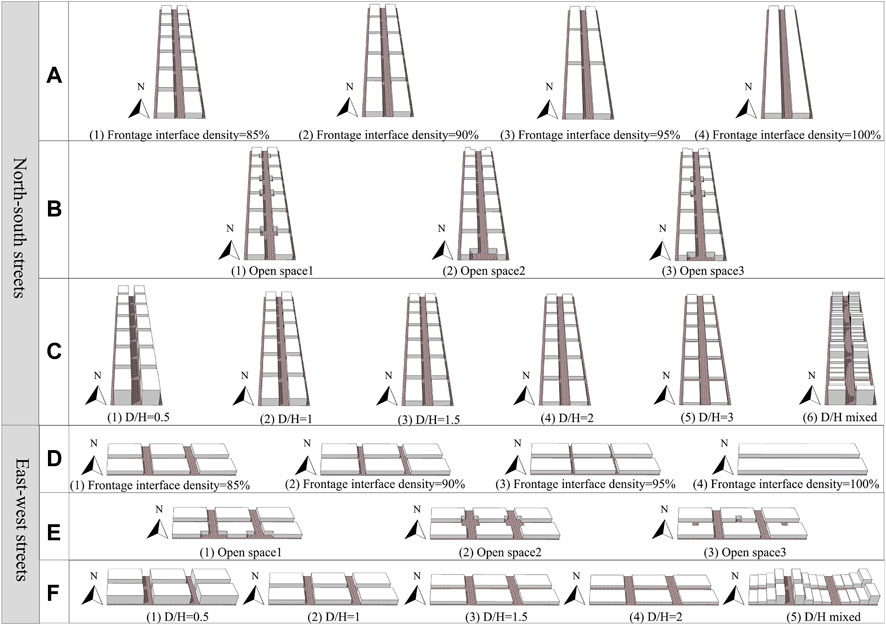
FIGURE 2. A diagram of the models. (A) North-south streets with different street interface densities, (B) North-south streets with different open spaces, (C) North-south streets with different building heights, (D) East-west streets with different street interface densities, (E) East-west streets with different open spaces and (F) East-west streets with different building heights.
Based on the conditions of the Taiping neighborhood and the five east-west streets within, as described in Table 3, and ensuring sufficient distance between the building and model boundaries, all east-west models were set to a size of 272 m (length) x 172 m (width) x 30 m (height). Since there are many 6-m-tall buildings in the east-west streets, the idealized scenario model had a uniform building height of 6 m. The east-west street width is mostly around 7 m, so the street width was uniformly set to 7 m. According to the density of the street interface in the Taiping neighborhood, which ranges from 86.77% to 100%, scenario models were created with street interface densities of 85%, 90%, 95%, and 100%, respectively. Then, using 6-m-tall buildings, 7-m-wide streets, and a street interface density of 85% as the microclimate baseline conditions, different scenario models were constructed by increasing the open space area in different areas of the street (Figure 2), and the differences in thermal comfort among different scenario models were compared. As shown in Table 3, the D/H values for the east-west streets in the study area range from 0.52 to 2.17. The researchers tried to explore the impact of different D/H on the thermal comfort. Using 7-m-wide street and a street interface density of 85% as the baseline conditions, the microclimate environment characteristics when D/H was 0.5, 1.0, 1.5, and 2.0, as well as when there is a combination of multiple D/H values were studied. Figure 2 shows the diagrams of the models.
The measured temperature and humidity values and their corresponding simulated temperature and humidity values at a fixed observation point in the study area between 10:00 and 20:00 on July 12, 2022 are as shown in Table 4 below. By analyzing the measured and simulated temperature and humidity data at a fixed location on Taiping Street during the hours of 10:00–20:00 on 12 July 2022, researchers found that the coefficient of determination (R2) between the two sets of data was 0.91, the root mean square error (RMSE) was 1.68, and the index of agreement (d) was 0.75 for temperature, while the R2 was 0.92, the RMSE was 3.2, and the d was 0.86 for humidity. Typically, an R2 greater than 0.5 is considered reasonable (Santhi et al., 2001; Balany et al., 2022). The RMSE values for air temperature and relative humidity are within the range reported in many related studies (RMSE of relative humidity ranging from 2.04% to 11.12% and air temperature ranging from 0.52°C to 4.30 °C) (Tsoka et al., 2018). The closer the index of agreement is to 1, the higher the consistency between the simulated and measured values. The d values for temperature and humidity are both greater than or equal to 0.75, indicating a high level of consistency between the simulated and measured values. Therefore, the range of simulation errors in this study is reasonable.
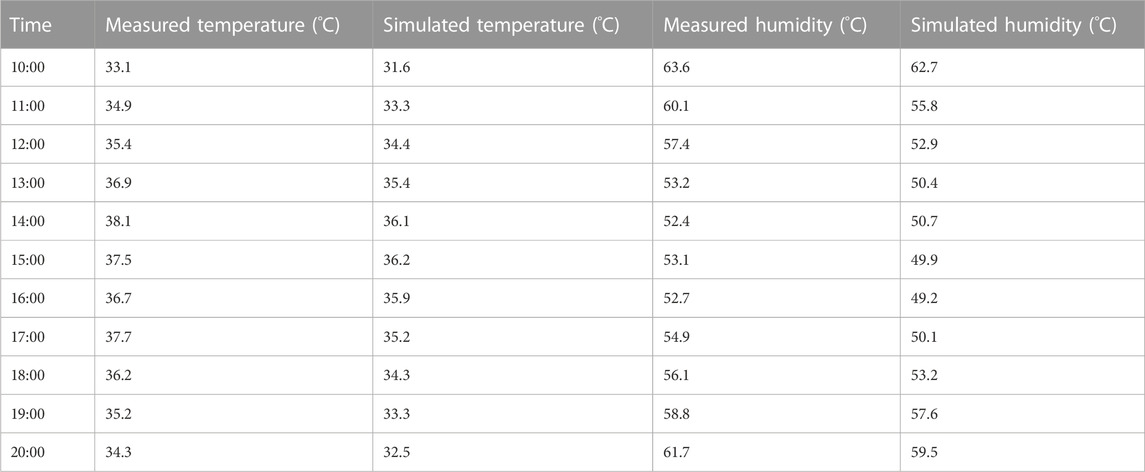
TABLE 4. Temperature and humidity values were measured and simulated at various time points between 10:00 am and 8:00 pm on 12 July 2022.
The model with a street interface density of 85% has seven rows of buildings on both sides of the street separated by a 7.5-m-wide street, with each row measuring 36.4 m in length. The model with a street interface density of 90% has five rows of buildings on both sides of the street separated by a 7.5-m-wide street, with each row measuring 54 m in length. The model with a street interface density of 95% has three rows of buildings on both sides of the street separated by a 7.5-m-wide street, with each row measuring 95 m in length. The model with a street interface density of 100% is full of buildings that are not separated by any street on both sides of the street. The schematic diagrams of the four models are shown in the row A of Figure 2.
By conducting a variance analysis (two-way ANOVA without replication) of the PET values in the study area under different street interface densities and time conditions based on the simulation results of the north-south street model shown in Figure 3, it was found that the p-values for the significant difference tests between each group of data when time and street interface densities were used as sources of variation were both less than 0.01. This indicates that significant differences in PET values within the study area under different street interface densities and the same time are unlikely to be caused by sampling errors.
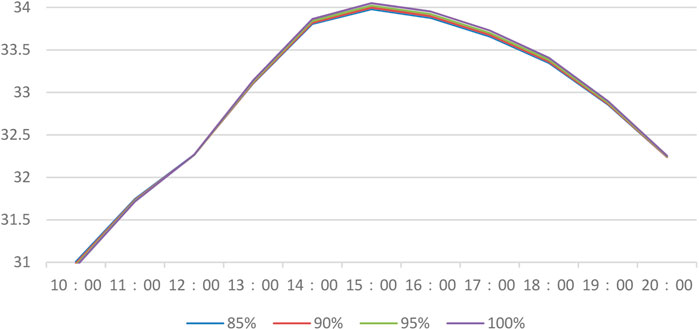
FIGURE 3. Temporal variation of PET at a height of 1.0 m in the street under different street interface densities.
Figure 3 shows the average PET values within the study area for each scenario model at each hour between 10:00 and 20:00. Figure 8 shows the simulation results of each model at 14:00. A comparison and analysis of the average PET values of the 12-m-wide north-south streets between 10:00 and 20:00 under different street interface densities (Figure 3) show that a higher value indicates a poor microclimate and vice versa. When only the density of the street interface is changed, the microclimate environment characteristics do not change significantly; the difference between the average PET values under the street interface densities of 85% and 100% is less than 0.1. In terms of thermal sensation, the PET values of these streets are within the range of “warm”. From 10:00 to 11:00, the PET value reaches its minimum when the street interface density is 100%, and the lower the street interface density, the higher the PET value. At 12:00, the PET value is minimum when the street interface density is 90%. From 13:00 to 20:00, the PET value reaches its minimum when the street interface density is 85%, and the higher the street interface density, the higher the PET value.
The PET simulation results of the four models (Figure 4) at 14:00 were analyzed. Changsha is located north of the Tropic of Cancer, and the position of building shadows relative to buildings changes constantly throughout the day, following a general pattern of moving from the west side of the buildings to the north side of the buildings and then to the east side of the buildings. At noon, shadows always face due north (CGZDL, 2022). In Figure 4, different colors represent different ranges of PET values. As the street interface density value decreases in the four models, the number of narrow east-west streets between buildings increases. The buildings on the north and south sides of these narrow streets can shade the sunlight and create shaded areas. In the models with higher street interface densities, the area of streets with better thermal comfort in the narrow historic blocks is larger. In addition, narrow streets between buildings can also facilitate the formation of ventilation corridors for ventilation and heat dissipation (Peng, 2016).
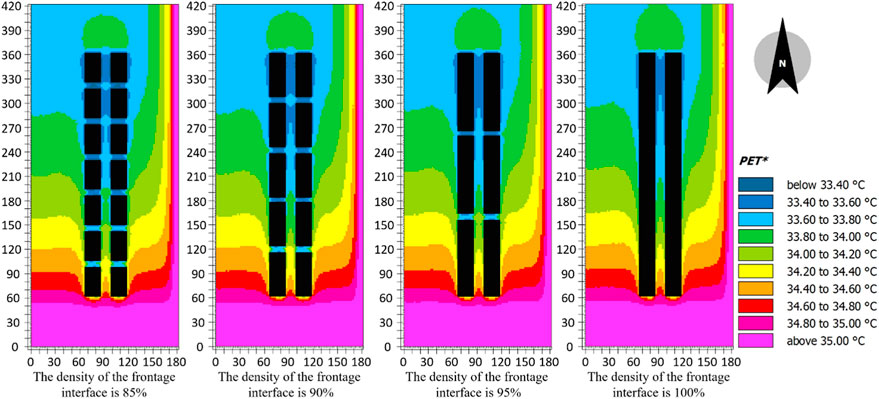
FIGURE 4. PETs at a height of 1.0 m at 14:00.
The model with a street interface density of 85% has three rows of buildings on both sides of the street separated by a 11.25-m-wide street, with each row measuring 42.5 m in length. The model with a street interface density of 90% has three rows of buildings on both sides of the street separated by a 7.5-m-wide street, with each row measuring 45 m in length. The model with a street interface density of 95% has three rows of buildings on both sides of the street separated by a 3.75-m-wide street, with each row measuring 47.5 m in length. The model with a street interface density of 100% is full of buildings that are not separated by any street on both sides of the street. The schematic diagrams of the four models are shown in the first row of Figure 2.
By conducting a variance analysis (two-way ANOVA without replication) of the PET values in the study area under different street interface densities and time conditions based on the simulation results of the east-west street model shown in Figure 5, it was found that the p-values for the significant difference tests between each group of data when time and street interface densities were used as sources of variation were both less than 0.01. This indicates that significant differences in PET values within the study area under different street interface densities and the same time are unlikely to be caused by sampling errors.
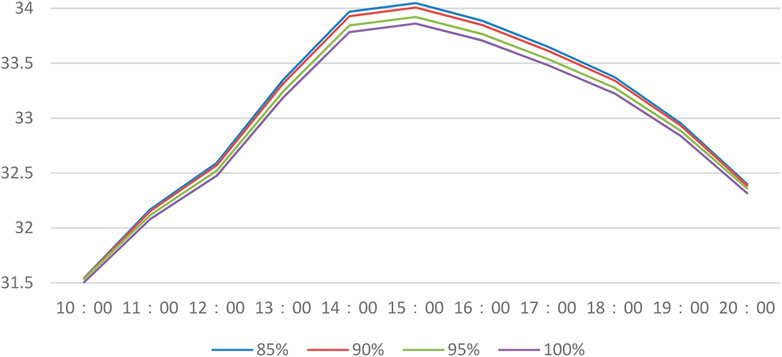
FIGURE 5. Temporal variation of PET at a height of 1.0 m in the streets under different street interface densities.
A comparison and analysis of the average PET values of the 12-m-wide east-west streets between 10:00 and 20:00 under different street interface densities (Figure 5) show that the PET values of these streets are within the range of “warm” in terms of thermal sensation. The PET value reaches its maximum when the street interface density is 85%, and the higher the street interface density, the lower the PET value; the gap is the most obvious between 14:00 and 16:00.
From Figure 6, it can be seen that at 14:00, the temperature at the north-south streets between buildings is higher in the model with a street interface density of 85%. The main reason is that there are no buildings on the north and south sides of these streets to shade the sunlight and create shaded areas. The prevailing wind direction in Changsha in the summer is from the south. Even if the north-south streets form ventilation corridors, the lack of building shading makes the wind passage area less thermally comfortable. At 14:00, the building shadows are located northeast of the buildings, and the width of the north-south streets in the model with a street interface density of 95% is narrower than those in the models with street interface densities of 85% and 90%. The shaded areas created by the buildings on the east and west sides of the street under the sunlight have also contributed to the improved thermal comfort of the north-south streets. Overall, in the four models, the PET value reaches its minimum when the street interface density is 100%.
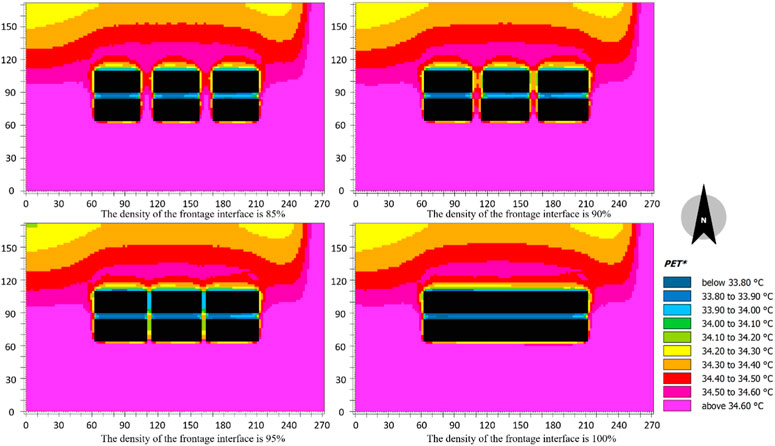
FIGURE 6. PETs at a height of 1.0 m at 14:00.
The simulated wind direction selected is south wind, with the wind speed of 3.7 m/s. The north-south streets form ventilation corridors, which helps increase the thermal comfort of the study area. However, the thermal comfort of the north-south street in the picture is poor. On the contrary, affected by the building shadow, the east-west street is generally better in thermal comfort. This also shows that, in the idealized models, building shadow is more effective in improving microclimate.
Taking into account the information presented in Figures 2–6, it is suggested that in cities located north of the Tropic of Cancer, such as Changsha, China, in historic districts with shorter buildings and narrower streets, it would be advantageous to demolish some buildings on both sides of the north-south streets to create narrower east-west streets. This would help to create street areas with relatively better thermal comfort. This is mainly due to the fact that during the hot morning, noon, and afternoon periods of the day, shadows cast by buildings form on the east-west streets, which provide better thermal comfort in shaded areas. In contrast, considering that the dominant wind direction in Changsha during the summer is southerly, if some buildings are demolished on the north and south sides of the east-west streets, even if it creates a ventilation corridor, there will be no buildings on the north and south sides of the north-south streets to provide shade, making the north-south streets hotter in the historic district.
Researchers explored how to increase open space to improve thermal comfort in historic districts. Three open space models were developed based on the model with a street interface density of 85% in Figure 2 by demolishing some buildings and increasing the open space area. The three models are shown in the row B of Figure 2 as open space 1, 2, and 3. The open space studied by the researchers is located in an area with one north-south street and six east-west streets. The total area of open space increased by demolishing buildings is the same in all three models. In open space model 1, no open space was added at the ends of the north-south street, and open space was only increased by demolishing some buildings where the east-west and north-south streets intersect. In open space model 2, some buildings were demolished and larger open spaces were added only at the ends of the street. No open space was added where the east-west and north-south streets intersect. In open space model 3, buildings were demolished and open space was added at the ends of the streets and at some intersections of the north-south and east-west streets. The open space area added at the intersection of the six east-west streets and one north-south street in model 3 was smaller than that in model 1. The open space area added at the ends of the north-south street in model 3 was smaller than that in model 2. Model 2 did not increase the open space area at the intersection of the east-west and north-south streets.
By conducting a variance analysis (two-way ANOVA without replication) of the PET values in the study area under different open spaces and time conditions based on the simulation results of the north-south street model shown in Figure 7, it was found that the p-values for the significant difference tests between each group of data when time and street interface densities were used as sources of variation were both less than 0.01. This indicates that significant differences in PET values within the study area under different street interface densities and the same time are unlikely to be caused by sampling errors.
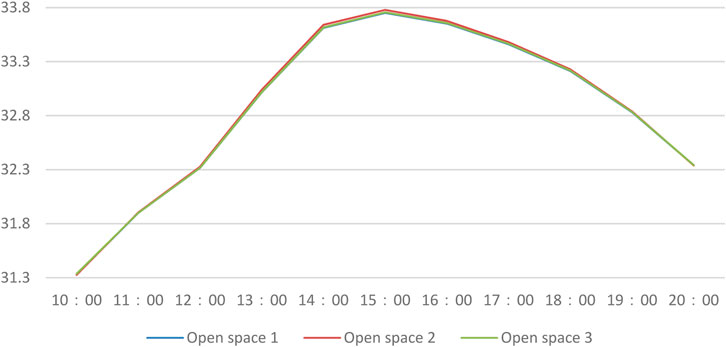
FIGURE 7. Temporal variation of PET at a height of 1.0 m in the streets in the case of different open spaces.
Figure 7 shows the mean PET (physiological equivalent temperature) values in the study area for each scenario model at each hour between 10:00 and 20:00. A comparison and analysis of the average values of PET from 10:00 to 20:00 in the one north-south street and six east-west streets of three different open space models (Figure 7) found that, among the three open space models, open space model 2 has the best thermal comfort (lowest PET values) for 10:00 and 20:00. Open space model 1 has the best thermal comfort for all other time periods. However, open space model 3 has the worst thermal comfort (highest PET values) for all time periods except for 10:00 and 20:00. Overall, model 1 has the best thermal comfort (lowest PET values), while model 3 has the worst. This suggests that removing smaller buildings with a smaller footprint and adding open space is the most effective way to improve thermal comfort at street intersections. However, removing larger buildings and adding open space at the ends of streets has the worst effect on thermal comfort.
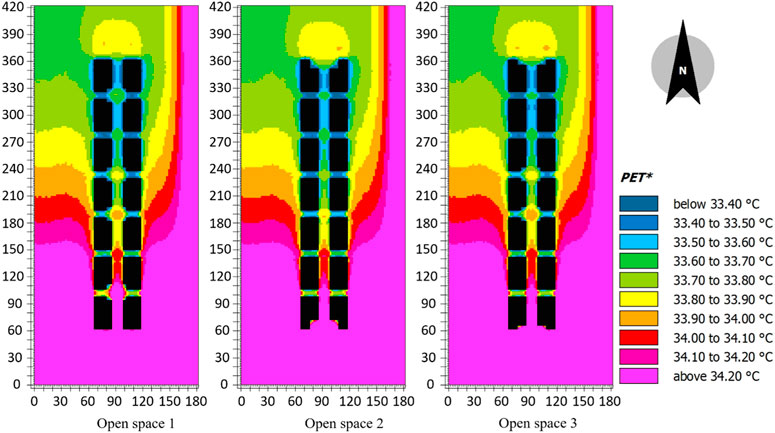
FIGURE 8. PETs at a height of 1.0 m at 14:00.
The simulation time is 14:00 and when the building shadow is located in the northeast direction, the open space added to the south of the street becomes an area with poor thermal comfort because it is not covered by the shadow. Removing smaller buildings with a smaller footprint and adding open space to historic streets can create more areas covered by building shadows during the day, resulting in better thermal comfort in these areas. This explains why model 1 has the lowest PET values and model 2 has the highest PET values at 14:00 in Figure 7.
Based on the east-west street model with a street interface density of 85% in Figure 2, researchers constructed three models with different scenarios of demolishing parts of buildings and adding open space to explore which one has the best thermal comfort. Open space model 1 involves removing parts of the buildings on one side of the street away from the historic district and adding open space. Open space model 2 involves demolishing parts of buildings at the intersection of north-south and east-west streets and adding open space. Open space model 3 involves removing parts of the buildings in the middle of the side of the buildings close to the historic street and adding open space.
By conducting a variance analysis (two-way ANOVA without replication) of the PET values in the study area under different open spaces and time conditions based on the simulation results of the east-west street model shown in Figure 9, it was found that the p-values for the significant difference tests between each group of data when time and street interface densities were used as sources of variation were both less than 0.01. This indicates that significant differences in PET values within the study area under different street interface densities and the same time are unlikely to be caused by sampling errors.
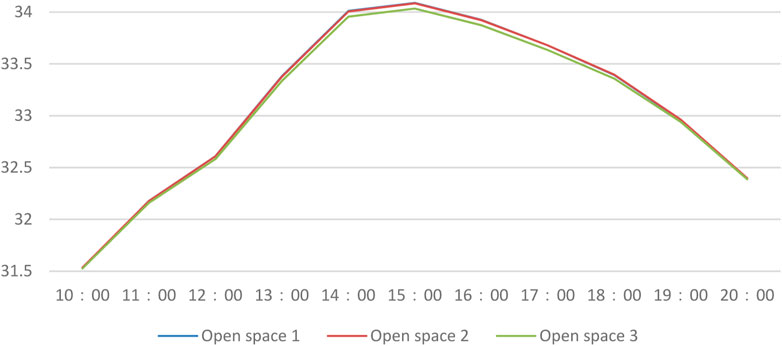
FIGURE 9. Temporal variation of PET at a height of 1.0 m in the streets in the case of different open spaces.
According to Figure 9 and the corresponding PET values of each model at each whole hour, it can be seen that between 10:00 and 20:00, open space model 3 has the lowest PET values and the best thermal comfort among the three models. From 10:00 to 11:00 and from 17:00 to 20:00, model 1 has the highest PET values and the worst thermal comfort. Between 11:00 and 17:00, model 2 has the highest PET values and the worst thermal comfort.
Researchers comprehensively considered the PET values of each model in each period in Figure 9 and the simulation results of each model at 14:00 in Figure 10. In Model 3, additional open space was added in the middle area between the buildings on both sides of the historic street. Due to the rotation of the Sun, the direction of the movement of the building shadows in Changsha City north of the Tropic of Cancer is from the west side of the buildings to the north side of the buildings and then to the east side of the buildings, from sunrise to sunset. In Scenario Model 3, the newly added open space is surrounded by buildings on three sides, and the open spaces are easily covered by the building shadows when they are in different orientations. In Model 1, the newly added open space is on the south side of the building. When the building shadows are on the north side of the building, the open space is more affected by the sunlight and becomes a relatively hotter area. In Model 2, some buildings were demolished at the intersection of the east-west and north-south streets to form open space. In some periods of the morning, afternoon, and evening, especially when the building shadows are on the west or east side of the building, the overall thermal comfort of Model 2 is inferior to that of Model 3.
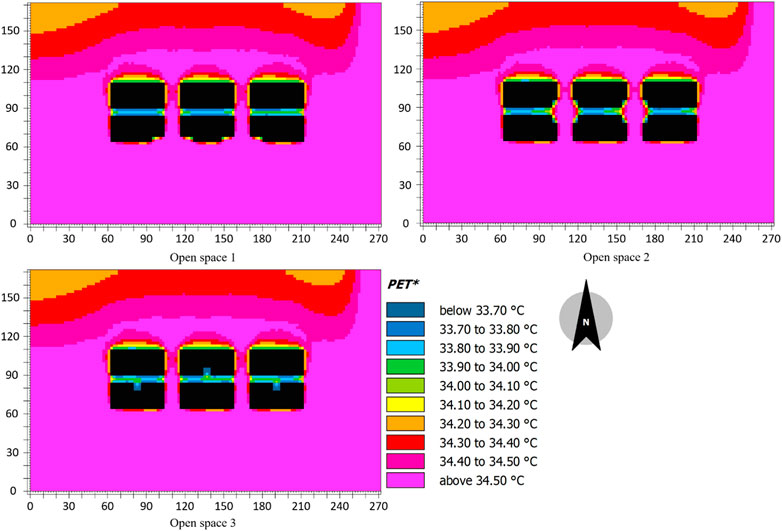
FIGURE 10. PETs at a height of 1.0 m at 14:00.
The building heights and street widths adopted in the study above are typical sizes of real historic conservation areas. Through previous research in which the density of the street interface of the building or the microclimate environment characteristics of the open-space street were changed, instead of the building height and street width, it was found that the microclimate improving effect of this micro-renovation under these microclimate conditions is not obvious. To find a more effective strategy to improve microclimate, in this paper, the building height or the street D/H was changed without changing the street width in this paper to study the microclimate environment characteristics under different D/H values without changing the street width.
By conducting a variance analysis (two-way ANOVA without replication) of the PET values in the study area under different D/H and time conditions based on the simulation results of the north-south street model shown in Figure 11, it was found that the p-values for the significant difference tests between each group of data when time and street interface densities were used as sources of variation were both less than 0.01. This indicates that significant differences in PET values within the study area under different street interface densities and the same time are unlikely to be caused by sampling errors.
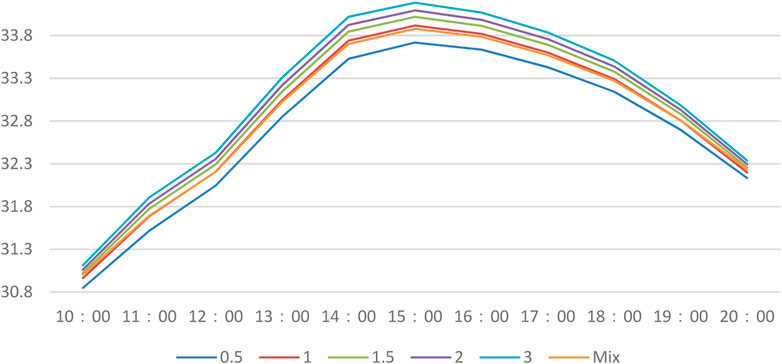
FIGURE 11. Temporal variation of PET at a height of 1.0 m in streets with different D/H values.
The north-south streets in all six models are 12 m wide, but have different building heights. The building height is 24 m for the D/H = 0.5 model, 12 m for the D/H = 1 model, 8 m for the D/H = 1.5 model, 6 m for the D/H = 2 model, and 4 m for the D/H = 3 model, and has a combination of heights in a D/H mix model, which has five combinations of D/H values in each row of buildings from the south to the north; the D/H of the first row of buildings from the south is 0.5, 1, 1.5, 2, and 3, and that of the second row of buildings is 3, 2, 1.5, 1, and 0.5, and so on. When building height is the only variable, it can better explore the impact of building shadows on the microclimate of the block while excluding the influence of the different layouts of building space on winding paths.
A comparison and analysis of the average values of PET of the streets with a width of 12 m at the central section of the street from 10:00 to 20:00 under six different D/H values (Figure 11) reveal that the order of the microclimate environment quality of north-south streets from 10:00 to 11:00 is D/H = 0.5 > D/H = 1 > D/H = mix > D/H = 1.5 > D/H = 2 > D/H = 3; that from 12:00 to 19:00 is D/H = 0.5 > D/H mix > D/H = 1 > D/H = 1.5 > D/H = 2 > D/H = 3; that at 20:00 is D/H = 0.5 > D/H = 1 > D/H = mix > D/H = 1.5 > D/H = 2 > D/H = 3.
Considering the information in Figures 11, 12, overall, the PET value is lowest and the thermal comfort is best when D/H = 0.5. In all models, the width of the north-south street is the same, and in this model, the building height is the highest, the area covered by building shadows is the largest, and the thermal comfort in the area covered by building shadows is the best. When D/H = 3, the PET value is highest, and the thermal comfort in the research area is the worst. In this model, the building height is the shortest, the area covered by building shadows is the smallest, and the research area is most affected by sunlight, resulting in the worst thermal comfort.
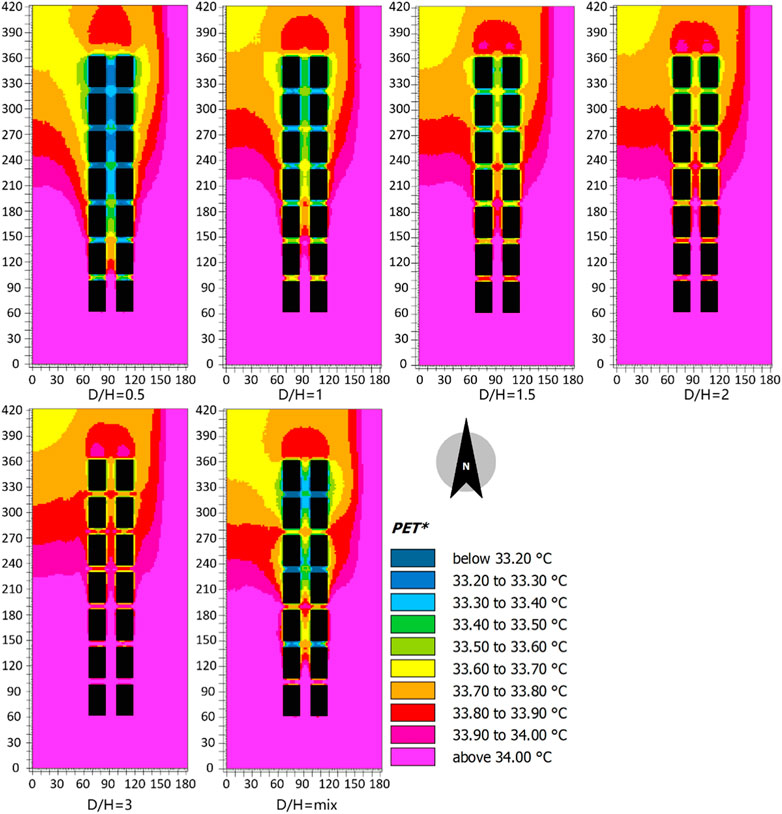
FIGURE 12. PETs at a height of 1.0 m at 14:00.
The east-west streets in all five models are 7 m wide, with different building heights. The building height is 14 m for the D/H = 0.5 model, 7 m for the D/H = 1 model, 4.5 m for the D/H = 1.5 model, and 3.5 m for the D/H = 2 model, and has a combination of heights in a D/H mix model. In the D/H mix model, which has four combinations of D/H values in each row of buildings from the east to the west; the D/H of the first row of buildings from the west is 2, 1.5, 1, and 0.5, that of the second row of buildings is 0.5, 1, 1.5, and 2, and that of the third row of buildings is 2, 1.5, 1, and 0.5.
By conducting a variance analysis (two-way ANOVA without replication) of the PET values in the study area under different D/H and time conditions based on the simulation results of the east-west street model shown in Figure 13, it was found that the p-values for the significant difference tests between each group of data when time and street interface densities were used as sources of variation were both less than 0.01. This indicates that significant differences in PET values within the study area under different street interface densities and the same time are unlikely to be caused by sampling errors.

FIGURE 13. Temporal variation of PET at a height of 1.0 m of streets with different D/H values.
A comparison and analysis of the average values of PET of the streets with a width of 7 m at the central section of the street from 10:00 to 20:00 under five different D/H values (Figure 13) reveal that the order of the microclimate environment quality of east-west streets is D/H = 0.5 > D/H = 1 > D/H = mix > D/H = 1.5 > D/H = 2.
It was found by comparing the PETs of the model in Figure 14 that the microclimate change rule of the east-west streets with different D/H values is similar to that of the north-south streets. This means that the larger the D/H, the worse the microclimate environment. Due to the diversity of building height in the D/H mix model, the comfort of the microclimate environment is moderate, which is related to the area and degree of buildings on both sides of the streets to avoid direct sunlight on the streets.
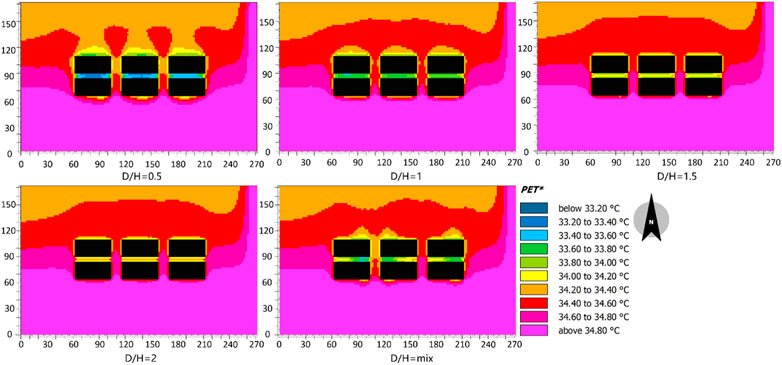
FIGURE 14. PETs at a height of 1.0 m at 14:00.
According to the simulation result in Part 3.4 and the features of the historical block with lower architectures and narrower streets, architectural shadows have obvious effect on improving the thermal comfort in the historical block. On the contrary, airway increment has unobvious effect on improving the thermal comfort of the historical block. In overall consideration of the fact that Changsha city is geologically located to the north of the Tropic of Cancer and the directions of the architectural shadows relative to the architectures in different time periods around a year, particularly during the relatively hot months in spring, summer and autumn, the researchers first proposed suggestions on how to reach the purpose of optimizing the microclimate in the historical block by changing the street interface density of east-west streets and north-south streets. Figure 15 is a schematic diagram of controlling street interface density. What Picture 15-a shows is the scenario model of a historical block where all the architectures are 9 m high, the main north-south street is 10 m wide, other north-south streets are 4 m wide and the east-west streets are 4 m wide. It is preferred to build new architectures on both ends of north-south streets, so that the architectural shadows may be fully used to cover the Sun from the north-south streets, especially at noon or around when the temperature is the highest in a day. Picture 15-b is the scenario model after architectures are added on both ends of north-south streets on the basis of Picture 15-a. If the said deduction is right, Picture 15-b will perform better than Picture 15-a in the general thermal comfort simulation under the weather parameters condition of July 12. The result is in line with the deduction after relevant simulations are finished and compared, with the process and relevant data neglected hereby. The east-west streets in the historical block are narrower in width and are obviously impacted by architectural shadows in a whole day. For reconstructing the historical block, city planners may consider to add new east-west streets to increase zones with good thermal comfort in a whole day, especially at noon and around, under the influence of architectural shadows, so as to reach the purpose of optimizing the entire by improving the part. Picture 15-c is the model after a east-west street as an open space is added on the basis of the historical block model shown in Picture 15-b. After simulating the average PET from 10:00 to 20:00 in the research areas in two different scenarios and making comparison, it was found that the result of simulation is in line with the said deduction.
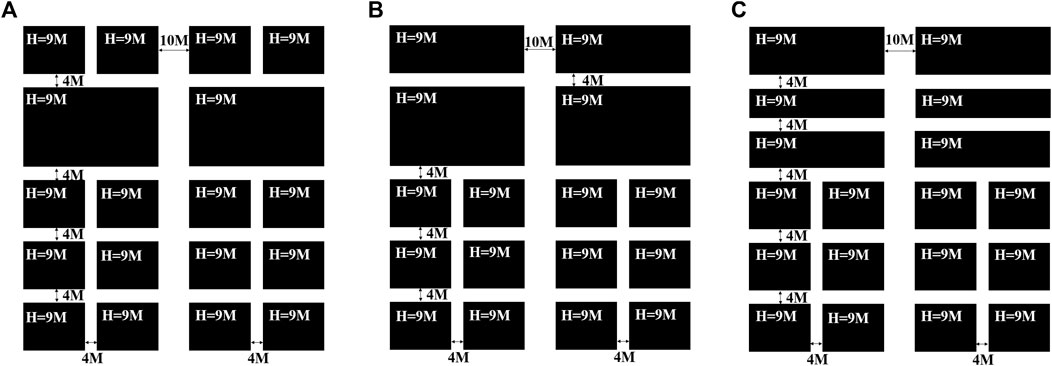
FIGURE 15. Schematic diagram of controlling street interface density. (A) The model before the transformation, (B) Increase the street interface density of east-west streets, (C) Decrease the street interface density of north-south streets.
When reconstructing the historical block, planners sometimes need increase the open space to relieve the jam problem of the historical block in some time segments due to relative high visitors flow. Considering the historical block features narrower architectures and streets and to meet the need of expanding the open space at the intersections between east-west streets and north-south streets, it is preferred to dismantle part of the architectures at many intersections to increase many open spaces with relatively small area, rather than dismantle part of the architectures at few intersections to increase few open spaces with relatively large area. It is mainly because increasing more relatively small open spaces is beneficial for increasing small open spaces in more areas which enjoy better thermal comfort in different time segments on the condition of reducing overall negative impact on the intersections. For the architecture height and road width vary in different historical blocks, this finding may not necessarily apply to any situation, but undoubtedly guide planners to give priority to relatively small rather than big open spaces. In consideration of the direction of the architectural shadows relative to the architectures in the daytime, setting more relatively small open spaces in the middle of the north-side of the architectures can make full use of architectural shadows in different time segments around the day and thereby create an area with good thermal comfort. Figure 16 is a schematic diagram for the demolition of corner buildings. As shown in Picture 16, the architectures are 9 m high, the main north-south streets in the middle is 10 m wide, other north-south street are 4 m wide and the east-west streets are 4 m wide (The street width does not include the length or width of the increased open space). Pictures 16-a, 16-b and 16-c separately refer to adding fewer and larger open spaces, adding more and smaller open spaces and adding more and smaller open spaces in the middle of the north-side of the architectures. After the PET simulation and analysis and comparison of average PET in the research areas of all time segments based on the weather parameters of Changsha city from 10:00 to 20:00 on 12 July 2022, it was found that the overall thermal comfort of 16-c is better than 16-b and 16-a. The simulation result can strongly support the said finding.
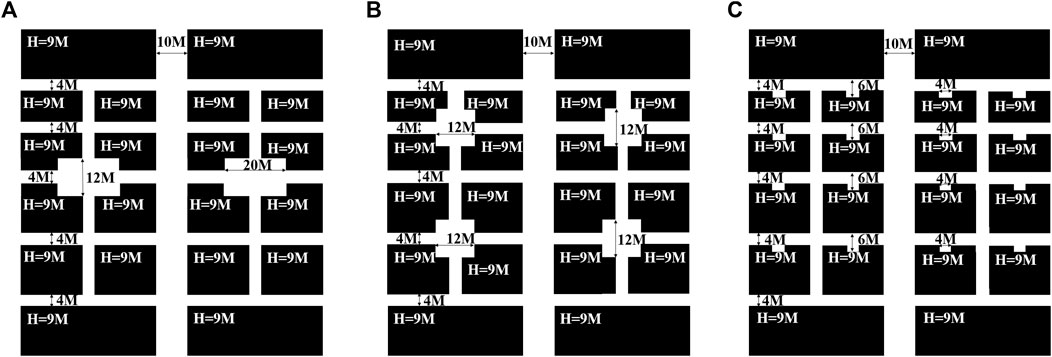
FIGURE 16. Schematic diagram for the demolition of corner buildings. (A) Demolish fewer buildings with larger floor space at intersections, (B) Demolish more buildings with smaller floor space at intersections. (C) Demolish more buildings with smaller floor space in the middle of the north-side of the buildings.
From the perspective of architectural shadows, the higher the architectures are, the larger the architectural shadows are in most time segments of a day. When the historical block is located to the north of the Tropic of Cancer, the architectural shadows are at some position on the northwest, due west or southwest of their corresponding architectures at the sunrise time; from then on, the architectural shadows generally move to the northeast relative to their positions then, until they reach on the due north of their architectures at 12:00. After 12:00, the architectural shadows generally move to southeast relative to their positions at 12:00, until the Sun sets.
Figure 17 is a schematic diagram for the optimising of building heights. In overall consideration of the position changing situation of the architectural shadows relative to their architectures in the areas to the north of the Tropic Cancer in a whole day, increasing either the architectural height on both sides of east-west streets or that on both sides of north-south streets will increase the area of architectural shadows in some time segments of a day, so as to increase the area of the zones with good thermal comfort and further optimize the thermal comfort of the historical block. Picture 17-a is the base-case scenario where the architectural height is as indicated on the picture, the main north-south streets in the middle is 10 m wide, other north-south streets are 4 m wide and the east-west streets are 4 m wide. Picture 17-b is the model after the height of some architectures on both sides of north-south streets are changed on the basis of the base-case scenario. Picture 17-c only changes the height of some architectures on both sides east-west streets. According to the simulation as per the weather parameters from 10:00 to 20:00 on 12 July 2022, the general thermal comfort of 17-b and 17-c is superior than 17-a. The general thermal comfort can be effectively improved by increasing the architectural height in this scenario model of the historical block.
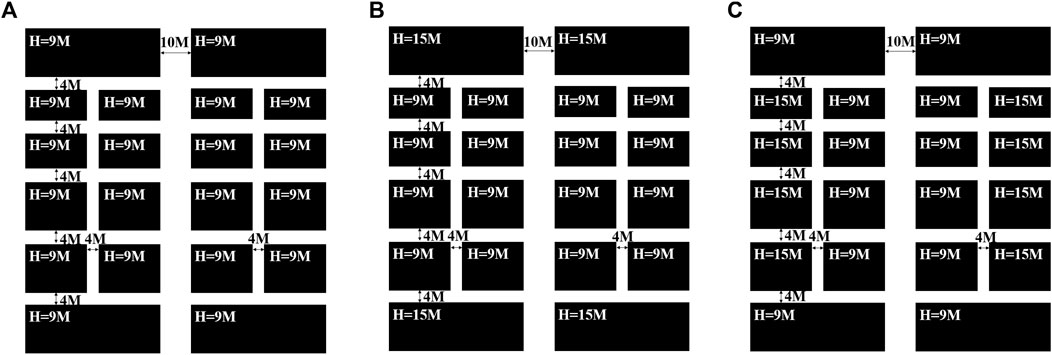
FIGURE 17. Schematic diagram of the building heights. (A) All buildings are 9 m high (B) Some buildings on the north and south sides are 15 m high and the rest is 9 m high, (C) Some buildings on the east and west sides are 15 m high and the rest is 9 m high.
The historic conservation area is composed of linear street spaces, and its internal street space form is closely related to the characteristics of the microclimate environment. The activation and renewal of the historic conservation area for the purpose of microclimate improvement can be realized by studying the characteristics of street form. In this paper, Taiping Street in Changsha is selected as the historic conservation area studied. The linear street spatial form formed by the enclosure of buildings on both sides of the area was extracted, and the street spatial form in summer was studied through field survey, field measurement, and software simulation.
5 Historical blocks are generally narrow, with lower buildings on both sides of the street. By properly renovating historical buildings to make full use of their advantages in blocking sunlight at different times and forming building shadows, the overall thermal comfort of the block can be effectively improved. Based on the specific situation of Changsha City located north of the Tropic of Cancer, the researchers fully considered the orientations of building shadows at all times of the day and fully utilized the specific feature of building shadows that can form areas of better thermal comfort by blocking sunlight. The study takes the historical blocks of Taiping Street in Changsha City as the research object and proposed optimization strategies that are beneficial to improving thermal comfort. This undoubtedly helps guide relevant scholars, especially urban planners, to fully consider the situation where thermal comfort is better in building shadow areas during the process of renovating historical blocks and to renovate historical blocks specifically to improve thermal comfort. Based on the specific situation of Taiping Street, the researchers explored the relationship between different values of street interface density and the thermal comfort of the area from the perspective of street interface density and found that increasing the street interface density of east-west streets is beneficial to fully utilizing building shadows to improve thermal comfort. Reducing the street interface density of north-south streets and forming new east-west streets can fully utilize building shadows to block sunlight, form shades, and improve thermal comfort. Removing some buildings and adding smaller open spaces in the middle of the north side of the building is also beneficial for using building shadows to improve thermal comfort. When adding open spaces, priority should be given to adding more smaller open spaces at the intersections of east-west and north-south streets rather than fewer larger open spaces. This is beneficial for forming many new small open spaces with better thermal comfort during the day while minimizing the negative impact on the thermal comfort of intersections. Increasing building height on both sides of east-west and north-south streets and reducing the D/H ratio is also beneficial for improving the thermal comfort of the block by increasing the area of building shadows during certain periods of the day. Our findings are beneficial for guiding researchers to think about fully utilizing building shadows and improving the thermal comfort of historical blocks from the three aspects of street interface density, open space, and D/H ratio. In our study, the effect of wind passages on improving the thermal comfort of historical blocks is not significant, which also helps guide planners to think about whether it is a suitable choice to blindly increase wind passages in historical blocks at a high cost without considering the role of building shadows.
The original contributions presented in the study are included in the article/supplementary material, further inquiries can be directed to the corresponding author.
Conceptualization, JL, HT; Methodology, JL, BZ; Validation, JL; Data management and analysis, JL, HT; Writing-original draft preparation, JL, HT, and BZ; Writing-editing and revision, JL, HT, and BZ.
Author HT was employed by the China Machinery International Engineering Design & Research Institute Co Ltd.
The remaining author declares that the research was conducted in the absence of any commercial or financial relationships that could be construed as a potential conflict of interest.
All claims expressed in this article are solely those of the authors and do not necessarily represent those of their affiliated organizations, or those of the publisher, the editors and the reviewers. Any product that may be evaluated in this article, or claim that may be made by its manufacturer, is not guaranteed or endorsed by the publisher.
Asaeda, T., and Ca, V. T. (1993). The subsurface transport of heat and moisture and its effect on the environment: A numerical model. Bound. Layer. Met. 65, 159–179.
Ashwini, K., and Sil, B. S. (2022). Impacts of land use and land cover changes on land surface temperature over cachar region, northeast India—a case study. Sustainability 14, 14087. doi:10.3390/su142114087
Balany, F., Muttil, N., Muthukumaran, S., Wong, M. S., and Ng, A. W. M. (2022). Studying the effect of blue-green infrastructure on microclimate and human thermal comfort in melbourne’s central business district. Sustainability 14 (15), 9057. doi:10.3390/su14159057
Bruse, M. (2004). ENVI-Met 3.0 updated model overview. Avaliable At: https://www.envi-met.net/documents/papers/overview30.pdf (Access on March 13th, 2023).
Bruse, M., and Fleer, H. (1998). Simulating surface-plant-air interactions inside urban environments with a three dimensional numerical model. Environ. Model. Softw. 13, 373–384. doi:10.1016/S1364-8152(98)00042-5
CGZDL (2022). Point of direct solar radiation, direction of shadow, length of day and night. Avaliable At: http://m.cgzdl.com/jiaoxue/jiexi/13174.html.
Changsha Bureau of Industry and Information Technology (2022). Changsha overview. Changsha: Government of Changsha. Avaliable At: http://csgy.changsha.gov.cn/ztpd/ydhlw/202209/t20220923_10819530.htm (Access on Feburary 28, 2023).
Chen, Y., Li, J., Hu, Y., and Liu, L. (2023). Spatial and temporal characteristics of nighttime UHII based on local climate zone scheme using mobile measurement-A case study of Changsha. Build. Environ. 228, 109869. doi:10.1016/j.buildenv.2022.109869
Chi, M., and Dan, J. (2016). Chinese grow in height rankings. Avaliable At: https://www.chinadaily.com.cn/china/2016-07/27/content_26242508.htm (Access on March 7th, 2023).
Cui, P. (2020). Study on thermal comfort and microclimate enhancement strategy of commercial block morphology. PhD thesis. Harbin: Harbin Institute of Technology.
Deardorff, J. W. (1978). Efficient prediction of ground surface temperature and moisture with inclusion of a layer of vegetation. J. Geophys. Res. 83, 1889–1903. doi:10.1029/jc083ic04p01889
ENVI-met (2023). Lateral boundary conditions. Avaliable At: https://envi-met.info/doku.php?id=kb:lbc (Access on March 13th, 2023).
Fan, C., Myint, S., and Zheng, B. (2015). Measuring the spatial arrangement of urban vegetation and its impacts on seasonal surface temperatures. Prog. Phys. Geogr. 39 (1), 199–219. doi:10.1177/0309133314567583
Gaspari, J., and Fabbri, K. (2017). A study on the use of outdoor microclimate map to address design solutions for urban regeneration. Energy Procedia 111, 500–509. doi:10.1016/j.egypro.2017.03.212
Gherraz, Hz., Guechi, I., and Alkama, D. (2020). Quantifying the effects of spatial patterns of green spaces on urban climate and urban heat island in a semi-arid climate. Bull. Société R. Sci. Liège 89, 164–185. doi:10.25518/0037-9565.9821
Hang, G., Wang, Y., and Cheng, X. (2021). A dynamic evaluation method of landscape perception in urban park—based on combining landscape vision and thermal comfort. Chin. Landsc. Archit. 2021 (5), 38–43.
Hashim, B. M., Al Maliki, A., Sultan, M. A., Shahid, S., and Yaseen, Z. M. (2022). Effect of land use land cover changes on land surface temperature during 1984–2020: A case study of baghdad city using landsat image. Nat. Hazards 112, 1223–1246. doi:10.1007/s11069-022-05224-y
Höppe, P. (1999). The physiological equivalent temperature - a universal index for the biometeorological assessment of the thermal environment. Int. J. Biometeorol. 43 (2), 71–75. doi:10.1007/s004840050118
Hu, H., Chen, Q., Qian, Q., Zhou, X., Chen, Y., and Cai, Y. (2022). Field investigation for ambient wind speed and direction effects exposure of cyclists to PM2.5 and PM10 in urban street environments. Build. Environ. 223, 109483. doi:10.1016/j.buildenv.2022.109483
Huttner, S. (2012). Further development and application of the 3D microclimate simulation ENVI-met. PhD thesis. Mainz: Johannes Gutenberg University Mainz.
Intergovernmental Panel on Climate Change (2021). “Summary for policymakers,” in Contribution of working group I to the sixth assessment report of the intergovernmental panel on climate change (Cambridge: Cambridge University Press).
Jänicke, B., Milošević, D., and Manavvi, S. (2021). Review of user-friendly models to improve the urban micro-climate. Atmosphere 12, 1291. doi:10.3390/atmos12101291
Jendritzky, G., Menz, H., Schirmer, H., and Schmidt-Kessen, W. (1990). Methodik zur raumbezogenen Bewertung der thermischen Komponente im Bioklima des Menschen (Fortgeschriebenes KlimaMichel-Modell). Beitr Akad. Raumforsch Landespl. 114, 1.
Ji, T., Yuan, W., Wang, K., and Ji, L. (2022). Perspective on thermal sensation in sports under thermal environment. China Sport Sci. Technol. 2022 (4), 73–80.
Jiang, L., Cheng, Y., Cheng, W., Lin, R., and Wu, C. (2022). Field observation and analysis on effects of greening form and its plant landscape characteristics on thermal environment in square. Build. Sci. 38 (6), 52–58.
Kruger, E. L., and Drach, P. (2017). Identifying potential effects from anthropometric variables on outdoor thermal comfort[J]. Build. Environ. 117, 230–237. doi:10.1016/j.buildenv.2017.03.020
Lee, H., Mayer, H., and Chen, L. (2016). Contribution of trees and grasslands to the mitigation of human heat stress in a residential district of Freiburg, Southwest Germany. Landsc. Urban Plan. 148, 37–50. doi:10.1016/j.landurbplan.2015.12.004
Li, J., and Wang, J. (2016). Simulation analysis on relationship between spatial form and microclimate of pedestrian street in Nanjing. J. Southeast Univ. Nat. Sci. Ed. 46 (5), 1103–1109.
Li, N., Liu, P., and Wu, Z. (2019). Field survey on summer thermal comfort and adaptationof University dormitories in Changsha. Energy 182 (4), 194–120. doi:10.1016/j.energy.2019.05.204
Liu, Y., Lu, F., Dong, W., Liang, X. M., and Ye, F. (2020). A highly selective perylenediimide-based chemosensor: "Naked-Eye" colorimetric and fluorescent turn-on recognition for Al3. Archit. Technol. 51 (6), 702–705. doi:10.3389/fchem.2020.00702
Liu, Z., Cheng, W., Jim, C. Y., Morakinyo, T. E., Shi, Y., and Ng, E. (2021). Heat mitigation benefits of urban green and blue infrastructures: A systematic review of modeling techniques, validation and scenario simulation in ENVI-met V4. Build. Environ. 200, 107939. doi:10.1016/j.buildenv.2021.107939
Long, Y. (2021). Research on micro-renewal strategies of historical streets from refined development perspective —taking taiping street area in Changsha as an example. China Oversea Archit. 27 (1), 127–130.
Lu, G., Hu, Y., Yang, Z., Zhang, Y., Lu, S., Gong, S., et al. (2022). Geographic latitude and human height - statistical analysis and case studies from China. Arab. J. Geosci. 15, 335. doi:10.1007/s12517-021-09335-x
Marcelli, A., Sebastianelli, M., Conte, A., Lucci, F., and Della Ventura, G. (2020). Micro-climatic investigation and particulate detection in indoor environments: The case of the historical museum of bersaglieri in rome. Rend. Fis. Acc. Lincei 31, 807–817. doi:10.1007/s12210-020-00935-5
Masoudi, M., and Tan, P. Y. (2019). Multi-year comparison of the effects of spatial pattern of urban green spaces on urban land surface temperature. Landsc. Urban Plan. 184, 44–58. doi:10.1016/j.landurbplan.2018.10.023
Matzarakis, A., and Mayer, H. (1997). Heat stress in Greece. Int. J. Biometeorol. 41, 34–39. doi:10.1007/s004840050051
Matzarakis, A., Mayer, H., and Iziomon, G. (1999). Applications of a universal thermal index: Physiological equivalent temperature. Int. J. Biometeorol. 43 (2), 76–84. doi:10.1007/s004840050119
Ministry of Housing and Urban-Rural Development of the People’s Republic of China (2014). Design standard for thermal environment of urban residential areas. Beijing: China Architecture& Building Press.
Moisa, M. B., Merga, B. B., and Gemeda, D. O. (2022). Urban heat island dynamics in response to land use land cover change: A case of jimma city, southwestern Ethiopia. Theor. Appl. Climatol. 149, 413–423. doi:10.1007/s00704-022-04055-y
Nardino, M., Cremonini, L., Georgiadis, T., Mandanici, E., and Bitelli, G. (2021). Microclimate classification of bologna (Italy) as a support tool for urban services and regeneration. Int. J. Environ. Res. Public Health 18, 4898. doi:10.3390/ijerph18094898
NCD Risk Factor Collaboration (NCD-RisC) (2016). A century of trends in adult human height. eLife 5, e13410. doi:10.7554/eLife.13410
Peng, S. (2016). Numerical simulation of wind and thermal environment in inner cities and strategies for partial renewal: A case study of dazhimen, wuhan. City Plan. Rev. 40 (8), 16–24.
Qiao, Z., He, T., Lu, Y., Sun, Z., Xu, X., and Yang, J. (2022). Quantifying the contribution of land use change based on the effects of global climate change and human activities on urban thermal environment in the Beijing-Tianjin-Hebei urban agglomeration. Geogr. Res. 41 (7), 1932–1947.
Renard, F., Alonso, L., Fitts, Y., Hadjiosif, A., and Comby, J. (2019). Evaluation of the effect of urban redevelopment on surface urban heat islands. Remote Sens. 11, 299. doi:10.3390/rs11030299
Santhi, C., Arnold, J. G., Williams, J. R., Dugas, W. A., Srinivasan, R., and Hauck, L. M. (2001). Validation of the swat model on a large rwer basin with point and nonpoint sources 1. JAWRA J. Am. Water Resour. Assoc. 37, 1169–1188. doi:10.1111/j.1752-1688.2001.tb03630.x
Seto, K., and Shepherd, M. (2009). Global urban land-use trends and climate impacts. Curr. Opin. Environ. Sustain 1 (1), 89–95. doi:10.1016/j.cosust.2009.07.012
Silva, H. E., and Henriques, F. M. A. (2014). Microclimatic analysis of historic buildings: A new methodology for temperate climates. Build. Environ. 82, 381–387. doi:10.1016/j.buildenv.2014.09.005
Stolow, N. (1994). The preservation of historic houses and sites: The interface of architectural restoration and collection/display conservation principles. Stud. Conserv. 39, 116–122. doi:10.1179/sic.1994.39.supplement-2.116
Stull, R. (1994). A convective transport theory for surface fluxes. J. Atmos. Sci. 51, 3–22. doi:10.1175/1520-0469(1994)051<0003:acttfs>2.0.co;2
Tang, H., Liu, J., and Zheng, B. (2022). Study on the green space patterns and microclimate simulation in typical urban blocks in central China. Sustainability 14, 15391. doi:10.3390/su142215391
Tsoka, S., Tsikaloudaki, A., and Theodosiou, T. (2018). Analyzing the ENVI-met microclimate model’s performance and assessing cool materials and urban vegetation applications–A review. Sustain. Cities Soc. 43, 55–76. doi:10.1016/j.scs.2018.08.009
Wan, L. (2017). Study on protection and revitalization of historic conservation area in Guangzhou. MSc thesis. Guangzhou: South China University of Technology.
Wang, C., Wang, Z. H., and Ryu, Y. H. (2021). A single-layer urban canopy model with transmissive radiation exchange between trees and street canyons. Build. Environ. 191, 107593. doi:10.1016/j.buildenv.2021.107593
Wang, W., and Sun, J. (2020). Urban renewal can mitigate urban heat islands. Geophys. Res. Lett. 47 (6), e2019GL085948.
Wang, Z., Bou-Zeid, E., and Smith, J. A. (2013). A coupled energy transport and hydrological model for urban canopies evaluated using a wireless sensor network. Q. J. R. Meteorological Soc. 139 (675), 1643–1657. doi:10.1002/qj.2032
Xiang, Y., and Zheng, B. (2022). Research on urban plaza renovation based on thermal comfort simulation evaluation:The case of Changsha. J. Railw. Sci. Eng. 2022 (1), 291–230.
Xiong, Y., and Zhang, F. (2021). Effect of human settlements on urban thermal environment and factor analysis based on multi-source data: A case study of Changsha city. J. Geogr. Sci. 31 (06), 819–838. doi:10.1007/s11442-021-1873-5
Keywords: historic conservation area, street space form, microclimate, local renewal, ENVI-met, simulation
Citation: Liu J, Tang H and Zheng B (2023) Simulation study of summer microclimate in street space of historic conservation areas in China: A case study in Changsha. Front. Environ. Sci. 11:1146801. doi: 10.3389/fenvs.2023.1146801
Received: 17 January 2023; Accepted: 18 April 2023;
Published: 09 May 2023.
Edited by:
Qiming Zhou, Hong Kong Baptist University, Hong Kong SAR, ChinaReviewed by:
Jinda Qi, National University of Singapore, SingaporeCopyright © 2023 Liu, Tang and Zheng. This is an open-access article distributed under the terms of the Creative Commons Attribution License (CC BY). The use, distribution or reproduction in other forums is permitted, provided the original author(s) and the copyright owner(s) are credited and that the original publication in this journal is cited, in accordance with accepted academic practice. No use, distribution or reproduction is permitted which does not comply with these terms.
*Correspondence: Bohong Zheng, emhlbmdib2hvbmdAY3N1LmVkdS5jbg==
Disclaimer: All claims expressed in this article are solely those of the authors and do not necessarily represent those of their affiliated organizations, or those of the publisher, the editors and the reviewers. Any product that may be evaluated in this article or claim that may be made by its manufacturer is not guaranteed or endorsed by the publisher.
Research integrity at Frontiers
Learn more about the work of our research integrity team to safeguard the quality of each article we publish.