
95% of researchers rate our articles as excellent or good
Learn more about the work of our research integrity team to safeguard the quality of each article we publish.
Find out more
ORIGINAL RESEARCH article
Front. Environ. Sci. , 07 September 2023
Sec. Land Use Dynamics
Volume 11 - 2023 | https://doi.org/10.3389/fenvs.2023.1146346
This article is part of the Research Topic Advances in Characterizing and Monitoring Land Cover/Use and Associated Ecosystem Changes Using Remote Sensing Data View all 13 articles
 Motuma Shiferaw Regasa
 Michael Nones*
In recent years, Ethiopia is facing problems due to soil erosion, mainly because of the conversion of natural vegetation into cultivated land to answer to increasing human pressure. Such changes in coverage are fostering soil erosion, which is also affecting dam reservoirs, because of the increasing sediment yield entering the lake. The present study focuses on the Ethiopian Fincha watershed and takes advantage of the potentiality of the Soil and Water Assessment Tool (SWAT) model, to investigate how land use land cover changes impact soil erosion and the consequent sediment yield entering the Fincha Dam. The SWAT model was calibrated and validated using time series data of stream flow and sediment covering the period 1986-2008, and its performance was evaluated by looking at the coefficient of determination, Nash-Sutcliffe simulation efficiency, and per cent bias. Once validated, the SWAT model was applied to derive sediment yield for the future 30 years, based on forecasted land use land cover conditions. The results show that the mean annual soil loss rate increased from 32.51 t ha−1 in 1989 to 34.05 t ha−1 in 2004, reaching 41.20 t ha−1 in 2019. For the future, a higher erosion risk should be expected, with the annual soil loss rate forecasted to be 46.20 t ha−1 in 2030, 51.19 t ha−1 in 2040, and 53.98 t ha−1 in 2050. This soil erosion means that sediments transported to the Fincha Dam, located at the watershed outlet, increased significantly in the last 30 years (from 1.44 in 1989 to 2.75 mil t in 2019) and will have the same trend in the future (3.08–4.42 mil t in 2020 and 2050, respectively), therefore highly affecting the Fincha reservoir services in terms of reduction of water volume for irrigation and hydroelectric power generation. By providing possible medium/long-term scenarios, the present work can help land planners and decision-makers in developing future land management strategies based on actual projections, eventually aiming to reduce soil erosion at the watershed scale and guarantee the sustainable development of the Fincha region and its key hydraulic infrastructures.
Globally, 75 billion tons of soil are eroded every year (Dissanayake et al., 2019). Research performed at the continental scale pointed out that the United States experience a loss rate of around 15-18 t ha−1 year−1, while Europe has a range of 10–20 t ha−1 year−1. Less developed countries like Asia, Africa, and South America can reach rates of even 20-40 t ha−1 year −1 (Deore, 2005). For example, as reported by Kidane and Alemu, (2015), transboundary rivers originating from the highlands of Ethiopia convey around 1.3 billion tons of sediment annually, while the Blue Nile only transports about 131 million tons per year. Changes in land use land cover (LULC) can cause soil erosion, which eventually contributes to increasing the quantity of sediments entering waterbodies and dam reservoirs. This process is evident in arid and semi-arid environments (e.g., Pulighe et al., 2019; Sharma et al., 2022; Negewo and Sarma, 2023), where soil degradation can generate cascading effects like drought and famine (Yesuf et al., 2015). To counteract the erosion process and guarantee suitable development, effective management strategies and policies, and implementation of best management practices with the active involvement of all stakeholders are needed. To guarantee proper outcomes in the medium to long term, the selection of such management actions should be evidence-driven, and therefore based on modelling approaches, able to provide reliable results in data-scarce regions (Tegegne et al., 2017; Degife et al., 2021).
Nowadays, the Ethiopian economy and population are taking advantage of the presence of multiple dams and reservoirs, providing the availability of a large amount of water resources and suitable topography (Assfaw, 2019). However, these reservoirs are highly impacted by soil erosion, with consequent severe problems of sedimentation even beyond their dead storage capacity, which is a clear sign of poor land use practices and improper land management. Many studies have shown that main factors contributing to soil erosion include the type of soil, the topography of the basin, the types of land uses and vegetation cover, and the amount of rainfall (e.g., Setegn et al., 2008; Betrie et al., 2011; Kidane et al., 2019; Aneseyee et al., 2020) The reduction of storage volume due to sedimentation negatively impacts the capacity to produce hydroelectric power, increasing production and maintenance costs, reducing the availability of water for concurrent uses like irrigation, and eventually shortening the reservoir life.
Past investigations have shown a large variety of hydrological models used for evaluating and predicting changes in water balance (Aredo et al., 2023) and soil erosion both worldwide (Zeiger and Hubbart, 2016; Gharibdousti et al., 2019) and in Ethiopian watersheds (Miheretu and Yimer, 2018), but most of them used the Soil and Water Assessment Tool (SWAT) (see, among many others, Gessese and Yonas, 2008; Senti et al., 2014; Yesuf et al., 2015; Ebabu et al., 2019; Megersa et al., 2019; Gebretekle et al., 2022; Mariye et al., 2022; Anteneh et al., 2023).
SWAT was chosen for the present investigation due to its free availability, simple integration with GIS-based interfaces, and connectivity to tools for sensitivity, calibration, and uncertainty analysis. Moreover, the opportunity to easily integrate GIS information in SWAT constitute an advantage in studying area with a scarcity of data, such as the Fincha watershed. These studies confirmed that poor land use practices, improper land management and absence of appropriate soil conservation measures have been major causes of soil erosion and land degradation problems, with consequent sedimentation in Ethiopian reservoirs (Tefera and Streak, 2010; Ayana et al., 2012; Dibaba et al., 2021; Anteneh et al., 2023).
During the past decades, the Fincha watershed, part of the Blue Nile River basin, has experienced dynamic LULC changes including the degradation of natural woodlands (Dibaba et al., 2021; Regasa et al., 2021). According to Leta et al. (2021a) and Kenea et al. (2021), such LULC variations can have both long- and short-term temporal and spatial effects on the watershed hydrology, and consequently on the soil erosion and sediment yield entering the dam reservoirs located in the watershed (Dibaba et al., 2021).
It is worth noting that these studies focused on the local scale, and investigated the impact of past LULC on the watershed hydrology. However, very reduced literature exists on predicting the impact of future LULC changes, both in terms of changes in watershed hydrology and the connected production of sediment. The present investigation aims to address this knowledge gap by evaluating the impact of LULC change on sediment yield entering the Fincha reservoir, looking at past trends (1989, 2004, 2019 years) and predicting future scenarios (2030, 2040, 2050 years). LULC scenarios were developed based on historical data and future predictions (Regasa and Nones, 2022), while hydrological changes and consequent sediment yield were computed by applying the SWAT model, given its reliability in modelling water and sediment loading (Gassman et al., 2007; Ang et al., 2023). The present findings contribute to a better understanding of soil erosion processes and consequences in a poorly gauged basin, giving useful insights on future management strategies and mitigation measures that can be applied for reducing sediments entering the Fincha reservoir, eventually contributing to assuring a long service life.
The study area is presented in the next section, together with the available dataset and a short overview of the methods used for data processing. This is followed by a thorough description of the SWAT model and the assumptions made for running it, along with a sensitivity analysis. Results are reported in Section 3, and focus on both the calibration and validation process, as well as the estimation of sediment yield and the localization of areas affected by the erosion process. The study assumptions and the obtained results are then discussed in light of the available literature to point out the study’s novelty, as well as the pros and cons of applying SWAT in ungauged watersheds.
The Fincha watershed is in Ethiopia’s Horroo Guduruu Wallaggaa Oromiyaa Regional State, in the Upper Blue Nile Basin, about 300 km from Addis Ababa. It is geographically located between latitudes 9°9′53″ N to 10°1′00″ N and longitudes 37°00′25″ E to 37°33′17″ E, as shown in the map (Figure 1). The Fincha watershed covers an area of. 300,505 ha.
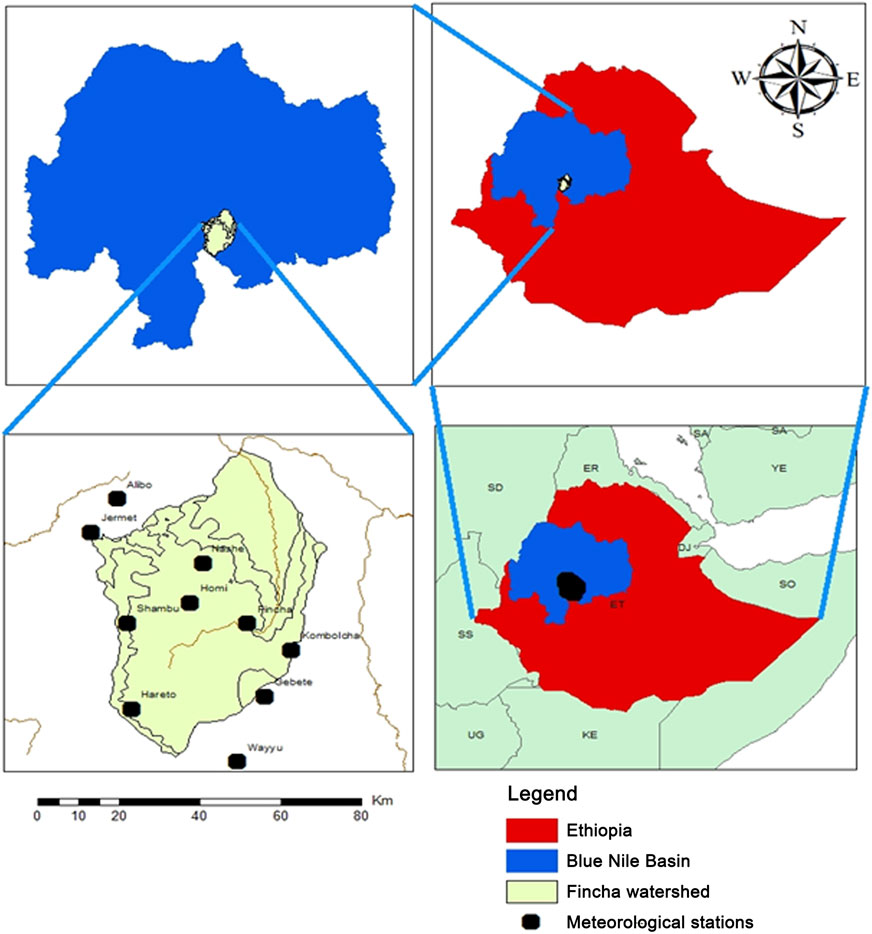
FIGURE 1. Location of the Fincha watershed, Blue Nile Basin, Ethiopia.
The region is defined by four distinct seasons: Summer, June to August, with heavy rains; Harvest season occurs from September to November, winter, which lasts from December to February, is illustrated by morning frost, particularly in January. Spring, from March to May, is the hottest season, with showers on occasion. The annual rainfall in the study area ranges from 1,367 to 1842 mm, with the Northern lowlands receiving the least rain and the Southern and Western highlands receiving more than 1,500 mm (Regasa and Nones, 2022). The main rainy season is from June to September, where the average precipitation is around 1,604 mm with peaks between July to August.
Three hydropower dams are present in the study area (Figure 1). This investigation focuses on the Fincha Dam, which was built in 1973, with an initial reservoir volume of 185 million m3. In 1987, the Amarti River was diverted into the lake, increasing the reservoir capacity to 460 million m3, which guarantees a current hydropower production of 127 MW (Tefera and Sterk, 2008).
According to previous studies (e.g., Leta et al., 2021b; Debela, 2022; Regasa and Nones, 2022), natural resources such as the Fincha, Amarti, and Nashe lakes not only contribute to the national economy by generating hydroelectric power, but are also used to irrigate crop and extensive sugar cane fields (Kitila et al., 2015). Because of its downstream connection to the Nile basin and intensive agriculture, the area is of national and international interest in hydro politics. Indeed, as suggested by various authors (e.g., Obengo, 2016; Chekol, 2019; Hailu, 2022), there are increased ambitions to control the Nile water resources, including controlling the river water sources and the hydropower reservoirs located in the watershed.
The SWAT model requires multiple pieces of information, which come from different sources (Table 1). In detail, the model inputs are Digital Elevation Model (DEM), LULC maps, soil data, weather data (relative humidity, precipitation, solar radiation, temperature, and wind speed), water flow and sediment data. For the sake of brevity, only a summary of the key data used in this research and their processing is reported here, while more details can be found in the cited literature.
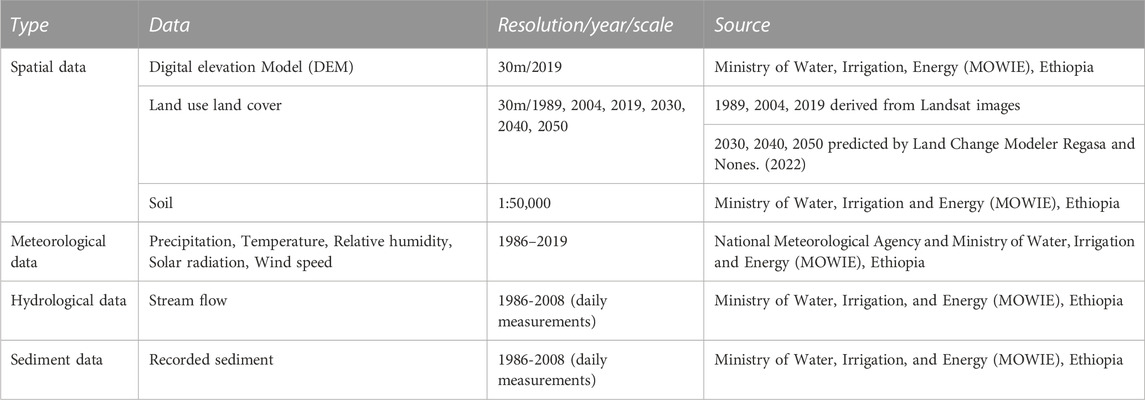
TABLE 1. Available data and sources.
The data were obtained from the Metrological National Agency of Ethiopia. Their analysis was performed using daily observed weather data covering the period 1986-2019. These data include precipitation, maximum and minimum temperatures, solar radiation, wind speed and relative humidity of ten gauging stations, and were collected from the Ethiopian metrological agencies of Alibo, Fincha, Gebete, Hareto, Homi, Jermet, Kombolcha, Nashe, Shambu and Wayyu. The statistical software Xlstat was used to fill in missing data.
Soil data were obtained from the Ethiopian Ministry of Water, Irrigation and Energy (MOWIE), and they were pre-processed to follow the Food and Agricultural Organization (FAO) guidelines as stated in Pennock (2019). Ten soil types can be recognized in the Fincha watershed: Dystric Vertisols, Eutric Cambislos, Eutric Leptosols, Eutric Vertisols, Haplic Alisols, Haplic Arenosols, Haplic Phaeozems, Rhodic Nitisols, Chromic Luvisols, Water and Marsh (Figure 2B).
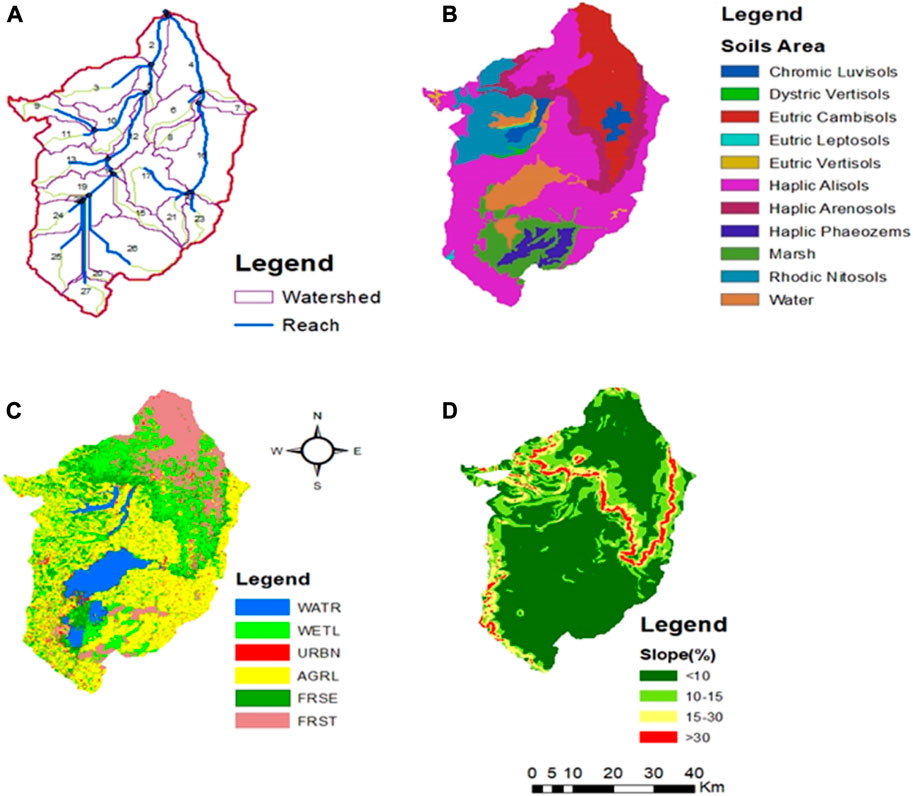
FIGURE 2. Main characteristics of the study area: (A) river system and sub-watersheds; (B) soil types; (C) Land Use Land Cover of 2019; (D) terrain slope.
Land use is a key SWAT model input that influences surface runoff, evapotranspiration, erosion, nutrients and pesticide load in a watershed. The LULC data used in the present research were previously described by Regasa and Nones (2022), who, using satellite imagery and Geographic Information Systems, investigated LULC changes in past (1989, 2004, 2019) and future (2030, 2040, 2050) years. In their study, ground truth data, key informant interviews and focal group discussions were also considered to reduce uncertainties associated with deriving LULC from remote sensing.
The Fincha watershed was classified into six classes: waterbody, grass/swamp, built-up, agricultural land, forest, and shrub (Figure 2C). The LULC data set was reclassified into six major land classes as it is for use in SWAT. This reclassification was conducted because the SWAT model needs standard names such as WATR, WETL, URBN, AGRL, FRSE, and FRST as indicated in the legend of Figure 2C for waterbody, grass/swamp, built-up, agricultural land, forest, and shrub, respectively.
Multiple slope classes were defined and then used to delineate SWAT HRU having the same slope, based on a 30 m × 30 m DEM of the Fincha watershed and using the Arc-GIS spatial analysis tool. When defining the hydrologic response unit, Arc-SWAT allows the integration of up to five slope classes. In addition, the SWAT model allows to select a single or multiple slope class. As a result, the slope classes used in this study were broken down into four classes (10%, 15%, 25%, >30%) to represent the variation in the topography of the Fincha watershed (Figure 2D).
The sediment rating curve is generally used to estimate the sediment yield from the flow measurements and sediment concentrations (Asselman, 2000). To overcome the lack of continuous measurements, a sediment rating curve was developed to relate daily stream flow to sediment data recorded at the outlet of the Fincha Dam. Such a curve can show how stream flow affects the rate of sediment movement (Assfaw, 2020; Tilahun et al., 2023), but its reliability highly depends on the available dataset. Moreover, because of the difficulties in measuring sediment transport in high-flow conditions, generally, sediment rating curves are generally more reliable for low to medium flows (Sadeghi and Saeidi, 2010; Tomkins, 2014; Pomázi and Baranya, 2022).
To simulate sediment yield and stream flow, SWAT needs, as model input, sediment, and stream flow data with a continuous time step. Due to the lack of continuous sediment data, these were derived by applying an empirical sediment rating curve to the simulated 1 stream flow. Such an approach is generally used when there are few long-term and trustworthy records of sediment concentrations (Jilo et al., 2019).
Following literature evidence (e.g., Asselman, 2000; Horowitz, 2003; Franzoia and Nones, 2017; Assfaw, 2019; Temiz et al., 2022), a general relationship between sediment concentrations and river discharge can be written as:
where Qs is the sediment load in ton day−1, Qf represents the stream flow in m3 s−1, while a and b are regression constants to be determined from a regression between measured sediment and water flows.
In the study case, the obtained sediment data (four times in 1990, specifically in February, March April and May), in 1991 two times (October and August), in 1995 (one time in August) and in 1996 (one time in May) was in mg l−1. The concentration was converted to ton day-1 via Eq. 2:
where C indicates the suspended sediment concentration in mg l−1.
Using the data obtained from MOWIE and reporting flow and sediment data measured at the Fincha gauging station between 1986 and 2008, a sediment rating was created (Figure 3). The regression constants a and b were found to be 2.9508 and 1.2056, respectively.
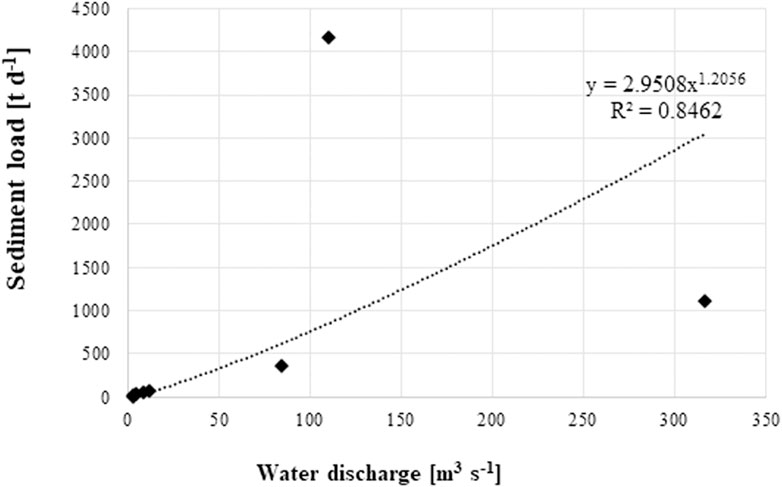
FIGURE 3. Sediment rating curve for the period 1986-2008. Data were measured at the Fincha gauging station (source: MOWIE).
The Soil and Water Assessment Tool (SWAT) was developed by the United States Department of Agriculture (USDA) and is a continuous-time, semi-distributed, process-based watershed model. It was initially developed to predict the impact of land management practices on water, sediment and chemical yields in agricultural watersheds (Arnold et al., 1998; Winchell et al., 2007; Anteneh et al., 2023) but, since then, it has been widely used to understand the hydrological cycle in general, simulating the effect of land use hydrology, water quality and ecosystem services, to eventually derive sediment yield and soil management practices (e.g., Qiu and Wang, 2014; Xue et al., 2014; Dibaba et al., 2021; Kenea et al., 2021; Lin et al., 2022). There is ample literature proving the validity of SWAT in modelling soil erosion and transport processes (see, among many others, Setegn et al., 2010; Phuong et al., 2014; Cousino et al., 2015; Djebou, 2018; Dakhlalla and Parajuli, 2019; Khanchoul et al., 2020).
SWAT divides a watershed into sub-watersheds, connected through a stream channel. Further, each sub-watershed is divided into Hydrologic Response Units (HRUs), which represent a unique combination of soil, land use and slope type in a sub-watershed (Arnold et al., 2012; Rathjens and Oppelt, 2012). In SWAT, hydrology and sediment are simulated at the HRU level, and then the outputs are summarized first at the sub-watershed level, and then at the watershed level, routing these quantities through the stream network (Neitsch et al., 2011). SWAT can account for that, simulating all the effects of soil erosion and climate change on water supply properly (Krysanova and White, 2015; Boru et al., 2019).
From the SWAT website (swat.tamu.edu), Arc-SWAT version 2012.10 4.19 was downloaded, and its interface was linked to Arc-GIS 10.3.1 for the modelling. This latter process involves setting up a SWAT project, defining the spatial extent of the analysis (watershed, sub-watersheds, HRUs), writing and editing SWAT input, and performing the simulations. Following the collection of data, all input data were prepared, the watershed and the HRUs were defined, and the classification of land use, soil, and slope was included in the model.
Based on the water balance equation (Swami and Kulkarni, 2016), SWAT simulates the hydrological cycle:
where SWt is the last soil water content [mm], SWo is the first soil water content on day i [mm], t indicates the time [days], Rday is the amount of precipitation on day i [mm], Qsurf represents the amount of surface runoff on day i [mm], Wseep is the amount of water entering vadose zone from the soil profile on day i [mm], Ea is the amount of evapotranspiration on day i [mm] and Qgw indicates the amount of return flow on day i [mm].
In our study, the SWAT model was applied to estimate hydrological components such as surface run-off, evapotranspiration, and sediment yield. Sediment yield was estimated at the HRU level, through a Modified Universal Soil Loss Equation (MUSLE) (e.g., Khelifa et al., 2017; Ayele et al., 2021; Sahar et al., 2021)
where Sed is sediment yield in metric tons per day, Qsurf is the surface runoff volume [mm], qpeak is the peak run-off rate [m3 s−1], AreaHRU is the area of HRU [ha], K is the soil erodibility factor and depends on the type of soil, C is the factor and crop management factor, P is the practice support factor usually only apply to cropland or land that is managed to conserve soil, while L and S factors indicate the length and steepness of the slope, respectively. CFRG is the course fragment factor.
The watershed and the sub-watersheds were delineated by using the 30 m-resolution DEM of the Fincha watershed, via defining the stream network in SWAT and considering flow accumulation and water flow direction. SWAT model enables users to delineate watersheds and sub-watersheds using Digital Elevation Models (DEMs) by expanding the Arc-GIS and spatial analyst extension function. Watershed and sub-watershed delineation was accomplished through a series of steps, including DEM setup, stream definition, inlet outlet definition, watershed outlet selection and definition, and finally watershed parameter calculation (Figure 2A).
The Arc SWAT model interface by default proposes the minimum and maximum watershed area, as well as the size of the sub-watershed in hectares to define the minimum drainage area required to form the stream’s origin. The smaller the threshold area, the more detail of the drainage network, the greater the number of sub-watersheds, and the higher the number of HRUs. However, more processing time and computer space are required. As a result, the model’s proposed threshold was used to determine the optimal size of the threshold area.
HRUs were defined based on the topographical characteristics of the terrain as derived from the DEM and assigned to each sub-watershed based on a threshold value for LULC, soil, and slope categories. According to Megersa et al. (2019), a threshold of 10% was imposed in defining HRUs, to exclude areas characterized by small land uses and slope classes. Consequently, the Fincha watershed was divided into 27 sub-watersheds and then subdivided into 234 HRUs. It is worth reminding that only 9 of these sub-watersheds are located upstream of the Fincha Dam, and are therefore contributing to the sediment yield entering the dam.
A sensitivity analysis is needed to investigate the model’s capacity to adequately predict water stream flow and sediment yield (Anaba et al., 2016), and this was done via the SWAT Calibration and Uncertainty Procedures (SWAT-CUP) interface (Mekuriaw, 2019) combined with the SUFI-2 approach (Leta et al., 2021a). For that, seven parameters connected to sediment processes and nine parameters representing stream flow were selected, following literature evidence (Khelifa et al., 2017; Daramola et al., 2019; Yuan and Forshay, 2019; Kenea et al., 2021).
SWAT Calibration and Uncertainty Procedures (SWAT-CUP), a program for integrated sensitivity analysis, calibration, and validation, was used to analyze the uncertainties of SWAT model prediction (Dibaba et al., 2021). In this investigation, the sensitivity analysis was performed using the SUFI-2 techniques and looking at the water discharge - sediment load data measured at the outlet of the Fincha Reservoir (at Fincha Dam) during the period 1986-2008.
To perform model calibration and validation, the stream flow and sediment data were divided into two periods, and an initial warm-up period was also taken into consideration. The initial three (1986–1988) years were chosen as the warm-up period, while the calibration was performed for the 1989-2002 period, and 2003-2008 was utilized to validate the SWAT model. To test the goodness of fit between monthly simulated and observed values, the model’s performance was assessed using the coefficient of determination (R2), the Nash-Sutcliffe simulation efficiency (NSE), and the per cent bias (PBIAS).
Determination coefficients can range from 0 (inadequate model) to 1 (the model perfectly fits the data), and, typically, values R2 larger than 0.6 indicate good correlation (Leta et al., 2021b). The NSE values can reach a maximum of 1 (perfect fit), while a negative NSE value indicates that the model’s performance is inferior to that obtained using the observations’ mean as a predictor (Jilo et al., 2019). The simulation efficiency is classified as unsatisfactory, satisfactory, good, or very good if NSE < 0.50, 0.5<NSE < 0.65, 0.65<NSE < 0.75, 0.75<NSE < 1, respectively (Leta et al., 2021a).
PBIAS assesses the typical tendency of the simulated data to differ from the observed data in size or frequency, and lower PBIAS values indicate better simulation results. Moriasi et al. (2012) define PBIAS positive values as a model underestimation, while negative values as a model overestimation.
According to Yasir et al. (2020) and Dibaba et al. (2021), the following equations were applied to determine R2 (Eq. 5), NSE (Eq. 6) and PBIAS (Eq. 7):
where QObs is the actual variable,
Using scenario-based simulations, the effects of current and future LULC changes on watershed sediment yield were assessed for the period 1989-2050. This was done by creating six scenarios (historical reference years 1989, 2004, 2019; future predicted 2030, 2040, 2050) accounting for different LULC conditions (Regasa and Nones, 2022). A fixing-changing method was applied to investigate the effects of LULC change (Leta et al., 2021b): SWAT was run with changing LULC maps, but all the other modelling parameters were kept constant as derived from the model validation (Gessesse et al., 2015). The sediment yield was computed separately for the entire Fincha watershed (27 sub-watersheds) and the region upstream of the Fincha Dam (9 sub-watersheds). Pearson’s correlation method (Aga et al., 2020) was used to assess the variations in LULC classes and the sediment yields, while the pair-wise Pearson correlation matrix was applied to detect linear correlations.
The sensitivity analysis was based on the SUFI-2 algorithm techniques (Arnold et al., 2013). The p-value and the t-stat value were used to assess the sensitivity of each parameter and then rank it, with rank 1 indicating the most sensitive parameter. Statistically, bigger absolute t-stats and lower p-values mean that a parameter is significant. On the other part, a high p-value indicates that there is no correlation between changes in the predictor values and the response variable (Pandey et al., 2021).
As reported in Tables 2, 3, the performed sensitivity analysis shows that the top three most sensitive parameters for stream flow are 1) groundwater delay (V_GW_DELAY.gw), 2) threshold water depth in the shallow aquifer required for return flow to occur (V_GWQMN.gw), and iii) Manning’s roughness value for the main channel (R_CH_N2.rte). In the case of sediments, the top three most sensitive are 1) exponential factor for channel sediment routing (R_SPEXP.bsn), 2) sediment concentration in lateral and groundwater flow (R_LAT_SED.hru), and iii) channel cover factor (R_CH_COV2.rte).
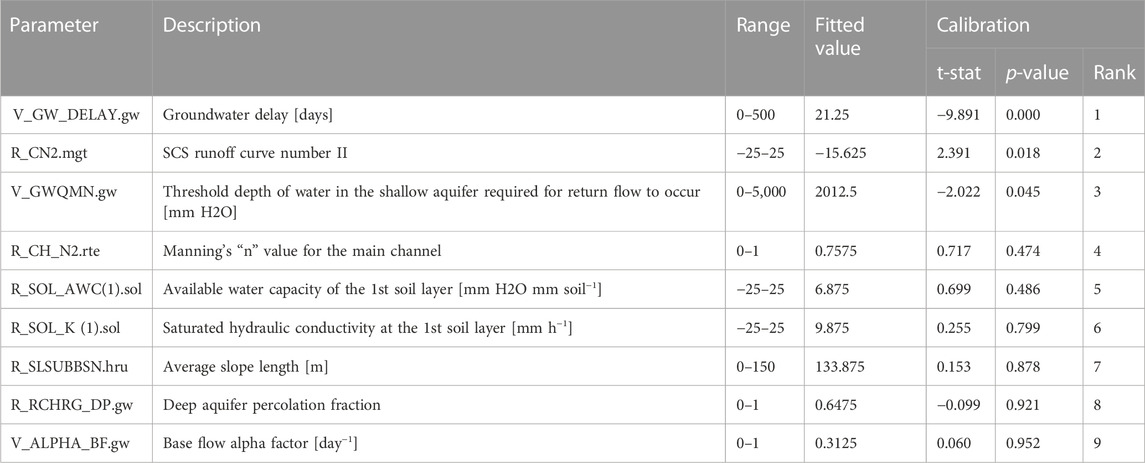
TABLE 2. Stream flow parameters with range and fitted value, as derived from the sensitivity analysis performed using SUFI-2. Their rank is based on the p-value.
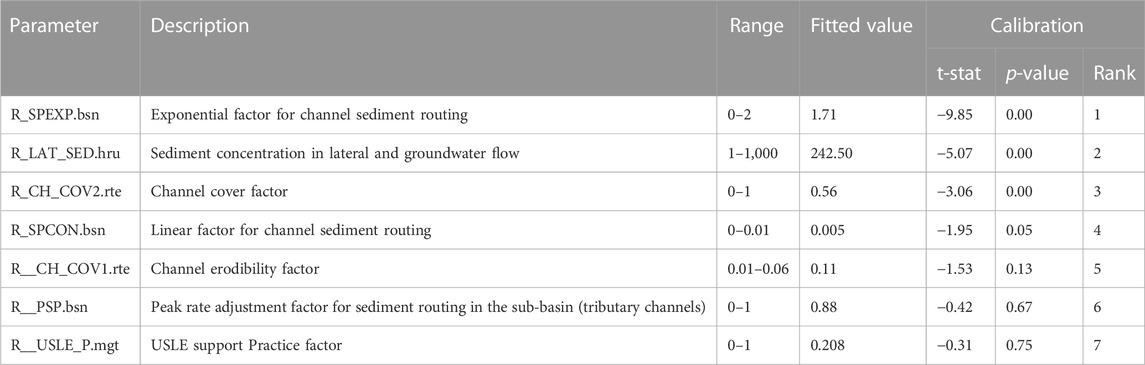
TABLE 3. Sediment parameters with range and fitted value, as derived from the sensitivity analysis performed using SUFI-2. Their rank is based on the p-value.
Most of the studies performed using SWAT divided stream flow and sediment data for calibration and validation equally. However, according to the study conducted by Arnold et al. (2012), in the case of watersheds characterized by a scarcity of data, most of them should be used for calibration, while a minor part of the data is for validation. As an example, Ait M’Barek et al. (2023) used 75% of hydrological data for calibration and 25% for validation.
As the Fincha watershed is also characterized by data scarcity, a similar approach was followed, using the observed monthly stream flow and sediment at the Fincha reservoir close to the Fincha Dam outlet from 1986 to 2008. The warm-up period spanned from 1986 to 1988, and was used to reduce the impact of the model’s initial conditions, while the calibration period lasted from 1989 to 2002, and the validation period from 2003 to 2008.
The model is very effective at simulating the stream flow (Figure 4), while more uncertainties are connected with the simulation of sediment load during high-flow conditions (Figure 5). In both cases, SWAT slightly overestimates peak conditions during the calibration phase, while more consistent results characterize the validation phase.
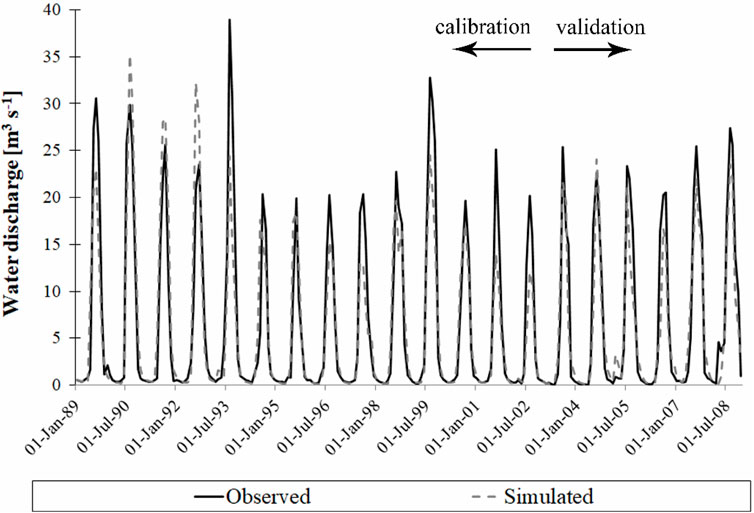
FIGURE 4. Comparison between computed and measured water discharge at the Fincha Dam outlet, during the calibration (1989–2002) and validation (2003–2008) phases.
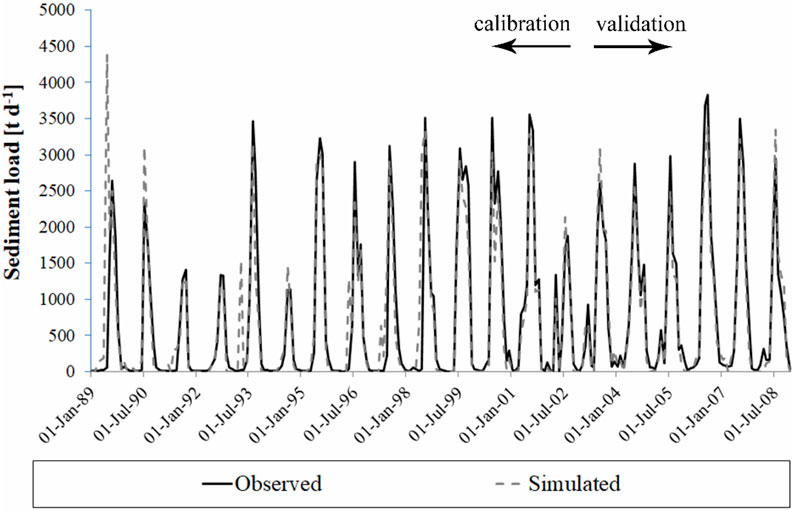
FIGURE 5. Comparison between computed and measured sediment load at the Fincha Dam outlet, during the calibration (1989–2002) and validation (2003–2008) phases.
The capability of the SWAT model in reproducing observed stream flow and sediment load was evaluated with a few statistics, which are summarized in Table 4. In this case, it is possible to observe that, on average, SWAT is able to adequately reproduce the observed phenomena, and it is considered reliable in simulating future conditions (Section 3.3).
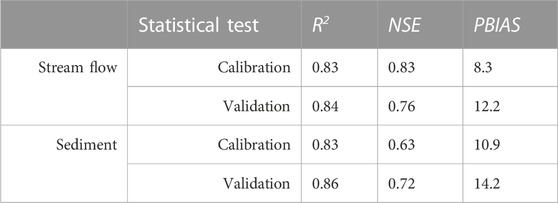
TABLE 4. Monthly stream flow and sediment statistics for calibration (1989–2002) and validation (2003–2008).
A positive PBIAS for both periods indicates that the overall expected sediment production had been slightly underestimated, especially during the validation period, mainly due to problems in detecting water and sediment peaks (Figure 5).
The SWAT model was applied to simulate sediment yield in 27 sub-watersheds (see Section 2.2). Based on the approach proposed by Dibaba et al. (2021), these sub-watersheds were classified in terms of soil loss (Table 5).
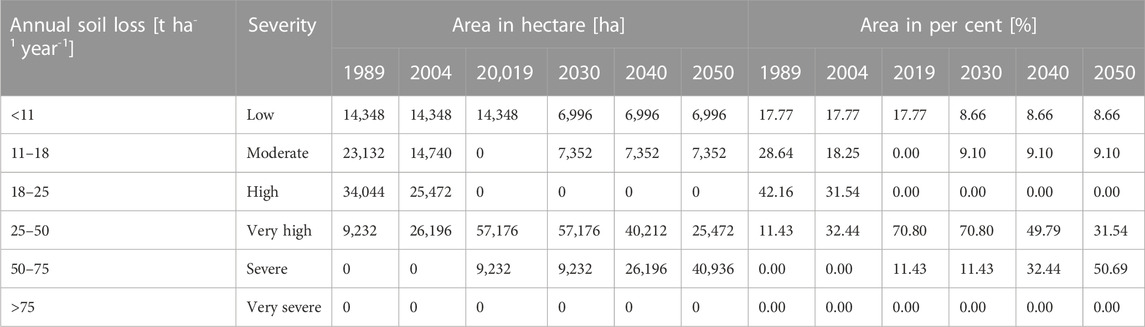
TABLE 5. Annual soil erosion and its severity for past and future scenarios of Fincha reservoir.
This classification pointed out significant dissimilarities across the Fincha watershed (Figure 6), which are mainly connected with the different LULC situations of each sub-watershed, as discussed in the next sections.
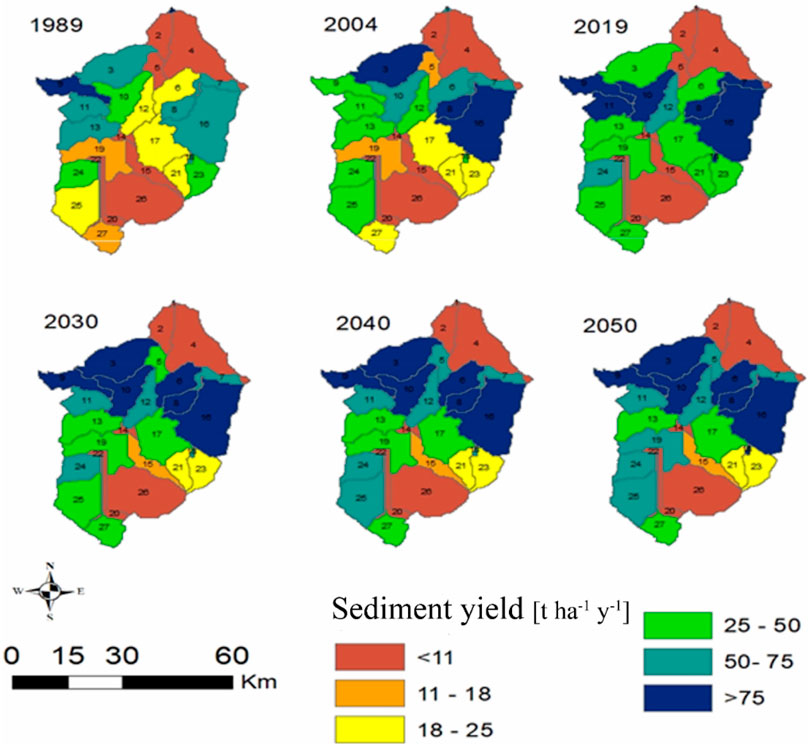
FIGURE 6. Spatial distribution of the sediment yield, subdivided for each sub-watershed.
The simulated annual sediment yield in the Fincha watershed varies significantly over space and time, ranging from 0.36 to 183.80 t ha−1 (Table 6), with an average of 32.51, 34.05, 41.20, 46.20, 51.19, 53.98 t ha−1 for 1989, 2004, 2019, 2030, 2040, and 2050, respectively. This indicates an increment of soil loss of 8.69 t ha−1 from 1989 to 2009, while the increase forecasted for the next 30 years (2019–2050) will be even more significant, reaching an annual sediment yield of 12.78 t ha−1.
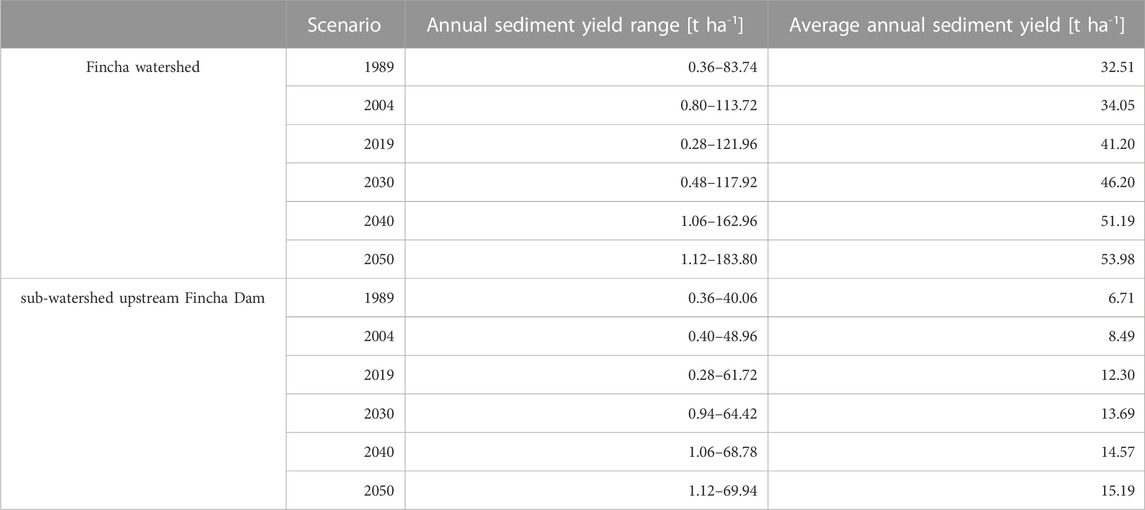
TABLE 6. Simulated sediment yield for the six scenarios, for both the overall Fincha watershed and the nine sub-watersheds upstream of the Fincha Dam.
Focusing only on the nine sub-watersheds upstream of the Fincha Dam, and therefore contributing to feeding the reservoir with sediments, the average annual sediment yield magnitude reduces, but a similar spatiotemporal variability is still visible (Table 6). The annual average sediment yield is expected to increase from 6.71 t ha−1 in 1989 to 15.19 t ha−1 in 2050.
Even if the average annual sediment yield of sub-watersheds located upstream of the Fincha Dam is lower than the average annual sediment yield of the whole watershed, the sediment amount entering the reservoir annually is still very high. In detail, 1.44, 1.85, 2.75, 3.08, 3.27, and 3.42 million tons in 1989, 2004, 2019, 2030, 2040, and 2050, respectively, can enter the Fincha dam lake which has a storage capacity of 660 million m3 (Duressa and Jubir, 2018; Duressa and Regasa, 2021). As shown in Figure 7, the sediment that can enter the Fincha Lake increases in time, following the expansion of agriculture, urbanization and deforestation.
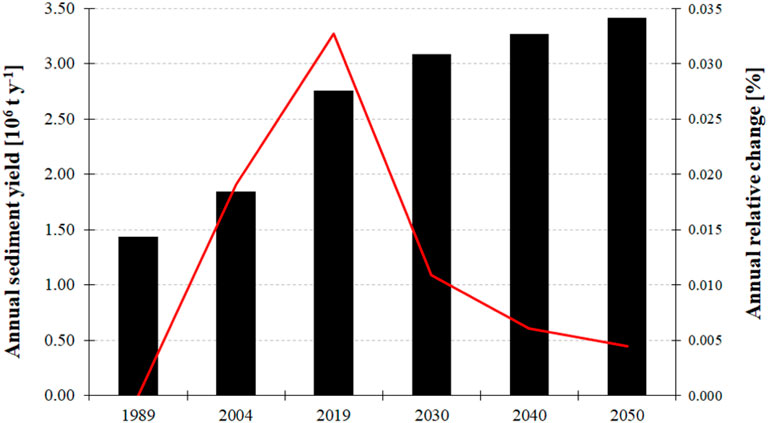
FIGURE 7. Annual sediment yield entering the Fincha Dam reservoir from the sub-watersheds located upstream (black bars). A slowdown in the annual sediment yield entering the Dam is observable by looking at the relative changes (red line).
The observed and simulated water and sediment discharges at the Fincha Dam showed an overall good agreement, indicating the reliability of the SWAT model in simulating these parameters in data-scarce regions. However, the model was unable to adequately reproduce the peaks in both water discharge and sediment yield. The underestimation of peak water flows generally results in an underestimation of the sediment peaks (Akoko et al., 2021), and such an underestimation is also a significant source of error in defining the overall sediment load of the watershed.
Moreover, the reliability of SWAT in estimating sediment yield is highly dependent on the availability of long-term datasets. In Ethiopia, long-term monitoring data are very rare, in particular in terms of sediment information. In the present work, a sediment rating curve was developed on the basis of the suspended sediment concentration measured occasionally at the Fincha Dam outlet. Even if based on a limited dataset, this curve is characterized by a strong correlation (R2 = 0.86) between recorded sediment and water flow data. However, uncertainties connected with using such a rating curve increase with the increase in water discharge, as only a few points were measured in high flow conditions (Figure 3). Despite the lack of data, the obtained curve is in line with similar investigations (Debela, 2022), at least for lower discharges.
The difference in peak sediment yields between observed and simulated data is comparable to the difference in estimating the peak flow. This problem, pointed out in similar studies, might be connected to the used model. For example, Leta et al. (2023) argue that the SWAT model’s underestimation of peak flows results in an underestimation of sediment peak. In their work, Dibaba et al. (2021) show errors in predicting sediment yield connected to the difficulties of the SWAT model in predicting second storm effects.
For the entire Fincha watershed, the mean annual soil loss rate was calculated as 32.51 t ha−1, 34.05 t ha−1, 41.20 t ha−1, 46.20 t ha−1, 51.19 t ha−1, 53.98 t ha−1 in 1989, 2004, 2019, 2030, 2040, 2050, respectively. This translates into an increase of annual soil loss of 8.69 t ha−1 during the last 30 years (1989–2019), and a forecasted increase of 12.78 t ha−1 for the next 3 decades, which will further negatively impact the overall watershed as well as the reservoirs located therein (Fincha, Amerti and Nashe). According to the study conducted on the Fincha watershed by Regasa and Nones (2022), for the last 30 years, deforestation, agriculture and urbanization have increased and this increment is expected for the future and is the reason for the increase of soil erosion and connected severity (Table 5).
As pointed out by Dibaba et al. (2021), tolerable soil loss is needed for maintaining ecosystem services without compromising the soil’s ability to continue providing those services in the future. The maximum tolerable soil loss (<11 t ha−1 year−1) estimated for Ethiopian watersheds is much lower than the estimated mean annual soil loss rate in the current study area (Girmay et al., 2020; Ayalew and Bharti, 2022), pointing out that the Fincha watershed is at very high of soil erosion. On the other part, the Fincha soil erosion rates are much lower than other local scale studies, which estimated an annual soil loss rate of 377.26 t ha−1 in the Chogo watershed, located very close to the current study area (Negash et al., 2021).
The mean annual sediment yields of the nine sub-watersheds located upstream of the Fincha Dam span will increase from 13.42 t ha−1 in 1989 to 30.38 t ha−1 in 2050. As the estimated mean annual soil loss rate is considerably higher than the maximum tolerable soil loss limit of 11 t ha−1, also this area is threatened by high erosion, with consequent negative effects on the socio-economy (Dibaba et al., 2021).
The proportion of area Fincha watershed at low erosion risk covered around 18% of the watershed during the past (reference years 1989, 2004, 2019) while a decrease is forecasted for the future (around 9% in 2030, 2040, 2050). On the other part, areas exposed to high erosion risk will increase, mainly because of deforestation in favour of agricultural land, expansion of urban areas and grassland, and growth and relocation of the population as stated (Regasa and Nones, 2022). This dynamic and rate of soil loss is a characteristic of many highland areas in Ethiopia (Weldu Woldemariam and Edo Harka, 2020), pointing out that the problem of soil erosion should be tackled at the national level, rather than with very local policies. The soil erosion risk showed a high spatial variation across the study landscape (Figure 6): low-risk areas were predicted downstream of the Fincha Dam, while areas characterized by the highest erosion risk are in the northwestern and eastern parts of the Fincha watershed. The evaluation of SY changes according to spatial location helps in pinpointing hotspot areas and areas where soil loss may be within acceptable limits.
Brhane and Mekonen (2009) focused on planning soil conservation strategies in the Medego watershed in Northern Ethiopia, using the Revised Universal Soil Loss Equation (RUSLE) to capture the annual soil loss. In their work, they pointed out that an acceptable soil loss is around 2 t ha−1 year−1. This value agrees with Dibaba et al. (2021), who estimated that the manageable soil loss in different Ethiopian watersheds ranges between 2 and 18 t ha−1 year−1.
Relatively less eroded areas were situated at lower elevations in the eastern and western parts of the sub-watershed, where the slope inclination is below 10% the above-mentioned factors made the area generate high soil loss risks. Similar results have been reported by earlier studies that directly correlated soil loss rate to terrain slope (Dibaba et al., 2021). The Nashe watershed, located in the Blue Nile region in Ethiopia, was the subject of a comparable study (Leta et al., 2023). In this work, the slope gradient, the percentage of farmland, and the amount of rainfall are all strongly correlated with the mean sediment production and the erosion hotspot zones. A high amount of sediment output was observed in steep sub-catchments with large amounts of land covered by agricultural activities and affected by high precipitation. Moreover, the authors have shown that, on slopes of less than 8%, the risk of erosion is typically low, while it increases for steeper slopes, especially in agricultural areas.
According to Regasa et al. (2021), the communities displaced from the reservoir areas were forced to resettle downstream of the dam, in areas characterized by lower soil loss. However, these communities were forced to relocate without receiving fair compensation because of the expansion of the number and dimension of reservoirs for hydropower production, taking them away from their farmland (Dibaba et al., 2020). Residents found it difficult to stay and were compelled to relocate due to the increased resettlement on unproductive lands and the relative depreciation of agricultural land, which resulted in further increasing soil erosion.
This study pointed out that most of the sub-watersheds of the Fincha watershed are highly threatened by soil erosion, and therefore require management and mitigation strategies to safeguard the environment and reduce the sediment yield entering the Fincha reservoir. However, such strategies could be costly and time-consuming, and cannot be applied at the same time all over the watershed. In this respect, the present investigation can provide information on what areas should be prioritized, but more studies are needed to propose effective management strategies to reduce soil erosion that also account for the sustainable socio-economic development of the area.
Despite the several assumptions made in this study, it is worth stressing here that the present results are consistent with the information reported by independent organizations such as UNESCO. Indeed, the sediment yield calculated at Addis Abeba in 2018 was around 67.53 t ha−1 year−1 (UNESCO WINS, 2023), indicating that the overall Ethiopia region is subjected to significant erosion.
Looking at similar studies performed worldwide, one can notice that Ethiopia is highly impacted by soil erosion. For example, Ait M’Barek et al. (2023) estimated the average annual soil loss of 4.71 t ha−1 year-1 in the El Grou watershed, located in north-central Morocco. In another study (Li et al., 2021), the authors show that the East African Highlands of Kagera Basin, located in Burundi (23% of the basin), Rwanda (34%), Tanzania (35%), and Uganda (8%), has an average soil erosion rate of 10.54 t ha−1 year−1 (Li et al., 2021).
The lack of appropriate monitoring of watershed-wide soil erosion, and, more importantly, the quantity of sediments entering and outgoing the Fincha reservoir, does not allow for a precise estimation of the lake sedimentation, therefore key questions connected to expected reservoir life and decrease of hydropower production connected with sedimentation remain unanswered, calling for additional research. To overcome the lack of in-field data, a potential option to be investigated in the next years is the use of remotely sensed data, taking advantage of examples developed in international projects such as HYPOS (hypos-project.eu). It is worth reminding that field information is still needed for calibrating and validating remote information, so more effort should be made in developing in-situ monitoring networks.
Using the Fincha watershed as a case study, the present research focused on understanding, via a modelling approach, the impact of LULC changes on soil erosion, comparing historical trends with future predictions. As pointed out by Regasa and Nones (2022), favouring agricultural land and settlements over natural forests might have a detrimental impact on soil erosion. In this work, it was demonstrated, via a numerical approach, that LULC changes are the major driver of soil erosion in the Fincha watershed, as it increased from 32.51 t ha−1 year−1 in 1989 to 41.20 t ha−1 year−1 in 2019, and it forecast to further increase till 53.98 t ha−1 year−1 in 2050 at the watershed scale. Such soil loss translates into sediment yield transported in the Fincha Dam reservoir, which was estimated to be around 1.44 million tons in 1989 and to increase to 3.42 million tons by 2050, eventually reducing the lifetime of the dam and negatively affecting the local socio-economy, which is largely connected with the functioning of the dam for hydropower and agricultural purposes.
Based on the estimated rate of mean annual soil loss, the erosion risk was classified into six classes, pointing out that the majority of the watershed is threatened by very high erosion risk, with severe erosion located in the central, northeastern, and northwestern sub-watersheds. As soil erosion represents a major threat to the current socio-economic development of the area, the classification proposed here could serve as a basis to prioritize future management strategies, aiming to reduce the impact of soil loss on the local environment and population.
Despite the uncertainties connected with the lack of data about soil erosion across the Fincha watershed and the assumption of LULC changes as the unique driver for soil erosion, neglecting additional drivers like climate change, the results proposed in this research are in line with literature evidence, and can provide practical implications for future land use management schemes. Indeed, the modelled scenarios can be used to guide water authorities, decision-makers, land managers, planners, and other interested parties to investigate potential management practices to reduce soil loss, particularly in areas characterized by high and severe erosion rates. This might result in improving the socio-economy in the Fincha watershed, eventually alleviating food scarcity and biodiversity losses.
The datasets presented in this study can be found in online repositories. The names of the repository/repositories and accession number(s) can be found below: https://dataportal.igf.edu.pl/group/fincha-dam-ethiopia-ncn.
Conceptualization, MR and MN; writing—original draft preparation, MR and MN; literature review, MR and MN; modelling, MR; data analysis, MR; supervision, MN; project administration, MN; funding acquisition, MN. All authors contributed to the article and approved the submitted version.
This research was funded by NCN National Science Centre Poland–call PRELUDIUM BIS-1, Grant Number 2019/35/O/ST10/00167. Project website: https://sites.google.com/view/lulc-fincha/home.
The authors declare that the research was conducted in the absence of any commercial or financial relationships that could be construed as a potential conflict of interest.
All claims expressed in this article are solely those of the authors and do not necessarily represent those of their affiliated organizations, or those of the publisher, the editors and the reviewers. Any product that may be evaluated in this article, or claim that may be made by its manufacturer, is not guaranteed or endorsed by the publisher.
Aga, A. O., Melesse, A. M., and Chane, B. (2020). An alternative empirical model to estimate watershed sediment yield based on hydrology and geomorphology of the basin in data-scarce rift valley lake regions, Ethiopia. Geosciences 10 (1), 31. doi:10.3390/geosciences10010031
Ait M’Barek, S., Bouslihim, Y., Rochdi, A., and Miftah, A. (2023). Effect of LULC data resolution on hydrological and erosion modeling using SWAT model. Model. Earth Syst. Environ. 9 (1), 831–846. doi:10.1007/s40808-022-01537-w
Akoko, G., Le, T. H., Gomi, T., and Kato, T. (2021). A review of SWAT model application in Africa. Water 13 (9), 1313. doi:10.3390/w13091313
Anaba, L. A., Banadda, N., Kiggundu, N., Wanyama, J., Engel, B., and Moriasi, D. (2016). Application of SWAT to assess the effects of land use change in the Murchison Bay catchment in Uganda. Comput. Water, Energy Env. Eng. 6 (1), 24–40. doi:10.4236/cweee.2017.61003
Aneseyee, A. B., Elias, E., Soromessa, T., and Feyisa, G. L. (2020). Land use/land cover change effect on soil erosion and sediment delivery in the Winike watershed, Omo Gibe Basin, Ethiopia. Sci. Total Environ. 728, 138776. doi:10.1016/j.scitotenv.2020.138776
Ang, R., Kinouchi, T., and Zhao, W. (2023). Sediment load estimation using a novel regionalization sediment-response similarity method for ungauged catchments. J. Hydrology 618, 129198. doi:10.1016/j.jhydrol.2023.129198
Anteneh, Y., Alamirew, T., Zeleke, G., and Kassawmar, T. (2023). Modeling runoff-sediment influx responses to alternative BMP interventions in the Gojeb watershed, Ethiopia, using the SWAT hydrological model. Environ. Sci. Pollut. Res. 30 (9), 22816–22834. doi:10.1007/s11356-022-23711-4
Aredo, M. R., Lohani, T. K., and Mohammed, A. K. (2023). Assessment of river response to water abstractions in the Weyib Watershed, Ethiopia. Int. J. River Basin Manag. 2023, 1–12. doi:10.1080/15715124.2023.2248488
Arnold, J. G., Kiniry, J. R., Srinivasan, R., Williams, J. R., Haney, E. B., and Neitsch, S. L. (2013). SWAT 2012 input/output documentation. Texas Water Resources Institute. Available at: https://swat.tamu.edu/docs/.
Arnold, J. G., Moriasi, D. N., Gassman, P. W., Abbaspour, K. C., White, M. J., Srinivasan, R., et al. (2012). Swat: Model use, calibration, and validation. Trans. ASABE 55 (4), 1491–1508. doi:10.13031/2013.42256
Arnold, J. G., Srinivasan, R., Muttiah, R. S., and Williams, J. R. (1998). Large area hydrologic modeling and assessment part I: Model development 1. JAWRA J. Am. Water Resour. Assoc. 34 (1), 73–89. doi:10.1111/j.1752-1688.1998.tb05961.x
Asselman, N. E. M. (2000). Fitting and interpretation of sediment rating curves. J. Hydrology 234 (3-4), 228–248. doi:10.1016/S0022-1694(00)00253-5
Assfaw, A. T. (2019). Calibration, validation and performance evaluation of SWAT model for sediment yield modelling in Megech reservoir catchment, Ethiopia. J. Environ. Geogr. 12 (3-4), 21–31. doi:10.2478/jengeo-2019-0009
Assfaw, A. T. (2020). Modeling impact of land use dynamics on hydrology and sedimentation of megech dam watershed, Ethiopia. Sci. World J. 2020, 1–20. doi:10.1155/2020/6530278
Ayalew, L. T., and Bharti, R. (2022). Modeling sediment yield of rib watershed, northwest Ethiopia. ISH J. Hydraulic Eng. 28 (1), 491–502. doi:10.1080/09715010.2020.1797544
Ayana, A. B., Edossa, D. C., and Kositsakulchai, E. (2012). Simulation of sediment yield using SWAT model in Fincha Watershed, Ethiopia. Agric. Nat. Resour. 46 (2), 283–297.
Ayele, G. T., Kuriqi, A., Jemberrie, M. A., Saia, S. M., Seka, A. M., Teshale, E. Z., et al. (2021). Sediment yield and reservoir sedimentation in highly dynamic watersheds: The case of koga reservoir, Ethiopia. Water 13 (23), 3374. doi:10.3390/w13233374
Betrie, G. D., Mohamed, Y. A., van Griensven, A., and Srinivasan, R. (2011). Sediment management modelling in the Blue Nile Basin using SWAT model. Hydrology Earth Syst. Sci. 15 (3), 807–818. doi:10.5194/hess-15-807-2011
Boru, G. F., Gonfa, Z. B., and Diga, G. M. (2019). Impacts of climate change on stream flow and water availability in Anger sub-basin, Nile Basin of Ethiopia. Sustain. Water Resour. Manag. 5, 1755–1764. doi:10.1007/s40899-019-00327-0
Brhane, G., and Mekonen, K. (2009). Estimating soil loss using Universal Soil Loss Equation (USLE) for soil conservation planning at Medego watershed, Northern Ethiopia. J. Am. Sci. 5 (1), 58–69.
Chekol, Y. G. (2019). Hydro-politics and the dynamics of the shifting ethio-Egyptian hydropolitical relations. Central Eur. J. Int. Secur. Stud. 13 (3), 88–100. doi:10.51870/cejiss.a130301
Cousino, L. K., Becker, R. H., and Zmijewski, K. A. (2015). Modeling the effects of climate change on water, sediment, and nutrient yields from the Maumee River watershed. J. Hydrology Regional Stud. 4, 762–775. doi:10.1016/j.ejrh.2015.06.017
Dakhlalla, A. O., and Parajuli, P. B. (2019). Assessing model parameters sensitivity and uncertainty of streamflow, sediment, and nutrient transport using SWAT. Inf. Process. Agric. 6 (1), 61–72. doi:10.1016/j.inpa.2018.08.007
Daramola, J., Ekhwan, T. M., Mokhtar, J., Lam, K. C., and Adeogun, G. A. (2019). Estimating sediment yield at Kaduna watershed, Nigeria using soil and water assessment tool (SWAT) model. Heliyon 5 (7), e02106. doi:10.1016/j.heliyon.2019.e02106
Debela, S. K. (2022). Prioritization of sediment yield at sub-watershed level using swat model in Finca’aa watershed, Abay Basin, Ethiopia. J. Sediment. Environ. 7 (2), 305–315. doi:10.1007/s43217-022-00099-2
Degife, A., Worku, H., and Gizaw, S. (2021). Environmental implications of soil erosion and sediment yield in Lake Hawassa watershed, south-central Ethiopia. Environ. Syst. Res. 10, 28–24. doi:10.1186/s40068-021-00232-6
Deore, S. J. (2005). Prioritization of micro-watersheds of upper Bhama Basin on the basis of soil erosion risk using remote sensing and GIS technology. PhD thesis. Pune, India: University of Pune.
Dibaba, W. T., Demissie, T. A., and Miegel, K. (2020). Drivers and implications of land use/land cover dynamics in Finchaa catchment, northwestern Ethiopia. Land 9 (4), 113. doi:10.3390/land9040113
Dibaba, W. T., Demissie, T. A., and Miegel, K. (2021). Prioritization of sub-watersheds to sediment yield and evaluation of best management practices in highland Ethiopia, Finchaa catchment. Land 10 (6), 650. doi:10.3390/land10060650
Dissanayake, D. M. S. L. B., Morimoto, T., Ranagalage, M., and Murayama, Y. (2019). Land-use/land-cover changes and their impact on surface urban heat islands: Case study of Kandy City, Sri Lanka. Climate 7 (8), 99. doi:10.3390/cli7080099
Djebou, D. C. S. (2018). Assessment of sediment inflow to a reservoir using the SWAT model under undammed conditions: A case study for the somerville reservoir, Texas, USA. Int. Soil Water Conservation Res. 6 (3), 222–229. doi:10.1016/j.iswcr.2018.03.003
Duressa, J. N., and Jubir, A. K. (2018). Dam break analysis and inundation mapping, case study of fincha’a dam in horro guduru wollega zone, oromia region, Ethiopia. Sci. Res. 6 (2), 29–38. doi:10.11648/j.sr.20180602.11
Duressa, J. N., and Regasa, M. S. (2021). Flood inundation mapping and risk analysis case of finchaa lake. Am. J. Environ. Sci. Eng. 5 (3), 53–62. doi:10.11648/j.ajese.20210503.11
Ebabu, K., Tsunekawa, A., Haregeweyn, N., Adgo, E., Meshesha, D. T., Aklog, D., et al. (2019). Effects of land use and sustainable land management practices on runoff and soil loss in the Upper Blue Nile basin, Ethiopia. Sci. Total Environ. 648, 1462–1475. doi:10.1016/j.scitotenv.2018.08.273
Franzoia, M., and Nones, M. (2017). Morphological reactions of schematic alluvial rivers: Long simulations with a 0-D model. Int. J. Sediment Res. 32 (3), 295–304. doi:10.1016/j.ijsrc.2017.04.002
Gassman, P. W., Reyes, M. R., Green, C. H., and Arnold, J. G. (2007). The soil and water assessment tool: Historical development, applications, and future research directions. Trans. ASABE 50 (4), 1211–1250. doi:10.13031/2013.23637
Gebretekle, H., Nigusse, A. G., and Demissie, B. (2022). Stream flow dynamics under current and future land cover conditions in Atsela Watershed, Northern Ethiopia. Acta Geophys. 70 (1), 305–318. doi:10.1007/s11600-021-00691-6
Gessese, A., and Yonas, M. (2008). Prediction of sediment inflow to Legedadi reservoir using SWAT watershed and CCHE1D sediment transport models. Nile Basin Water Eng. Sci. Mag. 1, 65–74.
Gessesse, B., Bewket, W., and Bräuning, A. (2015). Model-based characterization and monitoring of runoff and soil erosion in response to land use/land cover changes in the Modjo watershed, Ethiopia. Land Degrad. Dev. 26 (7), 711–724. doi:10.1002/ldr.2276
Gharibdousti, S. R., Kharel, G., and Stoecker, A. (2019). Modeling the impacts of agricultural best management practices on runoff, sediment, and crop yield in an agriculture-pasture intensive watershed. PeerJ 7, e7093. doi:10.7717/peerj.7093
Girmay, G., Moges, A., and Muluneh, A. (2020). Estimation of soil loss rate using the USLE model for Agewmariayam Watershed, northern Ethiopia. Agric. Food Secur. 9 (1), 9–12. doi:10.1186/s40066-020-00262-w
Hailu, A. D. (2022). Ethiopia hydropower development and Nile basin hydro politics. AIMS Energy 10 (1), 87–101. doi:10.3934/energy.2022006
Horowitz, A. J. (2003). An evaluation of sediment rating curves for estimating suspended sediment concentrations for subsequent flux calculations. Hydrol. Process. 17 (17), 3387–3409. doi:10.1002/hyp.1299
Jilo, N. B., Gebremariam, B., Harka, A. E., Woldemariam, G. W., and Behulu, F. (2019). Evaluation of the impacts of climate change on sediment yield from the logiya watershed, lower awash basin, Ethiopia. Hydrology 6 (3), 81. doi:10.3390/hydrology6030081
Kenea, U., Adeba, D., Regasa, M. S., and Nones, M. (2021). Hydrological responses to land use land cover changes in the Fincha’a Watershed, Ethiopia. Land 10 (9), 916. doi:10.3390/land10090916
Khanchoul, K., Amamra, A., and Saaidia, B. (2020). Assessment of sediment yield using swat model: Case study of kebir watershed, northeast of Algeria. Big Data Water Resour. Eng. (BDWRE) 2, 36–42. doi:10.26480/bdwre.02.2020.36.42
Khelifa, W. B., Hermassi, T., Strohmeier, S., Zucca, C., Ziadat, F., Boufaroua, M., et al. (2017). Parameterization of the effect of bench terraces on runoff and sediment yield by SWAT modeling in a small semi-arid watershed in Northern Tunisia. Land Degrad. Dev. 28 (5), 1568–1578. doi:10.1002/ldr.2685
Kidane, D., and Alemu, B. (2015). The effect of upstream land use practices on soil erosion and sedimentation in the Upper Blue Nile Basin, Ethiopia. Res. J. Agric. Environ. Manag. 4 (2), 55–68.
Kidane, M., Bezie, A., Kesete, N., and Tolessa, T. (2019). The impact of land use and land cover (LULC) dynamics on soil erosion and sediment yield in Ethiopia. Heliyon 5 (12), e02981. doi:10.1016/j.heliyon.2019.e02981
Kitila, G., Kabite, G., and Alamirew, T. (2015). Severity classification and characterization of waterlogged irrigation fields in the fincha'a valley sugar estate, Nile Basin of western Ethiopia. Hydrology Curr. Res. 6 (2), 1. doi:10.4172/2157-7587.1000209
Krysanova, V., and White, M. (2015). Advances in water resources assessment with SWAT - an overview. Hydrological Sci. J. 60 (5), 771–813. doi:10.1080/02626667.2015.1029482
Leta, M. K., Demissie, T. A., and Tränckner, J. (2021b). Hydrological responses of watershed to historical and future land use land cover change dynamics of Nashe watershed, Ethiopia. Water 13 (17), 2372. doi:10.3390/w13172372
Leta, M. K., Demissie, T. A., and Tränckner, J. (2021a). Modeling and prediction of land use land cover change dynamics based on land change modeler (LCM) in Nashe watershed, Upper Blue Nile basin, Ethiopia. Sustainability 13 (7), 3740. doi:10.3390/su13073740
Leta, M. K., Waseem, M., Rehman, K., and Tränckner, J. (2023). Sediment yield estimation and evaluating the best management practices in Nashe watershed, Blue Nile Basin, Ethiopia. Environ. Monit. Assess. 195 (6), 716. doi:10.1007/s10661-023-11337-z
Li, C., Li, Z., Yang, M., Ma, B., and Wang, B. (2021). Grid-scale impact of climate change and human influence on soil erosion within East African highlands (Kagera Basin). Int. J. Environ. Res. Public Health 18 (5), 2775. doi:10.3390/ijerph18052775
Lin, F., Chen, X., Yao, H., and Lin, F. (2022). SWAT model-based quantification of the impact of land-use change on forest-regulated water flow. Catena 211, 105975. doi:10.1016/j.catena.2021.105975
Mariye, M., Mariyo, M., Changming, Y., Teffera, Z. L., and Weldegebrial, B. (2022). Effects of land use and land cover change on soil erosion potential in berhe district: A case study of legedadi watershed, Ethiopia. Int. J. River Basin Manag. 20 (1), 79–91. doi:10.1080/15715124.2020.1767636
Megersa, T., Nedaw, D., and Argaw, M. (2019). Combined effect of land use/cover types and slope gradient in sediment and nutrient losses in Chancho and Sorga sub watersheds, East Wollega Zone, Oromia, Ethiopia. Environ. Syst. Res. 8 (1), 24–14. doi:10.1186/s40068-019-0151-3
Mekuriaw, T. (2019). Evaluating impact of land-use/land-cover change on surface runoff using Arc SWAT model in sore and geba watershed. Ethiop. J. Environ. Earth Sci. 10, 7–17. doi:10.7176/JEES/9-10-02
Miheretu, B. A., and Yimer, A. A. (2018). Estimating soil loss for sustainable land management planning at the Gelana sub-watershed, northern highlands of Ethiopia. Int. J. River Basin Manag. 16 (1), 41–50. doi:10.1080/15715124.2017.1351978
Moriasi, D. N., Wilson, B. N., Douglas-Mankin, K. R., Arnold, J. G., and Gowda, P. H. (2012). Hydrologic and water quality models: Use, calibration, and validation. Trans. ASABE 55 (4), 1241–1247. doi:10.13031/2013.42265
Negash, D. A., Moisa, M. B., Merga, B. B., Sedeta, F., and Gemeda, D. O. (2021). Soil erosion risk assessment for prioritization of sub-watershed: The case of Chogo watershed, horo guduru wollega, Ethiopia. Environ. Earth Sci. 80 (17), 589–611. doi:10.1007/s12665-021-09901-2
Negewo, T. F., and Sarma, A. K. (2023). Sustainable and cost-effective management of degraded sub-watersheds using ecological management practices (EMPs) for genale basin, Ethiopia. J. Hydrology 619, 129289. doi:10.1016/j.jhydrol.2023.129289
Neitsch, S. L., Arnold, J. G., and Kiniry, J. R. (2011). SWAT user manual, version 2009. Texas, USA: Texas Water Resources Institute Technical Report, A&M University. Available at: https://swat.tamu.edu/media/99192/swat2009-theory.pdf.
Obengo, J. O. (2016). Hydropolitics of the nile: The case of Ethiopia and Egypt. Afr. Secur. Rev. 25 (1), 95–103. doi:10.1080/10246029.2015.1126527
Pandey, A., Bishal, K. C., Kalura, P., Chowdary, V. M., Jha, C. S., and Cerdà, A. (2021). A soil water assessment tool (SWAT) modeling approach to prioritize soil conservation management in river basin critical areas coupled with future climate scenario analysis. Air, Soil Water Res. 14, 117862212110213. doi:10.1177/11786221211021395
Pennock, D. (2019). Soil erosion: The greatest challenge for sustainable soil management. Food & Agriculture Org, 100. Available at: https://www.fao.org/3/ca4395en/ca4395en.pdf.
Phuong, T. T., Thong, C. V. T., Ngoc, N. B., and Van Chuong, H. (2014). Modeling soil erosion within small mountainous watershed in central Vietnam using GIS and SWAT. Resour. Environ. 4 (3), 139–147. doi:10.5923/j.re.20140403.02
Pomázi, F., and Baranya, S. (2022). Acoustic based assessment of cross-sectional concentration inhomogeneity at a suspended sediment monitoring station in a large river. Acta Geophys. 70 (5), 2361–2377. doi:10.1007/s11600-022-00805-8
Pulighe, G., Bonati, G., Colangeli, M., Traverso, L., Lupia, F., Altobelli, F., et al. (2019). Predicting streamflow and nutrient loadings in a semi-arid Mediterranean watershed with ephemeral streams using the SWAT model. Agronomy 10 (1), 2. doi:10.3390/agronomy10010002
Qiu, Z., and Wang, L. (2014). Hydrological and water quality assessment in a suburban watershed with mixed land uses using the SWAT model. J. Hydrologic Eng. 19 (4), 816–827. doi:10.1061/(ASCE)HE.1943-5584.0000858
Rathjens, H., and Oppelt, N. (2012). SWAT model calibration of a grid-based setup. Adv. Geosciences 32, 55–61. doi:10.5194/adgeo-32-55-2012
Regasa, M. S., Nones, M., and Adeba, D. (2021). A review on land use and land cover change in Ethiopian basins. Land 10 (6), 585. doi:10.3390/land10060585
Regasa, M. S., and Nones, M. (2022). Past and future land use/land cover changes in the Ethiopian Fincha sub-basin. Land 11 (8), 1239. doi:10.3390/land11081239
Sadeghi, S. H., and Saeidi, P. (2010). Reliability of sediment rating curves for a deciduous forest watershed in Iran. Hydrological Sci. J. 55 (5), 821–831. doi:10.1080/02626667.2010.489797
Sahar, A. A., Hassan, M. A., and Abd Jasim, A. (2021). Estimating the volume of sediments and assessing the water balance of the badra basin, eastern Iraq, using swat model and remote sensing data. Iraqi Geol. J. 54, 88–99. doi:10.46717/igj.54.2C.9Ms-2021-09-28
Senti, E. T., Tufa, B. W., and Gebrehiwot, K. A. (2014). Soil erosion, sediment yield and conservation practices assessment on Lake Haramaya Catchment. World J. Agric. Sci. 2 (7), 186–193.
Setegn, S. G., Dargahi, B., Srinivasan, R., and Melesse, A. M. (2010). Modeling of sediment yield from anjeni-gauged watershed, Ethiopia using SWAT model 1. JAWRA J. Am. Water Resour. Assoc. 46 (3), 514–526. doi:10.1111/j.1752-1688.2010.00431.x
Setegn, S. G., Srinivasan, R., and Dargahi, B. (2008). Hydrological modelling in the lake tana basin, Ethiopia using SWAT model. Open Hydrology J. 2 (1), 49–62. doi:10.2174/1874378100802010049
Sharma, A., Patel, P. L., and Sharma, P. J. (2022). Influence of climate and land-use changes on the sensitivity of SWAT model parameters and water availability in a semi-arid river basin. Catena 215, 106298. doi:10.1016/j.catena.2022.106298
Swami, V. A., and Kulkarni, S. S. (2016). Simulation of runoff and sediment yield for a kaneri watershed using SWAT model. J. Geoscience Environ. Prot. 4 (01), 1–15. doi:10.4236/gep.2016.41001
Tefera, B., and Sterk, G. (2008). Hydropower-induced land use change in Fincha'a watershed, western Ethiopia: Analysis and impacts. Mt. Res. Dev. 28 (1), 72–80. doi:10.1659/mrd.0811
Tefera, B., and Sterk, G. (2010). Land management, erosion problems and soil and water conservation in Fincha’a watershed, western Ethiopia. Land Use Policy 27 (4), 1027–1037. doi:10.1016/j.landusepol.2010.01.005
Tegegne, G., Park, D. K., and Kim, Y. O. (2017). Comparison of hydrological models for the assessment of water resources in a data-scarce region, the Upper Blue Nile River Basin. J. Hydrology Regional Stud. 14, 49–66. doi:10.1016/j.ejrh.2017.10.002
Temiz, T., Sonmez, O., Dogan, E., Oner, A., and Opan, M. (2022). Evaluation of the effects of land-use change and increasing deforestation in the Sapanca Basin on total suspended solids (TSS) movement with predictive models. Acta Geophys. 70 (3), 1331–1347. doi:10.1007/s11600-022-00783-x
Tilahun, A. K., Verstraeten, G., Chen, M., Gulie, G., Belayneh, L., and Endale, T. (2023). Temporal and spatial variability of suspended sediment rating curves for rivers draining into the Ethiopian Rift Valley. Land Degrad. Dev. 34 (2), 478–492. doi:10.1002/ldr.4473
Tomkins, K. M. (2014). Uncertainty in streamflow rating curves: Methods, controls and consequences. Hydrol. Process. 28 (3), 464–481. doi:10.1002/hyp.9567
UNESCO WINS (2023). Sediment yield map. Available at: http://ihp-wins.unesco.org/layers/datastore:geonode:SedYield_calibrated_NC.
Weldu Woldemariam, G., and Edo Harka, A. (2020). Effect of land use and land cover change on soil erosion in Erer sub-basin, Northeast Wabi Shebelle Basin, Ethiopia. Land 9 (4), 111. doi:10.3390/land9040111
Winchell, M., Srinivasan, R., Di Luzio, M., and Arnold, J. (2007). ArcSWAT interface for SWAT 2005 user’s guide, blackland research center, Texas agricultural experiment station, temple. Available at: https://colinmayfield.com/public/PDF_files/ArcSWAT_Documentation.pdf.
Xue, C., Chen, B., and Wu, H. (2014). Parameter uncertainty analysis of surface flow and sediment yield in the Huolin Basin, China. J. Hydrologic Eng. 19 (6), 1224–1236. doi:10.1061/(ASCE)HE.1943-5584.0000909
Yasir, M., Hu, T., and Abdul Hakeem, S. (2020). Simulating reservoir induced Lhasa streamflow variability using ArcSWAT. Water 12 (5), 1370. doi:10.3390/w12051370
Yesuf, H. M., Assen, M., Alamirew, T., and Melesse, A. M. (2015). Modeling of sediment yield in Maybar gauged watershed using SWAT, northeast Ethiopia. Catena 127, 191–205. doi:10.1016/j.catena.2014.12.032
Yuan, L., and Forshay, K. J. (2019). Using SWAT to evaluate streamflow and lake sediment loading in the Xinjiang River Basin with limited data. Water 12 (1), 39. doi:10.3390/w12010039
Keywords: Ethiopia, Fincha watershed, sediment yield, SWAT model, land use land cover (LULC)
Citation: Regasa MS and Nones M (2023) SWAT model-based quantification of the impact of land use land cover change on sediment yield in the Fincha watershed, Ethiopia. Front. Environ. Sci. 11:1146346. doi: 10.3389/fenvs.2023.1146346
Received: 17 January 2023; Accepted: 28 August 2023;
Published: 07 September 2023.
Edited by:
Xiaoyang Zhang, South Dakota State University, United StatesReviewed by:
Rui Manuel Vitor Cortes, University of Trás-os-Montes and Alto Douro, PortugalCopyright © 2023 Regasa and Nones. This is an open-access article distributed under the terms of the Creative Commons Attribution License (CC BY). The use, distribution or reproduction in other forums is permitted, provided the original author(s) and the copyright owner(s) are credited and that the original publication in this journal is cited, in accordance with accepted academic practice. No use, distribution or reproduction is permitted which does not comply with these terms.
*Correspondence: Michael Nones, bW5vbmVzQGlnZi5lZHUucGw=
Disclaimer: All claims expressed in this article are solely those of the authors and do not necessarily represent those of their affiliated organizations, or those of the publisher, the editors and the reviewers. Any product that may be evaluated in this article or claim that may be made by its manufacturer is not guaranteed or endorsed by the publisher.
Research integrity at Frontiers
Learn more about the work of our research integrity team to safeguard the quality of each article we publish.