 Haoyang Lu
 Yajiao Tang2
 Dan Tan
- 1College of Bangor, Central South University of Forestry and Technology, Changsha, China
- 2College of Economics, Central South University of Forestry and Technology, Changsha, China
- 3College of Computer Science and Engineering, Central South University, Changsha, China
- 4Research Center for High-quality Development of Industrial Economy, Central South University of Forestry and Technology, Changsha, China
Introduction: Water, as an essential strategic resource, is diminishing; this has been framed as a financial risk. We aim to quantitively investigate the impact of water use and technology on the stock market and compare the differences in China and Japan, which represent emerging and mature markets, respectively.
Method: We constructed three models using the difference generalized method of moments. The first and second models focused on how water use could influence stock market volatility and returns; the third model added technology as an interaction to explore its impact on the above mechanism. We used an ARIMA-EGARCH model to predict the trend of marginal stock market return with an increase in industrial water use in the next 5 years.
Results and Discussion: The results show that 1) water use increases the stock market volatility in both countries, but Japan shows a greater increase than China; 2) water use has a negative impact on stock market returns in China and a positive impact in Japan; 3) technology plays a positive role in the second model, while the ARIMA-EGARCH results correspond to the first two conclusions, which verifies the reasonability of the models. We conclude that heterogeneity exists in the two different market types because of technology level.
1 Introduction
The world is experiencing a growing water crisis. As one of the most common resources, water is a natural and vital strategic resource and associated with not only human welfare but also ecological health. However, few investors are aware of the importance of water sustainability criteria in their investment decisions, and the lack of awareness could indicate water as a new financial risk (Hogeboom et al., 2018). For example, water scarcity, flooding, and pollution, which result in supply chain disruption, impaired production, active suspensions, and increased production costs, have detrimental effects on business activities (Lankford, 2013; Sojamo, 2015; Rudebeck, 2019), and such business risks result in increased stock market risks (Larson et al., 2012). Moreover, the stock market is positively and robustly correlated with contemporaneous and future economic development (Laopodis and Papastamou, 2016). Accordingly, we investigate how water use affects both stock market returns and volatility in Japan and China.
In the financial service sector, rating agencies identify, define, and quantify risks, and financial institutions are increasingly relying on them (Kareiva et al., 2015; Berg et al., 2019; Yu et al., 2020). One of these rating systems focuses on evaluating a firm’s risk based on environmental, social, and governance (ESG) indicators (Kölbel and Busch, 2021), including water. However, although many evaluations of water risks have been conducted at the firm level, few have been conducted at the stock market level. Moreover, most ESG providers only consider a minimal set of water indicators, such as “water withdrawal,” which may lead to an incomprehensive understanding of the risks associated with water (Berg et al., 2019; Rudebeck, 2022). Thus, more research is needed to unpack how water, as a financial risk, influences the stock market in different regions (Rudebeck, 2022). Further, because most environmental problems are complex, including those related to water, we may lose valid information if we consider water in isolation (Dimson et al., 2020). Therefore, many questions remain unanswered.
Accordingly, we develop three heuristic economic models to quantitatively examine the relationship between water use and the stock market in China and Japan, which represent emerging and mature markets, respectively. The first model explores the impact of water use on stock market volatility. The second model explores how water use influences stock market returns. To explore the extra factors influencing the mechanism between water use and stock market returns and volatility, Kubotera suggests that “endeavors in the technology of plasticity should continue to be devoted toward the reduction of energy and resource consumption by expanding the number of its relevant fields in production engineering” (Kubotera, 1996). While Kubotera’s study does not directly discuss water, it does illustrate how technology plays an essential role in the solutions to resource consumption. Therefore, in our third model, we add the interaction between water use and technology to the second model. To demonstrate the accuracy and applicability of the three models, we apply the ARIMA-EGARCH model to predict trends in marginal stock market returns with an increase in industrial water use over the next 5 years.
Our study can make several contributions.
1. We innovatively and quantitively discuss the financialization of water in China and Japan and, from a heuristic perspective, investigate the role that technology plays in the process of the financialization of water.
2. We use the ARIMA-EGARCH model to predict trends in marginal stock market returns with increased industrial water use over the next 5 years, and the corresponding results demonstrate not only the reasonability of our three models but also the applicability of our research.
3. The proposed model is efficient for making judgements, which the experimental results support.
4. We compare the similarities and heterogeneity directly between two different types of markets (i.e., emerging and mature markets), by choosing China and Japan as our study objects. Therefore, this study’s results can be applied in both emerging and mature markets.
2 Literature review
In essence, water itself is increasingly framed as a financial risk. Tracing the history of financialization of water, the process can be identified as five distinct phases: 1) water as public good, 2) water services as financial, 3) water risk as financial, 4) water as an economic risk, and 5) water as a financial risk (Rudebeck, 2022).
In the first stage, water is seen as a common good, belonging to the public (Gleick, 1998; McCarthy, 2005; Bakker, 2007). The second stage emphasizes that markets play a larger role as water services become a primary focus area for privatization. The network of services of water instead of itself leads to “the neoliberalisation of water services” and create new asset streams (Bresnihan, 2016; Fields, 2018). Distinct to the third phase is the financialization of the risk that water may pose, such as index-based insurance contracts. Further, how such instruments can enable water-dependent industries, such as utilities, shipping, or agriculture, which are exposed to water risks, to hedge against droughts or floods has been widely investigated (Meyer et al., 2016; Baum et al., 2018). The fourth phase is defined by framing water as a business risk by focusing on the amount of water embedded in corporate operations and supply chains, and the risks this presents as water insecurity rises (Aldaya et al., 2010; Aldaya et al., 2012; Sojamo et al., 2012). In the fifth stage, economic risks to which companies are exposed translate to investors through their holdings in those companies. Water itself plays a role in investor decision-making. However, few studies evaluate the extent to which investors include water sustainability criteria in their investment decisions (Nikolaou et al., 2014; Hogeboom et al., 2018).
Framing water as a financial risk is an emerging field in which few studies examine the relationship between water and the stock market. However, some previous studies have indirectly investigated the relationship between water and the stock market. Zheng report a negative effect between water and corporate finance performance in China, which cannot be reduced by water investment (Zheng et al., 2022). Moreover, reduced corporate financial performance can determine the decrease in stock price (Brealey et al., 2011). Further, Meyer et al. (2016) illustrate the risk of financial loss during low lake level periods in the Great Lakes in the United States (Meyer et al., 2016). If the mean water level is reduced by one standard deviation, the frequency with which these portfolios would underperform may be twice that of the original (Meyer et al., 2017). Moreover, effective drought-related risk management can significantly reduce the average total net cost by 17% over a 10-year period in the United States (Baum and Characklis, 2020). Variability in streamflow can lead to reduced generation from hydropower producers, resulting in financially disruptive revenue reduction (Foster et al., 2015). Therefore, these prior findings suggest that water use can result in increased costs, which will negatively affect corporate financial performance and stock market prices.
However, because of water use restrictions, expected losses are predicted to increase from 0.7 million dollars in 2015 to 1.2 million dollars in 2025 (Zeff and Characklis, 2013), revealing the different opinion that water use can prevent loss and increase performance and stock prices. Thus, prior research on different regions shows heterogeneity, which can be caused by many factors, including the measurement of objectives, geographical factors, and comprehensive development levels in a specific region. Our study considers technology as the extra factor that influences the mechanism between water use and the stock market, and speculates that it could be one of the causes of heterogeneity. Some literature supports this view. Water-saving technologies can save water and improve production when using fixed water (Huang et al., 2017). Meanwhile, firms with more technology spillover can earn greater annualized returns (Tseng, 2022).
In summary, our research aims to provide a reference to help other countries or regions reconsider their water management. This is because China and Japan are representative of emerging and mature markets, respectively, and water scarcity requires global relative firms, with public initiatives, to generate new funds and investments (Piñeiro-Chousa et al., 2020).
3 Materials
3.1 Data collection
3.1.1 Water supply
We choose total water use and industrial water use as the indicators of water use at the country level from 2005 to 2019, except 2008. We excluded 2008 because of the financial crisis. The data on China and Japan are from China Statistical Yearbook from 2001 to 2020 and Japan Statistical Yearbook from 2011 to 2022, respectively.
3.1.2 Stock market index
The raw data used in this study are the monthly MSCI closing composite stock price index, for the period of 31 January 2005 to 31 December 2019.
3.1.3 Technology level
We can use the concept of water productivity to understand water technology level. Lucas uses effective labor, which includes both the number and skill level of workers, as a production factor in human capital theory (Lucas, 2004). Similar to the concept of effective labor, the number of factors and productive capacity are involved in production. We can define water productivity based on both numerical and technological properties as follows:
where Y is the output, K is the capital stock, L is the labor input, W is the water input, A is the technology in other sectors, and H is the water technology.
Following Qiao, the water technology variable is represented by total-factor water efficiency and calculated using data envelopment analysis (DEA) (Qiao et al., 2022). We obtained data on GDP, capital input, labor input, and water input from the China Statistical Yearbook and Japan Statistical Yearbook. Capital input was calculated using the perpetual inventory method with an economic depreciation rate of 10% using constant prices with 2005 as the base period.
3.2 Data pre-processing
To explore the effect of water use on stock market from multiple perspectives, we created a new variable, water use structure, as follows:
Stock market return is commonly written using the following function:
where pt refers to the closing composite stock price index in month t. In addition, according to modern finance theory, we use average returns of each month to represent the yearly stock market returns (Brealey et al., 2011).
where returni represents yearly stock market returns, and returni,t represents returns in month t of year i. In addition, we use the standard deviation of the stock index for 1 year to represent stock market volatility. Total-factor water efficiency is a composite indicator that reflects the integrated relationship between water inputs and economic outputs. To deal with these variables, we use a DEA model. The purpose of DEA is to construct a non-parametric envelope leading line with valid points on the production Frontier and invalid points below the Frontier. Assuming there are N DMUs and each unit uses K input factors to produce the type of output, the efficiency of the ith DMU can be solved using the following linear programming equation:
where θ is a scalar quantity, λ is an N × 1 constant vector, and the resolved value of θ is the efficiency value of DMUi. If θ = 1, the unit is technically effective. Based on the definition of efficiency and the above analysis (Hu et al., 2006; Qiao et al., 2022), we can define total-factor water efficiency as follows:
where WTEt, AWIt, TWIt, LWIt represent total-factor water efficiency, actual water input, water reduction target, and radial adjustment of the water input in year t, respectively, and WTEt falls between [0,1]. When WTE = 1, no water is wasted, and water technology is in its most advanced stage. When WTE < 1, some water input can be saved.
The output index is GDP, and the input indices include capital, labor, and water resources. Table 1 shows the results. Industrial water use is observed t be larger than the stock market return and volatility (Tables 2, 3). To avoid disrupting the data characteristics, we log the data as follows:
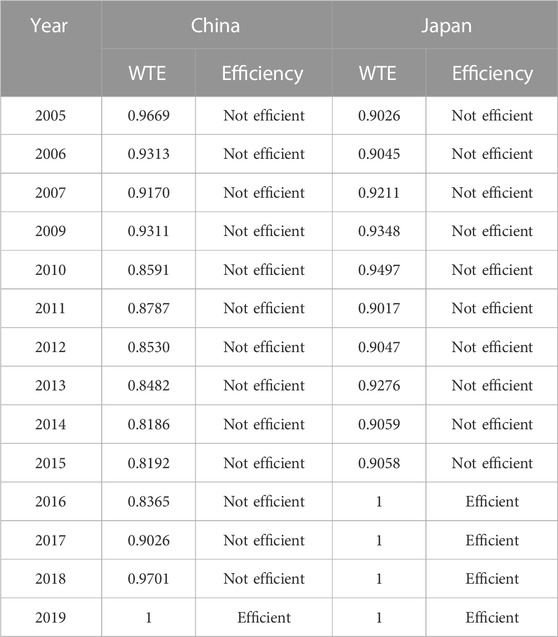
TABLE 1. DEA model results for China and Japan.
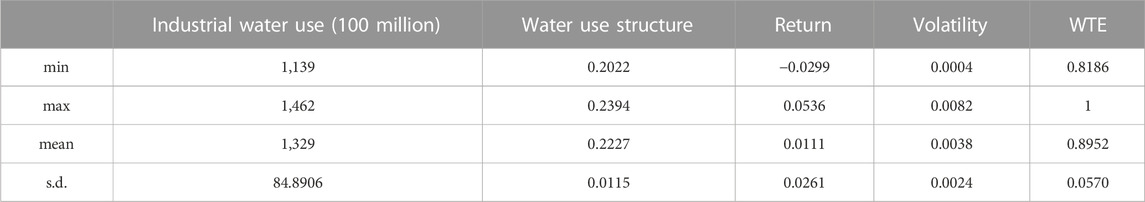
TABLE 2. Descriptive statistics for China.
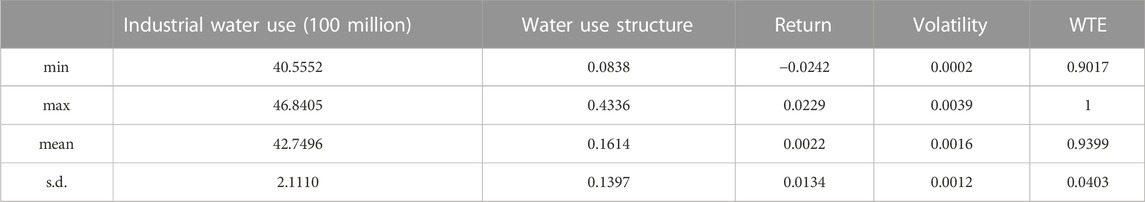
TABLE 3. Descriptive statistics for Japan.
4 Methods
Algorithm 1. Pseudo-code of the Heuristic Models and ARIMA-EGARCH.
Input: input parameters: stock market return, stock market volatility, industrial water use, water use structure, WTE.
1 Evaluate the coefficients of Eqs. 8–11;
2 Evaluate the fit of solutions;
3 Find the difference order d to obtain the smooth series;
4 Find the autoregressive times p and sliding average terms q;
5 Execute the operation using Eqs. 14, 16;
Output: output result.
4.1 Relationship between water use and stock market volatility
Following Papadamou, we create a research framework as follows (Papadamou et al., 2017):
where vt represents stock market volatility in year t, and ϵ is the random error.
4.2 Relationship between water use and stock market returns
We designed a similar framework to Eq. 8, and based on several previous studies, a one-period lagged variable was added as follows (Kamstra et al., 2003; Basher et al., 2018; Zheng et al., 2022):
where r refers to stock market return, t represents the year t, and ϵ is the random error.
4.3 Role of technology in the mechanism between water use and stock market returns
When considering the effect of technology on the financialization of water, we add the interaction between technology and the corresponding item, as follows:
where WTE refers to technology.
Eq. 10 explores how total water supply affects stock market return when the technology level improves by one unit. When β2 and β4 are in opposing directions, technology plays a role in weakening the mechanism between total water supply and stock market returns, and vice versa. This explanation also holds for Eq. 11. Further, to investigate the effect of technology on stock market returns, we add technology as an independent variable into Eq. 9:
4.4 Forecasting stock market return change per industrial water use using the ARIMA-EGARCH model
To verify the reasonableness and applicability of the three models, and owing to a large gap in the amount of industrial water use between China and Japan (2 and 3), we use the ARIMA model to predict marginal stock returns:
In the ARIMA (p,d,q) model, AR represents the “autoregressive,” p is the number of autoregressive terms, MA represents the “sliding average,” q is the number of sliding average terms, and d is the number of difference orders required to obtain a smooth series. Thus, we obtain the following:
where Δdmrt denotes the series of rt after d difference transformations, and rt denotes the stock market return at time t. ϵt denotes the random errors at time t, which are mutually independent white noise series and obey a normal distribution, with mean 0 and variance constant σ2. φi (i = 1, 2, 3, …, p) and θj (j = 1, 2, 3, …, q) are the parameters to be estimated, whose orders are p and q. Thus, the above model is denoted as ARIMA (p,d,q).
If the forecasted marginal returns are greater than 0, an increase in industrial water use can have a positive effect on stock market returns. Further, when an upward trend of marginal returns occurs, the positive influence of industrial water will be stronger over time, and vice versa.
To avoid the possibility that the residual series of the ARIMA model may have ARCH effects, we also use a Generalized Auto Regressive Conditional Heteroskedasticity (GARCH) model to adjust the future trend, which is a tailor-made regression model for financial data. The general GARCH (p,q) model can be expressed as follows:
with δ > 0, βi ≥ 0 (i = 1, …, p), and αj ≥ 0 (j = 1, …, q) to ensure that the conditional variance is positive, and the residual of ARIMA model denotes ht. However, to capture the asymmetry of positive and negative asset yields in the GARCH model, Nelson proposed the EGARCH model as follows (Nelson, 1996):
with
5 Computational method
The ordinary least squares method results in underfitting with serious endogeneity and multicollinearity issues; therefore, we chose the difference generalized method of moments (GMM) to solve Eqs. 8–12 using R4.1.1. The difference GMM does not require knowledge of the exact distribution of the random error terms, thereby allowing for heteroskedasticity and serial correlation of the random error terms. Moreover, it yields a more efficient parameter estimator than other parameter estimation methods. We calculate the weight of the entropy system and ARIMA-EGARCH model using Python 3.8.
6 Results
6.1 Relationship between water use and stock market volatility
The results in Table 4 show a positive relationship between industrial water use and stock market volatility, indicating that industrial water use can lead to more significant stock market volatility in both China and Japan. However, the impact in Japan is stronger than that in China, as shown by their coefficients of 0.007 and 0.003, respectively. This may be because of the degree of government intervention in the market economy. China’s market economy is integrated with the socialist system, and one of its characteristics is that the public ownership system is the mainstay. Multiple ownership economies are developing together in terms of ownership structure. Therefore, the nation protects and controls its stock market to a certain extent.
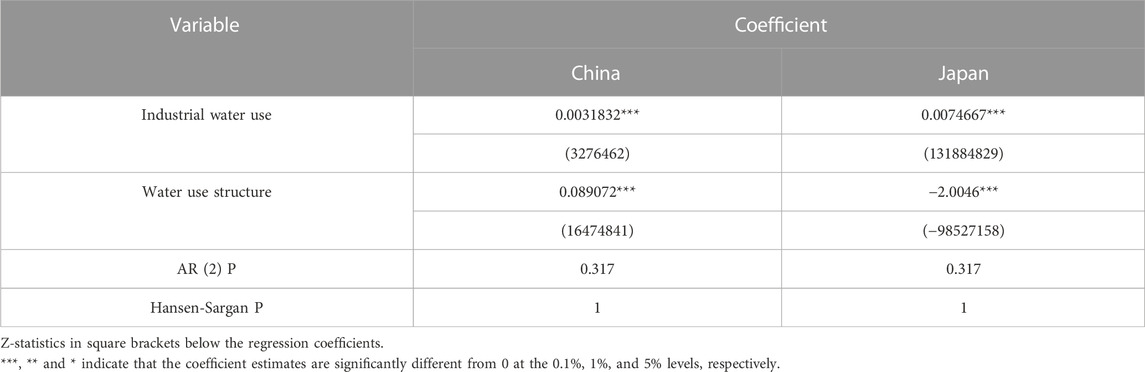
TABLE 4. Relationship between water use and stock market volatility.
Water use structure also has a strong positive impact on stock market volatility in China, while the impact in Japan is the opposite. The water use structure refers to the ratio of industrial water use to total water use. A positive coefficient indicates that, if more water is used for industry rather than agriculture, then the stock market will generate higher risk. Therefore, a 1% increase in the water use structure will result in 0.891 more risk in China, and the coefficient for Japan (−2.005) indicates that water use structure plays a role in lowering market volatility in Japan. Thus, we conclude that China may have room for improvement in optimizing its water use structure based on these results.
6.2 Relationship between water use and stock market returns
The contradictory results shown in Table 5 indicate that heterogeneity exists when exploring the impact of industrial water use on stock market returns. In China, industrial water use and water use structure can lead to decreased stock market returns. However, a positive effect is observed for Japan. Water use structure plays a more critical role in the stock market in China, which has a coefficient of −0.8237. Thus, China should make optimizing water outcomes a top priority, which corresponds to the conclusion drawn above when analyzing the results in Table 4. Further, because the water use structure may be more reasonable and better, an increase in water use structure will not lead to any changes in the stock market. As a raw material for production, water can affect the stock market through corporate supply chains, which are closely related to stock prices. The positive effect of industrial water use on the stock market shows that corporations use water efficiently, and may even resell it by transferring water to the raw material of new commodities.
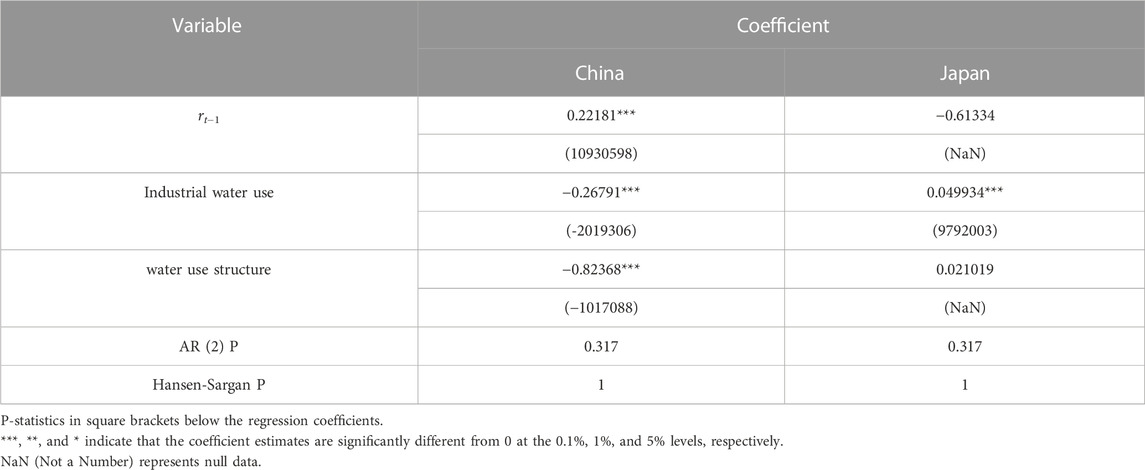
TABLE 5. Relationship between water use and stock market returns.
6.3 Role of technology in the mechanism between water use and stock market returns
Table 6 shows that technology plays a positive role in stock market returns, which are 0.49 and 0.037, respectively. The results in Table 7 show that the coefficients of the interaction between industrial water use and technology in China (0.0688) and Japan (0.0102) both have positive effects on stock market returns, indicating that when the technology level increases by one unit, the impact of industrial water supply on the stock market can move in a positive direction by 0.0688 and 0.0102 units in China and Japan, respectively. We next focus on the difference between the two coefficients, and find that technology has a larger difference in China’s stock market than in that of Japan. Combining we observe a forward influence of technology on the above process, and the heterogeneity may be because of the disparity between technology levels in the two countries. Moreover, the gap between the two coefficients shows that China has more potential for technological development; thus, the influence of technology is larger. However, Japan may have more cutting-edge technology; therefore, only diminishing returns are indicated.
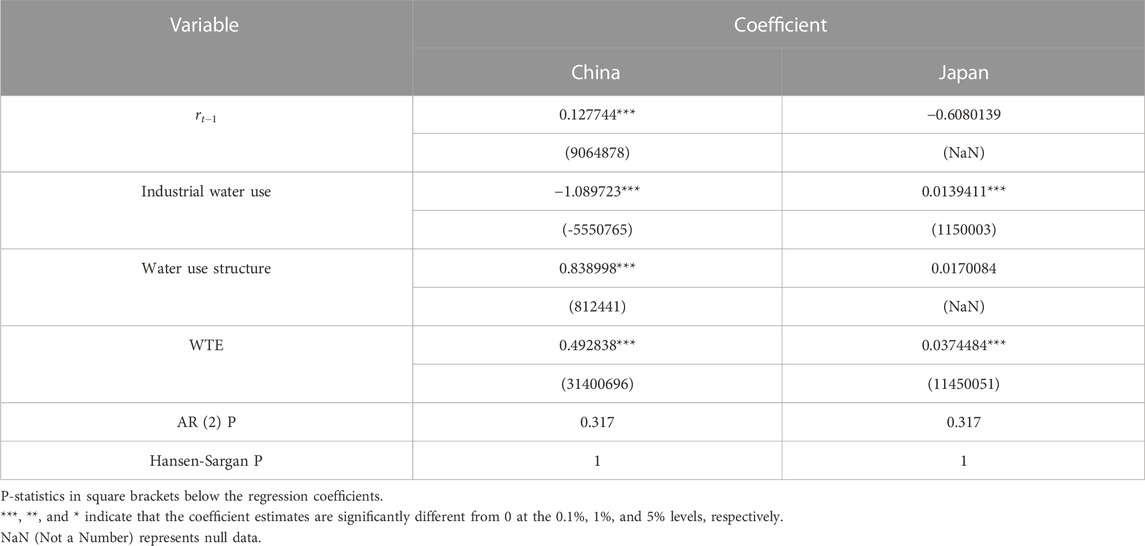
TABLE 6. Role of technology in the stock market.
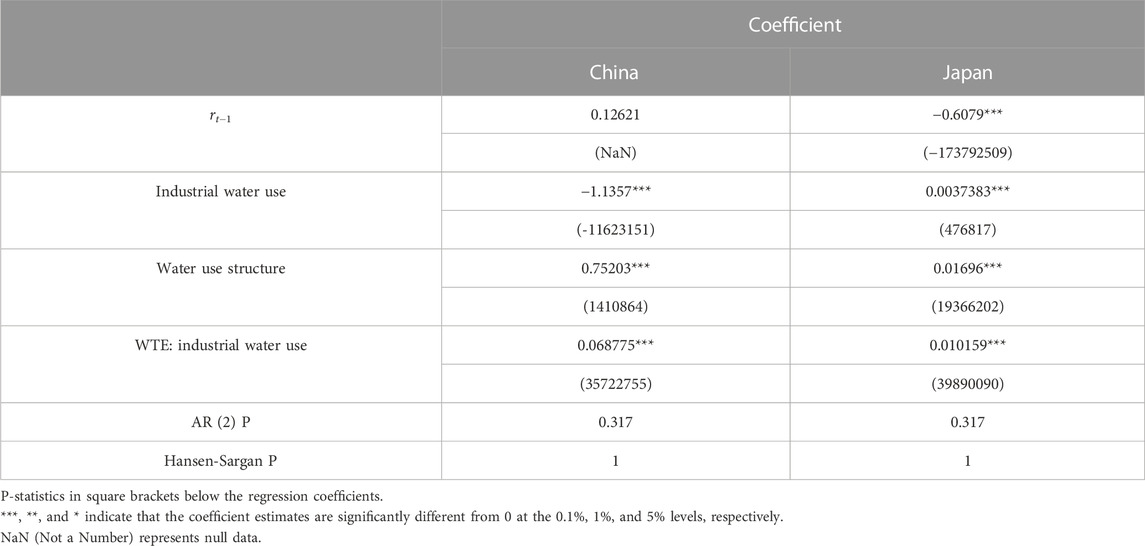
TABLE 7. Role of technology in the mechanism of industrial water use affecting stock market returns.
The results in Table 8 show that the interaction between water use structure and technology is only significant for China (2.0039), further indicating that technology can influence the mechanism between water use structure and the stock market in a forward direction. The coefficient for Japan is not significant, showing that water use structure may not be the main factor affecting Japan’s stock market returns, which corresponds to the results in Table 5, while technology hardly interacts with it.
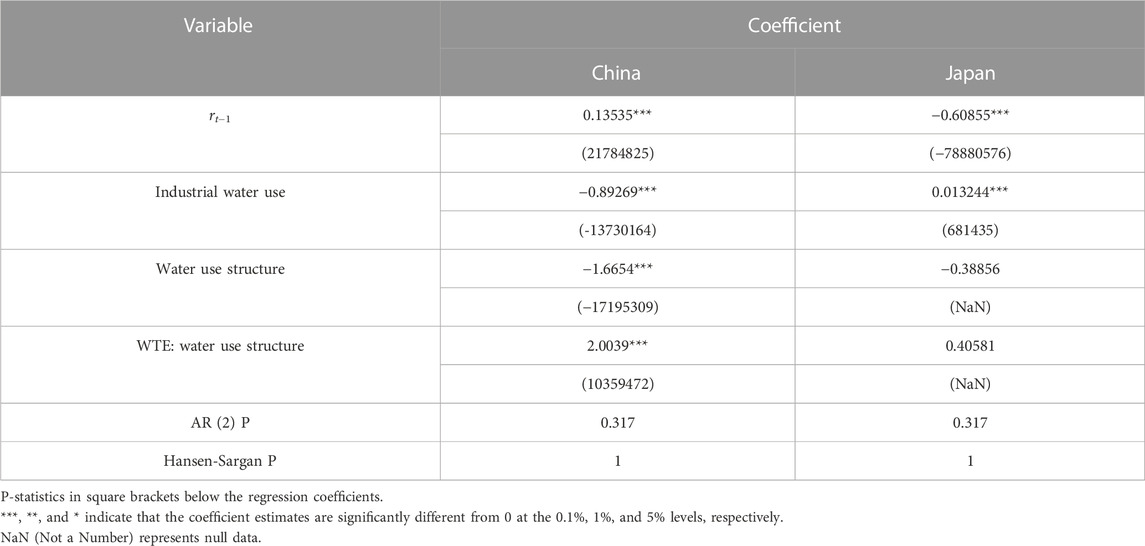
TABLE 8. Role of technology in the mechanism of water use structure affecting stock market returnsn.
6.4 Forecasting stock market return change per industrial water use with the ARIMA-EGARCH model
First, we need to ensure that the series is stable via the Augmented Dickey–Fuller (ADF) test. The ADF test is to determine whether there is a unit root in the series: if the series is smooth, there is no unit root; otherwise, there is a unit root.
If the test results reject the null hypothesis (i.e., p ¡ 0.05), then we can prove that the series is smooth.
Table 9, 10 show that, after the second and first order differencing, China and Japan obtained a smooth sequence, respectively. Therefore, dChina = 2 and dJapan = 1.
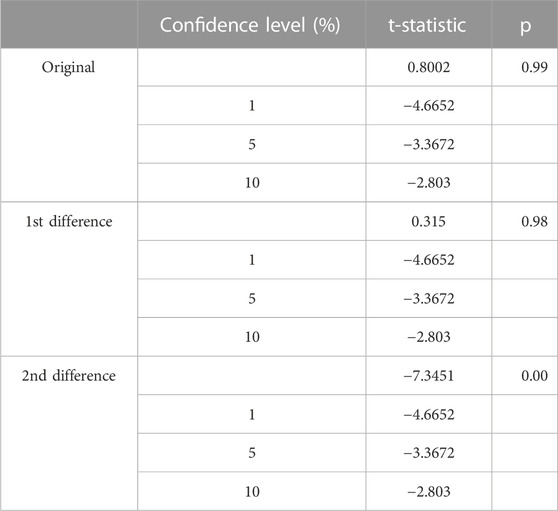
TABLE 9. Results of the ADF test in China.
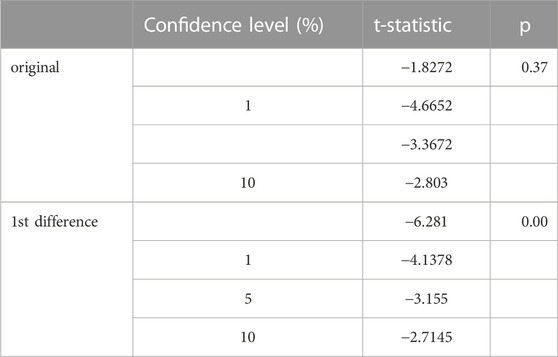
TABLE 10. Results of the ADF test in Japan.
Then, we use the autocorrelation function (ACF), partial autocorrelation function (PACF), Akaike information criterion (AIC), and Bayesian information criterion (BIC) q uasi-measures to assess the order of p and q. ACF allows us to obtain the autocorrelation value of any series with lagged values, while PACF generally identifies the correlation of the residual with the next lagged value. The order q of MA is obtained through the ACF plot, and after the order, ACF crosses the upper confidence interval for the first time. Similarly, the PACF drops sharply after the lag term order p. The ACF, PACF, AIC, and BIC measures identify the ARIMA (1,1,0) model as a time-series model for stock market volatility in Japan, and ARIMA (0,2,1) in China. Figures 1, 2 show forecast results.
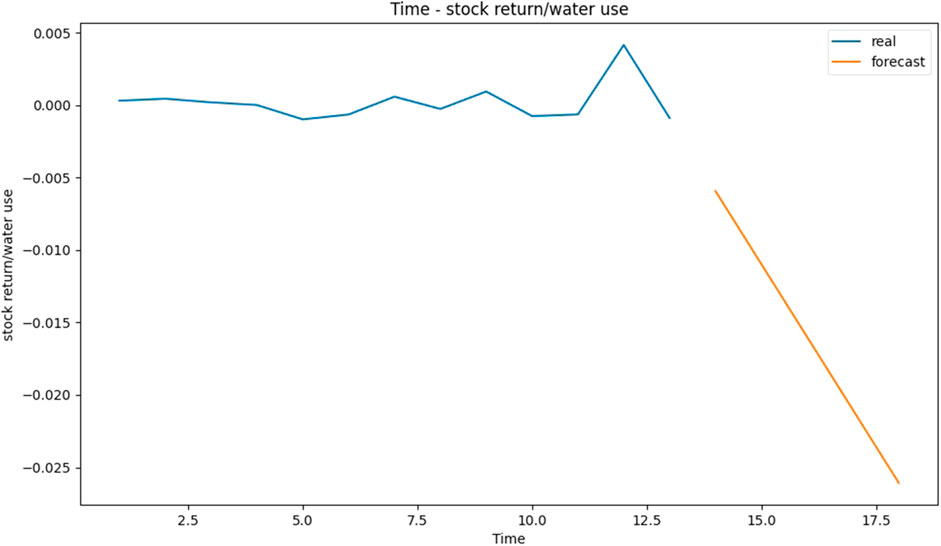
FIGURE 1. Forecast results in China.
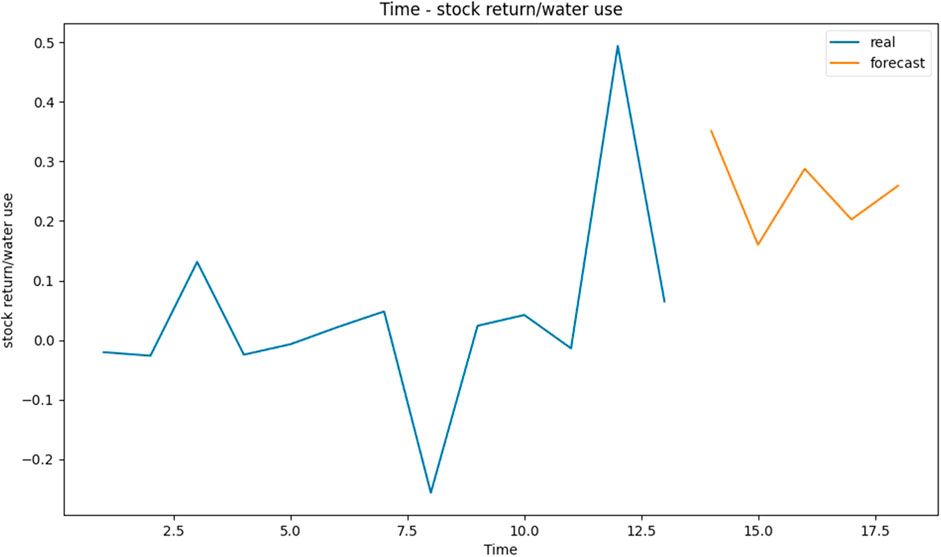
FIGURE 2. Forecast results in Japan.
However, Figure 3 shows that the residuals are skewed. Thus, we apply the EGARCH model to adjust the results, and the order of p and q is also determined using AIC quasi-measures.
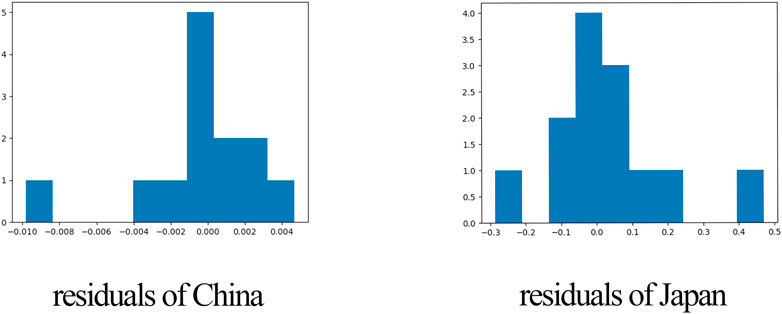
FIGURE 3. Histogram of residuals in China and Japan.
Based on the results in Table 11, ARIMA (1,1,0) + EGARCH (2,1) for Japan, and ARIMA (0,2,1) + EGARCH (2,3) for China are settled.
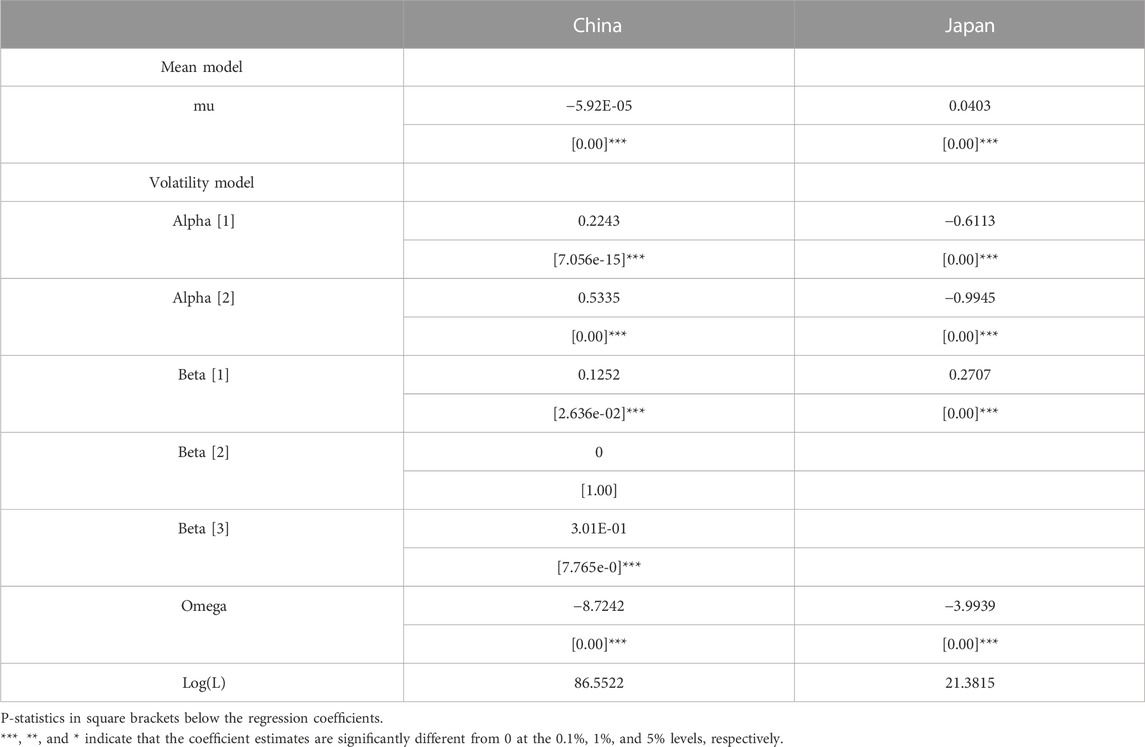
TABLE 11. Results of the EGARCH model in China and Japan.
According to Table 12, most marginal values in China are negative, and the trend will fluctuate around −0.005%, indicating that most the marginal stock return change will decline with an increase of industrial water use, and the effect by water use will sometimes be stronger, corresponding to the conclusions based on Table 5. Moreover, according to Table 1, water technology in China is gradually strengthening, and as technology strengthens, the effect of water on the stock market will gradually show bias toward a positive direction (), which corresponds to the forecast value of 2024, 0.038%. This illustrates the interplay of the models in this study. Conversely, Japan shows fluctuating trends all above 0, which shows that industrial water use has positive influence on the stock market in Japan, corresponding to Table 5. Moreover, the slope of the curve of Japan is much larger than that of China, indicating that the stock market is more volatile in Japan compared with China, and it corresponds to the first model’s conclusion (i.e., China’s coefficient is smaller than that of Japan).
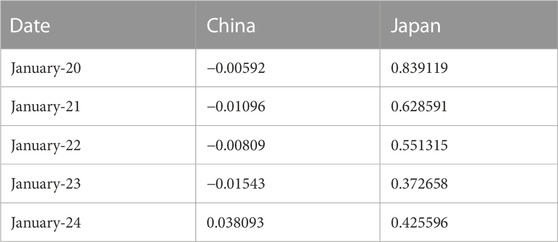
TABLE 12. Forecast results in China and Japan.
7 Conclusion
In this study, we quantitively investigate the relationship between water use and the stock market, which is a new research area with few comparative studies. We also explore the mechanism of technology in the relationship between two different market types: emerging (China) and mature (Japan). Thus, some conclusions can be drawn from the findings.
First, stock market volatility is more likely to be affected by water use in Japan compared with in China. In both countries, industrial water use and water use structure can increase stock market volatility. China may have room for improvement in optimizing its water use structure.
Second, industrial water use has a positive impact on stock market returns in Japan and a negative impact in China. Moreover, it may be the main influencing factor of stock market volatility in Japan. Nevertheless, industrial water use and water use structure play important roles in China’s stock market.
Third, technology level influences the examined relationship, which may one reasons for the heterogeneity. When the technology level increases by one unit, the impact of the industrial water use on the stock market moves by 0.0688 and 0.0102 units in a positive direction in China and Japan, respectively. This indicates that technology has a positive impact on how industrial water use influences market returns. However, only the results for China show that technology influences the mechanism between water use structure and stock market returns in a forward direction.
Fourth, the ARIMA-EGARCH model shows that most China’s marginal stock market returns are negative, and will fluctuate around −0.005%, while the predicted values of marginal stock market change are all above 0 in Japan, thus confirming the results for Models 1 and 2 in China and Japan. Moreover, the forecast marginal rate for China in 2024 (0.038%) is greater than 0, indicating that the gradual technological progress in China can have a positive impact on the relationship between water use and the stock market, corresponding to the results of the DEA method and Model 3.
7.1 Policy recommendations based on research findings
Each country has its own water conservation policies, such as China’s water price reform in 2008, which raised the price of water for water projects and increased sewage treatment fees. In Japan, the “Rainwater Network Conference” was established in 2008 to exchange and share information and cooperate across regions, with the aim of storing and using rainwater. Our findings correspond to these policies, and according to the results, our research may provide policy guidance for both emerging and emerged markets. Although water use has a different impact on stock market returns in China and Japan, more water use can lead to stock market volatility and create risk. Therefore, were advocate for governments to strengthen their supervision of corporate water use, especially for industries that use excessive amounts of water. At the same time, governments should take some measures to promote the transformation and upgrading of the industrial economy and implement the concept of sustainable development, such as with taxation, where enterprises with high water consumption must pay higher taxes than other enterprises unless they make internal adjustments and upgrades.
As we concluded, heterogeneity exists between China and Japan, which may be caused by the water technology level. Therefore, we suggest that companies invest in studying water technology innovation, application, and promotion, which is not only a cost-saving measure for enterprises but also the future economy of water shortage remedies. Water technology has great potential, and governments can implement appropriate subsidies for this type of research-based enterprise. However, our study has two limitations. The first concerns our small sample size. The scarcity of comparative research made it difficult for us to locate data resources and compare the results. The second concerns the methods that we applied, such as the DEA method, which did not enable us to present a modeling breakthrough.
In conclusion, investors, firms, and governments should be aware that water use plays an important role in the stock market. Because heterogeneity exists, we suggest that technology development must be considered, especially in the context of global water scarcity.
Data availability statement
The original contributions presented in the study are included in the article/supplementary material, further inquiries can be directed to the corresponding author.
Author contributions
HL, YT, ZY, and DT contributed to the conception and design of the study. HL and ZY organized the database, and performed the statistical analysis. HL wrote the first draft of the manuscript. HL, YT, and DT wrote sections of the manuscript. All authors contributed to the manuscript’s revision and read and approved the submitted version.
Funding
This work was supported by the project of the research on the driving mechanism and realization path of professional development of agricultural productive service industry fund by the National Planning Office of Philosophy and Social Science (No. 20BJY127), and the project of the study on the development of eco-welfare performance in Hunan in the context of carbon neutral carbon peaking fund by Hunan Provincial Education Department (No. S202210538002).
Conflict of interest
The authors declare that the research was conducted in the absence of any commercial or financial relationships that could be construed as a potential conflict of interest.
Publisher’s note
All claims expressed in this article are solely those of the authors and do not necessarily represent those of their affiliated organizations, or those of the publisher, the editors and the reviewers. Any product that may be evaluated in this article, or claim that may be made by its manufacturer, is not guaranteed or endorsed by the publisher.
References
Aldaya, M., Allan, J., and Hoekstra, A. (2010). Strategic importance of green water in international crop trade. Ecol. Econ. 69, 887–894. doi:10.1016/j.ecolecon.2009.11.001
Aldaya, M. M., Chapagain, A. K., Hoekstra, A. Y., and Mekonnen, M. M. (2012). The water footprint assessment manual zeroth edn. Routledge. doi:10.4324/9781849775526
Bakker, K. (2007). The ”commons” versus the ”commodity”: Alter-globalization, anti-privatization and the human right to water in the global south. Antipode 39, 430–455. doi:10.1111/j.14678330.2007.00534.x
Basher, S. A., Haug, A. A., and Sadorsky, P. (2018). The impact of oil-market shocks on stock returns in major oil-exporting countries. J. Int. Money Finance 86, 264–280. doi:10.1016/j.jimonfin.2018.05.003
Baum, R., and Characklis, G. W. (2020). Mitigating drought-related financial risks for water utilities via integration of risk pooling and reinsurance. J. Water Resour. Plan. Manag. 146, 05020007. doi:10.1061/(ASCE)WR.1943-5452.0001202
Baum, R., Characklis, G. W., and Serre, M. L. (2018). Effects of geographic diversification on risk pooling to mitigate drought-related financial losses for water utilities. Water Resour. Res. 54, 2561–2579. doi:10.1002/2017WR021468
Berg, F., Kolbel, J., and Rigobon, R. (2019). Aggregate confusion: The divergence of ESG ratings. SSRN Electron. J. 10.2139/ssrn.3438533.
Brealey, R. A., Myers, S. C., and Allen, F. (2011). “Principles of corporate finance,” in The McGraw-Hill/Irwin series in finance, insurance, and real estate 10th ed edn (New York: McGraw-Hill/Irwin).
Bresnihan, P. (2016). The bio-financialization of Irish Water: New advances in the neoliberalization of vital services. Util. Policy 40, 115–124. doi:10.1016/j.jup.2015.11.006
Dimson, E., Marsh, P., and Staunton, M. (2020). Divergent ESG ratings. J. Portfolio Manag. 47, 75–87. doi:10.3905/jpm.2020.1.175
Fields, D. (2018). Constructing a new asset class: Property-led financial accumulation after the crisis. Econ. Geogr. 94, 118–140. doi:10.1080/00130095.2017.1397492
Foster, B. T., Kern, J. D., and Characklis, G. W. (2015). Mitigating hydrologic financial risk in hydropower generation using index-based financial instruments. Water Resour. Econ. 10, 45–67. doi:10.1016/j.wre.2015.04.001
Gleick, P. (1998). The human right to water. Water Policy 1, 487–503. doi:10.1016/S1366-7017(99)00008-2
Hogeboom, R. J., Kamphuis, I., and Hoekstra, A. Y. (2018). Water sustainability of investors: Development and application of an assessment framework. J. Clean. Prod. 202, 642–648. doi:10.1016/j.jclepro.2018.08.142
Hu, J.-L., Wang, S.-C., and Yeh, F.-Y. (2006). Total-factor water efficiency of regions in China. Resour. Policy 31, 217–230. doi:10.1016/j.resourpol.2007.02.001
Huang, Q., Wang, J., and Li, Y. (2017). Do water saving technologies save water? Empirical evidence from north China. J. Environ. Econ. Manag. 82, 1–16. doi:10.1016/j.jeem.2016.10.003
Kamstra, M. J., Kramer, L. A., and Levi, M. D. (2003). Winter blues: A sad stock market cycle. Am. Econ. Rev. 93, 324–343. doi:10.1257/000282803321455322
Kareiva, P. M., McNally, B. W., McCormick, S., Miller, T., and Ruckelshaus, M. (2015). Improving global environmental management with standard corporate reporting. Proc. Natl. Acad. Sci. 112, 7375–7382. doi:10.1073/pnas.1408120111
Kölbel, J. F., and Busch, T. (2021). Signaling legitimacy across institutional contexts—the intermediary role of corporate social responsibility rating agencies. Glob. Strategy J. 11, 304–328. doi:10.1002/gsj.1355
Kubotera, H. (1996). Global environment and technology of plasticity: Role of technology of plasticity in addressing global environmental issues. J. Mater. Process. Technol. 59, 213–217. doi:10.1016/0924-0136(95)02133-7
Lankford, B. A. (Editor) (2013). Water security: Principles, perspectives and practices (Abingdon, Oxon: Routledge).
Laopodis, N. T., and Papastamou, A. (2016). Dynamic interactions between stock markets and the real economy: Evidence from emerging markets. Int. J. Emerg. Mark. 11, 715–746. doi:10.1108/IJoEM-12-2015-0253
Larson, W., Freedman, P., Passinsky, V., Grubb, E., and Adriaens, P. (2012). Mitigating corporate water risk: Financial market tools and supply management strategies. SSRN Electron. J. doi:10.2139/ssrn.2159370
Lucas, R. E. (2004). Lectures on economic growth. paperback ed edn. Cambridge, Mass: Harvard Univ. Press, 1. harvard univ. press.
McCarthy, J. (2005). Commons as counterhegemonic projects. Capital. Nat. Social. 16, 9–24. doi:10.1080/1045575052000335348
Meyer, E. S., Characklis, G. W., and Brown, C. (2017). Evaluating financial risk management strategies under climate change for hydropower producers on the great lakes: Financial risk under climate change. Water Resour. Res. 53, 2114–2132. doi:10.1002/2016WR019889
Meyer, E. S., Characklis, G. W., Brown, C., and Moody, P. (2016). Hedging the financial risk from water scarcity for Great Lakes shipping. Water Resour. Res. 52, 227–245. doi:10.1002/2015WR017855
Nelson, D. B. (1996). “Conditional heteroskedasticity in asset returns: A new Approach**Reprinted from Econometrica59 (1991), 347–370,” in Modelling stock market volatility (Elsevier), 37–64. doi:10.1016/B978012598275-7.50004-1
Nikolaou, I. E., Kourouklaris, G., and Tsalis, T. A. (2014). A framework to assist the financial community in incorporating water risks into their investment decisions. J. Sustain. Finance Invest. 4, 93–109. doi:10.1080/20430795.2013.823853
Papadamou, S., Sidiropoulos, M., and Spyromitros, E. (2017). Does central bank independence affect stock market volatility? Res. Int. Bus. Finance 42, 855–864. doi:10.1016/j.ribaf.2017.07.021
Piñeiro-Chousa, J., López-Cabarcos, M., and Ribeiro-Soriano, D. (2020). Does investor attention influence water companies’ stock returns? Technol. Forecast. Soc. Change 158, 120115. doi:10.1016/j.techfore.2020.120115
Qiao, N., Yue, A., Guan, H., Mu, L., and Ding, Y. (2022). How effective is water technology as a water scarcity remedy for the economy in China? Water 14, 3056. doi:10.3390/w14193056
Rudebeck, T. (2019). “Corporations as custodians of the public good? Exploring the intersection of corporate water stewardship and global water governance,” in Water governance - concepts, methods, and practice (Cham, Switzerland: Springer).
Rudebeck, T. (2022). Framing water as a financial risk: Reviewing the processes shaping a narrative. WIREs Water 9. doi:10.1002/wat2.1596
Sojamo, S., Keulertz, M., Warner, J., and Allan, J. A. (2012). Virtual water hegemony: The role of agribusiness in global water governance. Water Int. 37, 169–182. doi:10.1080/02508060.2012.662734
Sojamo, S. (2015). Unlocking the “prisoner’s dilemma” of corporate water stewardship in South Africa—exploring corporate power and legitimacy of engagement in water management and governance. Sustainability 7, 6893–6918. doi:10.3390/su7066893
Tseng, K. (2022). Learning from the Joneses: Technology spillover, innovation externality, and stock returns. J. Account. Econ. 73, 101478. doi:10.1016/j.jacceco.2022.101478
Yu, H.-C., Kuo, L., and Ma, B. (2020). The drivers of corporate water disclosure in enhancing information transparency. Sustainability 12, 385. doi:10.3390/su12010385
Zeff, H. B., and Characklis, G. W. (2013). Managing water utility financial risks through third-party index insurance contracts: Financial mitigation of water utility drought risks. Water Resour. Res. 49, 4939–4951. doi:10.1002/wrcr.20364
Keywords: water use, technology, heterogeneity, emerging and mature markets, stock market
Citation: Lu H, Tang Y, Yu Z and Tan D (2023) The impact of water and technology on the stock market in China and Japan based on a new heuristic model. Front. Environ. Sci. 11:1145480. doi: 10.3389/fenvs.2023.1145480
Received: 16 January 2023; Accepted: 10 April 2023;
Published: 20 April 2023.
Edited by:
Khurram Shehzad, Southeast University, ChinaReviewed by:
Jennifer Freya Helgeson, Jennifer Helgeson, United StatesSimon Grima, University of Malta, Malta
Ping Zhang, Capital University of Economics and Business, China
Copyright © 2023 Lu, Tang, Yu and Tan. This is an open-access article distributed under the terms of the Creative Commons Attribution License (CC BY). The use, distribution or reproduction in other forums is permitted, provided the original author(s) and the copyright owner(s) are credited and that the original publication in this journal is cited, in accordance with accepted academic practice. No use, distribution or reproduction is permitted which does not comply with these terms.
*Correspondence: Dan Tan , dDIwMDYwODU0QGNzdWZ0LmVkdS5jbg==