 Zhenqiu Wu
 Wenying Huang
95% of researchers rate our articles as excellent or good
Learn more about the work of our research integrity team to safeguard the quality of each article we publish.
Find out more
ORIGINAL RESEARCH article
Front. Environ. Sci. , 02 March 2023
Sec. Environmental Economics and Management
Volume 11 - 2023 | https://doi.org/10.3389/fenvs.2023.1143057
This article is part of the Research Topic Low-Carbon Transformation for Sustainable Development View all 14 articles
The energy consumption and carbon emission of the service industry should not be ignored. In order to achieve green and low-carbon development, improving the carbon productivity of the service industry is an extremely important method, and technical progress is a key path to improving the carbon productivity of the service industry. This paper decomposes the technical progress of China’s service industry into technical progress of non-energy factors and technical progress of energy factor, and analyzes the impact and action mechanism of these two technical progress on the carbon productivity of China’s service industry respectively from the theoretical and empirical perspectives. The main conclusions of this paper are as follows: From 2003 to 2019, technical progress had a significant positive impact on the carbon productivity of China’s service industry. The influence coefficients of technical progress of non-energy factors and technical progress of energy factor are 0.285 and 0.306. In terms of the type of technical progress, the technical progress of energy factor has a greater impact. The technical progress of non-energy factors and energy factor have a significant promoting effect on the improvement of carbon productivity of service industry in all regions of China. In Eastern, central and Western China, the influence coefficients of the former are 0.318, 0.289 and 0.266, and the influence coefficients of the latter are 0.352, 0.296 and 0.273. The mechanism test finds that the technical progress of non-energy factors and energy factor directly affect the carbon productivity of China’s service industry on the one hand, and indirectly affect the carbon productivity of China’s service industry through the production efficiency and energy use efficiency of the service industry on the other hand.
The global concentration of greenhouse gases in the atmosphere is breaking the highest value in the history of human meteorological observation, and the share of CO2 in greenhouse gases is as high as 76.7%, according to the World Resources Institute. According to the BP World Energy Statistics Yearbook (2021), China’s primary energy consumption in 2020 was 145.46 EJ, accounting for 26.1% of the global share. In the same year, China emitted 9.899 billion tons of CO2, accounting for 30.7% of the global share. China has become the world’s largest energy-consuming and carbon-emitting country. Saving energy and reducing carbon emissions have become a strategic requirement for China’s economic development, and improving carbon productivity is one of the important paths in balancing economic growth with low-carbon development. According to China’s National Economic Classification of Industries (GB/T 4754-2017), the tertiary industry is the service industry, which refers to industries other than the primary and secondary industries. The service industry includes: wholesale and retail trade; transportation, storage and postal services; accommodation and catering; information transmission, software and information technology services; finance; real estate; leasing and business services; scientific research and technical services; water, environment and public facilities management; residential services, repair and other services; education; health and social work; culture, sports and entertainment; public management, social security and social organizations; international organizations; as well as agriculture, forestry, animal husbandry and fishery services in agriculture, forestry, animal husbandry and fishery; mining auxiliary activities in the mining industry; metal products, machinery and equipment repair in the manufacturing industry. Since 2015, the service industry has consistently contributed more than 50% to China’s economic growth, according to the National Bureau of Statistics data. In the traditional concept of the Chinese, the service industry is subconsciously considered as a green and clean industry. In fact, the service industry, which occupies “half of China’s national economy”, has inevitably had much negative impact on the ecological environment while developing so rapidly. Department of Energy Statistics and National Bureau of Statistics, 2020 shows that China’s total energy consumption in 2019 was 4.87 billion tons of standard coal, of which the service industry consumed 850 million tons of standard coal, accounting for 17.4%, an increase of 3.8% compared to 13.6% in 2009. Facing the problem of carbon emissions from the service industry, it is also necessary to improve the carbon productivity of the service industry for the healthy and sustainable development of China’s national economy. Technical progress is an important factor that cannot be ignored to influence the carbon productivity of service industry (Li and Peng, 2018).
This paper takes the carbon productivity of China’s service industry as the research object and makes great efforts to achieve the following main research purposes. Firstly, it calculates the service industry’s carbon productivity and the technical progress level of non-energy factors and energy factor in various provinces and regions of China, and analyzes their temporal and spatial variation characteristics, this is the basis of follow-up research. Secondly, it discusses the impact of technical progress on the carbon productivity of China’s service industry, and clarifies the mechanism of the impact of technical progress on the carbon productivity of China’s service industry at both theoretical and empirical levels. Thirdly, proposes targeted countermeasures to improve the carbon productivity of China’s service industry in terms of technical progress and so on.
In terms of theoretical research significance, at the industry level, most of the previous studies on carbon productivity have focused on the secondary industry, while studies on the service industry are quite rare, but in fact the issue of carbon productivity in the service industry also needs attention. This paper extends the impact of technical progress on carbon productivity to the field of China’s service industry, constructs a scientific method to decompose the technical progress of China’s service industry into non-energy factors and energy factor technical progress, and calculates it. As for practical research significance, improving carbon productivity in the service industry is an important way to reduce China’s carbon emissions and achieve carbon neutrality. After clarifying the impact and mechanism of the technical progress of non-energy factors and energy factor in China’s service industry on carbon productivity, this paper puts forward policy suggestions to improve the carbon productivity of China’s service industry, which is of great practical significance to promote the green transformation and sustainable development of China’s service industry and high-quality development of China’s national economy.
The marginal contributions and innovations of this paper are as follows: Firstly, in terms of research objects, most of the existing literature on technical progress and carbon productivity starts from the macroscopic national or regional level. Even if it is specific to the industry level, the research objects are also concentrated on industry, agriculture, etc. This paper selects China’s service industry as the research object, discusses the impact of technical progress on the carbon productivity in China’s service industry and clarifies its action mechanism. It effectively complements the gap of research on the impact of technical progress on carbon productivity. Secondly, in terms of research methods, this paper expands the traditional two-factor model to a multi-factor model that includes energy factor, and constructs a decomposition method for technical progress in the service industry through the double-nested CES production function, that is, the decomposition method of decomposing technical progress in the service industry into technical progress of non-energy factors and energy factor, and uses this method to measure the level of these two types of technical progress in China’s service industry. It also empirically tests the impact of these two types of technical progress on the carbon productivity of China’s service industry. Finally, in terms of research conclusions, this paper finds that the technical progress of non-energy factors and energy factor directly affect the carbon productivity of China’s service industry on the one hand, and indirectly affects the carbon productivity of China’s service industry through the production efficiency and energy use efficiency of the service industry on the other hand. The results of theoretical analysis and empirical analysis are basically consistent. Based on the conclusions, some targeted policy suggestions are put forward to improve the carbon productivity of China’s service industry.
The remainder of the paper unfolds as follows. The “Literature review” section reviews the relevant literature. The “Mechanism” section analyzes the mechanism of impact of technical progress on carbon productivity in the service industry. The “Methodology and Data” section describes methodology and data for calculation of carbon emissions, carbon productivity, and technical progress in China’s service industry, empirical study on the impact of technical progress on carbon productivity in China’s service industry. The “Results” section reports and analyzes the results of calculation of carbon productivity, technical progress, and baseline regression model. The “Further Analysis” includes regional regression analysis, robustness test, endogenous test, and mechanism test. The “Conclusion and suggestion” section summarizes the main conclusions and puts forward some policy suggestions for decision-making. The “Research limitations and future research directions” section summarizes the main limitations and future research directions of this study.
Smith (1776) first provided a qualitative description of technical progress in “A Study of the Nature and Causes of National Wealth”, where he argued that the increasing refinement of the division of labor in production activities could lead to technical progress and thus drive economic growth with increased production efficiency. In the quantitative study of technical progress, Solow (1956) and Swan (1956) both suggested that technical progress as an exogenous variable of economic growth could have a significant and positive impact on economic growth. At the same time, in order to quantify technical progress, Solow (1957) first proposed to measure the contribution of technical progress to economic growth by using the “Solow residual” method. Based on Solow’s model, Massell (1961) used the component-weighted total factor productivity growth rate to reflect the overall technical progress and technical effects. Nishimizu and Page (1982) used a parametric frontier approach to decompose total factor productivity into technical progress and technical efficiency change. After that, according to the endogenous growth theory, Romer (1986), Lucas (1988) and others argued that the driving force for the economy to maintain growth must be endogenous, and technical progress is the central endogenous variable. Since technical progress has externalities, the marginal rewards of production factors can remain stable or even increase incrementally. This breaks through the limitations of the neoclassical growth model, and it is more conducive to explaining the long-term economic growth phenomenon. To study the multifactor technical progress including energy factor, the elasticity of substitution between factors needs to be measured first. Berndt and Christensen (1974) measured the elasticity of substitution among the three main factors of production (capital, labor, and energy) by constructing a translog cost function combined with a three-stage least squares estimation method under the assumption that technical progress is neutral. It was found that there is a weak substitution relationship between energy and labor, but energy and capital are complementary. Hassler et al. (2012) constructed a Cobb-Douglas production function and a nested CES production function, measured the level of technical progress under the two production function models, and described the advantages and disadvantages of these two function models in measuring the level of technical progress, and explored a reasonable range of values for the elasticity of factor substitution.
Productivity is divided into two categories: single-factor productivity and total factor productivity. Similarly, carbon productivity is divided into single-factor carbon productivity and total factor carbon productivity.
A part of scholars measured single-factor carbon productivity. Xiong et al. (2021) measured single-factor carbon productivity and found significant spatial differentiation of agricultural carbon productivity at the urban level in the Taihu Lake Basin, China. Sun et al. (2021) studied the carbon productivity of construction industry in Beijing-Tianjin-Hebei region using system dynamics model and predicted the value of carbon productivity under three scenarios.
Another part of scholars measured total factor carbon productivity. Gao and Zhu (2016) measured carbon productivity in the industrial sectors based on the DEA-DDF model. Xu et al. (2020) used SBM directional distance function and GML index method to measure the carbon productivity of manufacturing industry in Shanghai from 2001 to 2016, and found it improving constantly.
In terms of endogenous factors affecting carbon productivity, Meng and Niu (2012) conducted a systematic study. By decomposing the whole change of carbon productivity, they found that the two major endogenous factors affecting carbon productivity were technical progress and industrial structure adjustment. Through reviewing the literature, it is found that many scholars have verified this view. Hoffinann and Busch (2008) argued that technical innovation could affect the level of carbon performance of enterprises by improving the various carbon-containing materials used by enterprises in their production activities. Sun et al. (2020) used the DEA method to categorize the main influencing factors of total factor carbon productivity and CO2 emissions as technical progress, scale efficiency and management efficiency, and found that technical progress is the largest driving factor, followed by scale efficiency and management efficiency. Ren et al. (2021) used the STIRPAT model and the spatial panel Durbin model to investigate the spatial spillover effects of environmental regulation and technical innovation on industrial carbon productivity in China, and found that technical innovation was beneficial to industrial carbon productivity, but there was no significant regional spillover of technical innovation. Zhang et al. (2014) decomposed the influencing factors of carbon productivity into technical progress and the substitution effect between capital and labor factors and energy factor, and through further empirical research proved that technical progress has a positive promoting effect on carbon productivity, while the substitution effect between labor factor and energy factor will not be conducive to the improvement of carbon productivity. Xu and Wang (2015) found through empirical research that technical progress is the core factor affecting the fishery carbon productivity in China’s coastal areas, and industrial structure adjustment will also have a certain degree of impact.
In terms of exogenous factors affecting carbon productivity, there are energy price, energy structure, environmental regulation, research and development (R&D) input, economic spatial agglomeration, foreign direct investment (FDI), foreign trade, etc. Energy efficiency (Guo et al., 2021) and energy price (Tian and Yang, 2020) are important factors affecting carbon productivity. Jiang et al. (2022a) compared the carbon marginal abatement cost curves of China and India, they found that the cost of using fossil energy in China has increased more than that in India which made China reduce more energy consumption, so that the carbon emissions in China have fallen by a larger proportion than that in India. Tian and Yang (2020) found that energy price would have an impact on carbon emissions by affecting enterprises’ choice of energy factor input. The higher the energy price is, the lower the carbon emissions of enterprises will be, but this impact would be weakened with the continuous rise of energy price. R&D input (Mo, 2021) and environmental policy (Li et al., 2020) also play an important role in promoting carbon productivity. Li et al. (2020) established a spatial Dubin model and found that the impact of green R&D input on carbon productivity improvement has a spatial spillover effect. Jiang et al. (2022b) adopted the CGE model to study the impact of demand-side policies related to electrification and decarbonization of private transportation in China on the environment and economy and found that the environmental policy of imposing carbon emission tax on fossil energy is the best way to reduce carbon emission and energy consumption. Although it will increase the production cost of enterprises in the early stage and lead to the decline of output and the loss of GDP, the loss of GDP will be reduced gradually in the long term. Liu and Hu (2016) and Long et al. (2020) both found that foreign direct investment has a significant impact on China’s carbon productivity, and local FDI significantly improves local carbon productivity, while FDI from surrounding areas hinders local carbon productivity. Zhang et al. (2018) argued that there was a significant spatial spillover effect on China’s carbon productivity, and foreign trade significantly increased China’s carbon productivity.
There are abundant studies on the impact of technical progress on carbon productivity in the existing literature, and this issue is still deeply concerned by scholars in recent years. By reviewing the existing literature, many scholars have concluded that technical progress promotes the improvement of carbon productivity with the assistance of different decomposition methods. Zhang (2011) found that technical progress is the most important factor affecting carbon productivity through the Rasch decomposition method. Wang et al. (2016) decomposed the carbon productivity changes of 37 large global carbon emission countries based on the Luenberger productivity index. The results showed that the core factor of carbon productivity improvement was technical progress. Bai et al. (2019) measured the TFCP (total factor carbon productivity) of 88 economies worldwide using the Malmquist index method, and found that technical progress is the main reason for the growth of TFCP. Similarly, the studies of Han (2021), Cheng and Li (2021) and Du and Li (2019) all show that technical progress is the core influencing factor of the change of carbon productivity. In the further study of the impact of technical progress on carbon productivity, some scholars found that the impact of technical progress on carbon productivity is heterogeneous. Zhang and Xu (2016) found that the impact of environmental regulation and technical progress on the carbon productivity of China’s second industry has sectoral heterogeneity. Environmental regulation has a more significant impact on the carbon productivity of capital and technology-intensive sectors and resource-intensive sectors, while technical innovation has a more significant impact on the carbon productivity of labor-intensive sectors. After further decomposing technical progress, some scholars found that different forms of technical progress have different degrees of impact on carbon productivity. For example, Fan et al. (2020) studied the impact of four forms of technical progress on carbon productivity in manufacturing industry based on DEA method, which are neutral technology, capital-embodied technology, energy technology and carbon emission reduction technology in the process of emission reduction. The results showed that capital-embodied technical progress is more important than neutral technical progress.
To sum up, it is not difficult for us to see, that the research results on carbon productivity are quite abundant among scholars from different countries. For the measurement of carbon productivity, scholars mainly use the methods of carbon average GDP, stochastic frontier analysis (SFA) and data envelopment analysis (DEA). For the study of the factors affecting carbon productivity, scholars found that the factors affecting carbon productivity are mainly technical progress, technical innovation, energy efficiency, R&D investment, environmental policy, foreign trade, and foreign direct investment. By decomposing the carbon productivity changes, scholars found that technical progress is the core influence factor of carbon productivity, and its influence on carbon productivity is heterogeneous, and after further decomposing technical progress, they found that different forms of technical progress have different degrees of influence on carbon productivity.
There is rich literature of research on the relationship between technical progress and carbon productivity by scholars in various countries. Specifically at the industry level, most previous studies by scholars on carbon productivity have focused on the secondary industry, and studies on the service industry are quite rare. Further, the literature that decomposes technical progress in service industry into non-energy factors and energy factor technical progress, and explores the impact of these two types of technical progress on carbon productivity of service industry is extremely rare. In this paper, we use the panel data of service industry in each province of China to study the impact of two types of factor technical progress on the carbon productivity of China’s service industry, and propose corresponding policy suggestions to provide reference for China’s government to promote the carbon productivity of the service industry from the perspective of technical progress, and promote China’s service industry to develop towards the “carbon neutral” goal, it is of great significance to environmental protection and sustainable development in China and the world.
Since the carbon productivity of service industry is equal to the output of service industry divided by the carbon emission of service industry, the mechanism of the effect of technical progress on the carbon productivity of service industry may have two ways. On the one hand, it may increase output through the effect of technical progress on the output of the service industry; on the other hand, it may reduce carbon emissions because of technical progress on the carbon emissions of the service industry.
In order to discuss the above mechanism of technical progress more clearly, it is necessary to classify the technical progress of the service industry, and this paper divides the technical progress of the service industry into two categories: non-energy factors technical progress and energy factor technical progress. Technical progress in non-energy factors can be divided into two categories. One is technical progress that increases the output of the service industry when energy consumption is unchanged, or the same output of the service industry is obtained when less energy is consumed. The second is to use equipment that purifies emissions and thus reduces carbon emissions while output in the service industry remains unchanged. Technical progress of energy factor refers to the decline in the carbon content of the calorific value of the energy unit due to the technical progress of energy factor, so that more service output can be produced under the same carbon emissions.
Technical progress in the service industry leads to carbon productivity improvement, which can be summarized into two mechanisms as follows: one is that technical progress improves carbon productivity in the service industry by increasing the production efficiency of the service industry. The other is that technical progress in the service industry improves carbon productivity in the service industry by increasing the efficiency of energy use. The analysis of the influence mechanism of technical progress in the service industry on carbon productivity is shown in Figure 1.
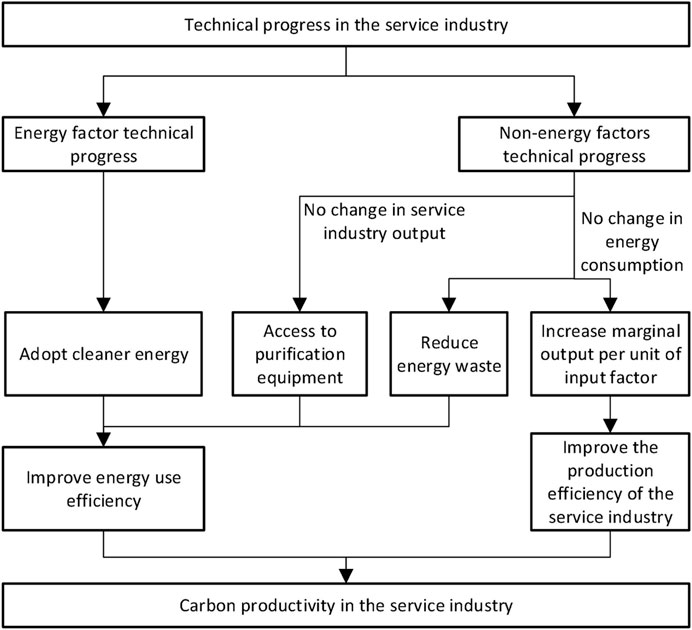
FIGURE 1. Mechanism analysis of impact of technical progress on carbon productivity in the service industry.
The first mechanism: Because the improvement of service industry technology level can promote the increase of marginal output per unit input factor, which makes it possible to improve the production efficiency and produce more output with the same capital, labor, and energy input factors. Therefore, technical progress in the service industry can increase the carbon productivity of the service industry by directly driving the increase in the output of the service industry under constant carbon emissions. The technical progress of service industry corresponding to this mechanism refers to the first category of technical progress of non-energy factors. The second mechanism: specifically, it can be divided into the following three situations. First, the service industry can use the same energy input, reduce energy waste in the production process, and obtain more output, thus increasing the service industry carbon productivity. Second, the service industry adopts cleaner energy with a higher technology level, thus increasing the service industry’s carbon productivity. Third, the service industry can use the same energy input and connect to emission purification equipment at the production terminal to reduce carbon emissions, thus increasing the carbon productivity of the service industry. The second and third situations of this mechanism correspond to the second category of technical progress in the service industry, which refers to technical progress in energy factor and technical progress in non-energy factors.
Subject to the availability of data on China’s service industry, this paper uses the energy fixed source combustion method recommended by the IPCC in 2006 guidelines to calculate the CO2 emissions of the service industry in various provinces in China, as shown in Eq. 1.
In Eq. 1,
In this paper, the level of GDP output per unit of CO2 is chosen to measure the carbon productivity for the following reasons: ① The single-factor carbon productivity calculated through the carbon-averaged GDP treats carbon as a production factor input, which is a complement to capital productivity and labor productivity, and is more intuitive and effective for examining the role of carbon emissions in the economy. ② Compared with single-factor carbon productivity, the measurement of total factor carbon productivity takes into account the substitution between carbon emissions and factors such as capital, labor, and energy, but since the technical progress in this paper is measured using the CES production function, which also includes factors such as capital, labor, and energy. Therefore, if the total factor carbon productivity indicator is used, it may lead to unreliable regression results between technical progress and carbon productivity.
The carbon productivity of China’s service industry is real added value of China’s service industry at a given time divided by the CO2 emissions of the service industry, as shown in Eq. 2.
In Eq. 2,
Based on the research methods of Liao et al. (2018), Wu and Du (2018), this paper constructs a two-layer nested CES production function in the form of “(capital-labour) + energy”, which divides the factors required in production activities into two types, energy factor and non-energy factors, on the basis of the manifestation of the production function. The CES production function has the advantage that the elasticity of substitution is not limited to 1. The specific form of the production function is given in Eq. 3.
In Eq. 3,
Assuming that factor markets are perfect competition when marginal output and real prices of factors are equal, it can be deduced that:
Modifying Eqs 4, 6, we can derive the level of technical progress for the non-energy factors and energy factor as:
From Eqs 7, 8, to obtain the level of technical progress in two types, it is necessary to calculate the values of
Regarding the value of the substitution elasticity
Among them,
From Eqs 7, 8 it can be deduced that:
Taking the logarithm of Eqs 10, 11, and substituting them into Eq. 9:
Let
Simplify Eq. 12 as:
By estimating a panel model for Eq. 13, the elasticity of substitution between energy factor and non-energy factors in the service industry for 30 provinces can be estimated. Summing up the data for the provinces, the value of the elasticity of substitution can be further estimated for China as well as for regions.
The data used in this paper is sourced from the China Statistical Yearbook, China Energy Statistical Yearbook, China Labour Statistical Yearbook, China’s National Bureau of Statistics Database, CSMAR Database, and Wind Database.
① Output of the service industry (
② Capital factor input (
③ Labor factor input (
④ Energy factor input (
⑤ The income shares of labour, capital, and energy (
⑥ The value of
Based on the existing literature research results (Xie et al., 2018; Yang et al., 2021), the following empirical model is constructed to study the impact of technical progress on carbon productivity in China’s service industry:
In Eq. 14,
The carbon productivity of the service industry (
The technical progress level of non-energy factors in the service industry (
In addition to being affected by technical progress, carbon productivity is also affected by the level of infrastructure, the level of environmental regulation (Li et al., 2016), the level of foreign direct investment (Liu and Hu, 2016), the structure of energy consumption, industrial structure, the level of urbanization, and the degree of trade openness (Zhou and Nie, 2012). To avoid the influence of these factors on the regression results, this study controls these variables.
① Environmental regulation level (
② Energy consumption structure (
③ Industrial structure (
④ Infrastructure level (
⑤ Urbanization level (
⑥ Foreign direct investment level (
⑦ Trade openness (
Considering the possible trend or periodicity of the variables over a long statistical time, in order to avoid non-stationarity of the sample data leading to pseudo-regressions and thus affecting the empirical results, we first perform a stationarity test on the data. In this paper, we use two panel unit root tests, LLC (Levin-Lin-Chu) test and Fisher-ADF(Augmented Dickey-Fuller) test, and the test results show that the variables all significantly reject the original hypothesis of the existence of unit root, and the subsequent regressions and tests can be performed.
Due to space limitations, this paper reports the carbon productivity of the service industry in 30 China’s provinces, regions, and the whole country, as shown in Table 1.
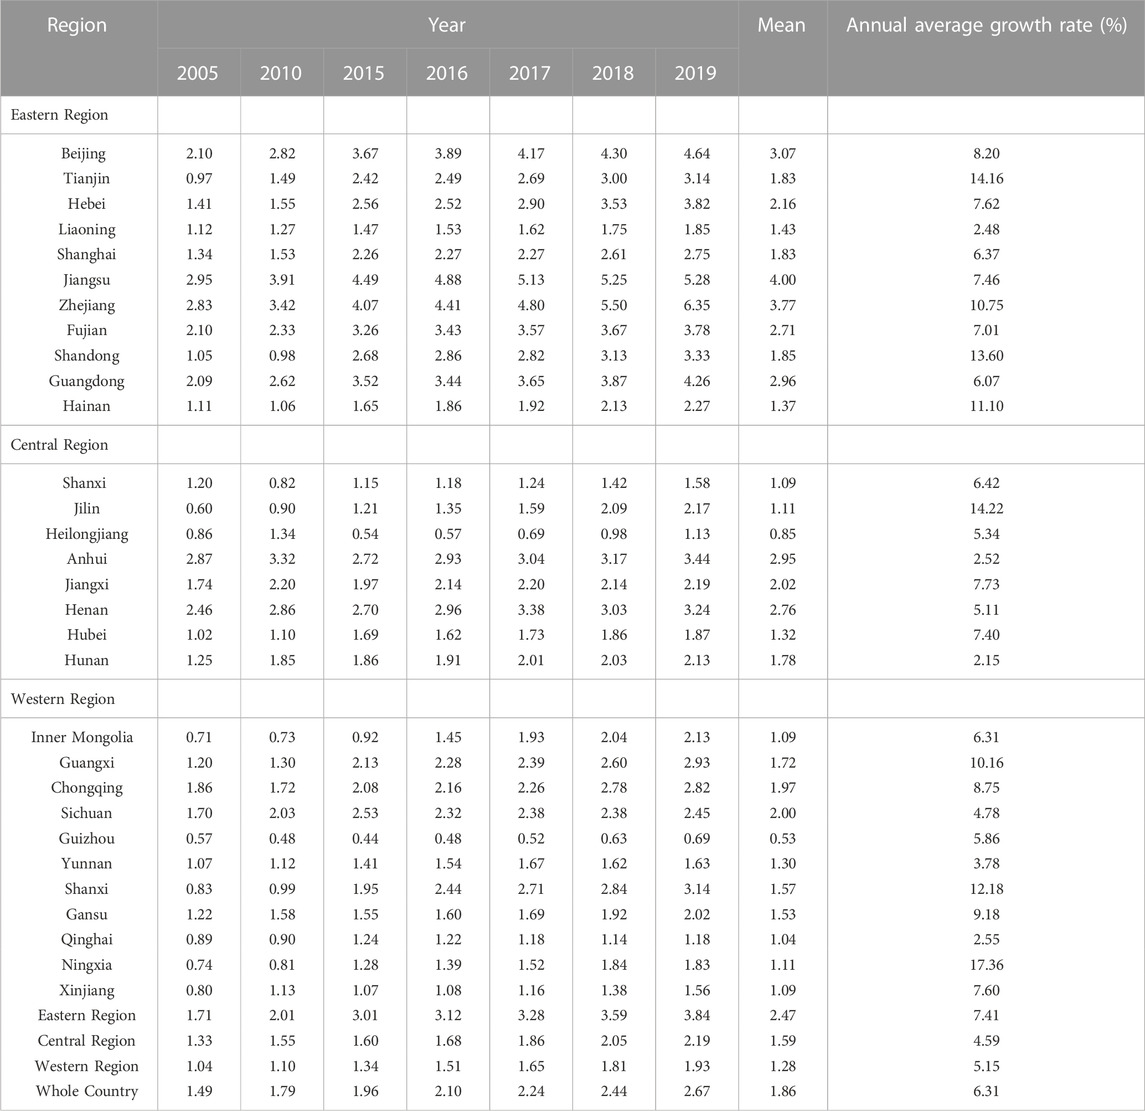
TABLE 1. The carbon productivity of the service industry in 30 China’s provinces, regions, and the whole country.
From Table 1, we can get: the carbon productivity of service industry at the national level has been increasing from 1.49 in 2005 to 2.67 in 2019, with an increase of 72.3%. The growth rate shows a fluctuating upward trend, with an average annual growth rate of 6.31%. Thus, it can be seen, China has been working hard for the low carbon development of its service industry, and the green development strategy is steadily advancing with relatively remarkable results. In terms of all years from 2003 to 2019, except for the decline in individual years, the carbon productivity of China’s service industry has increased in most years. For example, the decline in 2008 may be affected by the global financial crisis, which has led to a significant decline in the output growth rate of China’s service industry, which is 5.6 percentage points lower than that of the previous year.
At the regional level, from 2003 to 2019, the carbon productivity of the service industry was in a state of continuous improvement in most years. In terms of regional horizontal comparison, the average values for each region are 2.47 in the Eastern region, 1.59 in the central region, and 1.28 in the Western region, decreasing from East to West. But in terms of annual average growth rates, in contrast to the trend reflected in the average values, the figures for each region are 7.41% in the eastern region, 4.59% in the central region, and 5.15% in the Western region, the western region is 0.56% points higher than the central region. This shows that there is a large difference in the carbon productivity of the service industry across regions, which is closely related to the development of the service industry and carbon energy consumption in each region.
At the provincial level, the mean value of carbon productivity in the service industry of the 30 provinces selected for this paper has a maximum value of 4.0 in Jiangsu and a minimum value of 0.53 in Guizhou, indicating a wide gap between the provinces. As the average annual growth rate is positive, the carbon productivity of the service industry in China shows a continuous improvement, with the highest annual average growth rate being 17.36% in Ningxia and the lowest being 2.15% in Hunan.
According to the results of Eqs 7, 8, when compared vertically, the trend of the technical progress level of the two types of factor in the service industry in China as a whole and in three regions from 2003 to 2019, is shown in Figure 2.
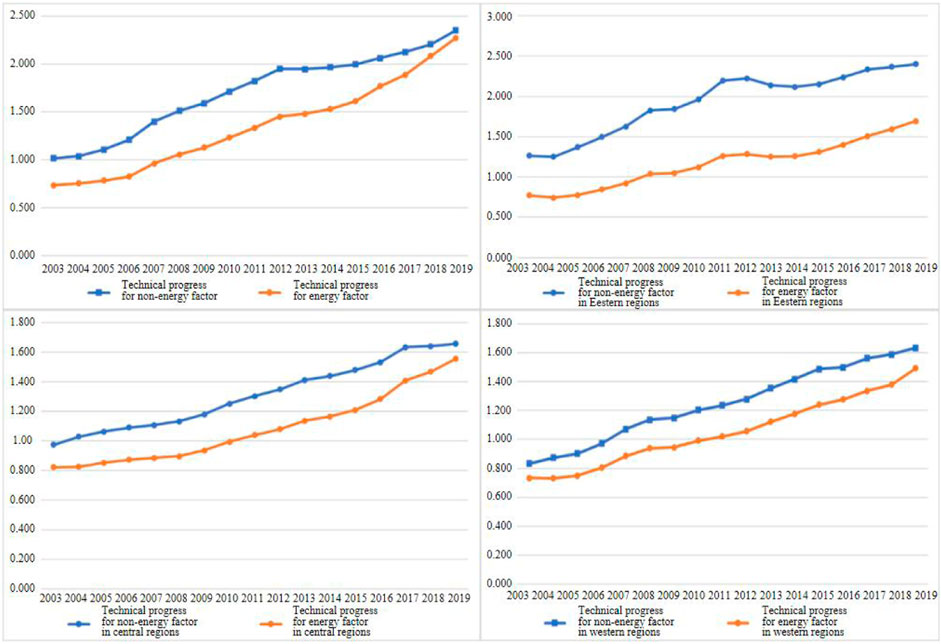
FIGURE 2. Trends in the level of technical progress in the service industry in China and in the Eastern, central, and Western regions.
According to Figure 2, at the national level, the level of technical progress for non-energy factors and energy factor in the service industry generally showed an upward trend from 2003 to 2019, indicating that technical progress can continuously increase the marginal output of non-energy factors and energy factor. By comparing the levels of technical progress of the two types of factor, it can be concluded that the level of technical progress of the non-energy factors is higher, and the gap between the levels of technical progress of the two types of factor is larger during 2004–2012, and the gap between the levels of technical progress of the two types gradually decreases after 2012, indicating that the growth rates of the two types of technical progress have gradually converged. The gap between the two types of technical progress in the service industry in the eastern region is larger, while the gap in the central and Western regions is smaller, but all regions have shown a trend of gradually narrowing the gap in the past three years. In recent years, China has paid particular attention to energy saving and emission reduction, requiring governments at all levels to strictly implement energy saving and emission reduction policies. After the implementation of the carbon emission trading pilot in 2013, it has become an urgent matter to reduce carbon emissions and improve the efficiency of energy use, which requires enterprises in the service industry to pay more attention to technical development in energy, so the growth rate of technical progress in energy factor has been increasing.
In a side-by-side comparison, the comparison of the two types of technical progress level in the service industry in the eastern, central, and western regions of China is shown in Figures 3, 4.
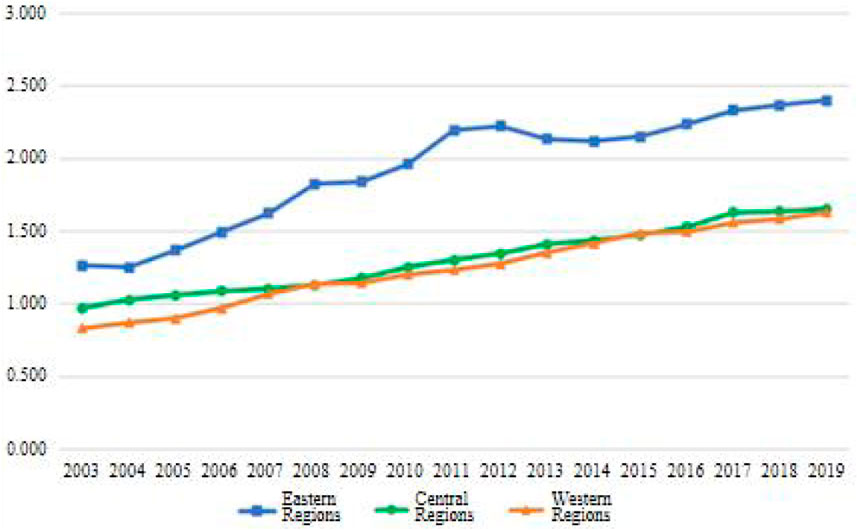
FIGURE 3. Comparison of the level of technical progress of non-energy factors in the service industry in the Eastern, central, and Western regions of China.
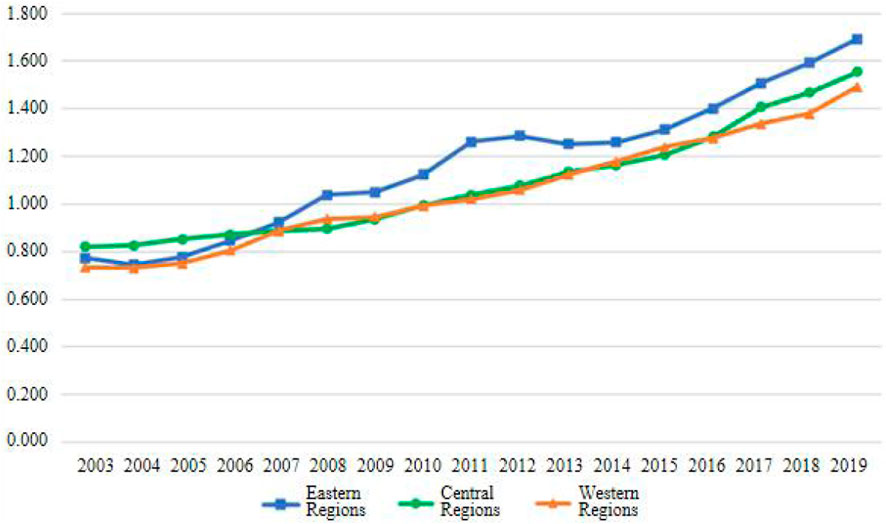
FIGURE 4. Comparison of the technical progress of energy factor in service industry in the Eastern, central and Western regions of China.
Figure 3 shows a line graph comparing the level of technical progress of non-energy factors in the service industry in the Eastern, central and Western regions of China. The analysis of Figure 3 shows that the level of technical progress of non-energy factors in the Eastern region is higher than that in the central and Western regions. The eastern region has always been the region where China’s capital and labour force are concentrated and fast-moving, and the overall level of the service industry development has always been ahead of the central and Western regions, and the concentration of service industry enterprises is also higher. In general, the Eastern region has a higher level of technology and greater innovation capacity in terms of capital and labour. The level of technical progress in non-energy factors in the central and Western regions is relatively similar, but overall the level of technical progress in non-energy factors is slightly higher in the central region. In terms of specific values, the average values of technical progress level of non-energy factors in the service industry in the Eastern, central, and Western regions from 2003 to 2019 are 1.931, 1.309, and 1.247, respectively, decreasing in descending order from East to West.
Figure 4 shows a line graph comparing the technical progress level of energy factor in the service industry in the Eastern, central, and Western regions of China horizontally. From the situation reflected in the line graph, the level of technical progress of energy factor in the service industry in the Eastern region is higher than that in the central and Western regions, but the difference with the central and Western regions is smaller than the level of technical progress of non-energy factors. The level of technical progress in energy factor in the eastern region was lower than that in the central region until 2007. The central region is richer in energy resources, for example, Shanxi, as China’s major coal mining province, has a higher level of technology in the extraction and use of coal mines, and the transportation industry is more developed in the central region, so before 2007, the central region probably had higher technical innovation in improving the efficiency of energy use than the eastern region because of its resource endowments. The level of technical progress in the energy factor of the service industry in the central and Western regions is relatively close, showing a multi-point intersection. In terms of specific values, the average values of the level of technical progress of energy factor in the service industry in the Eastern, central, and Western regions from 2003 to 2019 are 1.167, 1.084, and 1.052, respectively, decreasing in order from East to West.
All the empirical analyses in this paper are done using Stata15.1 software, and the descriptive statistics of each variable are shown in Table 2.
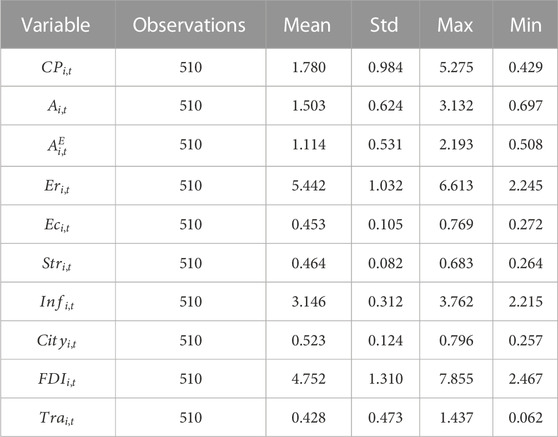
TABLE 2. Summary statistics of variables.
We firstly analyze the relationship between technical progress and carbon productivity in the service industry by baseline regression. According to the results of the Hausman test, the null hypothesis of the random effect model was rejected (p = 0.000), so models 1 to 3 in the baseline regression analysis all use fixed-effects models. In Model 1, only two core explanatory variables are regressed with the carbon productivity of the service industry. On the basis of Model 1, Model 2 added three control variables, including environmental regulation level, energy consumption structure, and industrial structure. Model 3 added all the control variables. The baseline regression results of the impact of technical progress on carbon productivity in China’s service industry are shown in Table 3.
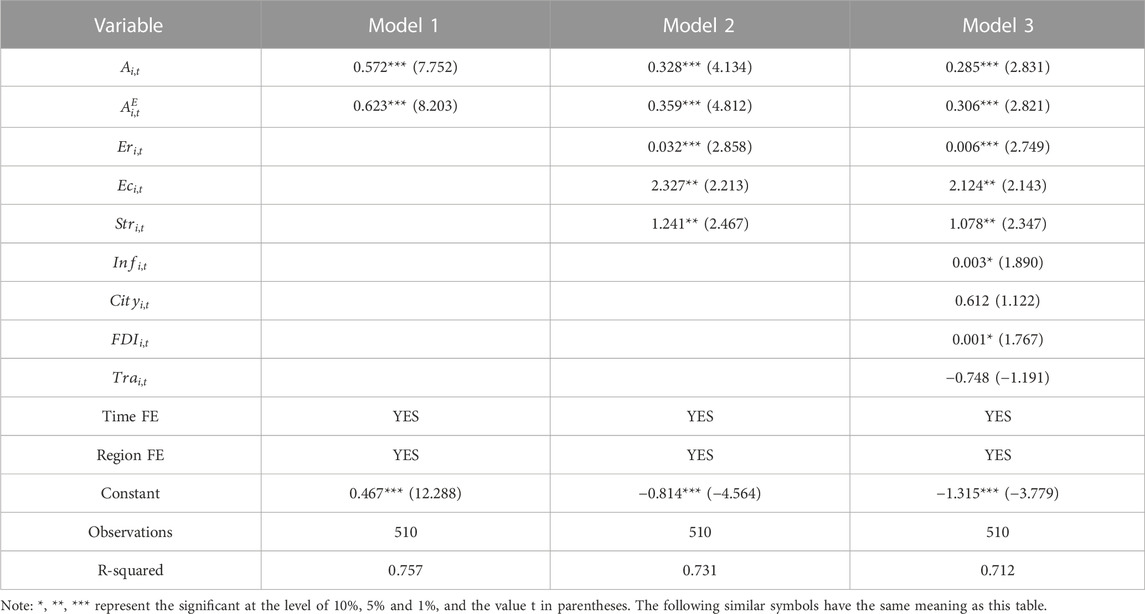
TABLE 3. Baseline regression results of the impact of technical progress on carbon productivity in China’s service industry.
Baseline regression results from Table 3 show that both non-energy factors technical progress and energy factor technical progress are positively correlated with carbon productivity of service industry in China, and both are significant at the 1% significance level. Specifically, in terms of regression coefficient, for every unit of technical progress in non-energy factors, the carbon productivity of service industry will increase by 0.285 unit, for every unit of technical progress in energy factor, the carbon productivity of service industry will increase by 0.306 unit. The regression coefficient shows that technical progress can significantly promote the improvement of carbon productivity in the service industry, and technical progress in energy factor has greater impact than technical progress in non-energy factors. The reason may be that in the case of stable output of service enterprises, the key to improving the carbon productivity of service industry is to achieve the same output with less carbon emissions, and the technical progress of energy factor has a more direct impact on carbon emissions. Among the control variables, the influence of control variables is significantly positive except urbanization level and trade openness which have insignificant effects on carbon productivity of service industry.
This section examines the impact of regional technical progress on carbon productivity of service industry in China. The regression results of the impact of regional technical progress on the carbon productivity of service industry in China are shown in Table 4.
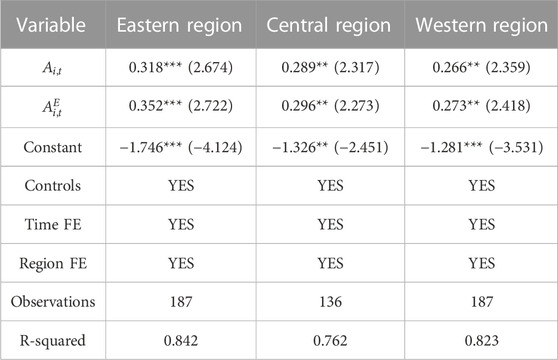
TABLE 4. Regression results of the impact of regional technical progress on carbon productivity of service industry in China.
From the regional regression results in Table 4, it can be seen that the technical progress of non-energy factors and the technical progress of energy factor have a positive impact on the carbon productivity of the service industry in eastern China at a significance level of 1%, and the influence coefficients are 0.318 and 0.352, respectively, that is, technical progress has significantly promoted the carbon productivity of service industry in Eastern China. Similarly, the two types of technical progress in the central and western regions of China have a positive and significant impact on the improvement of carbon productivity in the service industry in the region.
Specifically, in the central and western regions of China, the influence coefficients of technical progress of non-energy factors are 0.289 and 0.266, respectively, and the influence coefficients of technical progress of energy factor are 0.296 and 0.273, respectively. It can also be seen from the regression results in Table 4 that in the case of constant control variables, the impact of non-energy factors technical progress and energy factor technical progress on carbon productivity of service industry is positive in all regions of China, which is in line with the law of economic development. However, the influence degree is different, and the influence of the Eastern region is greater and more significant. Since the economic development of Eastern China has always been in a leading position, compared with the central and Western regions, its innovation infrastructure is better, the development level of the service industry is higher, and the whole innovation capability of service industry enterprises is stronger. Furthermore, some provinces in the Eastern region take the lead in carbon emissions trading pilot in the country, which makes the regional service industry enterprises have stronger awareness of carbon emission reduction.
In order to eliminate the possible influence of extreme values, all the relevant variables are processed with a 1% Winsorize tail up and down, and then repeats the baseline regression steps. The regression results are shown in Table 5. It can be seen from the regression results that the technical progress of energy factor and non-energy factors in China and the Eastern, central, and western regions has significant and positive impact on the carbon productivity of the service industry. From this perspective, the baseline regression results are robust.
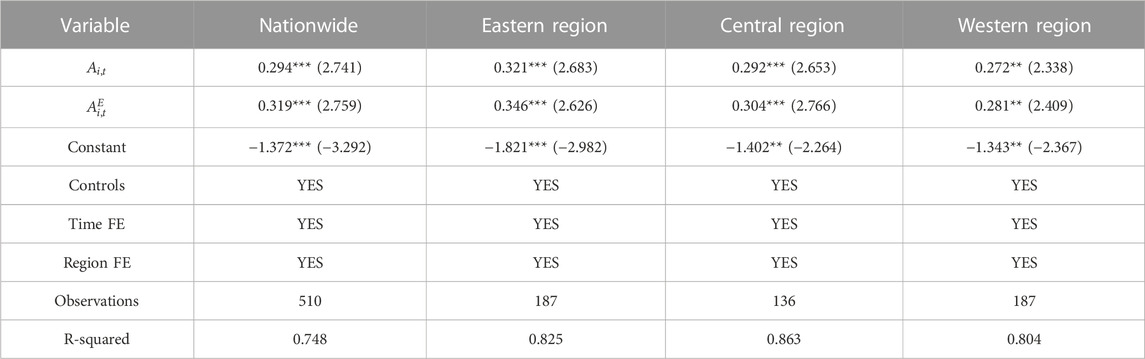
TABLE 5. Regression results of the impact of technical progress on carbon productivity of service industry in China after tail shrinkage treatment.
In order to test the sensitivity of the indicators, we replace the method of measuring carbon emission indicator in carbon productivity of China’s service industry with the method of Zhang and Zhang (2015), and re-measure the carbon productivity of service industry in each province, the measurement method of carbon emissions is replaced by Eq. 15:
In Eq. 15,
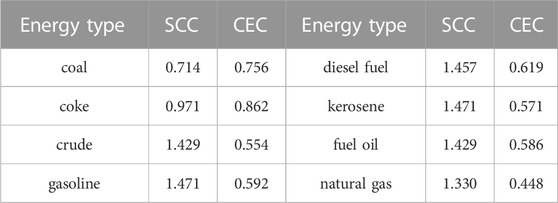
TABLE 6. Various indicators and coefficients after replacement of measurement method.
The model (14) is re-regressed using the carbon productivity data of China’s service industry after changing the measurement method, and the regression results are shown in Table 7. It can be found that the technical progress of non-energy factors and the technical progress of energy factor still have a significant positive impact on the carbon productivity of China’s service industry. From this perspective, the results of the baseline regression are robust.
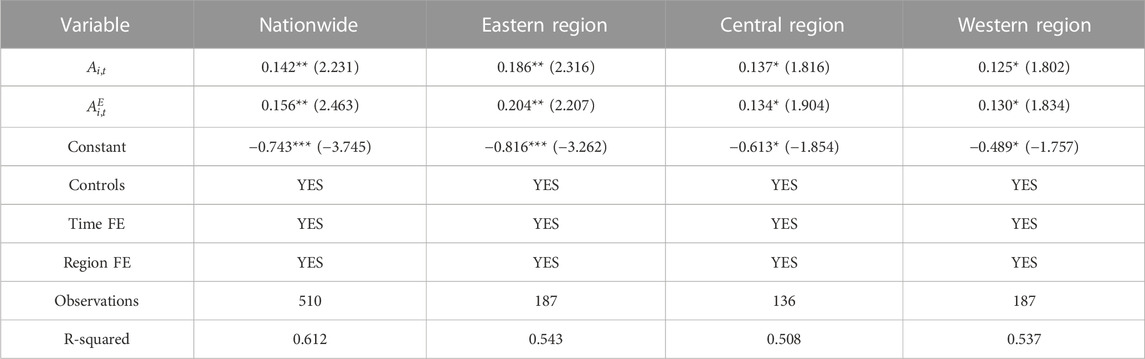
TABLE 7. Regression results of the impact of technological progress on carbon productivity in China’s service industry after replacement of explained variable.
Since the global financial crisis that broke out in 2008 had a great impact on the world economy and had a very serious impact on China’s national economy, we shortened the time period to 2009-2019, reprocessed the data of each variable with 2009 as the base year, and then regressed. Table 8 shows the regression results after re-selecting the time period, it can be seen from the regression results that the baseline regression results in this paper are still robust.
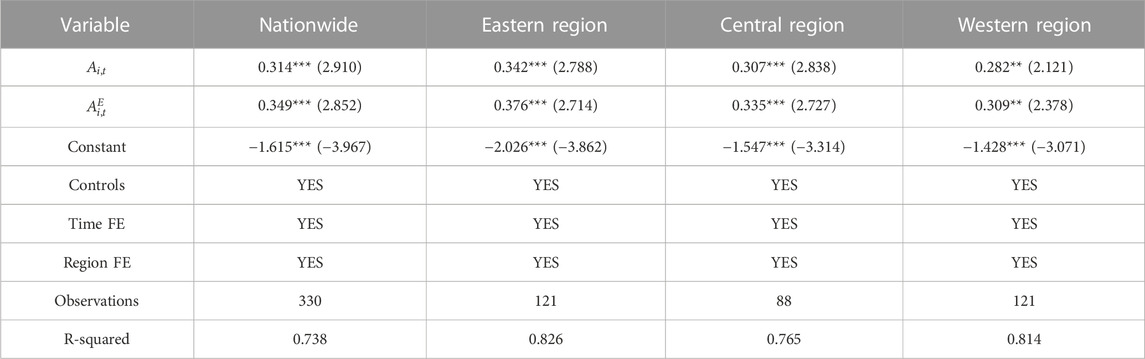
TABLE 8. Regression results of the impact of technical progress on carbon productivity in China’s service industry from 2009 to 2019.
Synthesis of the above three robustness test results, the baseline regression results in this paper are robust, that is, the technical progress of non-energy factors and the technical progress of energy factor have a significant and positive impact on the carbon productivity of China’s service industry. But in terms of the degree of impact, the Eastern region is larger than the central and Western regions, and the technical progress of energy factor has a greater impact on the carbon productivity of China’s service industry.
Considering that there is a reverse causal relationship between the explained variable carbon productivity and the explanatory variable non-energy factors technical progress and energy factor technical progress, in order to test the impact of reverse causality on the regression results, we refer to the practice of most literature and choose the one-period lag of non-energy factors technical progress and energy factor technical progress as instrumental variables to estimate the model by two-stage least squares (2SLS). Table 9 shows the regression results of the instrumental variable method, in which the LM statistic and the F statistic reflect the validity of the instrumental variable, indicating that they have passed the “unidentifiable” and “weak instrumental variable” tests. The regression results in Table 9 are basically consistent with the baseline regression results, indicating the conclusion that technical progress of non-energy factors and technical progress of energy factor can significantly improve the carbon productivity of the service industry is still valid.
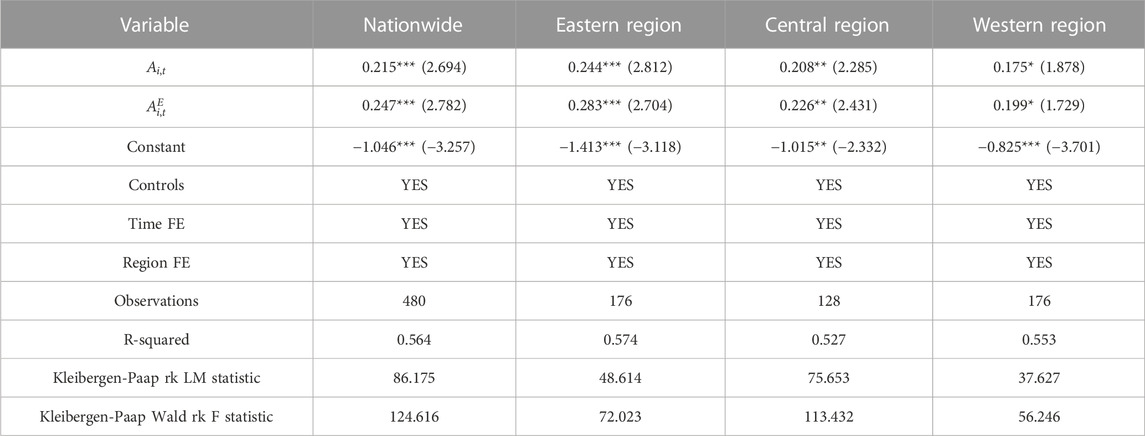
TABLE 9. Regression results of instrumental variable method.
In order to test whether there is an endogenous problem caused by omitted variables, we add more control variables to the model by referring to Liu et al. (2020), and then examine the regression coefficient and significant changes of core explanatory variables. We incorporate the level of innovation drive and labor education into the control variables of the model, and then conduct the baseline regression. In terms of indicator construction, firstly, the indicator of innovation-driven level of the whole region is based on patent grants per 10,000 people in each province; secondly, the indicator of the educational level of the regional labor force is based on the average education years of the population over 6 years old in each region. The regression results are shown in Table 10, the results show that the baseline regression results in this paper are still robust.
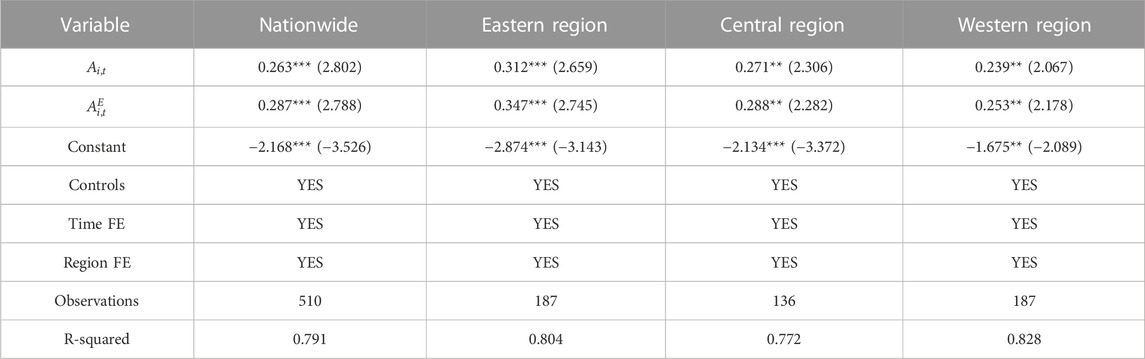
TABLE 10. Regression results after adding omitted variables.
This part empirically tests the mechanism of technical progress on carbon productivity of China’s service industry.
In order to test whether technical progress has an impact on China’s service industry carbon productivity through production efficiency of service industry, the following model is set:
In Eq. 16, the production efficiency of service industry (
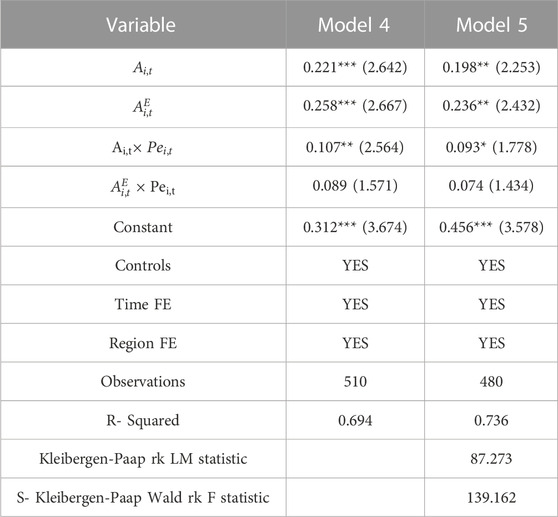
TABLE 11. Results of the first mechanism test in China’s service industry.
From the regression results in Table 11 model 4, it can be seen that after adding service industry
Considering that there is a reverse causal relationship between the explained variable carbon productivity and the explanatory variable non-energy factors technical progress, energy factor technical progress and production efficiency, in order to test the impact of reverse causality on the regression results, we refer to the practice of most literature and choose the one-period lag of non-energy factors technical progress, energy factor technical progress and production efficiency as instrumental variables to estimate the model by two-stage least squares (2SLS). Table 11 model 5 shows the regression results of the instrumental variable method, in which the LM statistic and the F statistic reflect the validity of the instrumental variable, indicating that they have passed the “unidentifiable” and “weak instrumental variable” tests. The regression results in model 5 are basically consistent with the regression results in model 4, indicating the regression results in model 4 is still valid.
To test whether technical progress has an impact on carbon productivity of China’s service industry through energy use efficiency of service industry, the following model is set:
In Eq. 17, the energy use efficiency of service industry (
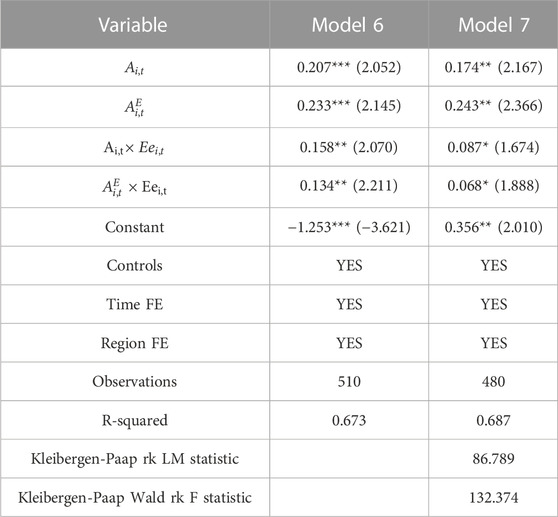
TABLE 12. Results of the second mechanism test in China’s service industry.
The regression results in Table 12 model 6 show that after adding
Considering that there is a reverse causal relationship between the explained variable carbon productivity and the explanatory variable non-energy factors technical progress, energy factor technical progress and energy use efficiency, in order to test the impact of reverse causality on the regression results, we refer to the practice of most literature and choose the one-period lag of non-energy factors technical progress, energy factor technical progress and energy use efficiency as instrumental variables to estimate the model by two-stage least squares (2SLS). Model 7 shows the regression results of the instrumental variable method, in which the LM statistic and the F statistic reflect the validity of the instrumental variable, indicating that they have passed the “unidentifiable” and “weak instrumental variable” tests. The regression results in model 7 are basically consistent with the regression results in model 6, indicating the regression results in model 6 is still valid.
We firstly explain the mechanism of technical progress on carbon productivity of service industry in theory. Secondly, we measure and analyze the technical progress of non-energy factors and energy factor in China’s service industry. Then we empirically study the impact of technical progress non-energy factors and technical progress of energy factor on carbon productivity in China’s service industry. And finally, we conduct an empirical test on the mechanism of technical progress of non-energy factors and energy factor on carbon productivity in China’s service industry, and draw the following main conclusion.
First, in terms of carbon productivity, the carbon productivity of China’s service industry increased continuously from 2003 to 2019, and the overall growth rate showed a fluctuating upward trend with an average annual growth of 6.31%. Second, the technical progress level of non-energy factors and energy factor in the whole country and the eastern, central, and western regions of China has shown an upward trend on the whole, and the technical progress level of non-energy factors is relatively high. The gap between the technical progress of non-energy factors and the technical progress of energy factor was large during 2004–2012 but gradually narrowed after 2012. The technical progress of non-energy factors and energy factor in service industry was the highest in the eastern region, and relatively close in the central and western regions. Third, technical progress had a significant and positive impact on the carbon productivity of China’s service industry from 2003 to 2019. In terms of types of technical progress, technical progress of energy factor had a greater impact. In terms of regions, technical progress had significant promoting effect on the improvement of carbon productivity of service industry in various regions, and the order is the eastern, central, and western according to the size of the regression coefficient. Besides, through the test of the mechanism, it is found that the technical progress of non-energy factors and technical progress of energy factor directly affect the carbon productivity of China’s service industry, and indirectly affect the carbon productivity of China’s service industry through the production efficiency of service industry and energy use efficiency of service industry.
According to the research conclusions of this paper, we put forwards the following policy suggestion for the improvement of carbon productivity in China’s service industry:
Firstly, faced with the increasing carbon emissions in China’s service industry, we can optimize the energy structure by improving the energy policy system to alleviate this problem. On the demand side, first of all, relevant policies should be formulated based on the development characteristics of China’s service industry and combined with the industrial characteristics of China’s service industry to improve the energy policy system focusing on improving carbon productivity. Secondly, policy guidance, energy subsidies, strengthening the supervision of energy conservation and emission reduction and other methods can be used in the short term to promote the popularization of clean energy and guide the energy demand of service enterprises to lean towards clean energy. Finally, it is necessary to reduce the various costs of clean energy used by service enterprises and promote the greening of the whole service industry. On the supply side, we should vigorously develop clean energy, encourage investment in clean energy, broaden access to using clean energy, increase the proportion of clean energy in China’s energy supply structure, provide sufficient clean energy supply for the energy market, gradually increase service enterprises’ preference for clean energy in the long term and promote the wide application of clean energy in China’s service industry, so as to reduce carbon emissions in China’s service industry.
Secondly, focusing on technical innovation, we should give full play to the role of technical progress in promoting carbon productivity in China’s service industry. First of all, we should support non-energy technology innovation activities of service enterprises using industrial orientation policy. Besides, special support should be given to technical innovation of China’s service enterprises in clean energy to reduce carbon emissions. Finally, we should pay more attention to the cultivation of outstanding talents in the service industry and the input in scientific innovation to promote the industrial upgrading of China’s service industry and improve the carbon productivity of the service industry.
Finally, according to the level of regional development, the carbon productivity of China’s service industry should be improved according to local conditions. For the eastern of China where the development of the service industry is relatively mature, the output level of the service industry has always been in a leading position and tends to be stable, the focus of improving carbon productivity can be placed on reducing CO2 emissions through technical innovation of energy factor. We need to increase subsidies for research and development of clean energy technology and encourage the development of the clean energy industry to provide technical support for service enterprises to develop cleaner production models. For the central and western of China where the service industry is still in the development stage, the output of the service industry still has a large space for improvement. We should actively implement relevant policies and plans for the development of the service industry in the central and western of China, narrow the development gap with the eastern of China. Meanwhile, both the improvement of production efficiency and energy use efficiency should be taken into account to achieve win-win development of output growth and low-carbon emission reduction in service industry, so as to improve the carbon productivity of service industry.
There are some limitations in this paper. Firstly, when discussing the factor input of production activities, energy factor is introduced into the production function composed of traditional two factors (labor factor and capital factor) and becomes the third input factor, but the factors are only divided into non-energy factors and energy factor when setting the production function, which means non-energy factors only include labor factor and capital factor without considering other factor input. In fact, other factors such as institutions will also have an important impact on production. Secondly, in terms of data, due to the limitations of various data acquisition of the service industry, the heterogeneity analysis only analyzes the regional heterogeneity and there is a lack of analysis in the heterogeneity of segmented industries of the service industry. Finally, in terms of the estimation of elasticity of substitution, the research method in this paper can only estimate the fixed elasticity of substitution in each region, and cannot analyze its dynamic changes. Further studies are needed in the future.
The future directions of improvement are as follows: Firstly, the selection of input factors will be more diversified. By constructing a multi-factor production function model to analyze the relationship between the multiple factors and explore the impact of these factors on the carbon productivity of China’s service industry. Secondly, the research objects will be more detailed. With the continuous development of the service industry, all kinds of data of the service industry in the world will be gradually enriched, and the analysis of the service industry segments will be realized. Finally, static analysis will be transformed into dynamic analysis. Current studies rarely analyze the dynamic changes of elasticity of substitution between factors. Future studies will gradually focus on the dynamic changes of elasticity of substitution between factors, so as to make the research conclusions closer to reality.
The raw data supporting the conclusion of this article will be made available by the authors, without undue reservation.
All authors contributed to the study conception and design. Conceptualization, formal analysis, funding acquisition, resources, supervision and visualization were performed by ZW. Conceptualization, data curation, formal analysis, investigation, methodology, project administration, resources, software, validation, visualization, roles/writing—original draft and writing—review and editing were performed by WH. Writing—review and editing and visualization were performed by YG, YD, and FZ. All authors read and approved the final manuscript.
This work was supported by the National Social Science Fund of China [Grant number 20BJL095] and Central Universities Fundamental Research Operating Expenses Scientific Research Cultivation Project of Zhongnan University of Economics and Law [Grant number 2722022EK003].
This paper cordially appreciates the valuable comments from the editor and reviewers.
The authors declare that the research was conducted in the absence of any commercial or financial relationships that could be construed as a potential conflict of interest.
All claims expressed in this article are solely those of the authors and do not necessarily represent those of their affiliated organizations, or those of the publisher, the editors and the reviewers. Any product that may be evaluated in this article, or claim that may be made by its manufacturer, is not guaranteed or endorsed by the publisher.
Bai, C. Q., Kerui, D., Ying, Y., and Feng, C. (2019). Understanding the trend of total factor carbon productivity in the world: Insights from convergence analysis. Energy Econ. 81 (01), 698–708. doi:10.1016/j.eneco.2019.05.004
Berndt, E. R., and Christensen, L. R. (1974). Testing for the existence of a consistent aggregate index of labor inputs. American economic review. Am. Econ. Assoc. 64 (3), 391–404.
BP World Energy Statistics Yearbook (2021). BP statistical review of world energy. United Kingdom: BP.
Chen, J. H., and Li, Q. C. (2021). Study on the influencing factors of carbon emissions from energy consumption in sichuan province under the background of chengdu - chongqing double city economic circle construction: Based on the perspective of LMDI model. Ecol. Econ. 37 (12), 30–36.
Department of Energy Statistics and National Bureau of Statistics (2020). China energy statistical Yearbook. Beijing: China Statistics Press.
Du, K. R., and Li, J. L. (2019). Towards a green world: How do green technology innovations affect total-factor carbon productivity. ENERGY POLICY 131, 240–250. doi:10.1016/j.enpol.2019.04.033
Fan, L. W., You, J. M., Zhang, W., and Zhou, P. (2020). How does technological progress promote carbon productivity? Evidence from Chinese manufacturing industries. J. Environ. Manag. 277 (09), 111325–111341. doi:10.1016/j.jenvman.2020.111325
Gao, W. J., and Zhu, S. (2016). The technological progress route alternative of carbon productivity promotion in China’s industrial sector. Nat. HAZARDS 82 (3), 1803–1815. doi:10.1007/s11069-016-2271-7
Guo, F., Meng, S. Q., and Sun, R. J. (2021). The evolution characteristics and influence factors of carbon productivity in China’s industrial sector: From the perspective of embodied carbon emissions. Environ. Sci. Pollut. Res. 28 (36), 50611–50622. doi:10.1007/s11356-021-14271-0
Han, B. (2021). Research on the influence of technological innovation on carbon productivity and countermeasures in China. Environmental Science and Pollution Research 28 (13), 880–894.
Harberger, A. C. (1978). “Perspectives on capital and technology in less-developed countries. Contemporary economic analysis,” in The Conf. of the Association of Univ. Teachers of Economics, April 1977.
Hassler, J., Krusell, P., and Olovsson, C. (2012). Energy-saving technical change. Cambridge: National Bureau of Economic Research. NBER Working Paper No.18456.
Hoffinann, V. H., and Busch, T. (2008). Corporate carbon performance indicators. J. Industrial Ecol. 12 (04), 505–520. doi:10.1111/j.1530-9290.2008.00066.x
IPCC Guidelines for National Greenhouse Gas Inventories (2006). Intergovernmental Panel on Climate Change. Kanagawa: Institute-for-Global-Environmental-Strategies.
Jiang, H. D., Purohit, P., Liang, Q. M., Dong, K., and Liu, L. J. (2022a). The cost-benefit comparisons of China's and India's NDCs based on carbon marginal abatement cost curves. Energy Econ. 109, 105946. doi:10.1016/j.eneco.2022.105946
Jiang, H. D., Xue, M. M., Liang, Q. M., Masui, T., and Ren, Z. Y. (2022b). How do demand-side policies contribute to the electrification and decarburization of private transportation in China? A CGE-based analysis. Technol. Forecast. Soc. Change 175, 121322. doi:10.1016/j.techfore.2021.121322
Leng, Y. L., Xian, G. M., and Du, S. Z. (2015). Foreign direct investment and haze pollution: An empirical analysis based on Chinese provincial panel data. Int. Trade Issues 2015 (12), 74–84. doi:10.13510/j.cnki.jit.2015.12.007
León-Ledesma, M. A., Mcadam, P., and Willman, A. (2010). Identifying the elasticity of substitution with biased technical change. Am. Econ. Rev. 100 (4), 1330–1357. doi:10.1257/aer.100.4.1330
Li, L., and Tao, F. (2012). Research on the impact of environmental regulation on industrial technological progress: Empirical test based on industrial panel data of provinces from 2005 to 2009. Sci. Technol. Manag. Res. 32 (04), 41–45. doi:10.3969/j.issn.1000-7695.2012.04.011
Li, W., and Peng, L. (2018). Changes in carbon productivity in the service sector and its drivers from a heterogeneity perspective. Mod. Manag. 38 (02), 119–122. doi:10.19634/j.cnki.11-1403/c.2018.02.033
Li, X. P., Wang, S. B., and Hao, L. L. (2016). Environmental regulation, innovation drivers and inter-provincial carbon productivity changes in China. J. China Univ. Geosciences 16 (01), 44–54. doi:10.16493/j.cnki.42-1627/c.2016.01.005
Li, X. P., Yu, D. S., and Yu, J. J. (2020). The spatial spillover effect of heterogeneous environmental regulation on carbon productivity—based on the spatial Durbin model. China Soft Sci. 352 (04), 82–96.
Liao, M. L., Ren, Y. F., and Zhang, X. X. (2018). Calculation of energy - biased technological progress and its impact on energy utilization efficiency: Based on empirical study of 27 subsectors of manufacturing industry. Financ. Rev. 10 (02), 15–31+122-123.
Liu, C. J., and Hu, W. (2016). Has foreign direct investment boosted China’s carbon productivity? Empirical analysis based on a spatial panel Durbin model. World Econ. Stud. 32 (01), 99–109+137. doi:10.13516/j.cnki.wes.2016.01.010
Liu, G. P. (2015). Factor decomposition of carbon productivity in China. Manag. Mod. 35 (04), 49–51. doi:10.3969/j.issn.1003-1154.2015.04.017
Liu, S. Y., Lin, Z. F., and Leng, Z. P. (2020). Have tax incentives improved innovation? Testing based on enterprise life cycle theory. Econ. Res. 55 (06), 105–121.
Long, R. Y., Gan, X., Chen, H., Wang, J. Q., and Li, Q. W. (2020). Spatial econometric analysis of foreign direct investment and carbon productivity in China: Two-tier moderating roles of industrialization development. Resour. Conservation Recycl. 155, 104677. doi:10.1016/j.resconrec.2019.104677
Lu, J., and Liu, Y. Q. (2016). Elasticity of factor substitution, capital expansion and share change of factor compensation in China’s industrial sector. World Econ. 39 (03), 118–143. doi:10.19985/j.cnki.cassjwe.2016.03.007
Lucas, R. E. (1988). On the mechanics of economic development. J. Monetary Econ. 22 (1), 3–42. doi:10.1016/0304-3932(88)90168-7
Massell, B. F. (1961). A disaggregated view of technical change. J. political Econ. 69 (6), 547–557. doi:10.1086/258575
Meng, M., and Niu, D. X. (2012). Three-dimensional decomposition models for carbon productivity. Energy 46 (01), 179–187. doi:10.1016/j.energy.2012.08.038
Mo, J. Y. (2021). Do environmental policy and innovation improve carbon productivity? Evidence from the Korean emission trading scheme. ENERGY and Environ. doi:10.1177/0958305X211064575
Nishimizu, M., and Page, J. M. (1982). Total factor productivity growth, technical progress and technical efficiency change: Dimensions of productivity change in yugoslavia. Econ. J. 92, 929–936. doi:10.2307/2232675
Ren, X., Wu, X., Liu, Y., and Sun, S. (2021). The spatial spillover effect of environmental regulation and technological innovation on industrial carbon productivity in China: A two-dimensional structural heterogeneity analysis. Math. Problems Eng. 2021, 1–15. doi:10.1155/2021/5613525
Romer, P. M. (1986). Increasing returns and long-run growth. J. Political Econ. 94, 1002–1037. doi:10.1086/261420
Smith, A. (1776). An inquiry into the nature and Causes of the Wealth of nations. Hamilton: McMaster University Archive for the History of Economic Thought.
Solow, R. M. (1956). A contribution to the theory of economic growth. Q. J. Econ. 70, 65–94. doi:10.2307/1884513
Solow, R. M. (1957). Technical change and the aggregate production function. Rev. Econ. Statistics 39 (03), 312–320. doi:10.2307/1926047
Sun, L. X., Xia, Y. S., and Feng, C. (2020). Income gap and global carbon productivity inequality: A meta-frontier data envelopment analysis. Sustain. Prod. Consum. 26 (12), 548–557. doi:10.1016/j.spc.2020.12.026
Sun, W., Han, Y. N., Zhang, F., Hu, C. X., and He, Y. J. (2021). Research on carbon productivity of the construction industry in Beijing-Tianjin-Hebei region using system dynamics model. Int. J. Glob. WARMING 25 (3), 390–407. doi:10.1504/ijgw.2021.10042678.2021.119008
Swan, T. W. (1956). Economic growth and capital accumulation. Econ. Rec. 32, 334–361. doi:10.1111/j.1475-4932.1956.tb00434.x
Tian, Y. X., and Yang, X. M. (2020). Asymmetric effects of industrial energy prices on carbon productivity. Environ. Sci. Pollut. Res. 27 (33), 42133–42149. doi:10.1007/s11356-020-10204-5
Wang, K., Xian, Y., Wei, Y. M., and Huang, Z. M. (2016). Sources of carbon productivity change: A decomposition and disaggregation analysis based on global luenberger productivity indicator and endogenous directional distance function. Ecol. Indic. 66, 545–555. doi:10.1016/j.ecolind.2016.02.034
Wang, L., and Han, Y. J. (2017). The relationship between OFDI reverse technology spillover and home country industrial structure optimization. J. Foreign Econ. Trade Univ. 2017 (05), 53–64. doi:10.13509/j.cnki.ib.2017.05.005
Wu, C. Q., and Du, Y. (2018). Research on the influence of biased technological progress on total factor energy utilization efficiency of yangtze river economic belt. China Soft Sci. 2018 (03), 110–119.
Wu, Y. R. (2009). China’s capital stock series by region and sector. University of Western Australia. Business School.
Xie, H. Q., Huang, L. Y., and Liu, D. D. (2018). Global value chain embedding improve China’s manufacturing carbon productivity. Int. Trade Issues 2018 (12), 109–121. doi:10.13510/j.cnki.jit.2018.12.013
Xiong, C. H., Wang, G. L., and Xu, L. T. (2021). Spatial differentiation identification of influencing factors of agricultural carbon productivity at city level in Taihu lake basin, China. Sci. TOTAL Environ. 800, 149610. doi:10.1016/j.scitotenv.2021.149610
Xu, D. L., and Wang, Y. J. (2015). Regional differences and influencing factors of my country’s coastal fishery carbon productivity. J. China Agric. Univ. 20 (02), 284–290. doi:10.11841/j.issn.1007-4333.2015.02.36
Xu, R., Wu, Y. M., and Huang, Y. (2020). Measurement and convergence of carbon productivity across Shanghai’s manufacturing sectors. Int. J. Clim. Change Strategies Manag. 12 (03), 369–387. doi:10.1108/ijccsm-11-2019-0065
Yang, Q., Jiang, C. T., Jiang, X. D., and Jiang, C. L. (2021). Can high - tech industrial agglomeration improves carbon productivity. Macroecon. Res. 2021 (04), 141–159. doi:10.16304/j.cnki.11-3952/f.2021.04.012
Yang, W. J. (2015). Factors affecting environmental performance of Chinese provincial industries: Empirical analysis based on intertemporal DEA - tobit model. J. Beijing Univ. Technol. (Social Science Edition) 17 (02), 40–48. doi:10.15918/j.jbitss1009-3370.2015.0206
Zhang, C. J., and Zhang, Z. Y. (2015). The spatial effect of energy endowment and technological progress on China’s carbon emission intensity. China’s Popul. Resour. Environ. 25 (09), 37–43. doi:10.3969/j.issn.1002-2104.2015.09.006
Zhang, C., Wang, J. K., Shi, W. Y., and Li, Y. (2014). Factor decomposition of China’s regional carbon productivity fluctuations. Chin. Population· Resour. Environ. 24 (10), 41–47. doi:10.3969/j.issn.1002-2104.2014.10.007
Zhang, H., and Xu, K. N. (2016). Impact of environmental regulation and technical progress on industrial carbon productivity: An approach based on proxy measure. SUSTAINABILITY 8 (8), 819. doi:10.3390/su8080819
Zhang, L. L., Xiong, L. C., Cheng, B. D., and Yu, C. (2018). How does foreign trade influence China’s carbon productivity? Based on panel spatial lag model analysis. Struct. Change Econ. Dyn. 47, 171–179. doi:10.1016/j.strueco.2018.08.008
Zhang, Y. J. (2011). Technological progress, structural change and carbon productivity growth. China Sci. Technol. Forum 2011 (05), 114–120. doi:10.13580/j.cnki.fstc.2011.05.020
Keywords: service industry, technical progress, non-energy factors technical progress, energy factor technical progress, carbon productivity
Citation: Wu Z, Huang W, Ge Y, Dai Y and Zu F (2023) Research on the impact of technical progress on the carbon productivity in China’s service industry. Front. Environ. Sci. 11:1143057. doi: 10.3389/fenvs.2023.1143057
Received: 12 January 2023; Accepted: 20 February 2023;
Published: 02 March 2023.
Edited by:
Fayyaz Ahmad, Lanzhou University, ChinaReviewed by:
Maham Furqan, Oregon State University, United StatesCopyright © 2023 Wu, Huang, Ge, Dai and Zu. This is an open-access article distributed under the terms of the Creative Commons Attribution License (CC BY). The use, distribution or reproduction in other forums is permitted, provided the original author(s) and the copyright owner(s) are credited and that the original publication in this journal is cited, in accordance with accepted academic practice. No use, distribution or reproduction is permitted which does not comply with these terms.
*Correspondence: Wenying Huang, d2VueWluZ2h1YW5nOTdAMTI2LmNvbQ==
Disclaimer: All claims expressed in this article are solely those of the authors and do not necessarily represent those of their affiliated organizations, or those of the publisher, the editors and the reviewers. Any product that may be evaluated in this article or claim that may be made by its manufacturer is not guaranteed or endorsed by the publisher.
Research integrity at Frontiers
Learn more about the work of our research integrity team to safeguard the quality of each article we publish.