 Jinhuang Mao1,2
 Meimei Wang
94% of researchers rate our articles as excellent or good
Learn more about the work of our research integrity team to safeguard the quality of each article we publish.
Find out more
ORIGINAL RESEARCH article
Front. Environ. Sci. , 10 February 2023
Sec. Environmental Economics and Management
Volume 11 - 2023 | https://doi.org/10.3389/fenvs.2023.1138396
Introduction: Based on the green economic growth theory and the background of comprehensive promotion of high-quality development, the article evaluates and analyzes the dynamic evolution, convergence mechanism and influencing factors of Green Total Factor Productivity (GTFP) growth in 19 major urban agglomerations.
Methods: By using the SBM-GML model method, the paper aims to study the existence of differences in green economic operation in urban agglomerations.
Results: (1) The GTFP of Chinese urban agglomerations is in an effective state driven by technological progress, and the core driving role of technical efficiency has not been fully exploited, the constraints and limitations of resources, energy and environment on the space of high-quality development of urban agglomerations still exist. (2) There is no δ convergence in the GTFP growth of urban agglomerations, but there is a trend of β convergence, the pattern of coordinated regional development is gradually forming. (3) The eastern urban agglomerations show the competitiveness of green development and spatial convergence rate of GTFP growth better than other regions, and even present a synergistic development situation. (4) Industrial structure and financial service level have positive effects on GTFP growth of urban agglomerations, while business environment and capital deepening level have negative effects on them.
Discussion: The research aims to provide reference for decision making to comprehensively promote regional synergistic development strategy in urban agglomerations of mainland China.
How to correctly deal with the inherent relationship between resources, environment and economic development and achieve a “win-win” situation between sustainable economic growth and resource protection has always been a hot topic of concern for all sectors of society. In 2017, the 19th National Congress of the Communist Party of China proposed that China’s economy has shifted from a stage of high-speed growth to a stage of high-quality development. High-quality development focuses on both “quantity” and “quality”, with the fundamental driving force lying in economic vitality, innovation and competitiveness, all of which are closely linked and inseparable from green development (Li et al., 2013; Liu and Qin, 2019; Liu et al., 2018; Liu et al., 2019). In other words, green development is a key sign of China’s shift from speed economy to high-quality development (Liu et al., 2019), it is also the key to cracking the dilemma of how to achieve harmony between economic and social development and resources and environment (Yu et al., 2019).
In the context of deepening regional integration, urban agglomerations, as the center of gravity of national economic development and the strategic pivot point of regional development, have become the frontier position and high-quality spatial carrier for achieving green development in China (Huang and Li., 2017), and are directly related to the promotion and implementation of the green development concept. However, as the spillover effect continues to strengthen, urban agglomerations have gradually become core regions with high economic concentration and high concentration of resource and environmental problems (Barbier, 2011). Influenced by the traditional crude development model, a series of problems such as low utilization rate of resource intensification and ecological and environmental pollution have emerged in the development of urban agglomerations (Liu et al., 2022), and the development mode of massive construction, massive consumption and massive emission has not been fundamentally reversed. In addition, due to the obvious spatial heterogeneity characteristics of regional natural conditions, resource endowments and economic bases, which cause significant differences in scale levels, development directions and environmental carrying capacity of each urban agglomeration, there are obvious spatial non-equilibrium in the green economic efficiency of Chinese urban agglomerations, and the change trends and trajectories of economic efficiency of each urban agglomeration have significant differences (Shi and Li, 2019; Xu et al., 2019; She et al., 2020; Wang et al., 2021). Therefore, it is important to objectively evaluate the green economic operation efficiency of each urban agglomeration, analyze what kind of differences exist in the green economic operation of each urban agglomeration, what are the influencing factors, what is the convergence nature of green economic efficiency, and whether the lagging urban agglomerations have a catching-up effect on the leading urban agglomerations. It is of great theoretical and practical value to clarify the development potential of urban agglomerations and open up a new road for urban agglomeration construction (Zhang et al., 2022).
The key to scientifically evaluating the level of green development of urban agglomerations lies in accurate measurement using reasonable and effective indicators, so as to understand and analyze the status quo, characteristics and changing trends of green development as a whole. GTFP, which incorporates resource consumption and pollution emission factors into the production function framework, gives expression to the dynamic changes of productivity under the constraints of resources and environment. It is the true reflection of the quality and efficiency of economic growth (Hu and Yang, 2011; Fu et al., 2018). Therefore, this paper uses GTFP to characterize green development. Chinese scholars’ research on GTFP focuses on three aspects: perspective exploration, methodological choice and influencing factors. In terms of research perspective exploration, the main body of regulating China’s regional economic growth is the “regional system”, which is accompanied by different regional economic development strategies at different stages (Liu et al., 2019). Based on the logic of “three economic zones, four sectors, eight comprehensive economic zones, and urban agglomerations”, the existing studies have thoroughly explored the current situation, differences or causes of China’s green development from two dimensions of inter-region. The prominent contribution of this paper is the innovation of research perspective, with a key review on the research related to GTFP of urban agglomerations.
A review of existing studies shows that only a few scholars have placed their research perspective at the level of urban agglomerations, mostly on local urban agglomerations or developed urban agglomerations. For example, Li et al. (2016) studied the green innovation efficiency of the middle reaches of Yangtze River Delta Urban Agglomeration (UAYRD), found that most cities are in the bonus period of green development. Li and Liu (2019) studied three urban agglomerations of Yangtze River Delta, Pearl River Delta and Beijing-Tianjin-Hebei, finding that the three urban agglomerations have a low green total factor productivity. Studies on Shandong Peninsula Urban Agglomeration (UASDP) concluded that there is more room for improving the level of green development in the four urban agglomerations along the eastern coast. It is not difficult to find that these regions represent the highest level of development of urban agglomerations in China, and the green development results measured based on locally developed urban agglomerations may be different from the national level, which leads to errors in the analysis results and results in unrepresentative conclusions. Although some scholars have also expanded the research perspective further (Huang and Li., 2017), their studies are mostly dedicated to the horizontal dimension of green development in urban agglomerations and the direct impact effects during the same period, without involving the degree of balanced green development in urban agglomerations. The plan for coordinated regional development is one of the major national strategies in the new era, which represents the general tone for future work and efforts. To further promote the coordinated development of regional economies, it is necessary to attach importance to the coordinated development of urban agglomerations (Wang and Jin., 2018). However, according to the available literature, there is no research on the coordinated green development of 19 national urban agglomerations of China.
Based on the above realistic background and research progress, this paper will conduct an in-depth study on the green development efficiency of Chinese urban agglomerations and their unbalanced degree on the basis of theoretical analysis, with a view to accurately understanding the differences in green economic operation efficiency of urban agglomerations and promoting the coordinated development of cross-regional urban agglomerations. It provides three main contributions as follows: 1) It scientifically analyzes the convergence pattern of GTFP in urban agglomerations according to the green economic growth theory based on the case study of 19 urban agglomerations to be constructed in the “outline of the 14th Five-Year Plan and 2035 Visionary Goals for National Economic and Social Development of the People’s Republic of China”, filling the research gap. 2) It combines the DEA-SBM model with the GML index to compensate for the limitations of the traditional DEA model that ignores the discontinuity of the expected output and the GML index and the existence of linear programming non-solutions, so as to measure the GTFP growth more realistically; 3) It constructs a dynamic panel model to identify and explore the paths to promote GTFP growth in urban clusters, and provides empirical support and decision-making basis for the formation of a regional economic layout with complementary advantages for high-quality development.
As the main driving force of regional development and the main body of new urbanization development, urban agglomerations have a crucial strategic position in the promotion and implementation of China’s green development concept. In view of the fact that it is difficult to truly represent the overall urban agglomerations in China through correlation analysis based on local urban agglomerations, this paper identifies the 19 urban agglomerations mentioned in the outline of the 14th Five-Year Plan and 2035 Visionary Goals for National Economic and Social Development of the People’s Republic of China as the research objects. The cities under the jurisdiction of the urban agglomeration are determined according to the urban agglomeration development plans issued by the central and local governments. Based on data availability and comparability, the study area mainly covers municipalities and prefecture-level cities, excluding Qianjiang City, Changji Hui Autonomous Prefecture and Qiannan Buyi Miao Autonomous Prefecture due to the serious lack of research-related data. A total of 223 cities in 19 urban agglomerations are determined (Figure 1).
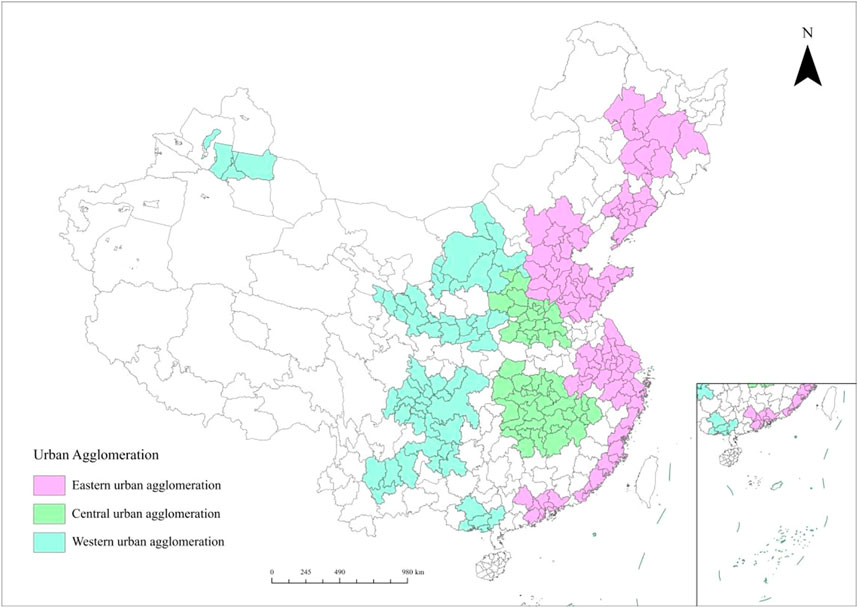
FIGURE 1. The distribution of urban agglomeration in mainland China.
This study focused on 223 cities in 19 urban agglomerations in China from 2010 to 2019. The data were obtained from China Regional Statistical Yearbook, China Environmental Statistical Yearbook, China Urban Statistical Yearbook, EPS Database, Statistical Yearbooks and Statistical Bulletins of Each City from 2010 to 2019. Some missing data were complemented by linear interpolation method.
This research period is chosen to objectively reflect the economic development situation of urban agglomerations in mainland China, because the economic development after 2019 was affected by the COVID-19 pandemic, the statistical data after 2019 cannot reflect the normal situation and law of economic development.
The labor input in the production process should be measured by the time spent under standard work intensity, however, China does not have relevant statistics on labor hours currently. Therefore, the number of employees in the whole society, which is commonly used in the current research, is chosen as the labor input for each city.
In current research, physical capital stock is commonly used to measure capital input, and this paper employs the perpetual inventory method to estimate physical capital stock. It is calculated as follows:
Where,
Further there are
Where,
Due to the lack of energy consumption data of coal and oil at the city level, the social consumption of electricity is chosen as a proxy indicator of energy input.
GDP of urban agglomeration cities is used as a proxy variable for output level. To eliminate the effect of price changes, the nominal GDP of each year of the urban agglomeration cities is converted to the real value of 2010 as the base period as the output variable according to the GDP index.
Industrial wastewater emissions, sulfur dioxide emissions, and smoke (dust) emissions are considered as “bad” outputs (Tu, 2008; Chen et al., 2018), to measure the cost of ecological environmental pollution in production.
Industrial structure adjustment plays an important role in regulating resource consumption and pollution emissions, determining the quality of regional economic growth. In this paper, the gross value of the primary industry is included in the calculation of the degree of industrial advancement to alleviate the “virtual-high” ratio of the gross value of the tertiary industry to the gross value of the secondary industry. The real advancement is the advancement that can improve the per capita welfare, so the ratio of GDP per capita to the standard of high-income countries is introduced to measure the degree of per capita welfare increase brought by the advancement of industrial structure. The equation is shown as follows:
The government spending on science and technology often represents the degree of local attention to science and technology innovation, which plays a leading role in social capital investment in science and technology, so this paper measures the financial technology investment by the proportion of science and technology expenditure to total fiscal budget expenditure (Chen et al., 2018).
In general, a better business environment leads to higher levels of green total factor productivity. In view of the statistical caliber and data availability, this paper uses the proportion of employed persons in other organizations to those in urban organizations to represent the business environment.
The construction of green financial system is conducive to the improvement of GTFP. This paper measures the level of local financial services using the ratio of loan balance of financial institutions to regional GDP (Qi and Xu., 2018).
More open trade facilitates access to advanced products and services, learning and introducing new technologies, and thus improving green total factor productivity in the region. In this paper, the proportion of total imports and exports to GDP, namely, the trade dependence, is used as an indicator to measure the level of opening up.
A higher capital stock per capita means a stronger sustainable development capacity of regional industries, and this paper measures the degree of capital deepening by the ratio of capital to labor.
Conventional radial Data Envelopment Analysis (DEA) efficiency measurement is prone to overestimating the efficiency value of the research object when there is non-zero slack with excessive input or insufficient output. The non-angle, non-radial SBM model is a further refinement of the traditional radial model due to the inclusion of non-desired outputs, and the SBM model can also prevent differences in measurement results caused by angle selection and better reflect economic reality. Besides, the GML index solves the problems of ML index discontinuity and linear programming unsolvable.
The SBM model incorporates the non-expected output, which is a further improvement of the traditional radial model. Meanwhile, the SBM model can avoid the differences in measurement results due to the choice of perspective and better reflect the economic reality, and the GML index solves the problems of discontinuity and the existence of linear programming non-solutions of the ML index. Therefore, this paper combines the DEA-SBM model with the GML index to measure the changes of green total factor productivity in Chinese urban agglomerations, which can reflect the change of GTFP in Chinese urban agglomerations and further decompose it.
The set of production possibilities containing both desirable and undesirable outputs is constructed. Each city in the urban agglomerations is considered as a Decision-Making Unit (DMU) to construct the production frontier. In each production period
Where,
The directional distance function is a method used to measure the distance from each decision unit to the optimal production possibility boundary. After determining the input-output combination, the directional distance function is constructed as follows:
Where,
Referring to the method of Fukuyama and Weber (2010), the SBM directional distance function for the urban agglomeration city
Where,
The GML index solves the problem that the ML index in the form of geometric mean is discontinuous and tends to lead to no feasible solution to the linear programming, and can more accurately reflect the long-term changes of GTFP (Oh and Heshmati, 2010).
On the basis of the production possibility set constructed above, the global production technology set
The index can be further decomposed into a Global Technological Efficiency Change (GEC) index, which measures the proximity of each DMU to the optimal productivity frontier, and a Global Technological Progress Change (GTC) index, which measures the dynamic outward expansion of the production possibility frontier. The decomposition equation is as follows:
Where,
δ test examines the trend in the variation of GTFP differences between regions over time, usually represented by standard deviations and variation coefficients. The decreasing dispersion with time indicates convergence, while the opposite indicates a tendency of divergence. In this paper, the coefficient of variation is used to test the convergence of δ, and the expression is as follows:
Where,
β convergence is generally divided into absolute β convergence and conditional β convergence in current studies; The conditional β convergence is mainly analyzed to see whether each research object converges to its respective steady-state level, which is not elaborated in this paper. Any absolute β convergence implies the growth rate of GTFP is negatively correlated with its initial level and will converge to the same steady-state level and growth rate at some point in the future. The model is expressed as follows:
Where, the left side represents the annual growth rate of GTFP in region
This paper constructs the following panel econometric analysis model. To facilitate the analysis of the elasticity coefficients and to reduce the effect of heteroskedasticity, the paper takes logarithms for all the research variables.
Where,
The GTFP of China’s 19 major urban agglomerations was effective from 2010 to 2019 (Figure 2), indicating that the industrial structure of urban agglomerations continued to be optimized, the new driving force of green development continued to be enhanced, and the green transformation of key industries was effective, but the overall level was not high, and the constraints and limitations of “resources, energy and environment” on economic development space still existed. The GTFP of China’s 19 urban agglomerations from 2010 to 2019 was effective (Figure 2), indicating that the industrial structure of the urban agglomeration continued to be optimized, the new momentum of green development continued to be enhanced, and the green transformation of key industries was effective. However, they were not at a high level on the whole, and the constraints and limitations of “resources, energy and environment” on the economic development space were still there. From 2010 to 2014, the GTFP of urban agglomerations decreased due to the reasons that for a long time, China’s industry had been dominated by heavy industry and had been more dependent on coal for energy with a low energy efficiency, coupled with insufficient endogenous driving force for growth of urban agglomerations, leading to poor operating performance of enterprises, as a result of the impact of the financial crisis, constraints on energy conservation and emission reduction, as well as the incomplete transformation of old and new driving forces.
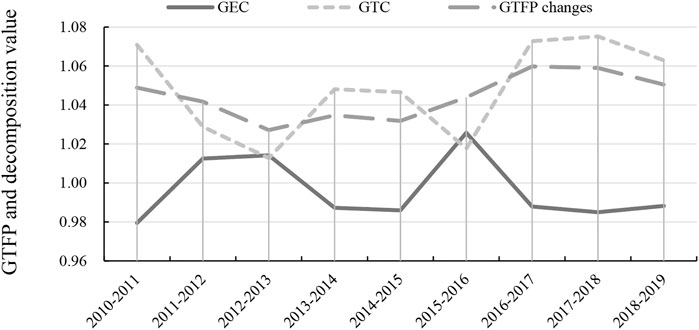
FIGURE 2. Changes of GTFP and decomposition value in urban agglomerations from 2010 to 2019.
A series of supporting policies introduced by the government failed to prevent the sharp decline in the efficiency of green development. The green development of the urban agglomerations progressed significantly from 2015 to 2020, mainly because the government attached great importance to ecological environmental protection and industrial structure adjustment during the 13th Five-Year Plan period. The supply-side structural reform and the five new development concepts proposed in 2015 both emphasize that the protection of the ecological environment is always firmly placed in the forefront of the development process, pointing the way for cities to create a high-quality regional industrial structure and layout, and to explore the development path of efficient use of resources and energy.
From the perspective of the decomposition value, the average annual growth rate of technological progress is 4.82%, while the technological efficiency shows a negative growth, −0.84% per year, indicating that technological progress is the main factor driving GTFP, and there is still considerable room for growth in technological efficiency in each urban agglomeration. The trend of technological progress changes in sync with GTFP, while the change of technology efficiency is opposite to GTFP, indicating that technological progress is the main driver of GTFP improvement. This is due to the fact that the changes in the systems of energy conservation, emission reduction and pollution prevention and control in places firstly give some impetus to the technical efficiency, making it improve in the short term but for a short duration. The increase in production efficiency encourages the enthusiasm of investors, which in turn leads to the improvement of green technologies.
The resource and environmental constraints have led to some differences in the level of green total factor productivity and technological progress across urban agglomerations. Leading to a spatial distribution featured by “high in the north and low in the south, high in the east and low in the west” (Table 1). UABTH, and UAYRD, as early formed and now well-developed urban agglomerations in China, have witnessed a consistent growth and maintained a high level of green total factor productivity during the study period, becoming the “highland” of China’s green economic development relying on their geographical location, economic foundation, high-end talents and other first-mover advantages. In contrast, UALX, UANXAYR and UANSTM, due to the disadvantages of lack of resources, weak foundation and talent drain, are generally in an effective state in the regional green total factor productivity, but the efficiency value is low, and even the green total factor productivity level is less than 1 before 2015, making them a “lowland” of China’s green economic development. The change of technological efficiency shows the characteristics of “Western urban agglomeration > Central urban agglomeration > Eastern urban agglomeration”, showing that the central and western regions have made certain breakthroughs in industrial structure transformation and institutional mechanism innovation in recent years. In contrast, urban agglomerations in the eastern region are nearing saturation as developed regions in technical efficiency growth potential, with diminished capacity for further efficiency release.
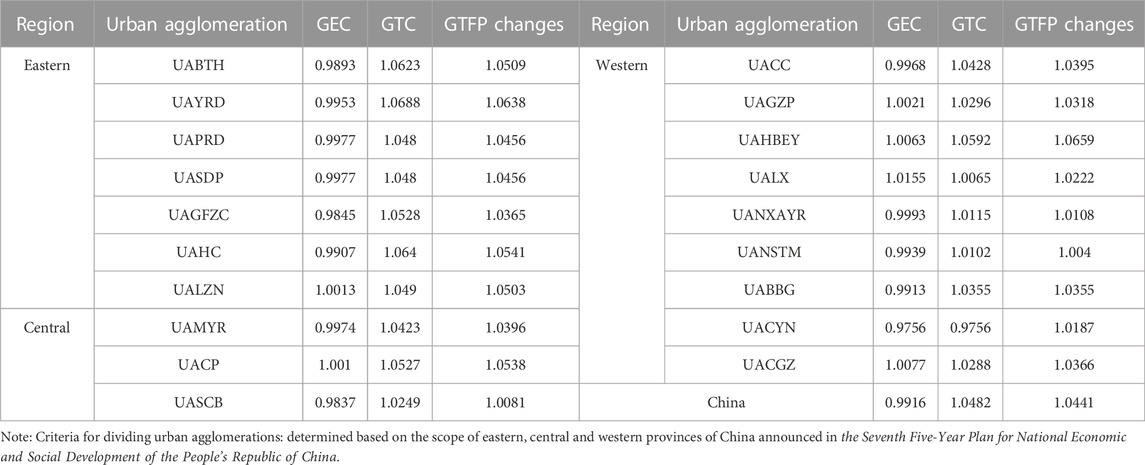
TABLE 1. Average values of region GTFP and decomposition changes of Chinese urban agglomerations from 2010 to 2019.
From the perspective of a single urban agglomeration, UAGFZC has the worst green development in the eastern region, mainly because the market elements such as talents, capital, and technology in this region have long faced the siphonic effect of Yangtze River Delta Urban Agglomeration (UAYRD) and Pearl River Delta Urban Agglomeration (UAPRD), which makes it difficult to gather high-quality factors, and thus inhibits the growth of GTFP. Shanxi Central Basin Urban Agglomeration (UASCB) has the worst green development in the central region, as it is a typical resource- and energy-based region, where long-term high-intensity energy exploitation and unreasonable industrial structure have lead to a “bottleneck” of insufficient endogenous power for sustained economic growth and serious ecological pollution. Ningxia along the Yellow River Urban Agglomeration (UANXAYR) has the worst green development in the western region, mainly because it is located in the upper reaches of the Yellow River, where the factors such as backward economic development and fragile ecological environment have curbed the efficiency of its green economy.
The above measurement results indicate that there are regional differences in GTFP among Chinese urban agglomerations. In order to further investigate the variation trend of GTFP in urban agglomerations, the convergence tests of GTFP changes in Chinese urban agglomerations are further conducted.
The variation coefficient of GTFP in urban agglomerations showed obvious alternating decreases and increases during the study period, and in general there was no trend of δ convergence (Figure 3), it shows that there is still a deviation in the perception of sustainable economic development in each city cluster, and the perception of green transformation is not deep enough.
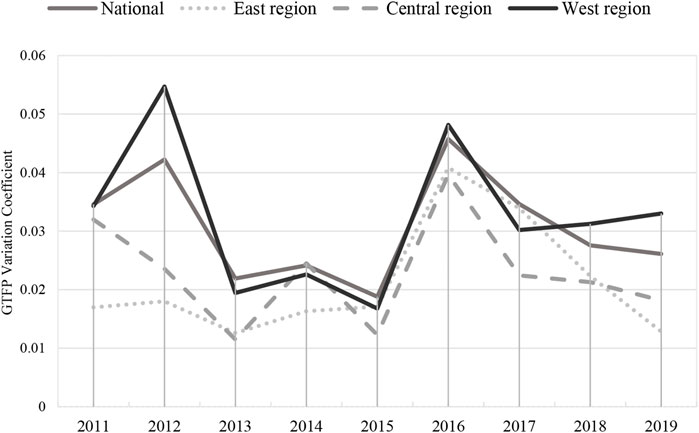
FIGURE 3. GTFP Variation Coefficient in China and East, Central and West Urban Agglomerations annual trend.
The horizontal comparison of the three regions shows that the variation coefficient of the GTFP index in eastern urban agglomerations is less volatile, indicating a balanced level of green development among urban agglomerations in the eastern region. This is due to the small spatial distance of the eastern cities, allowing for closer and easier communication between the regions. In addition, with the implementation of the eastern integration strategy, its economic foundation, environmental conditions and development strategies are increasingly integrated, showing a sign of δ convergence.
The differences in green total factor productivity changes among urban agglomerations in the western region are more volatile and have higher levels of coefficients of variation than those in the eastern and central urban agglomerations in most years. The differences in GTFP changes among western urban agglomerations are more volatile and they have higher levels of coefficients of variation than those in the eastern and central urban agglomerations in most years. This is due to the large differences in the level of economic development and environmental conditions among the western urban agglomerations and among the cities within the urban agglomeration, including developed Chengdu-Chongqing Urban Agglomeration (UACC), and less developed LanZhou-Xining Urban Agglomeration (UALX) and North Slope of Tianshan Mountain Urban Agglomeration (UANSTM), thus leading to large differences in the efficiency of green economy operation among western urban agglomerations.
Nationally, the β value of the GTFP index of urban agglomerations is less than 0 and passes the significance test, indicating that there is absolute β convergence among the 19 urban agglomerations in China, which implies that the 19 urban agglomerations in China are developing toward the same steady-state level (Table 2). This conclusion still holds for the eastern, central and western regions, that is, the difference of green economic development among urban agglomerations is gradually narrowing. The reason is that, on the one hand, urban agglomerations with lower levels of green economy development will introduce and learn advanced technologies from those with higher levels of green economy efficiency, and this technology diffusion has led to a convergence trend in technology levels; on the other hand, the promotion of China’s regional synergistic development strategy with urban agglomerations as the core has led to the increasing connection between urban agglomerations, and the development of green economy has shown a certain spatial spillover effect, making the gap in green economic efficiency changes continue to narrow. The western urban agglomerations have enjoyed the fastest convergence, indicating that the development of urban agglomerations in the western region has shown strong development potential despite its late start, which is mainly due to the implementation of the “Belt and Road” strategy, the western development strategy, and the policy support and development opportunities brought by the national implementation of ecological compensation, transfer payments and eastern support for the west.
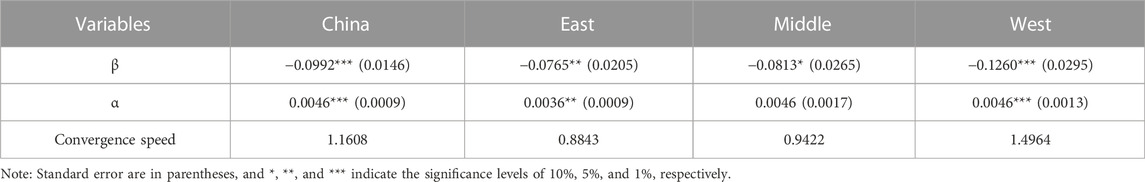
TABLE 2. Absolute β test results of GTFP in China and eastern, Central and Western urban agglomerations.
According to the absolute β test results of GTFP growth in a single urban agglomeration (Table 3), the convergence coefficient of more than 70% urban agglomerations is significantly negative, that is, the green economic development of most urban agglomerations has an absolute β convergence trend. It indicates that the growth gap of green economic efficiency of cities within each urban agglomeration will gradually decrease and converge to the same steady-state level over time without considering the differences in policy environment and economic and social development levels among cities within each urban agglomeration. It is worth noting that the β value of Chengdu-Chongqing Urban Agglomeration (UACC), Harbin Changchun Urban Agglomeration (UAHC), LanZhou-Xining Urban Agglomeration (UALX) and Central Guizhou Urban Agglomeration (UACGZ) is less than 0 but fails to pass the significance test, that is, the absolute β convergence trend is not obvious, indicating that the urban agglomeration still suffer from drawbacks such as serious internal homogeneous competition and lack of regional coordination mechanisms. Central Yunnan Urban Agglomeration (UACYN) has a β value greater than 0, indicating a further expanding green economic efficiency growth gap, as it is still in the stage of cultivation and development. As an economically developed city within the urban agglomeration, Kunming shows a siphonic effect on the neighboring areas while failing to exert a radiating effect on the neighboring cities, thus leading to a gradual widening of the regional development gap. GuanZhong Plain Urban Agglomeration (UAGZP) has the fastest convergence.
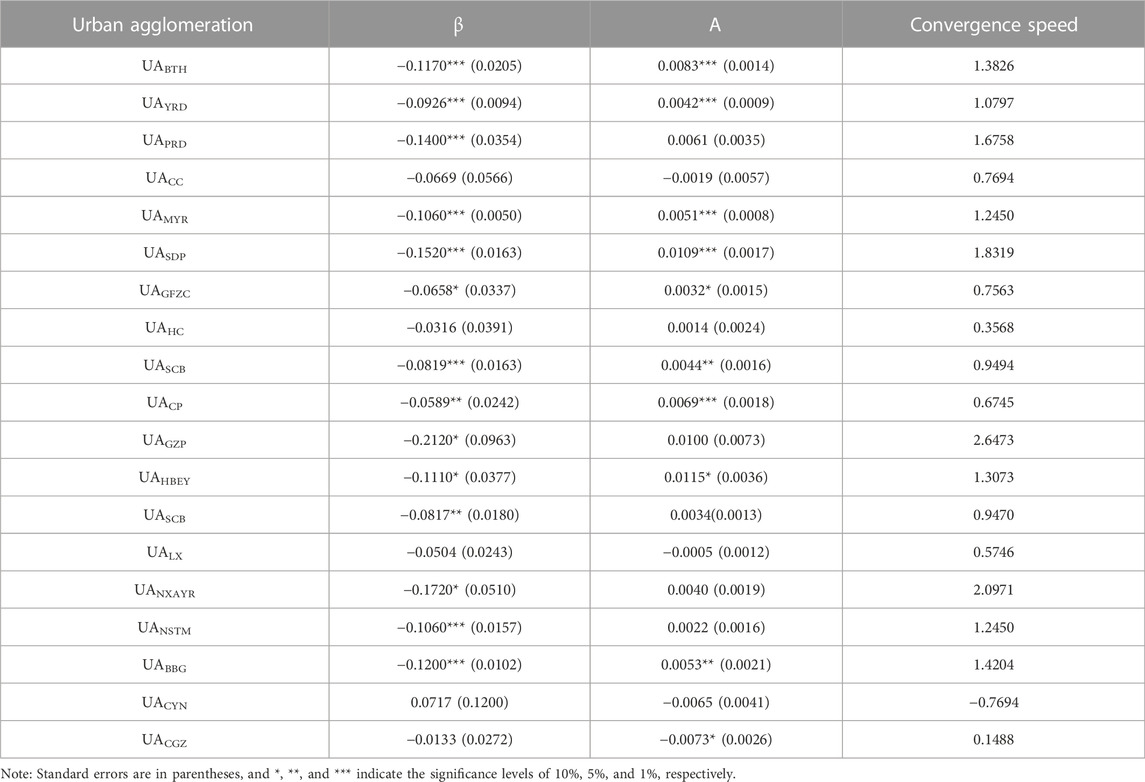
TABLE 3. Results of the absolute β test for GTFP in cities within urban agglomerations.
With the release of the Development Plan for the UAGZP, Xi’an as the “key traction” of the entire urban agglomeration, has significantly improved its comprehensive strength and overall competitiveness, and has made greatly progress in the radiation drive of the northwest region; besides, node cities such as Baoji, Yuncheng, and Tianshui have accelerated their development, promoting substantial progress in Xi’an-Xianyang integration. Multiple factors have led to substantial improvement in the quality of development of GuanZhong Plain Urban Agglomeration (UAGZP). The release of “The 14th Five-Year Plan” for the Construction of UAGZP will further boost the development UAGZP, and will continue to optimize its leading role for the high-quality development of northwest China and the strategic support for the China’s opening to the west. The convergence rate of the Central Plains Urban Agglomeration (UACP) is the slowest, mainly due to the fact that UACP spans five provinces, which constitutes a geographical limitation that hinders the formation of a true functional and integration between cities, thus leading to insufficient depth of cooperation between cities and serious industrial structure convergence and homogeneous competition. And Zhengzhou’s “single-core” drive is limited and secondary cities are underdeveloped, making it difficult for the Central Plains urban agglomeration to achieve internal coordinated development.
In order to deeply analyze the factors that affect the growth of GTFP in urban agglomerations, the following section will further explore the paths to improve GTFP in urban agglomerations from external factors. With GTFP as the explanatory variable, and given that the GTFP measured by the GML index is the chain growth rate, the paper gets the GTFP* of each city in each year by cumulative multiplication. The descriptive statistics of all variables are shown in Table 4.
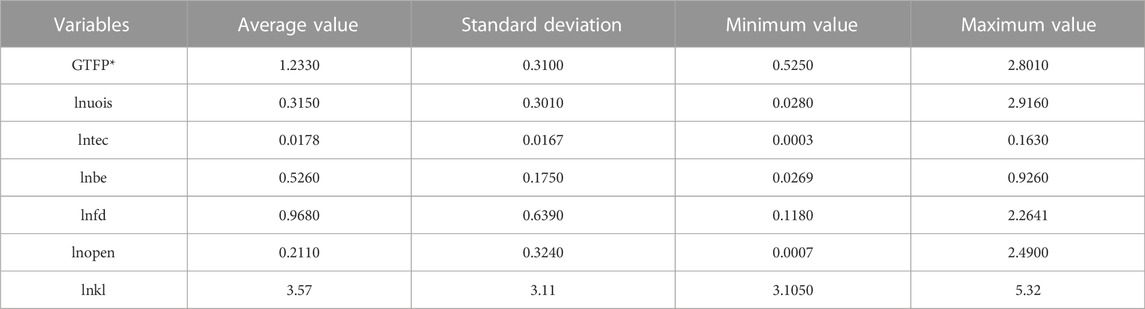
TABLE 4. Descriptive statistics of variables.
Since the short panel data used in this paper involve the selection of random effects and fixed effects models, the fixed effects model is selected according to the Hausman test results, and the software Stata MP14.2 is used for the empirical analysis. The regression results are shown in Table 5.
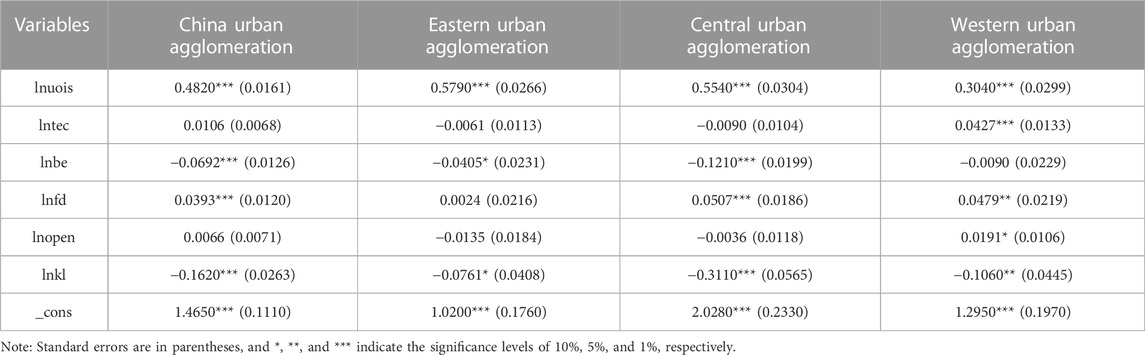
TABLE 5. Regression results of factors influencing GTFP.
The upgrading of industrial structure has a significant positive impact on the overall GTFP enhancement of Chinese urban agglomerations. This is due to the fact that the tertiary industry, dominated by service industry, is not highly dependent on energy and has a low degree of pollution, which drives the development of green and clean industry. In addition, it also implies that the structural dividend of Chinese urban agglomerations in economic development still exists. In particular, the upgrading of industrial structure has a higher impact on the improvement of GTFP in the eastern urban agglomeration. The reason is that the eastern urban agglomeration has incomparable advantages over the central and western urban agglomerations. In other words, a large economic aggregate, a long development history and a good industrial base further the green transformation of the eastern urban agglomeration.
Financial technology investment has no significant impact on the GTFP in China as a whole and in the eastern and central urban agglomerations, indicating that the allocation efficiency of financial science and technology investment is not high and the conversion rate of scientific research achievements is low in China. However, the financial technology investment has a significant positive impact on the GTFP of the western urban agglomeration, which may be related to the fact that most of the western urban agglomeration are resource-based cities, and that both the country and enterprises have invested heavily in environmental protection technology innovation in recent years.
Business environment has a significant negative impact on the GTFP in China as a whole and in the eastern and central urban agglomerations, but it has no significant impact on the GTFP of western urban agglomerations with a negative coefficient because the current business environment in China has not effectively eliminated the distortion of labor market factors and capital market factors, which has an inhibitory effect on the realization of green development of urban agglomerations.
The level of financial services has a significant positive impact on the GTFP in China as a whole and in the central and western urban agglomerations. This is because, as a capital-intensive industry, the finance with a an increased scale can attract and encourage the development of high-tech industries, thereby promoting the GTFP growth. However, the level of financial services has no significant effect on the growth of GTFP in the eastern urban agglomerations. A possible reasonable explanation is that the eastern urban agglomerations are economically developed, while the current quality of financial services in China is not high enough to provide financial support for the implementation of major strategic investments and major projects in the eastern urban agglomeration.
Opening up has a positive impact on the overall GTFP of Chinese urban agglomerations, but not significant. From regional perspective, opening up has a negative but insignificant impact on GTFP in the eastern and central urban agglomerations, but it significantly promotes the development of western urban agglomerations. This may be due to the fact that, driven by geographical location, economic advantages and other forces, the eastern and central urban agglomerations have taken over a large number of resource-intensive industries in developed countries and regions, which is conducive to regional economic development in a short period of time. However, under the pressures of the over-exploitation of energy resources and the deteriorating environment, the positive spillover effects of opening up are exhausted and the negative effects are gradually emerging, which in turn inhibits the growth of GTFP in the eastern and central urban agglomerations. On the contrary, due to the relatively backward economic development and less ecological and environmental pressure in the western urban agglomerations, opening up provides opportunities for them to actively absorb and learn from advanced technology and management experience, which promotes the growth of GTFP.
Capital deepening has a significant negative effect on GTFP in China as a whole and in the eastern, central and western urban agglomerations. It indicates that with the advancement of industrialization, the economic structure of Chinese urban agglomeration cities gradually shifts from traditional labor-intensive industries with lower environmental pollution intensity to resource-intensive industries with higher environmental pollution intensity, which is a resistance to the enhancement of GTFP.
GTFP is a comprehensive consideration of resource and environmental constraints, a true reflection of the quality of regional economic growth and a key support for achieving high-quality development (Liu et al., 2019). Therefore, the findings of this paper may help policymakers to understand the development level and quality of urban agglomerations from the perspective of GTFP and its convergence, especially in less developed urban agglomerations, and also provide a decision basis for urban agglomerations to accelerate the green transformation of development model and achieve coordinated regional high-quality development. According to the studies available, this paper is closest to the findings of Lin and Meng (2021). They measured and explored the real level, spatio-temporal divergence and dynamic spatial convergence of GTFP growth in six urban agglomerations in China from 2003 to 2018, and found that the overall GTFP growth in the six major urban agglomerations mainly originated from technical efficiency changes and GTFP growth exhibited strong spatial β conditional convergence, which does not correspond to the conclusions of this paper.
The explanation for this inconsistency in this paper is that Lin and Meng (2021) studied Beijing-Tianjin-Hebei Urban Agglomeration (UABTH), Central Plains Urban Agglomeration (UACP), Chengdu-Chongqing Urban Agglomeration (UACC), Mid-Yangtze River Urban Agglomeration (UAMYR), Yangtze River Delta Urban Agglomeration (UAYRD), and Pearl River Delta Urban Agglomeration (UAPRD), which are six urban agglomerations with large economic aggregates, representing the highest level of development of domestic urban agglomerations and having a higher rate of resource allocation and factor utilization compared to technological progress.
In comparison, this paper expands the research perspective to 19 urban agglomerations, which have emerging drawbacks such as large differences in size structure and significant development gaps. Although they can imitate and introduce advanced technologies, limitations in factors such as talent and business environment make it difficult to copy management methods and efficiency, resulting in the overall GTFP growth of urban agglomeration driven by technological progress. The findings of this paper are more representative and scientific than the conclusion of Lin and Meng (2021). In addition, the trade-off between “growth” and “equilibrium” is the main issue facing regional development. The absolute β convergence test indicates that the GTFP growth of Chinese urban agglomerations is converging. Does it suggest that the green transformation process of developed urban agglomerations has slowed down in recent years? Compared with the calculation results of GTFP of urban agglomerations, the GTFP of developed urban agglomerations has been in the leading position for a long time, but its growth rate is slowing down, thus giving a chance to the central and western urban agglomerations to catch up. Obviously, behind this “equilibrium” is slowing “growth”. Therefore, to give full play to the comparative advantages of urban agglomerations, it is required to emphasize the improvement of the overall economic strength of urban agglomerations, while taking into account the coordination and balance oriented to narrow the gap between regions. To achieve a “balanced game” between growth and equilibrium is still a key challenge facing the development of urban agglomerations in China.
To address the limitation that existing studies can hardly reflect the current situation of green development in Chinese urban agglomerations and its convergence effect, this paper examines the trends of GTFP and its growth gap in Chinese urban agglomerations based on SBM-GML model and δ convergence and absolute β convergence theories, empirically analyzes the factors affecting the level of green total factor productivity in urban agglomerations through fixed-effect model, reaching the following conclusions: (1) The GTFP of Chinese urban agglomerations is generally effective during the sample period, although shows short-term fluctuations, the overall fluctuations are not significant. Green technological progress is the main reason for the improvement of GTFP in urban clusters, and the decline of GTFP in local years is mainly dragged down by the efficiency of green technology. At the same time, the GTFP gap of urban agglomerations is obvious, and the eastern urban agglomerations show better green development competitiveness than other regions due to internal and external factors such as scale rank, development orientation and national strategy of regional synergistic development. This difference is not only due to resource endowment, but also more to the internal institutional mechanism accumulated for a long time; (2) There is no significant δ convergence in GTFP of Chinese urban agglomerations, but there is absolute β convergence, the GTFP of urban agglomerations does not have continuity in the time series, but there is a “catch-up effect” of urban agglomerations with low GTFP to those with high GTFP, and they will eventually converge to equilibrium with the same steady state. However, this “catch-up effect” does not mean that Chinese urban agglomerations have found their own suitable convergence path; (3) Industrial structure and financial service level showed a positive impact on the GTFP growth in Chinese urban agglomerations, while business environment and capital deepening level had a negative effect, and financial technology investment and opening up showed no significant effect.
Some innovative conclusions have been drawn in this paper, but the following shortcomings remain for further study: (1) No consideration was given to the existence of spatial spillover effects in the analysis of the growth trend and problems of green total factor productivity in urban agglomerations, and the use of spatial econometric can be considered in the future. (2) The spatial-temporal evolution and spatial difference of GTFP in urban agglomerations were not analyzed. The dynamic evolutionary characteristics of green total factor productivity in urban agglomerations can be examined by Kernel density estimation and Markov chain, and further analysis of the changing trends, structural characteristics and driving factors of green total factor productivity spatial differences in urban agglomerations can be performed using Theil index and Geo Detector. (3) Due to the large differences across cities in urban agglomerations, the study area needs to be deepened in future studies.
The original contributions presented in the study are included in the article/Supplementary Material, further inquiries can be directed to the corresponding author.
JM: Original draft, Writing, Editing, Program running, Data collection, Software; ZY: Data validation, software; YW: Writing, Review, and Editing; LW: Supervision; MW: Conceptualization and Editing.
This research was funded by the National Social Science Foundation Project (22BJL050); National Natural Science Foundation of China (42201198); Gansu Province Humanities and Social Science Project (22ZC02); Soft Science Project of Gansu Province (22JR4ZA040); Central University Fund (lzujbky-2022-46).
The authors declare that the research was conducted in the absence of any commercial or financial relationships that could be construed as a potential conflict of interest.
All claims expressed in this article are solely those of the authors and do not necessarily represent those of their affiliated organizations, or those of the publisher, the editors and the reviewers. Any product that may be evaluated in this article, or claim that may be made by its manufacturer, is not guaranteed or endorsed by the publisher.
Barbier, E. (2011). The policy challenges for the green economy and sustainable economic development. Nat. Resour. Forum 35 (3), 233–245. doi:10.1111/j.1477-8947.2011.01397.x
Chen, M. H., Zhong, C. Y., Zhang, X. M., and Liu, Y. X. (2018). Spatial synergy measurement of GTFP growth in urban clusters and economic policy choices. Macroecon. Res. (02), 126–139. doi:10.16304/j.cnki.11-3952/f.2018.02.012
Fu, J. Y., Hu, J., and Cao, X. (2018). Different sources of FDI, environmental regulations and GTFP. Int. Trade Issues (07), 134–148. doi:10.13510/j.cnki.jit.2018.07.011
Fukuyama, H., and Weber, W. L. (2010). A directional slacks-based measure of technical inefficiency. Socio-Economic Plan. Sci. 43 (4), 274–287. doi:10.1016/j.seps.2008.12.001
Hu, X. Z., and Yang, L. (2011). Analysis of regional GTFP differences and convergence in China. Finance Econ. Res. 37 (04), 123–134. doi:10.16538/j.cnki.jfe.2011.04.010
Huang, Y., and Li, L. (2017). Comprehensive measurement and spatio-temporal evolution of green development level in Chinese urban agglomerations. Geogr. Res. 36 (07), 1309–1322. doi:10.11821/dlyj201707010
Li, B., Peng, X., and OuYang, M. K. (2013). Environmental regulation, green total factor productivity and the transformation of China's industrial development mode - an empirical study based on data from 36 industrial industries. China Ind. Econ. (04), 56–68. doi:10.19581/j.cnki.ciejournal.2013.04.005
Li, J., and Liu, Z. (2019). Spatial differences in GTFP and influencing factors in three major urban clusters in China. Soft Sci. 33 (02), 61–64+80. doi:10.13956/j.ss.1001-8409.2019.02.13
Li, J. Y., Li, Z. Y., and Li, C. (2016). An empirical study of urban green innovation efficiency-evidence from the middle reaches of Yangtze River urban cluster. J. Jiangxi Univ. Finance Econ. (06), 3–16. doi:10.13676/j.cnki.cn361224/f.2016.06.001
Lin, P., and Meng, N. N. (2021). Spatial and temporal divergence and dynamic convergence of GTFP growth. Res. Quantitative Econ. Technol. Econ. 38 (08), 104–124. doi:10.13653/j.cnki.jqte.2021.08.006
Liu, B. L., Bian, Y., Zhou, M., and Zhu, J. F. (2019). 70 years review of China's regional economic development and its prospect. China Ind. Econ. (09), 24–41. doi:10.19581/j.cnki.ciejournal.2019.09.002
Liu, X. Z., Zhang, P. F., and Shi, X. Y. (2022). Industrial agglomeration, technological innovation and high-quality economic development–an empirical study based on five major urban clusters in China. Reform (04), 68–87.
Liu, Y., and Qin, M. (2019). Comprehensive measurement and comparison of green efficiency of four urban agglomerations in eastern coastal China. China Population-Resources Environ. 29 (03), 11–20.
Liu, Y. S., Tian, Y. H., and Luo, Y. (2018). Industrial structure upgrading, energy efficiency and GTFP. Theory Pract. Finance Econ. 39 (01), 118–126. doi:10.16339/j.cnki.hdxbcjb.2018.01.018
Liu, Y., Yang, J. L., and Liang, Y. (2019). Evaluation of green development efficiency and equilibrium characteristics of urban agglomerations in China. Econ. Geogr. 39 (02), 110–117. doi:10.15957/j.cnki.jjdl.2019.02.013
Oh, D. H., and Heshmati, A. (2010). A sequential Malmquist-Luenberger productivity index: Environmentally sensitive productivity growth considering the progressive nature of technology. Energy Econ. 32 (6), 1345–1355. doi:10.1016/j.eneco.2010.09.003
Qi, S. Z., and Xu, J. (2018). The impact of trade opening on GTFP in countries along the "One Belt and One Road. China Popul. Resour. Environ. 28 (04), 134–144. doi:10.12062/cpre.20180109
Shan, H. J. (2008). Re-estimation of capital stock K in China:1952-2006. Quantitative Econ. Tech. Econ. Res. 25 (10), 17–31. cnki:sun:sljy.0.2008-10-004.
She, S., Wang, Q., and Zhang, A. C. (2020). Technological innovation, industrial structure and GTFP of cities-a test of influence channels based on national low-carbon city pilot. Econ. Manag. Res. 41 (08), 44–61. doi:10.13502/j.cnki.issn1000-7636.2020.08.004
Shi, X. A., and Li, L. S. (2019). Green total factor productivity and its decomposition of Chinese manufacturing based on the MML index:2003–2015. J. Clean. Prod. 222 (10), 998–1008. doi:10.1016/j.jclepro.2019.03.080
Tu, Z. G. (2008). Harmonization of environment, resources and industrial growth. Econ. Res. (02), 93–105.
Wang, K. L., Pang, S. Q., and Zhang, F. Q. (2021). Can the opening of high-speed rail enhance GTFP in cities? Industrial Econ. Res. (03), 112–127. doi:10.13269/j.cnki.ier.2021.03.009
Wang, Q., and Jin, C. H. (2018). Quantitative measurement of the imbalance of economic development level of urban clusters in China. Quantitative Econ. Tech. Econ. Res. 35 (11), 77–94. doi:10.13653/j.cnki.jqte.2018.11.005
Xu, S. X., Liu, Q., and Lu, X. L. (2019). The four-dimensional model decomposition of regional development imbalance in China and the influencing factors-a study based on the threshold regression model measurement. Explor. Econ. Issues (04), 13–26.
Yu, L. H., Wang, Y., and Chen, J. Y. (2019). Green total factor productivity of Chinese mining industries considering negative intergenerational and environmental externalities. Resour. Sci. 41 (12), 2155–2171. doi:10.18402/resci.2019.12.01
Zhang, J., Wu, G. Y., and Zhang, J. P. (2004). Estimation of interprovincial physical capital stock in China:1952-2000. Econ. Res. 10, 35–44. cnki:sun:jjyj.0.2004-10-004.
Keywords: Green total factor productivity, Urban agglomerations, Convergence test, Influencing factors, China
Citation: Mao J, Yu Z, Wang Y, Wang L and Wang M (2023) Spatial convergence and influencing factors of green total factor productivity of China’s urban agglomerations. Front. Environ. Sci. 11:1138396. doi: 10.3389/fenvs.2023.1138396
Received: 05 January 2023; Accepted: 30 January 2023;
Published: 10 February 2023.
Edited by:
Meng Zhu, Key Laboratory of Ecohydrology of Inland River Basin (CAS), ChinaReviewed by:
Huaxi Yuan, Zhongnan University of Economics and Law, ChinaCopyright © 2023 Mao, Yu, Wang, Wang and Wang. This is an open-access article distributed under the terms of the Creative Commons Attribution License (CC BY). The use, distribution or reproduction in other forums is permitted, provided the original author(s) and the copyright owner(s) are credited and that the original publication in this journal is cited, in accordance with accepted academic practice. No use, distribution or reproduction is permitted which does not comply with these terms.
*Correspondence: Meimei Wang, d2FuZ21tQGx6dS5lZHUuY24=
Disclaimer: All claims expressed in this article are solely those of the authors and do not necessarily represent those of their affiliated organizations, or those of the publisher, the editors and the reviewers. Any product that may be evaluated in this article or claim that may be made by its manufacturer is not guaranteed or endorsed by the publisher.
Research integrity at Frontiers
Learn more about the work of our research integrity team to safeguard the quality of each article we publish.