 Zhong Ma
 Xingxing Niu
 Weijing Ma
 Yanxia Kang
 Weiwei Xie1,2
- 1College of Geography and Environmental Science, Northwest Normal University, Lanzhou, China
- 2Key Laboratory of Resource Environment and Sustainable Development of Oasis, Gansu Province, Lanzhou, China
- 3College of Earth and Environmental Sciences, Lanzhou University, Lanzhou, China
With the continuous advancement of the integration of the world’s digital economy, the economic development of various regions has become increasingly interdependent. However, the interregional interactions of digital industries have yet to be further elucidated. Here, based on the Multi-Regional Input-Output model, we take China, for example, and analyze the impact of digital industries on the economy from the industrial and regional. At the industry level, we discuss the economic spillover relationship between the digital industry and the three traditional industries, and analyzes the spatial and temporal differentiation in the inter-industry spillover status of China’s 30 provinces; at the regional level, we discuss the digital industrial economic spillover links and spillover states. The results show that: 1) The self-generating ability within the digital industry sector is the most significant factor influencing the industrial growth of China’s digital economy, followed by the interrelated effect between industry sectors, while the inter-industry feedback effect has a weak impact on the economic system. 2) There is a clear gap in the economic spillover capacity of the digital industry in 30 provinces, and the overall performance is decreasing in the eastern, central and western regions. 3) The intra-regional multiplier effect of digital industry shows a slowly decreasing trend, and the intra-regional digital economic spillover-feedback effect shows a growing trend. At the same time, the inter-regional digital economy interaction tends to decay in distance, indicating that regional accessibility has a significant impact on the inter-regional spillover effect.
1 Introduction
With the technology advancements such as the Internet, big data, cloud computing, artificial intelligence, and blockchain, the world economy is gradually transforming into digitalization (Liu et al., 2021a; Liu et al., 2021b). Digital economy have become the precursors for the current world scientific and technological and industrial revolution (Latif, et al., 2018), as well as the key forces for restructuring the world’s factor resources, reshaping the worldwide economic structure, and altering the global competition landscape (Jiang and Jia, 2022). The concept of “digital economy” was first proposed by Bowman (Bowman, 1996), and since then, it has rapidly become popular worldwide. Major western developed countries have stepped up the strategic layout of the application of the new generation of information technology to seize the opportunity of digital economy development. In the 1990s, the United States took the lead in seizing the opportunity of the digital revolution and seizing the commanding heights of the digital economy with infrastructure construction, which laid a solid foundation for the economic prosperity of the United States for more than a decade (Oliner and Sichel, 2000; Stiroh, 2002; Jorgenson and Vu, 2016). By giving play to the active leading role of the government, Europe, Japan, and other regions have introduced a series of digital economy development strategies (Jiang and Jia, 2022), which have produced great results in vigorously promoting the digital revolution (Bunje et al., 2022; Kurniawan, et al., 2022). In the context of the current intensifying downward pressure on the global economy, the digital economy is bucking the trend (Bulturbayevich et al., 2020), and has become a key tool for countries to stabilize economic growth and achieve economic recovery (Xue et al., 2022). Especially under the outbreak of COVID-19, the global industrial chain, supply chain and value chain are facing the challenge of being reshaped (Sun and Wang, 2021; Wang and Zhang, 2021). The resilience of digital technology has made the international community aware of the critical role of the digital economy in restoring the economy (Popkova et al., 2022; Wang et al., 2022). It is also an enlightening path for strategic measures to realize the new development pattern of “dual circulation” (Bressanelli et al., 2018).
As the development of China’s digital economy started late compared with developed countries, the construction of digital technology infrastructure lags behind, and there is still a considerable gap between China and developed countries in terms of basic theories, core algorithms, key equipment, etc., making the import and export trade deficit of digital products is huge and heavily dependent on imports, resulting in a series of problems in the development of China’s internal digital economy. Because China is a vast country, the balance of regional development is a key topic at present.
From the spatial perspective of economic development, the economic growth of a region is affected by the following three effects: intra-regional multiplier effect (ME), inter-regional spillover effect (SE), and inter-regional feedback effect (FE) (Round, 1985). The intra-regional multiplier effect refers to the output growth brought about by the interaction of various industrial sectors in region a; the inter-regional spillover effect refers to the one-way effect of the output growth of one region on the economic development of another region. The feedback effect represents the effect of the final output change of one region on other regions and then on the region itself through economic circulation. If the study of the multiplier effect is the economic development of a single region, then the research content of interregional spillover and feedback effect, especially the spillover effect, is more concerned with the development of the multi-regional economy.
The mainstream approaches to study spillover feedback effects include spatial econometric models, life cycle assessment (LCA), general and partial equilibrium models (GEM), and multi-regional input-output models (MRIO) (Ning et al., 2019). Although MRIO has a time lag due to the need to compile input-output tables, the preferred analytical method to study inter-regional industrial linkages is the multi-regional input-output model, which represents the interdependence and mutual influence relationships among sectors in complex economies in a systematic and quantitative way, and the spillover feedback effects can be effectively quantified by MRIO, which is the reason why this paper chooses to use MRIO to measure This is the reason why we choose to use MRIO to measure the spillover feedback effect.
The inter-regional spillovers and feedback effects produced by inter-regional trade play an increasingly important role in regional economic growth and inter-regional economic exchanges. Considering that regional spillovers are closely related to regional economic integration, it is necessary to measure the digital economy at the regional and industrial levels, especially in a vast developing country like China. Spillover effects, as an important factor in regional economic development, have been widely used not only to study economic aspects, but also to study environmental issues in recent years. For example, at the regional level, Zhang (2017) analyzed the spillover-feedback effects of carbon emissions in three regional levels of China. Ning et al. (2019) examine the feedback and spillover impacts of carbon emissions among China’s eight regions. Hu et al. (2019) assessed the multiplier, spillover and feedback effects of water, carbon and land footprint. At the level of China’s capital city agglomeration, Li et al. (2018) measured the spillover and feedback effects of economy and CO2 emissions. Chen, et al. (2021) Measured spillover-feedback effect of virtual water transfers in urban agglomerations. At the national level, Wang et al. (2021) calculated the status of inter-regional carbon emissions along the Belt and Road. Zhang and Zhang (2018) explore the relationship between China, EU and US CO2 emissions from regional and sectoral levels by calculating carbon spillover-feedback effects.
The digital economy can improve the efficiency of industrial innovation through spatial spillover effects (Liu et al., 2022; Zhang et al., 2022), promote industral transformation (Xiao, 2020; Singh et al., 2021), expand the level of industrial collaboration (Lioutas et al., 2021; Su et al., 2021), which in turn drives the economic development of neighboring regions (Ma and Zhu, 2022). With the growing momentum of the digital economy, digital technology and traditional industries will be deeply integrated and become the power source and core driving force of economic growth (Pradhan et al., 2019). As a technology-intensive activity, the digital economy has become inseparable from high-quality development. It is an indispensable and vital force in China for social development (Song et al., 2021),technological progress (Ding et al., 2021), poverty eradication (Lv et al., 2022), expanding the labor market (Simionescu, 2022), and expanding regional economic integration (Gong, 2022). Therefore, research on the digital economy has direct relevance for improving China’s overall national power and promoting high-quality and stable economic development (Bahrini and Qaffas, 2019). Although the spillover effects of the digital economy have been confirmed (Liu, et al., 2022; Zhang, et al., 2022), however, most studies focus on the overall effect, and few studies quantify the spillover effects of the digital economy in detail, ignoring heterogeneity and inter-city or regional heterogeneity and spatial spillover effects, which may lead to biased findings.
Through sorting and summarizing the existing literature, we found that, at present, most of the studies on digital economy are focused on measuring the scale or added value of digital economy, and relatively few of them study the effect of digital economy and various industries in the national economy. In addition, most scholars analyze the development level of digital economy by constructing an index system, and only a few scholars use the input-output method to construct an economic model to study the impact of digitalization level. Compared with the existing literature, the contribution of this paper is mainly reflected in three aspects:
First, this study focuses on the internal structure of the digital economy industry and analyzes the inter-industry association patterns between the digital economy industry and the traditional three major industries (primary industry, secondary industry, and tertiary industry) and their macroeconomic spillover effects using an input-output model; Second, this paper analyzes the spatial variability of inter-industry spillover effects of the digital economy in China’s 30 provinces. Finally, this paper takes into account the inter-regional spatial spillover and uses a multi-regional input-output model to analyze mutual spillover effects among the eight regions in China.
The research purpose of this article is to use overflow feedback effects to evaluate the scale of China’s digital economy development, and analyze the association of digital industries between eight regions and the two -way impact between target areas. Based on this, we will explore how the digital industry contributes to the region and whether it has promoted the economic development between regional. It will provide a reference for the accuracy and scientificity of quantitative research on China’s digital economy industry, enrich the research content of the digital economy industry to a certain extent, and provide a new basis for existing research.
2 Methodology
2.1 Multi-region input-output model
Multi-region Input-Output Model (MRIO) is able to measure the interaction between different regions, and plays a unique role in the fields of industrial linkage and cross-regional accounting. It is a practical model for analyzing the interaction and interdependence between different sectors in different regions by linking various regional input-output models.
On this Table 1, the equilibrium output relationship of the three regions is expressed by formula (1) as:
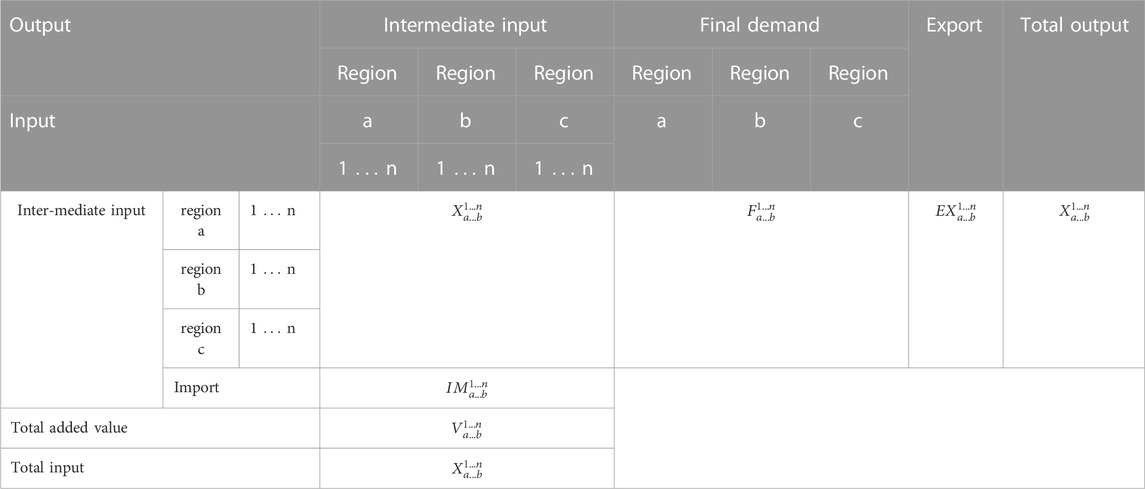
TABLE 1. Interregional input-output table for three region.
Then, Eq. 1 can be divided into:
Define
Define
Similarly, the expressions of
According to Eq. 7, the inter-region Leontief inverse matrix can be decomposed into:
2.2 Multiplier, spillover and feedback effects in MRIO
The term “feedback effect” was first coined by Miller (1963), who first proposed two regional input-output models to measure the economy feedback effects, but did not explicitly introduce the concept of spillover effects. Pyatt and Round (1979) and Stone (1985) proposed the concept of spillover effects based on the social accounting matrix (SAM) and analyzed it. Round (1985) proposed a decomposition model based on the above to measure spillover-feedback effects in more detail and extended a SAM-based three-region model. Since then, spillover-feedback effect models have been widely used to analyze inter-regional economic linkages and interactions.
For closed three-region, according to the multi-regional input-output model, the change in economy caused by each unit of the final demand of region a can be expressed as follows:
where
1) Intraregional multiplier effect of the region a
Equation 10 denotes the intra-regional multiplier of region a, which represents the economic changes caused by the own inter-industry structure within region a.
2) Interregional spillover effect of the region a
where denotes the effect of changes in final demand for a on total output of b, Similarly,
3) feedback effect of the region a
Where
2.2 Data sources
China’s inter-regional input-output tables of 42 sectors in 2012 and 2017 were obtained from the China Carbon Accounting Database (CEADs) (Zheng, et al., 2020), and provincial input-output tables were published by the National Bureau of Statistics. In this paper, we divide China into eight regions, based on interregional input-output tables for China in 1997, 2002 and 2007 (Figure 1). At the same time, we define the digital industry macroscopically and merge digital manufacturing and digital services into a hybrid industry, which is the object of this research. In the industry-level analysis section, we divided the industries into four industries: primary industry, secondary industry, tertiary industry, and digital industry.
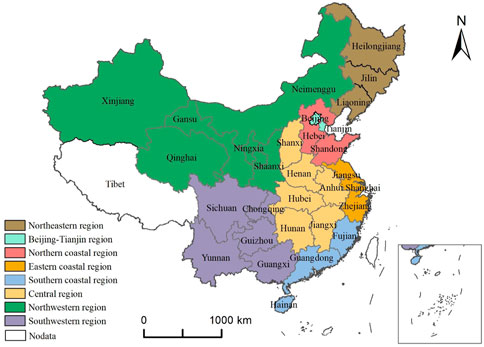
FIGURE 1. The eight regions of China.
3 Results
3.1 Intra- and inter-industrial effect intensity at industrial level
3.1.1 Intra-industry effect intensity decomposition analysis
The intra-industrial multiplier and feedback effect, and inter-industrial spillover effect intensities of four industrial (primary, secondary, tertiary and digital industry) in three time periods (2007, 2012 and 2017) are presented in Figure 2. In these three time periods, the secondary industry has the maximum value of the intra-industrial multiplier and feedback effect intensities, and the digital industry has the peak of the inter-industrial spillover effect intensities; in contrast, the spillover effect intensity of the primary industry surpasses the tertiary industry only in 2012 and 2017, and the primary industry holds the lowest value of the three types of effects in the rest of the time. This phenomenon implies that the internal correlation mechanism of digital industry exceeds the primary and secondary industries. As an emerging industry, it has a vital role in driving the national economy.
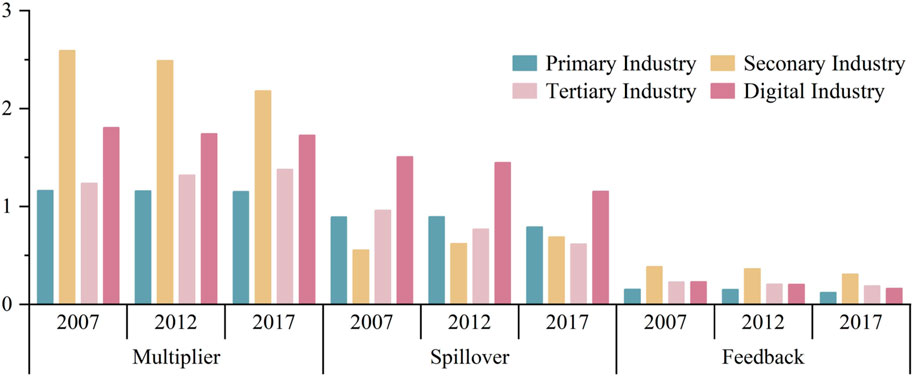
FIGURE 2. The effect intensities of the intra-industry of four industries.
From the perspective of the time dynamic evolution trend, the digital industrial total effect intensity (the sum of the intra-industrial multiplier and feedback effect intensities, and the inter-industrial spillover effect intensities) showed a downward trend. The reason for this fluctuation may be related to the fact that China’s economy has entered a new routine and high-quality development stage of medium and low-speed growth, which has caused a more significant impact on the original extensive industrial development mode. The driving effect of the digital industry on the growth of the national economy depends not only on the endogenous development of the digital industry but also on the smoothness of the interaction mechanism with other industries. For the three major traditional industries, their total effect intensities are similar to the changing trend of the digital, and all show a downward trend, indicating that industrial systems are interdependent in the impact of the national economic system. After the stage of high-quality development, China’s economy as a whole has entered a state of medium-low growth, resulting in a weakening of the effects of the inter-industry correlation mechanism and fluctuations in its endogenous development momentum.
3.1.2 Inter-industrial spillover-feedback effect intensity
The inter-industrial mutual spillover-feedback effect intensities of four industries and three time periods are appeared in Figure 3. Frist, for the inter-industrial mutual spillover effect intensities aspect, from the perspective of one industrial demand, the secondary industry has the crest value of spillover effect intensities (2.61, 2.28 and 1.70, respectively), and the digital industry has the least value of intensities (0.20, 0.17 and 0.19, respectively) in these time periods. At the same time, except for the tertiary industry, where the intensity of effects rises by 27.80%, the effect intensity of the rest of the industries showed a decreasing trend (26.03%, 53.19%, and 5.36%, respectively). From the perspective of one industrial supply, the results are just the opposite of the demand, with the largest values for the digital industry (1.51, 1.45 and 1.15, respectively), and the smallest values for the secondary industry (0.56, 0.62, 0.69, respectively). Similarly, except for the intensity of the effect of the secondary industry increased by 19.18%, while the remaining industries showed a decreasing trend (12.68%, 55.83% and 30.56%, respectively). Second, for the inter-industrial mutual feedback effect intensities aspect, from the perspective of feedback effect intensities of one industry via other industries back to itself, the digital industry has the crest value of intensities (0.18, 0.16 and 0.12, respectively). On the time scale, the tertiary industry has increased by 27.18%, while the remaining industries have all decreased. From the perspective of feedback effect intensities of other industries via the industry back to other industries, the largest values for the secondary industry (0.35, 0.29 and 0.20, respectively). The value of the secondary industry has increased by 24.04%, while the remaining industries has a decreasing trend.
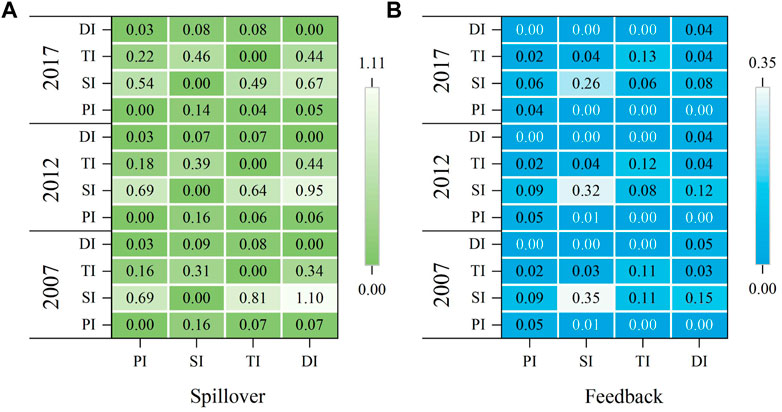
FIGURE 3. The inter-industrial mutual spillover (A) and feedback (B) effect intensities of four industries.
At the same time, we find that in the structure of inter-industrial mutual spillover-feedback effects, the intensity of the effects of both digital and primary industries is relatively small. Therefore, in the future, the in-depth integration of the digital industry and the primary industry should be further promoted, making it a powerful starting point for the rural revitalization strategy, promoting the integrated development of the rural digital industry and various industries, enriching the rural economic format, and enhancing the coordination of urban and rural development.
3.2 Spatiotemporal variability of effect intensity in 30 Chinese provinces
3.2.1 Spatial variability of intra-industrial effect intensity
The measurement results of the intra-provincial multiplier, spillover, and feedback effect intensities for 30 provinces in China in 2007 and 2017 was presented in Figure 4. Due to the obvious differences in the level of economic development, industrial structure, and the degree of development of the digital industry in various provinces in China, there are also heterogeneities in the intra-provincial multiplier, spillover, and feedback effect intensities of the digital industry. Taking 2017 as an example, Shandong’s total effect has the highest value, and the spillover effect intensity reached 2.36, which exceeded the multiplier effect intensity. This result shows that the relationship between industries in Shandong is close, the degree of integration between industries is high, and the growth of digital industries can be cross-transmitted through spillover effects to form the growth of multiple industries. The top ten provinces, except for Anhui and Chongqing, are from the eastern region; The bottom 10 are from the central and western regions. This result shows that the digital industry in the eastern region has improved in scale and efficiency; on the other hand, it has also formed a close connection with other industries. However, the digital industry in the central and western regions has not yet formed a more mature industrial interaction than in the eastern region. Generally, the intensity of the three effects in the developed coastal provinces is stronger than that of economically backward provinces. In the future, the internal structure of the digital industry needs to be further optimized to enhance the resilience of development and cope with the strong impact of the adjustment of the international economic and trade pattern.
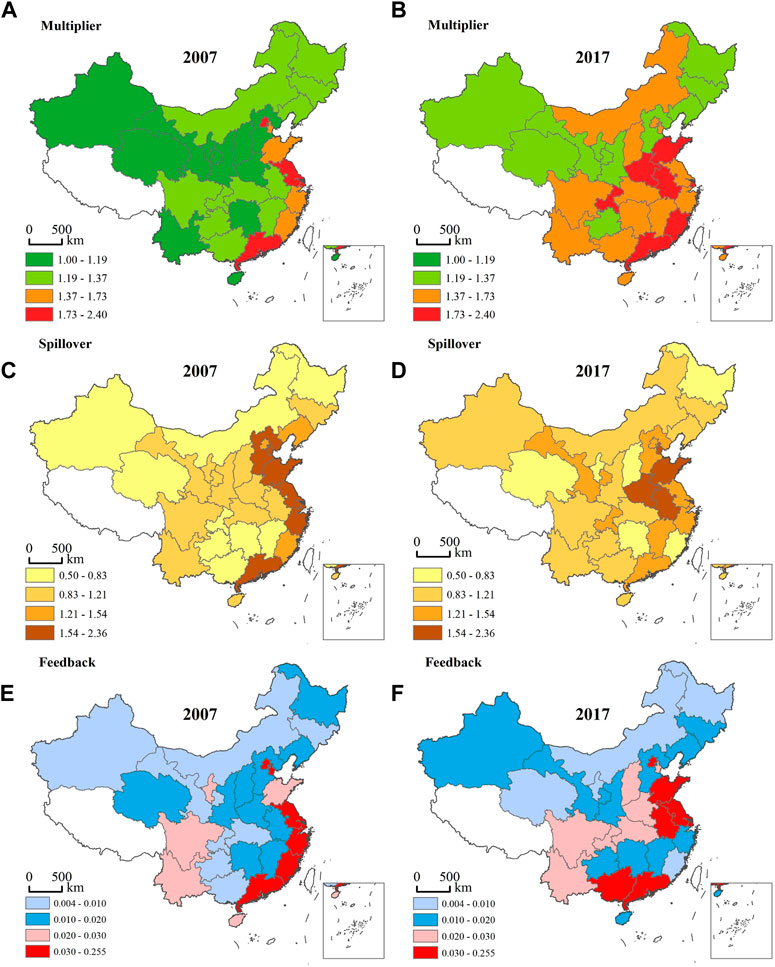
FIGURE 4. The spatiotemporal pattern of the multiplier, spillover, and feedback effect intensities of China’s digital industry in 2007(left) and 2017(right).
After nearly a decade of development, the effect intensity of digital industries in the central and western regions has increased significantly, such as Chongqing, Henan, and.
Anhui. This result is closely related to China’s implementation of the strategic guidance of the “Rise of Central China” and the “China Western Development.” However, the intensity of the effect in the more economically developed provinces in the coastal region all declined to varying degrees, and this result does not seem to match their economic status. Nevertheless, if we look at the reasons, part of the reason is that with the development of the economy, the economic connection between such regions and the outside world is strengthened, and it is no longer limited to the region itself. The intermediate products of the digital industry required by the inter-region begin to be provided by other regions, and the region is also started supplying intermediate goods to other regions. After taking this factor into account, this result can be reasonably explained to a certain extent. In general, the regions with higher intensity of the effect of digital industry are still concentrated in the southeast of the Hu Huanyong line, and have not yet broken through the line constraint, but show the trend of stronger in the east and gradual release of development potential in the middle and west.
3.2.2 Spatial variability of inter-industry effect intensity
The decomposition results of the intensity of spillover effects of digital industries in 30 Chinese provinces are displayed in Figure 5. In 2017, the intensity of spillover effects between digital and secondary industries was higher than that between digital and primary and tertiary industries in 26 provinces. This result is in line with the average level of spillover effect intensity of digital industries in China. However, the intensity of spillover effects between the digital industry and the tertiary industry in Beijing is twice as strong as that of the secondary industry, which also implies that the degree of integration between the digital industry and the tertiary industry in Beijing is much better than that with the secondary industry. The spillover structure of digital industries was adjusted between 2007 and 2017. The spillover intensity between digital and secondary industries in some developed coastal provinces showed a decreasing trend, such as Guangdong, Zhejiang, Anhui, and Fujian; on the contrary, the intensity of spillover effects between digital industries and both secondary and tertiary industries in inland regions increased. This phenomenon presents that the demand for secondary industries in the eastern coastal provinces is no longer limited to the domestic market, and the spillover effects of digital industries to other industries in the inland regions are more coordinated.
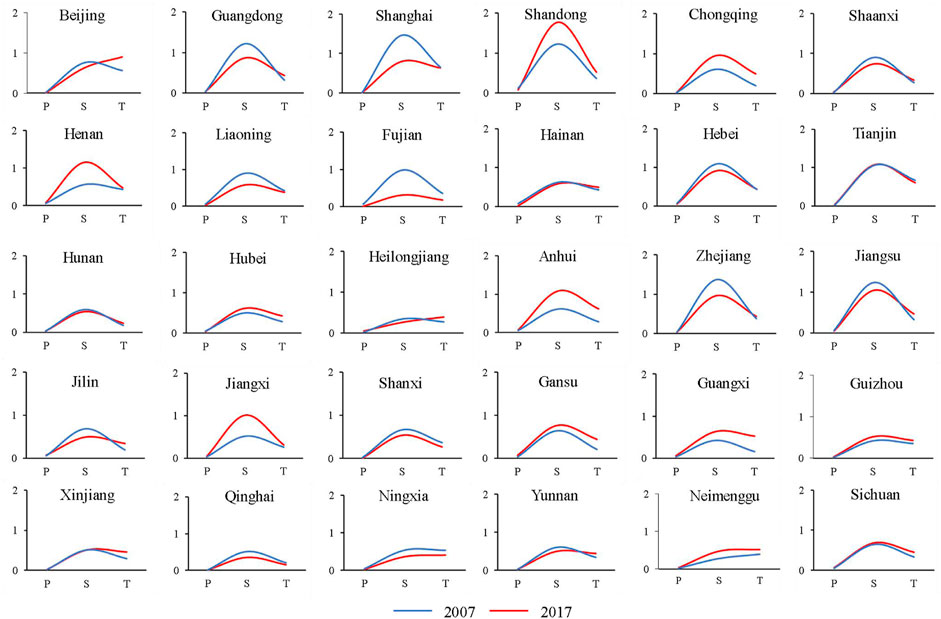
FIGURE 5. Spillover effects of digital industries on traditional tertiary industries by province. Note: “P” denotes the spillover effect of the digital industry on the primary industry; “S" denotes the spillover effect of the digital industry on the secondary industry; “T” denotes the spillover effect of the digital industry on the tertiary industry.
3.3 Intra- and inter-regional effect intensities at regional level
3.3.1 Intra-regional digital economic multiplier effect
The intra-regional multiplier and inter-regional spillover-feedback effects in eight regions (NE, BT, NC, SC, CT, NW and SW) and two periods (2012 and 2017) are presented in Figure 6. Regions SC and EC had larger intra-regional multiplier; NW, NC and CT had larger inter-regional spillover-feedback; In contrast, NW had the smallest intra-regional multiplier effects; SC had the smallest inter-regional spillover-feedback. By and large, all of the intra-regional multiplier effects moved towards a decline over the long haul; inter-regional spillover-feedback effects trended towards an increase. This tendency also indicates that the inter-regional linkage status shows a positive trend and the economic exchanges between regions are no longer confined to the intra-region. Regional markets are gradually opening up, and economic interactions are becoming frequent.
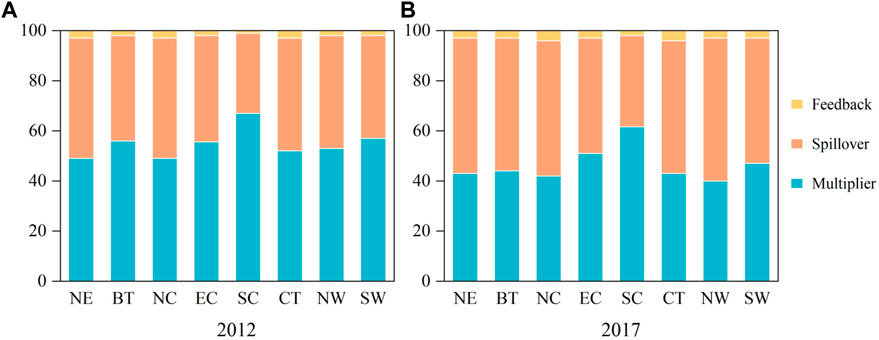
FIGURE 6. Ratio of digital industry spillover-feedback to total effect in eight regions of China. Note: NE-Northeast BT-Beijing-Tianjin NC-Northern coastal EC-Eastern coastal SC-Southern coastal CT-Central region NE-Northwest SE-Southwest.
3.3.2 Real inter-regional economic spillover of digital industry
The inter-regional spillover intensities of the digital industry across the 2 years are shown in Table 2. Taking the results in 2017 as an example, NC, CT, and NW were the regions with higher intensity of spillover effects; from a region’s demand side, CT, EC, and NC were the regions with higher intensity. Inversely, regions BT and NW had the smallest in demand aspect; regions SC and EC had the smallest in supply aspect. According to the viewpoint of time aspect, the inter-regional spillover intensities of digital industry in the eight region in demand and supply level is to keep growing. Specifically, from 2012 to 2017, the region SC, NW and CT in demand level increased by 156.49%, 60.43% and 54.22%, respectively, and similarly, from 2012 to 2017, the proportions in region NW, CT, BT in supply level were 57.00%, 48.51% and 45.29%, respectively. Therefore, the improvement of the regions is gradually relying on inter-regional interactions and linkages, which indicates that the level of regional integration is being strengthened.
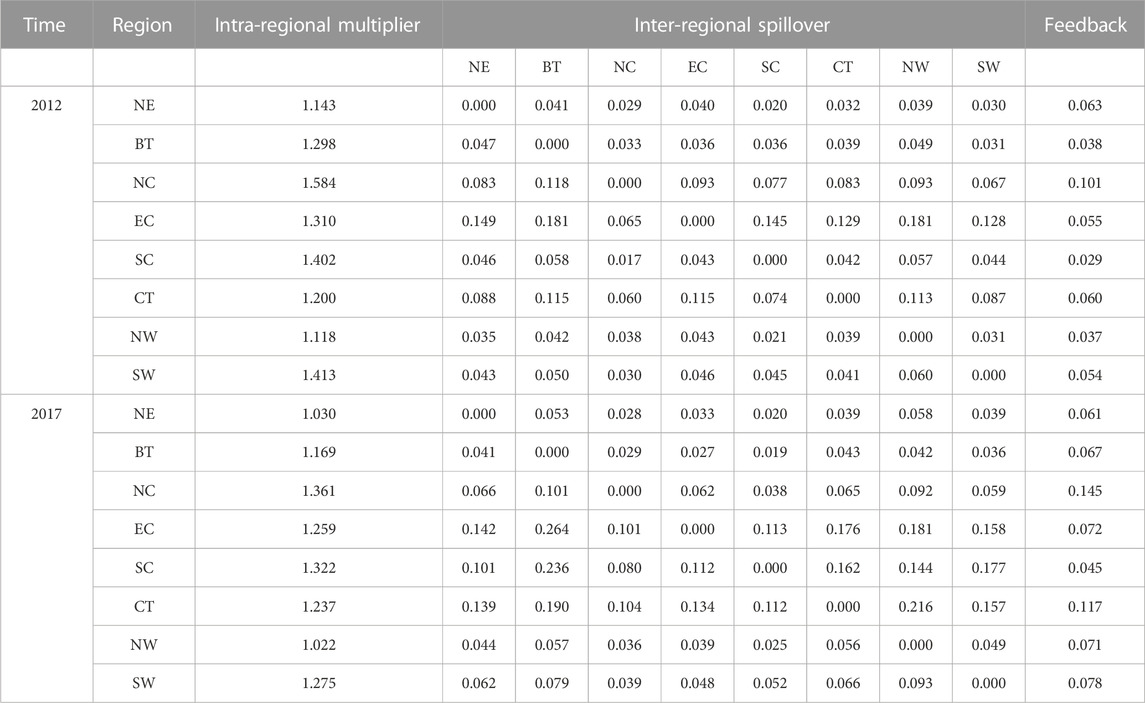
TABLE 2. The effect intensities of digital industry’s intra and interregional economic multipliers in China.
The eight inter-regional mutual economic spillover in two time periods are shown in Figure 7. Overall, whether in 2012 or 2017, BT, EC and SC were digital economic spillover flow export areas while NC, EC, and CT were net economic spillover flow import areas. However, in 2017, BT and SW transform from digital economic spillover flow import areas to economic spillover flow import areas than 2012, and the structure of inter-regional digital economic spillovers is also more balanced. Because, under the strategic guidance of the “Rise of Central China” and the “China Western Development”, the role of the central region in “connecting the east and connecting the west” is becoming more and more apparent. On the whole, it can be seen that spatial accessibility significantly impacts the inter-regional digital economic spillover. This influence is reflected in two aspects. First, the economic spillover between neighboring regions is more pronounced. Second, the region with low transportation costs is more significant. For example, the inter-regional economic spillover with maritime transport conditions is more significant, even if they are not adjacent.
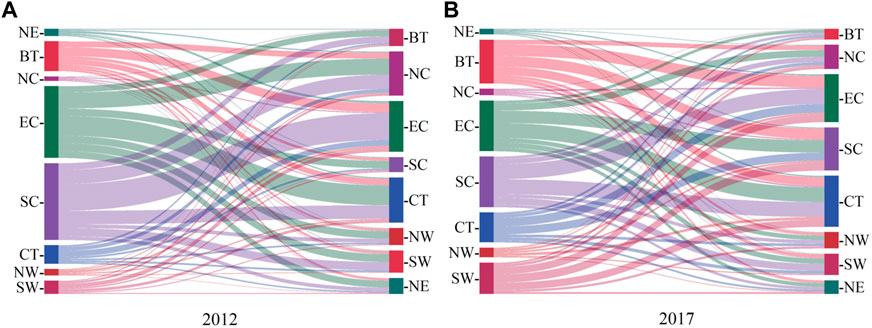
FIGURE 7. Mutual economic spillover of digital industries in eight regions of China. Note: “NE-” indicates the direction in which the northeast region overflows, “-NE” indicates the direction in which other regions spill into the northeast, and the rest have similar meanings.
3.3.3 Inter-regional digital economic feedback effect intensities
The intra-regional and the inter-regional digital economic feedback effect intensities are respectively shown in Table 2 and Figure 8. Taking an example 2017, at the intra-region level, regions NC and CT had the largest intra-regional feedback effect intensity; Region SC and NE had the smallest intra-regional feedback effect intensities. Except for the region NE, the remaining seven regions show an increasing trend over time. The region CT, NW and BT in increased by 96.02%, 95.28% and 78.24% from 2012 to 2017, respectively. From the standpoint of interregional feedback effect intensities of one region via other regions back to itself, the peak and least values are region NC and region SC in 2012 and 2017. From the standpoint of interregional feedback effect intensities of other regions via the region back to other regions, the peak and least values are region SC and region NE in 2017. In terms of time, all eight regions maintain an upward trend in one region via other regions back to itself aspect, and the region NW, CT and BT increasing by 104.87%, 95.26% and 68.54%; however, in other regions via the region back to other regions aspect, the trend stays up in some areas and down in others, the region SC, CT, BT and EC respectively increasing by 261.40%, 154.48%, 141.74% and 4.28%, the region NE NC NW SW decreasing by 81.88%, 37.54%, 38.45% and 1.97% respectively.
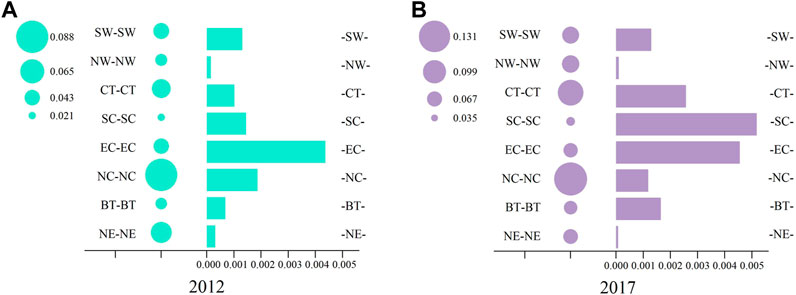
FIGURE 8. The inter-regional digital economic feedback effect intensities from one region’s own reaction and other regions’ own reaction. Note: “NE-NE” refers to the feedback effect intensities from one region’s own reaction, and “-NE-” refers to the feedback effect intensities from other regions’ own reaction, and the rest have similar meanings.
4 Discussions
4.1 Potential uses of the results
The experience of developed countries shows that the more developed the economy is, the more significant the resource allocation efficiency of digital industry is, and the closer the industrial relationship between digital industry and other industries is. At present, the intra-industry multiplier effect of China’s digital economy is stronger than the inter-industry spillover effect, and economic growth is mainly achieved through self-circulation. Therefore, it is necessary to further optimize the economic structure of the digital industry, focus on the coordinated development of the digital industry and the traditional industry, establish and improve the industrial system, so that it can bring greater economic growth momentum by improving labor productivity and promoting industrial technological innovation. In addition, China is in the critical period of industrial restructuring and supply-side reform, and is facing strong transformation needs. The digital industry needs innovation at the technical and model levels to promote the vertical development of the digital industrial chain and improve the modernization level of the industrial chain, in order to play a role in promoting the real economy.
The spatial variability of China’s digital industries effect intensities is excellent. To a certain extent, it also reflects the problem of unbalanced regional economic development. The effect intensity is related not only to the digital industry itself but also to the local industrial structure. The digital industries in the eastern region have a strong spillover effect. The digital industries in the central and western regions are in a rapid expansion stage, and there is no mature industrial interactive relationship with basic industries. For the eastern region, we should start with the optimization of industrial structure and industrial integration, encourage the model innovation of the digital industry, promote the integration of traditional industries and digital industries in industrial chain and industrial agglomeration, so that the digital industry can lead and drive the optimization and upgrading of the traditional industry structure, enhance the enhancement Sustainable development capabilities in the region. For the central and western regions, it should be placed in the first place in the development of the market, developing a digital industry with local characteristics according to local conditions, promoting the optimization and upgrading of the industrial structure, and the transformation of economic growth methods.
China’s regional digital industry development is very uncoordinated. The provinces with more developed digital industries do not show a higher degree of internal openness, and most of the digital industries are dominated by internal circulation, and the external export of digital industries in each region is significantly insufficient. For regions with backward economic development, the low level of digital industry development directly restricts the local economic growth rate, and the intra-regional circulation of digital industry in developed regions not only aggravates the unevenness of China’s regional development, but also fails to achieve the optimal allocation of resources. If this gap is to be narrowed, the interaction between regions needs to be strengthened, with strength leading to weakness. Therefore, more support should be given to the central and western regions in terms of policies and financial resources, and the mining of digital resources in the central and western regions should be expanded. At the same time, the central and western regions should also firmly grasp the strategic opportunities, strengthen regional cooperation with the eastern region, and learn from the advanced experience of digital industry development in the eastern region. Further breaking the market barriers between regions and promoting the economic development of China’s three growth poles, will bring a vital source of power to China’s overall economic growth, especially in the central and western regions.
4.2 The limitation and future prospects
In this paper, the spillover-feedback effects of the digital industry with other industries are measured in detail, but the internal mechanism and the influencing factors are not analyzed in depth. In the current study, the research on the spillover-feedback effects of industries exists more in the description of the current situation, and the research on the internal mechanism and influencing factors needs to be studied more deeply with the help of other modeling tools other than input-output models.
Second, this paper analyzes the spatially differentiated characteristics of the spillover-feedback effects of digital industries in 30 Chinese provinces, but the specific reasons for the differences in these characteristics are not further analyzed; whether the spatially differentiated characteristics affect the regional economy or the development of the regional economy affects the characteristics are questions worth further study in the future, which will provide a stronger explanation for understanding the promotion of digital industries to economic growth.
Finally, this paper finds through research that the spillover effect of China’s inter-regional digital industry is weak, and how to transform the current inter-industry spillover within the digital industry region into inter-regional spillover is a topic of great practical significance.
5 Conclusion
Based on the input-output model, this study analyzes the dynamic evolution characteristics of digital industry linkages at the industry level and compares the interactions between digital industry and the three major industries; at the provincial level, it shows the spatial and temporal differences and characteristics of digital industry linkages among 30 provinces in China and clarifies the different positions of digital industry in the economic development of each province; at the regional level, it analyzes the inter-regional spillover of digital industry and, as a result, the following important findings are obtained.
First, the autogenous capacity within the digital industry sector is the biggest factor affecting China’s digital economy industry, followed by the mutual spillover between industry sectors, while the feedback effect of industry has a weaker impact on the economic system. The spillover effect of the digital industry is the highest among the four industries, and the multiplier and spillover effects of the industries are also relatively balanced, while the secondary and tertiary industries rely more on their own endogenous multiplier effects, although this structural difference is gradually converging, and the mutual spillover between industries is becoming more and more significant.
Secondly, the differentiation of the industrial association structure of digital industry in each province is outstanding, and the degree of industrial integration in economically developed provinces is higher and is generally stronger than that in economically backward provinces. However, the regional differences are gradually narrowing, because the degree of industrial integration within the economically backward provinces is supported by policies showing a gradual upward trend, while the economically developed is subject to the impact of foreign markets showing a downward trend.
Third, overall, it seems that the external supply of digital industry in each region is very low, and the vast majority of digital products in each region of China are circulated internally within the region, with relatively weak inter-regional exchanges, and the external export of digital industry in each region is obviously insufficient. The intra-regional digital industry is most closely connected within the northern coastal region, and the northeastern region is the weakest. At the same time, the coastal region shows a decreasing trend, while the inland region shows an increasing trend; the inter-regional spillover is the highest in the Beijing-Tianjin region, the lowest in the eastern coastal region. The inter-regional spillover and feedback effect in the inland region keep increasing, but the coastal region shows a decreasing trend.
In summary, the development of the digital economy in the less developed regions of China, such as the Northeast, Northwest, and Southwest China, is increasingly being influenced by other regions; in contrast, the ability of coastal regions to drive digital economic growth in other regions of China is weakening. It further indicates that with the deepening integration of different regional markets, the development of China’s regional economy has gradually shifted from relying on local final products to relying on external regional final products, and the inter-regional spillover has become an important driving force source for China’s regional economic development that cannot be ignored.
Data availability statement
The original contributions presented in the study are included in the article/Supplementary Material, further inquiries can be directed to the corresponding authors.
Author contributions
ZM, conceptualization, methodology, software, visualization; XN, data curation, methodology, software, visualization, writing- original draft; WM, conceptualization, methodology, supervision, writing- reviewing and editing; YK, methodology, software, visualization; WX, methodology, software, visualization.
Funding
This work was supported by the National Natural Science Foundation of China (grant number 42201302) and the “Double First-Class” University Construction Project of Lanzhou University (grant number 561120213).
Acknowledgments
The author is grateful for the data support from the China Carbon Accounting Database (CEADs) and the National Bureau of Statistics and the very valuable comments from the anonymous referees.
Conflict of interest
The authors declare that the research was conducted in the absence of any commercial or financial relationships that could be construed as a potential conflict of interest.
Publisher’s note
All claims expressed in this article are solely those of the authors and do not necessarily represent those of their affiliated organizations, or those of the publisher, the editors and the reviewers. Any product that may be evaluated in this article, or claim that may be made by its manufacturer, is not guaranteed or endorsed by the publisher.
References
Bahrini, R., and Qaffas, A. A. (2019). Impact of information and communication technology on economic growth: Evidence from developing countries. Economies 7, 21. doi:10.3390/economies7010021
Bowman, J. P. (1996). The digital economy: Promise and peril in the age of networked intelligence. USA Academy of Management Perspectives. doi:10.1016/S0099-1333(96)90098-1
Bressanelli, G., Adrodegari, F., Perona, M., and Saccani, N. (2018). Exploring how usage-focused business models enable circular economy through digital technologies. Sustainability 10, 639. doi:10.3390/su10030639
Bulturbayevich, M. B., and Jurayevich, M. B.Law and Education (2020). The impact of the digital economy on economic growth. Int. J. Bus. 1, 4–7. doi:10.56442/ijble.v1i1.2
Bunje, M. Y., Abendin, S., and Wang, Y. (2022). The multidimensional effect of financial development on trade in Africa: The role of the digital economy. Telecommun. Policy 46, 102444. doi:10.1016/j.telpol.2022.102444
Chen, Y., Huang, K., Hu, J., Yu, Y., Wu, L., and Hu, T. (2021). Understanding the two-way virtual water transfer in urban agglomeration: A new perspective from spillover-feedback effects. J. Clean. Prod. 310, 127495. doi:10.1016/j.jclepro.2021.127495
Ding, C., Liu, C., Zheng, C., and Li, F. (2021). Digital economy, technological innovation and high-quality economic development: Based on spatial effect and mediation effect. Sustainability 14, 216. doi:10.3390/su14010216
Gong, Q. H. a. Y., and Gong, Y. (2022). The impact of the quality of digital economy development on manufacturing in the yangtze river delta city cluster. J. Econ. Finance Account. Stud. 4, 52–63. doi:10.32996/jefas.2022.4.3.6
Hu, J., Huang, K., Ridoutt, B. G., Yu, Y., and Xu, M. (2019). Measuring integrated environmental footprint transfers in China: A new perspective on spillover-feedback effects. J. Clean. Prod. 241, 118375. doi:10.1016/j.jclepro.2019.118375
Jiang, M., and Jia, P. (2022). Does the level of digitalized service drive the global export of digital service trade? Evidence from global perspective. Telematics Inf. 72, 101853. doi:10.1016/j.tele.2022.101853
Jorgenson, D. W., and Vu, K. M. (2016). The ICT revolution, world economic growth, and policy issues. Telecommun. Policy 40, 383–397. doi:10.1016/j.telpol.2016.01.002
Kurniawan, T. A., Maiurova, A., Kustikova, M., Bykovskaia, E., Othman, M. H. D., and Goh, H. H. (2022). Accelerating sustainability transition in st. Petersburg (Russia) through digitalization-based circular economy in waste recycling industry: A strategy to promote carbon neutrality in era of industry 4.0. J. Clean. Prod. 363, 132452. doi:10.1016/j.jclepro.2022.132452
Latif, Z., mengke, Y., DanishLatif, S., Ximei, L., Pathan, Z. H., Salam, S., et al. (2018). The dynamics of ICT, foreign direct investment, globalization and economic growth: Panel estimation robust to heterogeneity and cross-sectional dependence. Telematics Inf. 35, 318–328. doi:10.1016/j.tele.2017.12.006
Li, Y., Luo, E., Zhang, H., Tian, X., and Liu, T. (2018). Measuring interregional spillover and feedback effects of economy and CO2 emissions: A case study of the capital city agglomeration in China. Resour. Conservation Recycl. 139, 104–113. doi:10.1016/j.resconrec.2018.07.021
Lioutas, E. D., Charatsari, C., and De Rosa, M. (2021). Digitalization of agriculture: A way to solve the food problem or a trolley dilemma? Technol. Soc. 67, 101744. doi:10.1016/j.techsoc.2021.101744
Liu, X., Latif, Z., DanishLatif, S., and Mahmood, N. (2021a). The corruption-emissions nexus: Do information and communication technologies make a difference? Util. Policy 72, 101244. doi:10.1016/j.jup.2021.101244
Liu, X., Latif, Z., Xiong, D., Yang, M., Latif, S., and Wara, K. U. (2021b). The nexus among globalization, ICT and economic growth: An empirical analysis. J. Inf. Process. Syst. 17, 1044–1056. doi:10.3745/JIPS.04.0227
Liu, L., Ding, T., and Wang, H. (2022). Digital economy, technological innovation and green high-quality development of industry: A study case of China. Sustainability 14, 11078. doi:10.3390/su141711078
Lv, C., Song, J., and Lee, C.-C. (2022). Can digital finance narrow the regional disparities in the quality of economic growth? Evidence from China. Econ. Analysis Policy 76, 502–521. doi:10.1016/j.eap.2022.08.022
Ma, D., and Zhu, Q. (2022). Innovation in emerging economies: Research on the digital economy driving high-quality green development. J. Bus. Res. 145, 801–813. doi:10.1016/j.jbusres.2022.03.041
Miller, R. (1963). Comments on the “General Equilibrium” model of professor moses. Metroeconomica 15, 82–88. doi:10.1111/j.1467-999X.1963.tb00301.x
Ning, Y., Miao, L., Ding, T., and Zhang, B. (2019). Carbon emission spillover and feedback effects in China based on a multiregional input-output model. Resour. Conservation Recycl. 141, 211–218. doi:10.1016/j.resconrec.2018.10.022
Oliner, S. D., and Sichel, D. E. (2000). The resurgence of growth in the late 1990s: Is information technology the story? Economic perspectives. J. Econ. Perspect. 14, 3–22. doi:10.1257/jep.14.4.3
Popkova, E. G., De Bernardi, P., Tyurina, Y. G., and Sergi, B. S. (2022). A theory of digital technology advancement to address the grand challenges of sustainable development. Technol. Soc. 68, 101831. doi:10.1016/j.techsoc.2021.101831
Pradhan, R. P., Arvin, M. B., Nair, M., Bennett, S. E., and Bahmani, S. (2019). Short-term and long-term dynamics of venture capital and economic growth in a digital economy: A study of European countries. Technol. Soc. 57, 125–134. doi:10.1016/j.techsoc.2018.11.002
Pyatt, G., and Round, J. (1979). Accounting and fixed price multipliers in a social accounting matrix framework. Econ. J. 89, 850–873. doi:10.2307/2231503
Round, J. I. (1985). Decomposing multipliers for economic systems involving regional and world trade. Econ. J. 95, 383–399. doi:10.2307/2233216
Simionescu, M. (2022). The insertion of economic cybernetics students on the Romanian labor market in the context of digital economy and COVID-19 pandemic. Mathematics 10, 222. doi:10.3390/math10020222
Singh, S., Sharma, M., and Dhir, S. (2021). Modeling the effects of digital transformation in Indian manufacturing industry. Technol. Soc. 67, 101763. doi:10.1016/j.techsoc.2021.101763
Song, M., Zheng, C., and Wang, J. (2021). The role of digital economy in China's sustainable development in a post-pandemic environment. Enterp. Inf. Manag. 35, 58–77. doi:10.1108/JEIM-03-2021-0153
Stiroh, K. J. (2002). Information technology and the US productivity revival: What do the industry data say? Am. Econ. Rev. 92, 1559–1576. doi:10.1257/000282802762024638
Stone, R. J. S. (1985). The disaggregation of the household sector in the national accounts. Social accounting matrices: A basis for planning, 145–185.
Su, J., Su, K., and Wang, S. (2021). Does the digital economy promote industrial structural upgrading?—a test of mediating effects based on heterogeneous technological innovation. Sustainability 13, 10105. doi:10.3390/su131810105
Sun, L., and Wang, Y. (2021). Global economic performance and natural resources commodity prices volatility: Evidence from pre and post COVID-19 era. Resour. Policy 74, 102393. doi:10.1016/j.resourpol.2021.102393
Wang, Q., and Zhang, F. (2021). What does the China's economic recovery after COVID-19 pandemic mean for the economic growth and energy consumption of other countries? J. Clean. Prod. 295, 126265. doi:10.1016/j.jclepro.2021.126265
Wang, J., Dong, K., Dong, X., and Jiang, Q. (2021). Research on the carbon emission effect of the seven regions along the Belt and road—Based on the spillover and feedback effects model. J. Clean. Prod. 319, 128758. doi:10.1016/j.jclepro.2021.128758
Wang, X., Wang, L., Zhang, X., and Fan, F. (2022). The spatiotemporal evolution of COVID-19 in China and its impact on urban economic resilience. China Econ. Rev. 74, 101806. doi:10.1016/j.chieco.2022.101806
Xiao, X.-Y. (2020). Research on the integration of digital economy and real economy to promote high-quality economic development. Proceeding of the 2020 Management Science Informatization and Economic Innovation Development Conference (MSIEID). December 2020, Guangzhou, China. IEEE, 8–11.
Xue, Y., Tang, C., Wu, H., Liu, J., and Hao, Y. (2022). The emerging driving force of energy consumption in China: Does digital economy development matter? Energy Policy 165, 112997. doi:10.1016/j.enpol.2022.112997
Zhang, Y.-J., and Zhang, K.-B. (2018). The linkage of CO2 emissions for China, EU, and USA: Evidence from the regional and sectoral analyses. Environ. Sci. Pollut. Res. 25, 20179–20192. doi:10.1007/s11356-018-1965-7
Zhang, W., Zhang, T., Li, H., and Zhang, H. (2022). Dynamic spillover capacity of R&D and digital investments in China's manufacturing industry under long-term technological progress based on the industry chain perspective. Technol. Soc. 71, 102129. doi:10.1016/j.techsoc.2022.102129
Zhang, Y. (2017). Interregional carbon emission spillover–feedback effects in China. Energy Policy 100, 138–148. doi:10.1016/j.enpol.2016.10.012
Keywords: digital industry, spillover effect, multiplier effect, feedback effect, MRIO model, China
Citation: Ma Z, Niu X, Ma W, Kang Y and Xie W (2023) Interregional and intersectoral interaction of digital economy in China. Front. Environ. Sci. 11:1138200. doi: 10.3389/fenvs.2023.1138200
Received: 05 January 2023; Accepted: 07 March 2023;
Published: 20 March 2023.
Edited by:
Evgeny Kuzmin, Ural Branch of the Russian Academy of Sciences, RussiaReviewed by:
Kai Liu, Shandong Normal University, ChinaRemus Cretan, West University of Timișoara, Romania
Jaroslaw Nazarczuk, University of Warmia and Mazury in Olsztyn, Poland
Copyright © 2023 Ma, Niu, Ma, Kang and Xie. This is an open-access article distributed under the terms of the Creative Commons Attribution License (CC BY). The use, distribution or reproduction in other forums is permitted, provided the original author(s) and the copyright owner(s) are credited and that the original publication in this journal is cited, in accordance with accepted academic practice. No use, distribution or reproduction is permitted which does not comply with these terms.
*Correspondence: Xingxing Niu, MjAyMTIxMjgzOUBud251LmVkdS5jbg==; Weijing Ma, bWF3ZWlqaW5nQGx6dS5lZHUuY24=