 Fang Liu
 Tianling Qin2*
 Shanshan Liu
95% of researchers rate our articles as excellent or good
Learn more about the work of our research integrity team to safeguard the quality of each article we publish.
Find out more
ORIGINAL RESEARCH article
Front. Environ. Sci. , 03 May 2023
Sec. Land Use Dynamics
Volume 11 - 2023 | https://doi.org/10.3389/fenvs.2023.1137442
This article is part of the Research Topic Advances in Characterizing and Monitoring Land Cover/Use and Associated Ecosystem Changes Using Remote Sensing Data View all 13 articles
Exploring the impact of urban land use change (LUC) on ecosystem services is significant for ensuring urban ecological security and realizing regional economic development. This study used land use data from 1985, 2000, 2014, and 2020 of Tongling city and the CA–Markov model to predict the LUC in 2025 and 2030. The spatio-temporal distribution characteristics of LUC during 1985–2030 were analyzed using the land use dynamics model and Sankey diagram. The vegetation-corrected ecological services value (ESV) equivalent was used to quantify the impact of LUC on ESV. Estimating the profit/loss value and spatial autocorrelation revealed ESV’s spatial and temporal dynamics in Tongling city. The results show that: 1) The most obvious LUC in the study area during 1985–2030 is the conversion of cultivated land to built-up land, in which the proportion of cultivated land decreased by 9.6%, and built-up land increased by 12.2%. 2) During 1985–2030, the ESV in Tongling showed an increasing trend at the beginning and then decreased, reaching a maximum value of 274.74 billion yuan in 2000. Regarding individual ecosystem service functions, the hydrological regulation function significantly contributed to ESV changes. The area change in paddy fields and built-up land had the most significant impact on ESV. 3) The total addition of ESV in Tongling during 1985–2030 was 5.98 billion yuan; the total loss was 18.59 billion yuan, and the net loss was 12.6 billion yuan. The proportion of area with ESV gains relative to the whole city is getting smaller, and the proportion of area with ESV losses is growing. The spatial autocorrelation shows the presence of high aggregation in ESV profit and loss areas. Simulating future LUC in Tongling and exploring ESV’s response is beneficial to developing new landscape patterns and ecological protection. It also provides a scientific basis for the extensive promotion of sustainable urban development in the future.
Urban land use change (LUC) is a direct manifestation of urbanization. Rapid urban development profoundly affects the changes in the structure and function of different types of urban ecosystems (Dewan and Yamaguchi, 2009; Chatterjee and Majumdar, 2022). Ecosystem services reflect the direct or indirect benefits humans derive from changes in ecosystem structure, processes, and functions (De Groot et al., 2010; Pueffel et al., 2018; Chatterjee et al., 2022). Ecological services value (ESV) is the value generated by natural ecosystems quantified in monetary terms (Vallecillo et al., 2019). Changes in ESV are due to LUC, and substantial LUC has become a major factor in weakening and destroying urban ESV (Rimal et al., 2019; Santos-Martín et al., 2019; Gao et al., 2021a). LUC is also the main driver of changes in the value of ecosystem goods and services (Kindu et al., 2016; Felipe-Lucia et al., 2020). Exploring the impact of urban LUC on ESV has important practical significance for identifying the characteristics of the urban ecological environment changes and optimizing the national landscape planning (Hu et al., 2019; Sun et al., 2020).
Since Costanza et al. pioneered the quantification of global ESV in 1997, ESV research gradually became a hot spot in ecological research and accumulated numerous research results on the impact of urban LUC on ESV (Costanza et al., 1998; Sonter et al., 2017; Himes-Cornell et al., 2018; Syrbe et al., 2018; He et al., 2021; Zhang et al., 2021). Based on this, domestic scholars Xie et al. (2003) developed a Chinese ecosystem service value per unit area scale. Their findings are widely used by scholars in China and abroad. As the research progressed, the direction shifted from global to local and regional scales. Analyzing finer scales and typical regions has prompted more attention to various research questions (Tammi et al., 2017; Sannigrahi et al., 2018). Most studies involve high ESV value areas such as lakes and forests ((Gao et al., 2021b; Schirpke et al., 2021)). The studies mainly focus on the drivers, spatial and temporal changes and influencing factors of ecosystem services (Hu et al., 2022; Devkota et al., 2023). The research methods are mainly based on spatial and statistical analyses (Kubiszewski et al., 2017; Houtven et al., 2019). For example, at a global scale, Nelson et al. (2010) modelled the effects of urban sprawl on ecosystem services. They found that urban sprawl was the main factor contributing to species habitat decline. At the regional scale, Delphin et al. (2016) modelled the effects of urban sprawl on forest ecosystem services in the lower Suwannee River. They found varying degrees of reduction in carbon storage and wood volume. At the local scale, Cao et al. (2021) studied the relationship between regional urbanization characteristics and ecosystem services in China from 2000 to 2015. They found that ESV was positively correlated with economic growth, with significant differences in ESV across ecosystem types.
Aided by remote sensing and GIS technology, many scholars have conducted studies on land use prediction using simulation models. The advantages and disadvantages of these models have also been examined. For example, the FLUS model has unique advantages in simulating complex non-linear problems, but its inherent uncertainty can adversely affect the simulation results (Liang et al., 2018; Liu et al., 2021). The PLUS model can simulate the plot-level changes of multiple land use types and effectively solve the probability of land conversion under the combined effect of natural and human factors. However, it has shortcomings in spatial optimization (Li et al., 2022; Gao et al., 2022). The CLUE-S model systematically simulates the spatial distribution of various land types based on the relationship between land use and driving factors. However, it can only predict land use scenarios for small-scale studies (Chasia et al., 2023; Kiziridis et al., 2023). The CA-Markov model combines the ability of CA models to simulate spatial changes in complex systems. The Markov models are advantageous for long-term prediction since they can effectively simulate urban land use patterns from both temporal and spatial perspectives. They can also accurately predict land use type conversions (Gashaw et al., 2018; Mansour et al., 2020).
Previous studies on the impacts of LUC on ESV have focused mainly on the impact of past land use changes on the current ESV (Clements et al., 2021; Wang and Nuppenau, 2021; Xiang et al., 2022). There is still room for research on potential future trends in ESV. The studies also lack a detailed assessment of the current and future ESV profits and losses. In addition, attention was not given to ESV’s spatial differences caused by drastic changes in urban land use. In the context of implementing the Yangtze River conservation strategy and supporting the Yangtze River Economic Belt’s green development, Tongling has a typical problem of an unbalanced relationship between urban development and ecological conservation (Peng et al., 2021; Qiao and Huang, 2022). In this study, the CA–Morkov model is used to predict the future land use scenario of Tongling city for 5–10 years. The hot spots of ecological changes and ecological restoration areas were effectively identified by analyzing past and future land use scenario changes and ESV responses. The findings provide a theoretical basis for restoring ecological spots in the city. In addition, identifying ecological spots can also help to understand the ecological evolution mechanism in similar regions and provide scientific reference for the government to develop sustainable land use measures for cities targeted in the national strategic development (Schirpke et al., 2020; Peng et al., 2021).
This study used land use data in 1985, 2000, 2014, and 2020 as the main data source. The CA–Markov model was employed to predict land use patterns in 2025 and 2030 by combining land use information and natural and social driving factors. The spatial and temporal distribution of LUCs from 1985 to 2030 were analyzed using the dynamic LUC model and Sankey diagram. ESV equivalent per unit area was corrected using the normalized difference vegetation index (NDVI). The correction helps to identify ESV’s spatial and temporal response to LUC. The profit and loss analysis and spatial autocorrelations were also used to characterize profit and loss changes during 1985–2030. We expect this research to be of practical significance for effective urban planning and the realization of ecological security in Tongling city. The research also provides scientific support for restoring ecological space per the national strategic plan.
Tongling (30°20′–31°09′N, 117°05′–118°10′E) is located in Anhui Province, China (Figure 1). It is located at the intersection of the Yangtze River plains and the mountains of southern Anhui. The main stream of the Yangtze River is 142.6 km long in Tongling. The section is the most curved and branched section in the middle and lower reaches of the Yangtze River. Tongling is situated in a plain landscape in south-central Anhui, and the city’s total area is 2993.81 km2. The altitude ranges between 100 and 350 m. The city’s flat plains, basins and hills account for 63.67%, 14.43%, and 21.9% of the total land area. A humid subtropical monsoon climate with an average temperature of 16.2°C characterizes Tongling. It receives total annual sunshine hours of 2000–2050 h and annual precipitation of 1,247–1,558 mm. The rainfall is concentrated from May to September, accounting for approximately 60% of the annual rainfall. By the end of 2020, Tongling had a resident population of 1,312,000 and a gross regional product of 1003.7 million yuan. In addition, the vegetation cover ≥0.78 area accounted for 82% of the whole city in recent year, indicating the extensive green area and high degree of vegetation cover in Tongling.
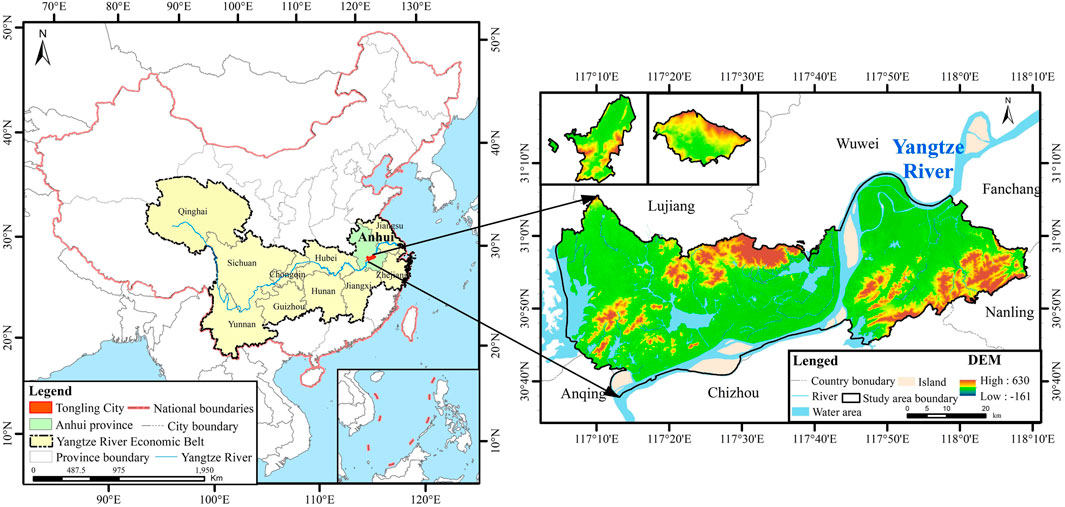
FIGURE 1. The location of the study area.
The data used in this study include digital elevation model (DEM), slope, land use, remote sensing imagery, socioeconomic, road and meteorological data. The details of these datasets are shown in Table 1. The land use data of Tongling in 1985, 2000, 2014, and 2020 are the main data sources. The data were obtained from the Environmental Science Data Center of the Chinese Academy of Sciences with a spatial resolution of 30 m. The classification accuracy of this data is more than 90%. Following the global land use classification systems such as International Geosphere-Biosphere Programme (IGBP), Food and Agriculture Organization of the United Nations (FAO) and the University of Maryland, the land uses were divided into 6 categories: cultivated land, forest, grassland, water area, built-up land and unused land (Zuo, 2016; Lei et al., 2020). The land covered by human infrastructure and urban construction is defined as built-up land. Considering the local situation of Tongling, the cultivated land and forest classes were further classified into detailed classes. Consequently, the cultivated land is subdivided into dryland and paddy fields, and the forest is subdivided into the broad-leaved forest and shrub wood.
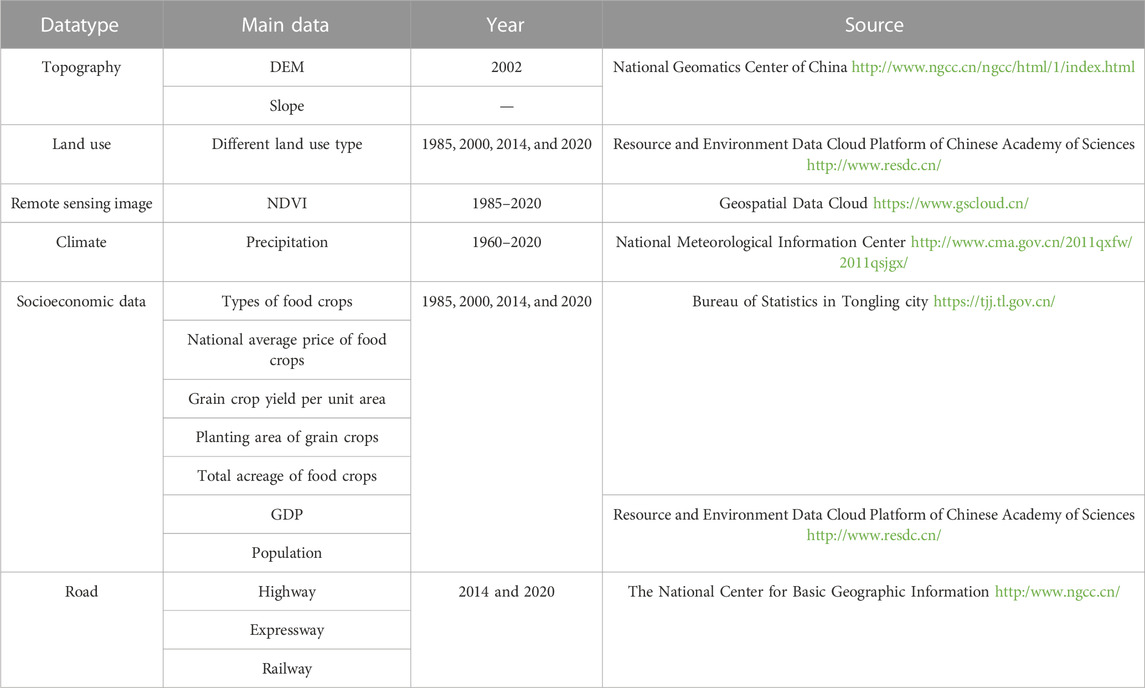
TABLE 1. Data types and sources.
Slope information was obtained from DEM (30 m spatial resolution) using the surface analysis module of ArcGIS10.2 software. The NDVI data were retrieved from the Geospatial Data Cloud, which contains two products, GIMMS and MODIS. This study uses the GIMMS NDVI (8 km spatial resolution) for 1985–2000 and the MODIS NDVI (1 km spatial resolution) for 2001–2020. The remote sensing data from the two sources were downscaled to obtain NDVI data with 30 m spatial resolution. Spatial interpolation of precipitation for 1960–2020 was performed using the spatial interpolation module in ArcGIS10.2 software to obtain the multi-year average surface rainfall in Tongling with 30 m spatial resolution. The food crops’ socioeconomic information was obtained from the statistical yearbook of Tongling city. The spatial distribution of the population and gross domestic product (GDP) of Tongling (30 m spatial resolution) was obtained by downscaling the 1 km grid dataset of China’s population and GDP. The road data were obtained from the National Center for Basic Geographic Information, and the raster data of highway, expressway and railway with 30 m spatial resolution were generated using ArcGIS10.2 software. The above data were used as drivers for predicting future land use patterns.
This study simulates the LUC in 2025 and 2030 using the CA–Markov model and five periods of land use data in Tongling. Elevation, slope, precipitation, road, population and GDP data were used as drivers. The dynamic LUC model and Sankey diagram were utilized to characterize each land use type’s spatial and temporal changes. Based on the ESV assessment system proposed by previous studies, the equivalence table of each ESV for different land use types in Tongling was constructed. The NDVI was used to correct the ESV equivalents of paddy fields, dryland, broad-leaved forest and shrub wood. Moreover, the equivalence factor method was used to analyze the distribution of ESV of each land use type from 1985 to 2030. In addition, the spatial and temporal dynamics of ESV profit and loss were analyzed using spatial autocorrelation (Figure 2).
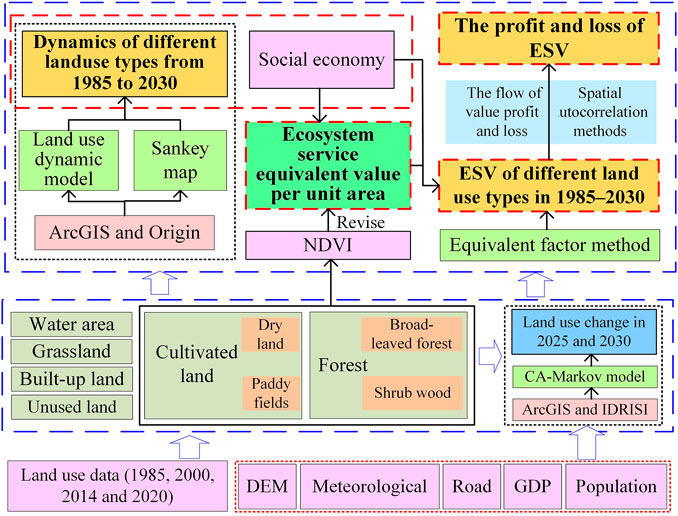
FIGURE 2. Research ideas.
The CA–Markov model in IDRISI software has been widely used in LUCC simulation studies (Matlhodi et al., 2021; Wang and Wang, 2022). The cellular automata (CA) in land use simulations can generate potential transition maps considering spatial structure and neighborhood states. At the same time, the Markov model can provide a time-varying LUCC transition zone matrix based on time variation. The initial probabilities of the different states of the system and the transfer probabilities between states are used to determine each state’s trend at each future moment. The CA–Markov model combines Markov and CA models to compensate for the deficiencies of each model. It can achieve dual prediction of land use types and their spatial distribution. The simulation process is as follows.
1) Complete merging, cropping, adjusting coordinate system and resolution of land use data using ArcGIS software. Then convert the datasets to IDRISI identifiable data.
2) Set the error parameters and interval years based on the land use data for 2014 and 2020. The land use transfer area and transfer probability matrix were obtained using the Markov model in the study area during 2014–2020.
3) Produce the suitability atlas using the “Decision Wizard” module of IDRISI software. This study selected eight factors that greatly impact LUC to create the suitability atlas. They are DEM, slope, average annual precipitation, roads, highways, railroads, population, and GDP.
4) Import the land use transfer area and transfer probability matrix into CA–Markov model with the suitability atlas to simulate the land use scenarios in 2025 and 2030.
In this paper, the Kappa coefficient is used as the evaluation index for the simulation accuracy assessment of the CA–Markov model. When the Kappa coefficient is greater than 0.75, it indicates high simulation accuracy. When the Kappa coefficient is less than 0.4, the simulation results are less consistent with the actual condition (Aksoy and Kaptan, 2021; Cunha et al., 2021). The expressions are:
Where
(1) The following land use dynamic models were used to describe the LUC characteristics quantitatively.
Where
(2) The Sankey diagram was made by origin software to reveal the conversion characteristics of the various land use types in different years (Zhang et al., 2019). The map depicts a network between start and end states, while the different branching lines inside the network represent the conversion of land use types. The width of the stacked bars proportionally shows the percentage of area occupied by this conversion method. The heights at the nodes represent the area of each land use type.
1) The value equivalent of various ecosystem services of land use types in Tongling City was assigned following the “China Terrestrial Ecosystem Service Value Equivalent Table per Unit Area” evaluation system. The system was a revision by Xie following the ESV assessment system proposed by Costanza et al. (1998) (Costanza et al., 1998; Xie et al., 2015) (Table 2). Eqs 5, 6 were used to calculate the ESV of Tongling City.
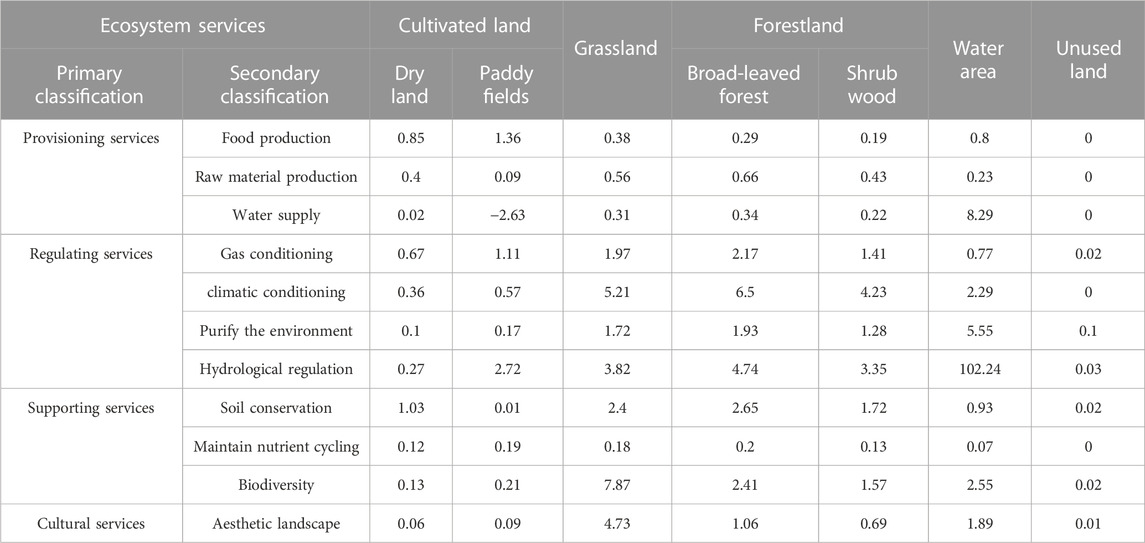
TABLE 2. Ecosystem service equivalent value per unit area for Tongling.
Where
The equivalent of ecosystem services for the study area was computed using Eq. 7 below. The economic value of farmland natural grain production in Tongling City in 2014 was calculated, and the economic value of 1 unit of ecosystem services was found to be 3083.8 yuan
where
To study the spatial distribution of ESV, we selected the vegetation coverage index (Eq. 8) as the revision index of grid-scale ESV. We used Eqs 9, 10 to revise grid-level ESV. Due to the scarcity of vegetation in the water bodies, the NDVI value for these land use types is ≤0. This study made further revisions for the cultivated land, forest and grassland.
Where
(2) The degree of impact of LUC on ESV was identified through analysis of ESV profit and loss (Ling et al., 2016). Using ArcGIS’s fish net creation tool, Tongling City was divided into 1.25 × 10⁴ grid units of 0.5 km × 0.5 km. The spatial autocorrelation analysis of ESV profit and loss was done using Geoda software.
Where
Before the simulation of land use scenarios in 2025 and 2030 in Tongling, the model’s accuracy was tested. The land use data for 2014 and 2020 were imported in IDRISI software, the number of cycles was set to 6 years, and a standard 5 × 5 adjacency filter was applied to obtain the LUCC simulated map for 2020. The Kappa index between the simulated and measured maps in 2020 is calculated to be 0.87. The error in cultivated land and forest area is about 5%. The error in the built-up land area is about 4%, and the error in grassland, water area and unused land is less than 3%. The results prove that the CA–Markov model meets the simulation requirements. Based on the 2020 land use data again, the number of cycles was set to 5 and 10 years. The standard 5 × 5 adjacency filter was also applied to obtain land use scenario maps for 2025 and 2030 (Figure 3).
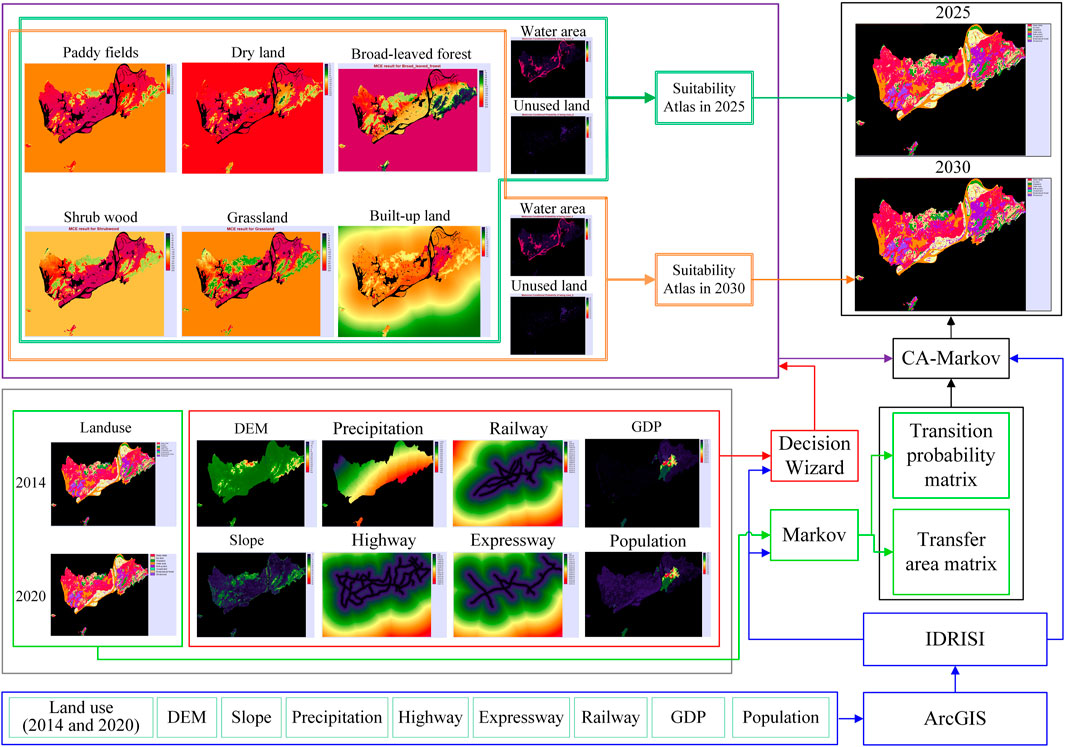
FIGURE 3. Simulation process of land use scenario in 2025 and 2030 with CA-Markov model in Tongling.
The most significant aspect of the LUC in Tongling from 1985 to 2020 is the decrease in cultivated land and the increase in built-up land. The area of built-up land in 2020 is three times larger than in 1985 (9.25 × 10³ hm2) (Figure 4). The increased area is derived from the conversion of 54.35% of cultivated land, 6.52% of forest and 4.8% of grassland. The built-up land continues to increase by 1.84 × 10⁴ hm2 in 2020–2030. 72.16% of the area comes from the conversion of cultivated land, and 21.26% and 9.76% of the area comes from forest and grassland, respectively. Generally, the LUC in Tongling from 1985 to 2030 is the conversion between cultivated and built-up land. By 2030, the proportion of cultivated land area in the city will decrease by 9.6%; the proportion of built-up land area will increase by 12.2%; the proportion of forest and grassland area will reduce by 1.4%; and the proportion of both water area and the unused land area will increase by 0.2%.
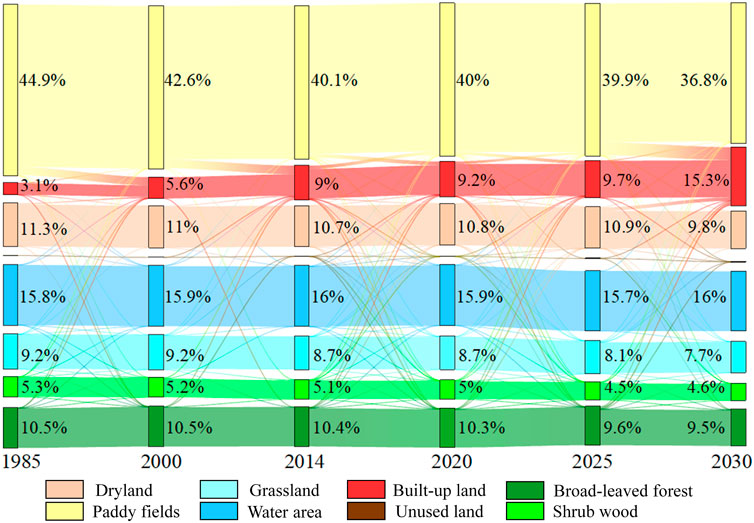
FIGURE 4. The Sankey map of LUC in Tongling from 1985 to 2030.
During 1985–2030, each period’s comprehensive land use dynamics fluctuated with an increasing trend. The largest change was observed during 2025–2030 (0.22%), indicating that this period has the most drastic LUC in Tongling (Figure 5). Regarding the individual land use types, all of them maintain an increasing trend except for the built-up and unused land. Built-up land decreased during 1985–2025 and shows an increase during 2025–2030. The change was the largest during 1985–2000 (5.59%) and the smallest during 2020–2025 (0.69%). These two periods are important as the built-up area shows a significant change. The unused land use type increased during 1985–2020 and decreased from 2020 to 2030. The maximum value (6.32%) was obtained during 2014–2020. The result indicates that unused land undergoes the most drastic change during this period, with a threefold increase in area (258.2 hm2).
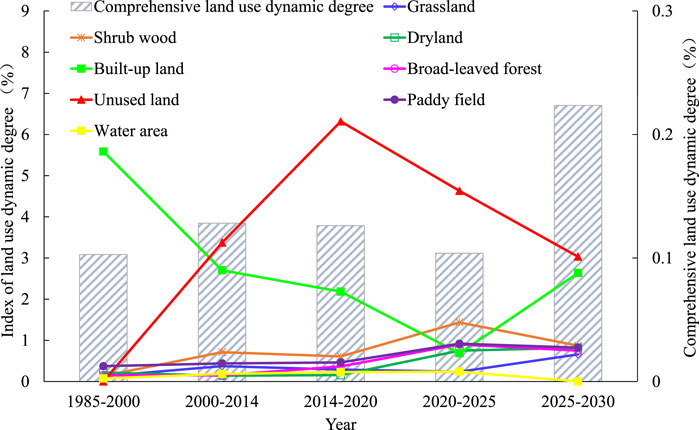
FIGURE 5. The dynamics degrees of different land use types in Tongling during 1985–2030.
The ESV in Tongling fluctuated from 1985 to 2030, reaching a maximum of 274.74 billion yuan in 2000. The ESV showed an increase of 5.08 billion yuan compared to 1985s (Table 3). The ESV decreased by 27 billion yuan during 2000–2030, with the largest decreases observed in grassland (28.21%), paddy fields (25.22%), and broad-leaved forests (20.96%). The total reduction in ESV from 1985 to 2030 is 15.91 billion yuan. The ESV of cultivated land decreased by 5.27 billion yuan (paddy fields accounted for 80.5%); the ESV of grassland decreased by 4.33 billion yuan; the ESV of forest decreased by 4.96 billion yuan (broad-leaved forest accounted for 65.77%); the ESV of water area decreased by 1.35 billion yuan, and unused land changed very little. In terms of ecosystem service types, from 1985 to 2030, except for the service value of water supply, which increased (266 billion yuan), the service value of other ecosystem types decreased (Figure 6). The hydrological regulation function of the ecosystem contributed the most to ESV, but the variation trends varied greatly. From 1985 to 2020, the ESV of all ecological services increased, and the ESV of hydrological regulation increased the most (2.21 billion yuan). The ESV reduction of hydrological regulation reached the largest during 2020–2030 (7.96 billion yuan) and 1985–2030 (5.75 billion yuan). From 1985 to 2030, changes in the area of paddy fields and built-up land have the most significant impact on ESV (Figure 7). The average impact degree of the paddy field is 12.14%. The average impact degree of built-up land is −42.35%, indicating that its area’s increase (decrease) will lead to a decrease (increase) in ESV. The average impacts of woodland and grassland on ESV are negative (−13.42% and −8.03%); The average impact of dryland on ESV is 1.36%, and the unused land has almost no impact.
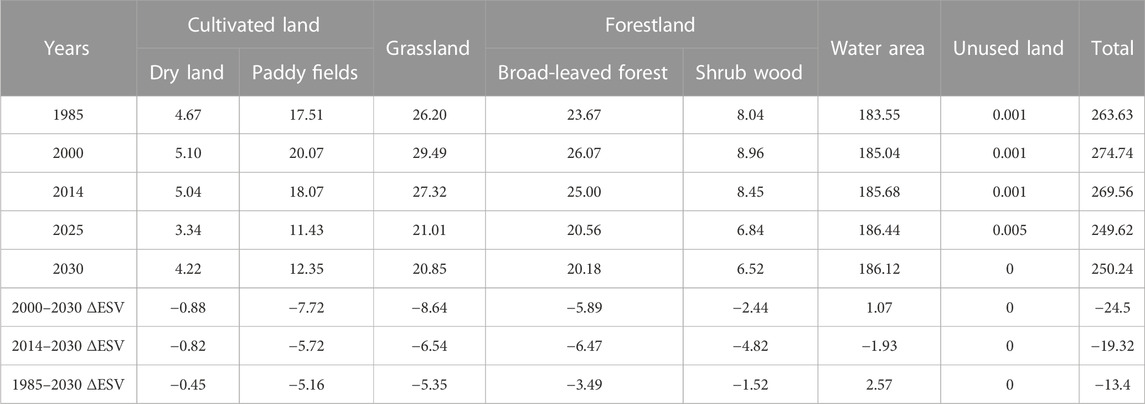
TABLE 3. Variations of ecological services value (ESV) of different land use types in Tongling (billion yuan).
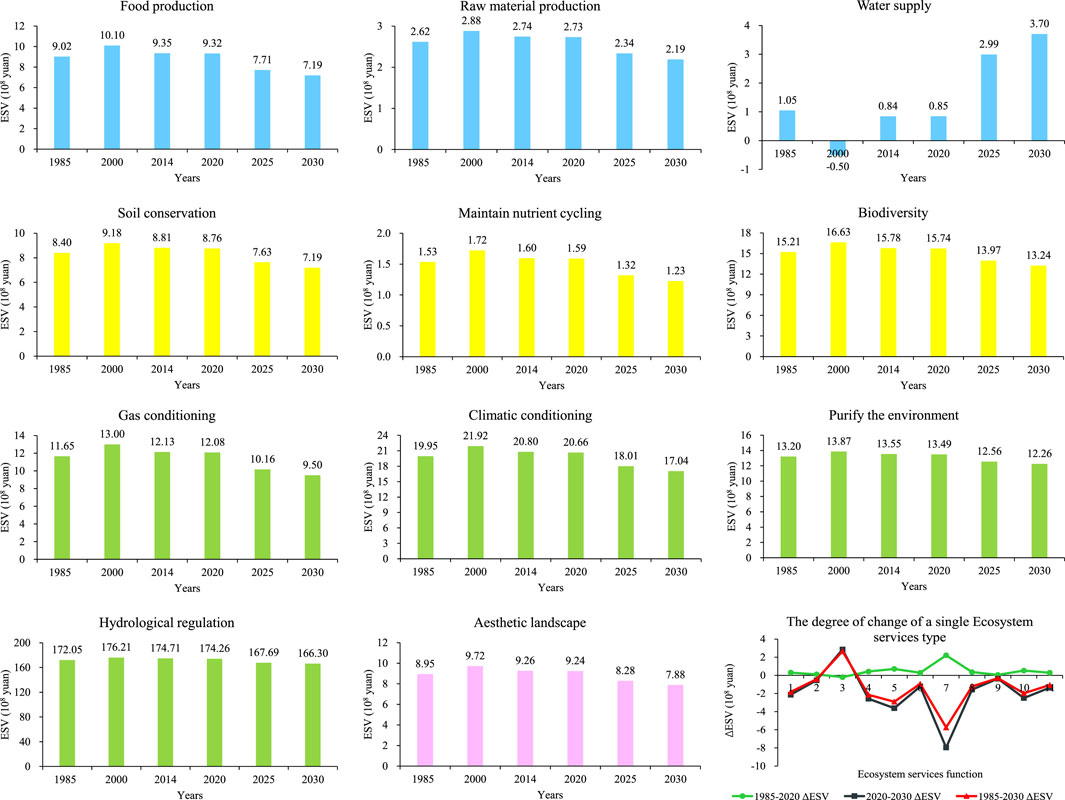
FIGURE 6. Variations of different types of ESV of Tongling. Note: Bar charts with the same color represent ecosystem service functions of the same classification level. Blue indicates the provisioning service function, including three secondary classification ecosystem service functions: food production, raw material production and water supply. Yellow indicates supporting service functions, including three secondary classification ecosystem services: soil conservation, maintaining nutrient cycling and biodiversity. Green indicates the regulation service function, including four secondary classification ecosystem services: gas conditioning, climatic conditioning, purifying the environment and hydrological regulation. Pink represents the aesthetic landscape in the cultural service function. The abscissa in the line chart represents the 11 ecosystem service functions. The serial order of the functions is as follows: food production, raw material production, water supply, gas conditioning, climatic conditioning, purifying the environment, hydrological regulation, soil conservation, maintaining nutrient cycling, biodiversity and aesthetic landscape.
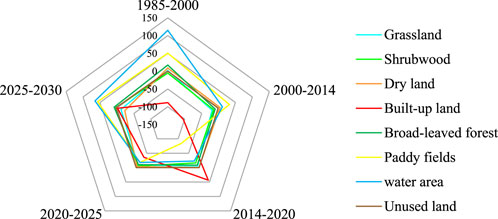
FIGURE 7. The influence degree from different land use types to ESV in Tongling.
From 1985 to 2030, the total addition of ESV in Tongling was 5.98 billion yuan. The total loss was 18.59 billion yuan, and a net loss of 12.6 billion yuan (Table 4). The largest contribution to the net loss came from the conversion of cultivated land and forest to built-up land, accounting for 20.03% and 19.04% of the total loss, respectively. The conversion of paddy fields to the water area and shrub forest to the broad-leaved forest are the main sources of value gain, accounting for 30.24% and 42.98% of the total gain in the region. During 1985–2000, the spatial distribution of ESV in Tongling was relatively uniform. With the rapid development of the social economy and the rapid increase in population, the flat right bank of the Yangtze River has been developed into urban centers, significantly increasing the built-up land area. The rapid urbanization forced the low-value areas of ESV to expand from the original sporadic distribution to a large city area. As a result, from 1985 to 2030, the area of ESV gain declined, and the value loss area increased. The loss ultimately led to an increase in the proportion of high-loss ranges. The city’s gain area decreased from 0.93% to 0.44%, and the proportion of loss area increased from 6.82% to 7.33% during 2020–2030 compared to 1985–2020 (Figure 8).
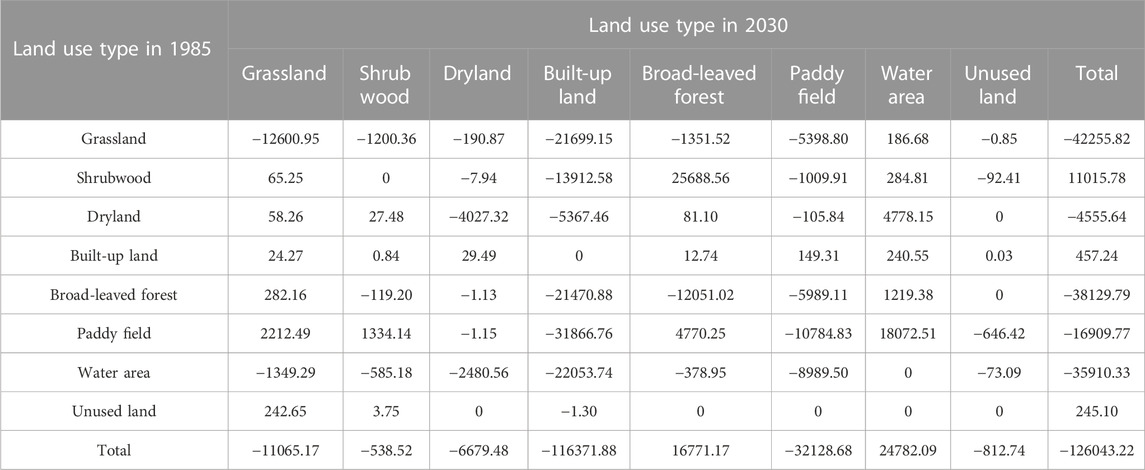
TABLE 4. Loss and profit matrix of ESV in Tongling during 1985–2030 (104 yuan).
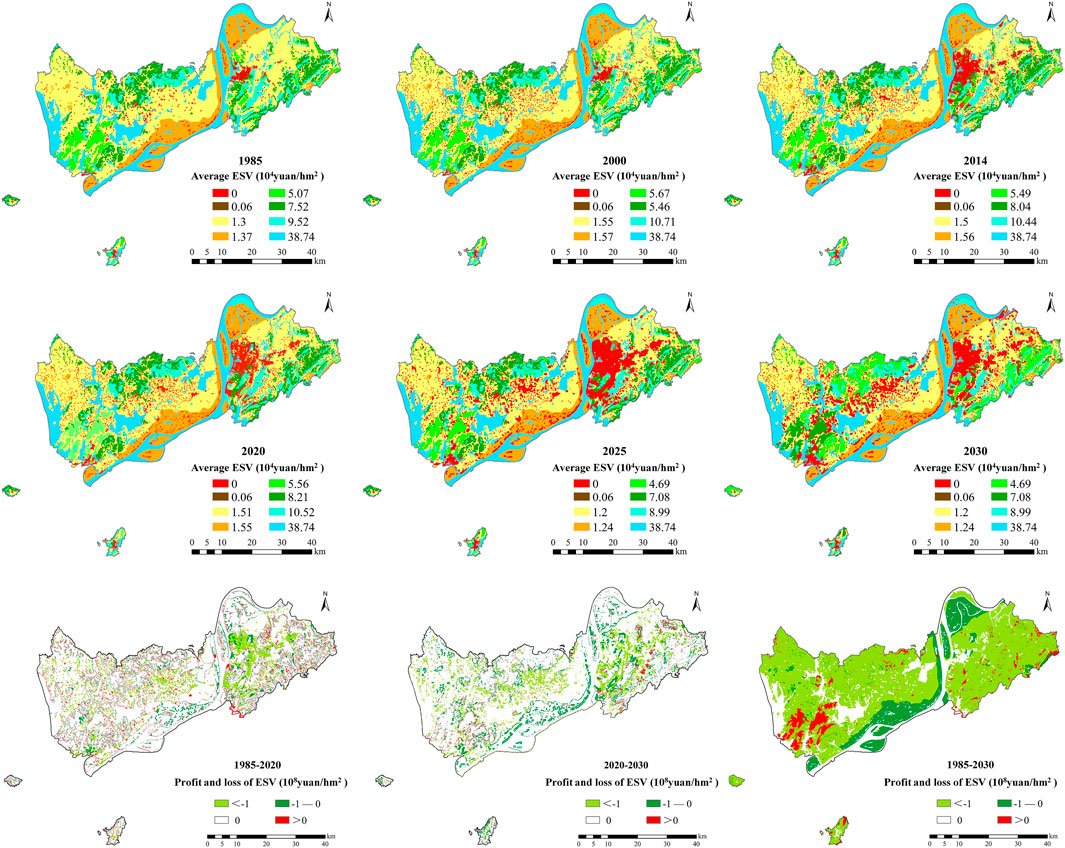
FIGURE 8. Spatial distribution pattern and the profit and loss of ESV in Tongling during 1985–2030.
The spatial autocorrelation analysis of ESV profit and loss shows that the global Moran’s I > 0, p < 0.001 in the three periods and the ESV profit and loss scatter points were mainly distributed in the first and third quadrants (Figure 9). It shows that the ESV profit and loss in Tongling has a high spatial correlation, relatively consistent distribution and high aggregation. For 1985–2020 and 2020–2030, the “high-high” and “low-low” aggregation areas of ESV profit and loss are more widely distributed. From 1985 to 2030, the ESV profit and loss of Tongling showed a “low-low” accumulation, mainly in the central urban areas. The “high-high” aggregation occurred in the water area.
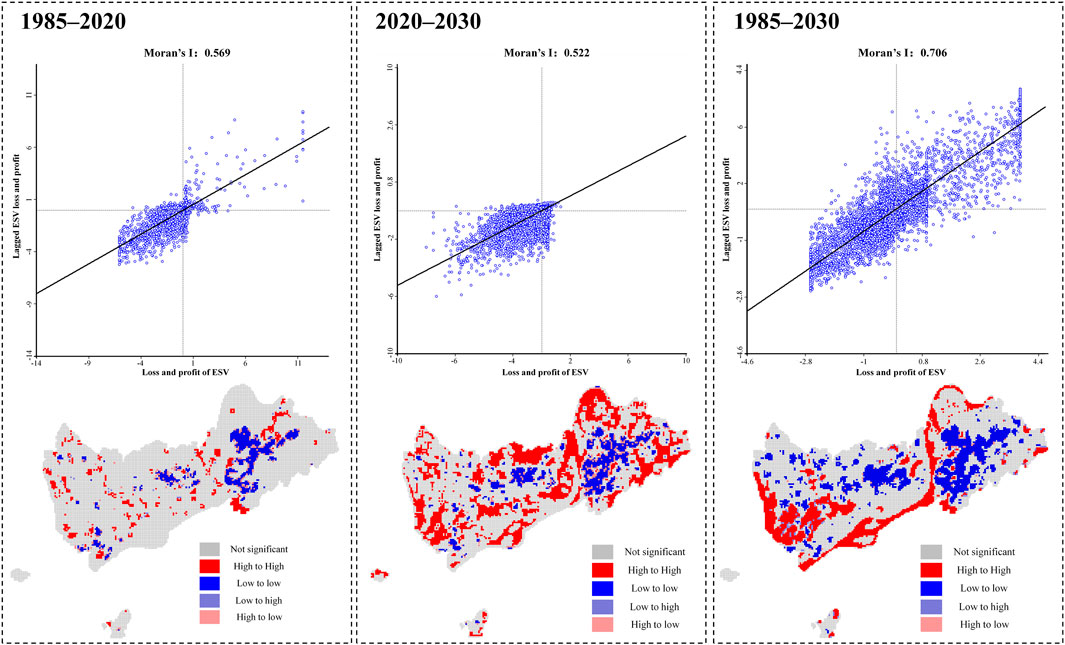
FIGURE 9. Moran scatter diagram and spatial autocorrelation map of ESV profit and loss in Tongling during 1985–2030.
In this study, the driving factors for LUC changes were selected from both natural and social attributes to predict the urban land use pattern of Tongling City in the next 5–10 years based on CA–Markov model. The driving factors in natural attributes include elevation, slope and precipitation. Related studies have shown that elevation and slope are crucial factors affecting the layout of cultivated land. As their values increase, they have a negative effect on cropland layout (Mansour et al., 2020). Precipitation affects woodland changes by influencing soil water content, transpiration, and air humidity (Venkatesh et al., 2022). The driving factors in social attributes include road information, population and GDP. They are important factors in limiting the development pattern and changing trends of urban spatial layout, especially in low and medium-density cities (Fu et al., 2018). Using the CA–Markov model, this study predicts an agricultural and forestry area of 2.03 × 10⁵ hm2 and a built-up land area of 4.87 × 10⁴ hm2 in Tongling by 2030. The prediction results are consistent with the provisions of the Tongling City Urban Master Plan (2016–2030) for agricultural and forestry area (1.94 × 10⁵ hm2) and built-up land area (4.9 × 10⁴ hm2). The finding shows that the selected drivers and the predicted land use layouts are reasonable.
This study found that in the past 35 years, the most significant change in Tongling City is the three-fold increase in the built-up land area, mainly from the transformation of cultivated land, forest land and grassland. Tongling is an important city in the Yangtze River Economic Belt. Since 2000, the efficiency of urban land use in the Yangtze River Economic Belt has increased annually. With rapid industrialization and urbanization, land use has also changed rapidly (Zhang and Sun, 2016). In particular, economic values were overly pursued in past land use development. All these factors have led to the rapidly expanding of the built-up land area. Scholars such as Cao et al. (2021), Yuan et al. (2018) and Wang et al. (2017) have verified that this problem exists in different scales and different cities. By forecasting the pattern of urban land use in the next 5–10 years, it is found that the area of built-up land will still increase, mainly due to the conversion of cultivated land. Although China’s population will decline slightly by 2021, China’s urbanization rate has been growing rapidly from 1990 to 2021, rising from 26.44% (1990) to 64.72% (2021) (Cao et al., 2021). A comprehensive analysis of the five levels of commercial resource agglomeration, urban hub, urban population activity, lifestyle diversity, and future plasticity found that Tongling is a city with relatively slow development in China (Zhang and Sun, 2016). Many factories and enterprises were introduced and developed to promote the development of Tongling City into a more prosperous city. In addition, relying on the golden waterway of the Yangtze River, from the perspective of sustainable development, it is proposed to build an urban green and ecological corridor to create a “win-win” pattern of ecology and economy (Zhai et al., 2021). As a result, the types of forest land and water area did not change much.
In this paper, the equivalent factor method is adopted. Usually, this method can only reflect the overall situation of the study area, and there is no way to reflect its change characteristics in space. Therefore, the value equivalent per unit area of cultivated land, forest land, and grassland types is corrected cell by cell using the NDVI in each period (Jia et al., 2021; Cao et al., 2021). The value equivalent in 2025 and 2030 is the average value equivalent of the corrected value equivalent of NDVI from 1985 to 2020. This method improves the accuracy of the results to a certain extent. This study found that the ESV of Tongling increased at the beginning and then decreased, reaching the maximum value in 2000 (274.74 billion yuan). Although the biggest change in land use from 1985 to 2000 was the conversion of paddy fields to built-up land, ESV did not decrease. The reason is the influence of ESV on value equivalent correction. The grid-by-grid NDVI values of cultivated land, grassland, and woodland in 2000 were all higher than those in 1985, especially for the forest. Even though the area decreased, the NDVI was higher (Chu et al., 2022). Therefore, reasonably determining the ESV correction coefficient is important in estimating the true response to ESV changes in the study area (Barrera et al., 2016; Fenta et al., 2020). After 2000, a large amount of cultivated land was transferred to built-up land, and the area of forest land also decreased to a certain extent, which greatly reduced the service capacity of the ecosystem.
According to statistics, by 2020, the forest coverage rate and afforestation area in Tongling City decreased by 8.59% and 6.56%, respectively, and the pressure on the ecological environment increased (Wu et al., 2017). These reductions eventually led to a year-on-year decrease in ESV, which is consistent with the continuous decrease in ESV caused by the development of most cities in China during the same period (Rong et al., 2017; Liu et al., 2021). From 1985 to 2030, the total addition of ESV in Tongling was 5.98 billion yuan, and the total loss was 1.859 billion yuan. The ESV profit and loss in Tongling are closely related to urban spatial structure and topography. The loss of ESV in the flat south bank of the Yangtze River has gradually increased with urbanization and cultivated land conversion into built-up land (Li et al., 2022). In the forest land types on the north bank of the Yangtze River, the ESV increased significantly due to the transformation from shrub wood to the broad-leaved forest. This transformation makes the ESV profit and loss show significant positive spatial autocorrelation characteristics on the global scale.
Studies have shown that woodlands and watersheds are important aspects of the ESV, illustrating the value of lucid waters and lush mountains for sustainable development (Qiao and Huang, 2022). Tongling is an important city along the Yangtze River that relies on the Yangtze River’s golden waterway to achieve a sustainable economy and ecological environment. In the future, the ecological environment protection of Tongling could focus on forest land and water areas. Under the background of decreasing cultivated land and increasing built-up land, the urban spatial layout needs to be optimized from three aspects.
1) The area of urban green space could be increased, and the interplanting structure of understory land could be optimized. It is recommended to develop urban ecological corridors considering the key water areas along the river.
2) The reduction of cultivated land will reduce the value of food production services. The optimum area of cultivated land could be strictly controlled. Furthermore, advanced technology could be introduced to increase grain yield to ensure food security further.
3) The effective utilization of existing built-up land area could be maximized and planned rationally. The occupation of water bodies and forests could be minimized. The industrial structure could also be adjusted to increase the city’s carrying capacity.
In this paper, advanced remote sensing observation combined with the CA–Markov model is used to predict the land use of Tongling city in the next 5–10 years. The method integrates the effects of natural, economic and social factors on LUC, and establishes a model of land use evolution under the combination of different influencing factors and different decision makers. It not only improves the accuracy of the simulation, but also the reasonableness of the land use development scenario prediction. The NDVI was incorporated to revise the ESV coefficients. It is the most widely applied method in China at present. Firstly, the method of accounting for NDVI is mature and the accuracy of remote sensing images used for calculation is high, which increases the accuracy of ESV accounting from the source. Secondly, compared with other vegetation indices, the NDVI can accurately reflect the intra- or inter-annual variation characteristics of vegetation cover on forest, grassland and cultivated land. Furthermore, the research results can provide a theoretical reference for the land use and ecological development of urban areas in the Yangtze River Economic Belt.
However, the limitations of the study that need to be pointed out include four aspects.
1) The main driving mechanisms of urban LUC include five aspects: urbanization, economic development, industrial structure, technological development and land marketization. More drivers need to be considered in forecasting future urban growth from the above five aspects, especially the adjustment of industrial structure and layout.
2) This study has uncertainties in predicting the change of the ESV equivalent in 2025 and 2030. The economic value in 2020 is used for the prediction, which may lead to an under- or overestimation of the ESV. In follow-up research, the future value equivalent of changes in ecosystem services will be carefully evaluated to improve the accuracy of ESV predictions.
3) This study summarizes the types of ecosystem services into four primary categories: provisioning, regulating, supporting and cultural, with a total of 11 secondary categories. But it narrowly defines the types of ecosystem services and lacks thinking about more types of the services, such as: wildlife habitat, healthy functioning soils, number of trees, etc.
4) Future land use pattern is predicted based on the current development trend only. We did not consider other land use scenarios. In follow-up research, we will set up various development scenarios. Further research on the process and mechanism of small-scale LUC could be undertaken to improve understanding of ESV, the trade-offs and the synergistic relationship of various ecosystem services.
This study considers actual situations to predict the land use scenario of the study area in the next 5–10 years and correct the ESV equivalent factor. Furthermore, the space-time distribution of LUC, ESV and ESV profit and loss are analyzed. The main conclusions are as follows.
1) During 1985–2030, the most obvious LUC in Tongling was the transformation of cultivated land to built-up land. The proportion of cultivated land decreased by 9.6%, built-up land increased by 12.2%, while other types of land did not change much. Regarding the dynamics of various land use types, the most pronounced changes are observed in built-up and unused lands.
2) During 1985–2030, the ESV of Tongling showed an increasing trend at the beginning and then decreased. It reached a maximum value of 274.74 billion yuan in 2000 and then decreased to 247.73 billion yuan in 2030. The overall ESV showed a downward trend. Regarding the individual ecosystem service functions, the hydrological regulation function greatly contributed to ESV changes.
3) During 1985–2030, the total addition of ESV in Tongling was 5.98 billion yuan; the total loss was 1.859 billion yuan, and the net loss was 1.26 billion yuan. The largest contribution to the net loss comes from converting cultivated land (20.03%) and forest (19.04%) to built-up land. The conversion of paddy fields into water areas and shrub forests to broad-leaved forests are the main sources of value gain, accounting for 30.24% and 42.98% of the total gain, respectively. From 1985 to 2030, the ESV profit showed fewer gain areas and more loss areas. The proportion of high-loss areas increased during this period as well. ESV profit and loss showed a significant spatial correlation on the global scale, showing a high degree of aggregation.
Publicly available datasets were analyzed in this study. This data can be found here: http://www.ngcc.cn/ngcc/html/1/index.html; https://tjj.tl.gov.cn/; https://zrzyhghj.tl.gov.cn/3227/3262/cxghj; http://www.cma.gov.cn/2011qxfw/2011qsjgx/; http://www.ngcc.cn/ngcc/html/1/index.html; http://www.resdc.cn/.
Conceptualization and methodology, FL; validation, HW; data curation, SL; writing—original draft, FL and HN; writing—review and editing, FL and TQ; supervision, SL; funding acquisition, TQ. All authors have read and agreed to the published version of the manuscript.
This study was supported by the National Science Fund Project (Grant No. 52130907).
We are very grateful to Dr. Sintayehu A. Abebe and Ms. Juan Chen for revising the English language of the article. We are also grateful to reviewers for their helpful comments on the manuscript.
The authors declare that the research was conducted in the absence of any commercial or financial relationships that could be construed as a potential conflict of interest.
All claims expressed in this article are solely those of the authors and do not necessarily represent those of their affiliated organizations, or those of the publisher, the editors and the reviewers. Any product that may be evaluated in this article, or claim that may be made by its manufacturer, is not guaranteed or endorsed by the publisher.
Aksoy, H., and Kaptan, S. (2021). Monitoring of land use/land cover changes using GIS and CA-markov modeling techniques: A study in northern Turkey. Environ. Monit. Assess. 193, 507. doi:10.1007/s10661-021-09281-x
Barrera, F. D. L., Rubio, P., and Banzhaf, E. (2016). The value of vegetation cover for ecosystem services in the suburban context. Urban. For. Urban. Gree. 16, 110–122. doi:10.1016/j.ufug.2016.02.003
Cao, G., Liu, Y., Song, X., Chen, Y., Zhang, Z., and Wu, D. (2021a). Study on the response mechanism of ecosystem services to urban land expansion by dynamic equivalent factor method: A case of wuhan, China. IOP Conf. Ser. Earth Environ. Sci. 651, 042039. doi:10.1088/1755-1315/651/4/042039
Cao, Y., Kong, L., Zhang, L., and Ouyang, Z. (2021b). The balance between economic development and ecosystem service value in the process of land urbanization: A case study of China’s land urbanization from 2000 to 2015. Land. use. Pol. 108, 105536. doi:10.1016/j.landusepol.2021.105536
Chasia, S., Olang, L. O., and Sitoki, L. (2023). Modelling of land-use/cover change trajectories in a transboundary catchment of the Sio-Malaba-Malakisi Region in East Africa using the CLUE-s model. Ecol. Model. 476, 110256. doi:10.1016/j.ecolmodel.2022.110256
Chatterjee, S., Dutta, S., Dutta, I., and Das, A. (2022). Ecosystem services change in response to land use land cover dynamics in Paschim Bardhaman District of West Bengal, India. RSASE 27, 100793. doi:10.1016/j.rsase.2022.100793
Chatterjee, U., and Majumdar, S. (2022). Impact of land use change and rapid urbanization on urban heat island in Kolkata city: A remote sensing based perspective. J. Urban Manag. 11 (1), 59–71. doi:10.1016/j.jum.2021.09.002
Chu, D., Shen, H. F., Guan, X. B., and Li, X. H. (2022). An L1-regularized variational approach for NDVI time-series reconstruction considering inter-annual seasonal similarity. Int. J. Appl. Earth. Obs. 114, 103021. doi:10.1016/j.jag.2022.103021
Clements, H. S., Vos, A. D., Bezerra, J. C., Coetzer, K., Maciejewski, K., Mograbi, P. J., et al. (2021). The relevance of ecosystem services to land reform policies: Insights from South Africa. Land. use. Pol. 100, 104939. doi:10.1016/j.landusepol.2020.104939
Costanza, R., D'Arge, R., De Groot, R. D., Farber, S., Grasso, M., Hannon, B., et al. (1998). The value of the world's ecosystem services and natural capital. Ecol. Econ. 25 (1), 3–15. doi:10.1016/S0921-8009(98)00020-2
Cunha, E. R. D., Santos, C. A. G., Silva, R. M. D., Bacani, V. M., and Pott, A. (2021). Future scenarios based on a CA-Markov land use and land cover simulation model for a tropical humid basin in the Cerrado/Atlantic forest ecotone of Brazil. Land. use. Pol. 101, 105141. doi:10.1016/j.landusepol.2020.105141
De Groot, R. S., Alkemade, R., Braat, L., Hein, L., and Willemen, L. (2010). Challenges in integrating the concept of ecosystem services and values in landscape planning, management and decision making. Ecol. Complex. 7, 260–272. doi:10.1016/j.ecocom.2009.10.006
Delphin, S., Escobedo, F. J., Abd-Elrahman, A., and Cropper, W. P. (2016). Urbanization as a land use change driver of forest ecosystem services. Land. use. Pol. 54, 188–199. doi:10.1016/j.landusepol.2016.02.006
Devkota, P., Dhakal, S., Shrestha, S., and Shrestha, U. B. (2023). Land use land cover changes in the major cities of Nepal from 1990 to 2020. Environ. Sustain. Indic. 17, 100227. doi:10.1016/j.indic.2023.100227
Dewan, A. M., and Yamaguchi, Y. (2009). Land use and land cover change in greater dhaka, Bangladesh: Using remote sensing to promote sustainable urbanization. Appl. Geogr. 29 (3), 390–401. doi:10.1016/j.apgeog.2008.12.005
Felipe-Lucia, M. R., Soliveres, S., Penone, C., Fischer, M., Allan, E., Boch, S., et al. (2020). Land-use intensity alters networks between biodiversity, ecosystem functions, and services. Proc. Natl. Acad. Sci. 117 (45), 28140–28149. doi:10.1073/pnas.2016210117
Fenta, A. A., Tsunekawa, A., Haregeweyn, N., Tsubo, M., Yasuda, H., Shimizu, K., et al. (2020). Cropland expansion outweighs the monetary effect of declining natural vegetation on ecosystem services in sub-Saharan Africa. Ecosyst. Serv. 45, 101154. doi:10.1016/j.ecoser.2020.101154
Fu, X., Wang, X. H., and Yang, Y. J. (2018). Deriving suitability factors for CA-Markov land use simulation model based on local historical data. J. Environ. Manage. 206, 10–19. doi:10.1016/j.jenvman.2017.10.012
Gao, L., Tao, F., Liu, R., Wang, Z., Leng, H., and Zhou, T. (2022). Multi-scenario simulation and ecological risk analysis of land use based on the PLUS model: A case study of nanjing. Sustain. Cities. Soc. 85, 104055. doi:10.1016/j.scs.2022.104055
Gao, X., Shen, J. Q., He, W. J., Zhao, X., Li, Z. C., Hu, W. F., et al. (2021b). Spatial-temporal analysis of ecosystem services value and research on ecological compensation in Taihu Lake Basin of Jiangsu Province in China from 2005 to 2018. J. Clean. Prod. 317, 128241. doi:10.1016/j.jclepro.2021.128241
Gao, X., Wang, J., Li, C. X., Shen, W. N., Song, Z. Y., Nie, C. J., et al. (2021a). Land use change simulation and spatial analysis of ecosystem service value in Shijiazhuang under multi-scenarios. Environ. Sci. Pollut. Res. 28, 31043–31058. doi:10.1007/s11356-021-12826-9
Gashaw, T., Tulu, T., Argaw, M., Worqlul, A. W., TolessaKindu, T., M., and Kindu, M. (2018). Estimating the impacts of land use/land cover changes on Ecosystem Service Values: The case of the Andassa watershed in the Upper Blue Nile basin of Ethiopia. Ecosyst. Serv. 31, 219–228. doi:10.1016/j.ecoser.2018.05.001
He, F., Jin, J., Zhang, H., and Yuan, L. (2021). The change of ecological service value and the promotion mode of ecological function in mountain development using InVEST model. Arab. J. Geosci. 14, 510. doi:10.1007/s12517-021-06869-y
Himes-Cornell, A., Pendleton, L., and Atiyah, P. (2018). Valuing ecosystem services from blue forests: A systematic review of the valuation of salt marshes, sea grass beds and mangrove forests. Ecosyst. Serv. 30, 36–48. doi:10.1016/j.ecoser.2018.01.006
Houtven, G. V., Phelan, J., Clark, C., Sabo, R. D., Buckley, J., Thomas, R. Q., et al. (2019). Nitrogen deposition and climate change effects on tree species composition and ecosystem services for a forest cohort. Ecol. Monogr. 89 (2), 13–45. doi:10.1002/ecm.1345
Hu, M. M., Li, Z. T., Wang, Y. F., Jiao, M. Y., Li, M., and Xia, B. C. (2019). Spatio-temporal changes in ecosystem service value in response to land-use/cover changes in the Pearl River Delta. Resour. Conserv. Recy. 149, 106–114. doi:10.1016/j.resconrec.2019.05.032
Hu, S., Yang, Y., Li, A., Liu, K., Mi, C., and Shi, R. (2022). Integrating ecosystem services into assessments of sustainable development goals: A case study of the beijing-tianjin-hebei region, China. Front. Environ. Sci. 10, 897792. doi:10.3389/fenvs.2022.897792
Jia, Y., Liu, Y., and Zhang, S. (2021). Evaluation of Agricultural Ecosystem Service Value in Arid and Semiarid Regions of Northwest China Based on the Equivalent Factor Method. Environ. Process 8 (2), 713–727. doi:10.1007/s40710-021-00514-2
Kindu, M., Schneider, T., Teketay, D., and Knoke, T. (2016). Changes of ecosystem service values in response to land use/land cover dynamics in Munessa-Shashemene landscape of the Ethiopian highlands. Sci. Total Environ. 547, 137–147. doi:10.1016/j.scitotenv.2015.12.127
Kiziridis, D. A., Mastrogianni, A., Pleniou, M., Tsiftsis, S., Xystrakis, F., and Tsiripidis, L. (2023). Improving the predictive performance of CLUE-S by extending demand to land transitions: The trans-CLUE-S model. Ecol. Model. 478, 110307. doi:10.1016/j.ecolmodel.2023.110307
Kubiszewski, I., Costanza, R., Anderson, S., and Sutton, P. (2017). The future value of ecosystem services: Global scenarios and national implications. Ecosyst. Serv. 26, 289–301. doi:10.1016/j.ecoser.2017.05.004
Lei, J. R., Chen, Z. Z., Chen, X. H., Li, W. L., and Wu, T. T. (2020). Spatio⁃temporal changes of land use and ecosystem services value in Hainan Island from 1980 to 2018. Acta. Ecol. Sin. 40 (14), 4760–4773. doi:10.5846/stxb201907261580
Li, X., Fu, J. Y., Jiang, D., Lin, G., and Cao, C. L. (2022a). Land use optimization in Ningbo City with a coupled GA and PLUS model. J. Clean. Prod. 375, 134004. doi:10.1016/j.jclepro.2022.134004
Li, X. M., Wang, Y., and Song, Y. (2022b). Unraveling land system vulnerability to rapid urbanization: An indicator-based vulnerability assessment for Wuhan, China. Environ. Res. 211, 112981. doi:10.1016/j.envres.2022.112981
Liang, X. L., Liu, X. P., Li, X., Chen, Y. M., Tian, H., and Yao, Y. (2018). Delineating multi-scenario urban growth boundaries with a CA-based FLUS model and morphological method. Landsc. Urban. Plan. 177, 47–63. doi:10.1016/j.landurbplan.2018.04.016
Ling, H. E., Chao, L. I., and Jia, Q. (2016). Profit and loss analysis on ecosystem services value based on land use change in coastal land. Ecol. Econ. 25 (8), 256–261. doi:10.3969/j.issn.1002-6819.2009.08.046
Liu, P. J., Hu, Y. C., and Jia, W. T. (2021). Land use optimization research based on FLUS model and ecosystem services–setting Jinan City as an example. Urban. Clim. 40, 100984. doi:10.1016/j.uclim.2021.100984
Mansour, S., Al-Belushi, M., and Al-Awadhi, T. (2020). Monitoring land use and land cover changes in the mountainous cities of Oman using GIS and CA-Markov modelling techniques. Land. use. Pol. 91, 104414. doi:10.1016/j.landusepol.2019.104414
Matlhodi, B., Kenabatho, P. K., Parida, B. P., and Maphanyane, J. G. (2021). Analysis of the future land use LandCover changes in the gaborone dam catchment using CA-markov model: Implications on water resources. Remote. Sens. 13, 2427. doi:10.3390/rs13132427
Nelson, E., Sander, H., Hawthorne, P., Conte, M., Ennaanay, D., Wolny, S., et al. (2010). Projecting global land-use change and its effect on ecosystem service provision and biodiversity with simple models. PloS One 5, e14327. doi:10.1371/journal.pone.0014327
Peng, K., Jiang, W., Ling, Z., Hou, P., and Deng, Y. (2021). Evaluating the potential impacts of land use changes on ecosystem service value under multiple scenarios in support of sdg reporting: A case study of the wuhan urban agglomeration. J. Clean. Prod. 307, 127321. doi:10.1016/j.jclepro.2021.127321
Pueffel, C., Haase, D., and Priess, J. A. (2018). Mapping ecosystem services on brownfields in Leipzig, Germany. Ecosyst. Serv. 30, 73–85. doi:10.1016/j.ecoser.2018.01.011
Qiao, W. Y., and Huang, X. J. (2022). The impact of land urbanization on ecosystem health in the Yangtze River Delta urban agglomerations, China. Cities 130, 103981. doi:10.1016/j.cities.2022.103981
Rimal, B., Sharma, R., Kunwar, R., Keshtkar, H., Stork, N. E., Rijal, S., et al. (2019). Effects of land use and land cover change on ecosystem services in the Koshi River Basin, Eastern Nepal. Ecosyst. Serv. 38, 100963. doi:10.1016/j.ecoser.2019.100963
Rong, Y., Li, C., Xu, C., and Yan, Y. (2017). Ecosystem service values and spatial differentiation changes during urbanization: A case study of Huanghua City. Chinese Journal of Ecology 36 (5), 1374–1381. doi:10.13292/j.1000-4890.201705.001
Sannigrahi, S., Bhatt, S., Rahmat, S., Paul, S. K., and Sen, S. (2018). Estimating global ecosystem service values and its response to land surface dynamics during 1995–2015. J. Environ. Manage. 223, 115–131. doi:10.1016/j.jenvman.2018.05.091
Santos-Martín, F., Zorrilla-Miras, P., Palomo, I., Montes, C., Benayas, J., and Maes, J. (2019). Protecting nature is necessary but not sufficient for conserving ecosystem services: A comprehensive assessment along a gradient of land-use intensity in Spain. Ecosyst. Serv. 35, 43–51. doi:10.1016/j.ecoser.2018.11.006
Schirpke, U., Ebner, M., Pritsch, H., Fontana, V., and Kurmayer, R. (2021). Quantifying ecosystem services of high mountain lakes across different socio-ecological contexts. Sustainability 13, 6051–6122. doi:10.3390/su13116051
Schirpke, U., Tscholl, S., and Tasser, E. (2020). Spatio-temporal changes in ecosystem service values: Effects of land-use changes from past to future (1860–2100). J. Environ. Manage. 272, 111068. doi:10.1016/j.jenvman.2020.111068
Sonter, L. J., Johnson, J. A., Nicholson, C. C., Richardson, L. L., Watson, K. B., and Ricketts, T. H. (2017). Multi-site interactions: Understanding the offsite impacts of land use change on the use and supply of ecosystem services. Ecosyst. Serv. 23, 158–164. doi:10.1016/j.ecoser.2016.12.012
Sun, Y. X., Liu, S. L., Shi, F. N., An, Y., Li, M. Q., and Liu, Y. X. (2020). Spatio-temporal variations and coupling of human activity intensity and ecosystem services based on the four-quadrant model on the Qinghai-Tibet Plateau. Sci. Total Environ. 743, 140721. doi:10.1016/j.scitotenv.2020.140721
Syrbe, R. U., Schorcht, M., Grunewald, K., and Meinel, G. (2018). Indicators for a nationwide monitoring of ecosystem services in Germany exemplified by the mitigation of soil erosion by water. Ecol. Indic. 94, 46–54. doi:10.1016/j.ecolind.2017.05.035
Tammi, I., Mustajärvi, K., and Rasinmäki, J. (2017). Integrating spatial valuation of ecosystem services into regional planning and development. Ecosyst. Serv. 26, 329–344. doi:10.1016/j.ecoser.2016.11.008
Vallecillo, S., La Notte, A., Zulian, G., Ferrini, S., and Maes, J. (2019). Ecosystem services accounts: Valuing the actual flow of nature-based recreation from ecosystems to people. Ecol. Model. 392, 196–211. doi:10.1016/j.ecolmodel.2018.09.023
Venkatesh, K., John, R., Chen, J. Q., Xiao, J. F., Amirkhiz, R. G., Giannico, V., et al. (2022). Optimal ranges of social-environmental drivers and their impacts on vegetation dynamics in Kazakhstan. Sci. Total Environ. 847, 157562. doi:10.1016/j.scitotenv.2022.157562
Wang, Q., and Wang, H. J. (2022). Correction to: An integrated approach of logistic‑MCE‑CA‑Markov to predict the land use structure and their micro‑spatial characteristics analysis in Wuhan metropolitan area, Central China. Environ. Sci. Pollut. Res. 29 (20), 30054–30053. doi:10.1007/s11356-022-18735-9
Wang, X., Dong, X., Liu, H., Wei, H., Fan, W., Lu, N., et al. (2017). Linking land use change, ecosystem services and human well-being: A case study of the manas river basin of xinjiang, China. Ecosyst. Serv. 27, 113–123. doi:10.1016/j.ecoser.2017.08.013
Wang, X. L., and Nuppenau, E. A. (2021). Modelling payments for ecosystem services for solving future water conflicts at spatial scales: The Okavango River Basin example. Ecol. Econ. 184, 106982. doi:10.1016/j.ecolecon.2021.106982
Wu, J. J., and He, R. H. (2017). Coordination degree between land use and eco-environment in Tongling City of Anhui Province. Journal of Yunnan Agricultural University (Social Science) 11 (5), 29–34. doi:10.3969/j.issn.1004-390X(s).2017.05.006
Xiang, M., Yang, J., Li, W., Song, Y., Wang, C., Liu, Y., et al. (2022). Spatiotemporal evolution and simulation prediction of ecosystem service function in the western sichuan plateau based on land use changes. Front. Environ. Sci. 10, 890580. doi:10.3389/fenvs.2022.890580
Xie, G. D., Lu, C. X., Leng, Y. F., Zheng, D., and Li, S. C. (2003). Ecological assets valuation of the Tibetan Plateau. J. Nat. Resour. 18 (2), 189–196. doi:10.11849/zrzyxb.2003.02.010
Xie, G. D., Zhang, C. X., Zhang, L. M., Chen, W. H., and Li, S. M. (2015). Improvement of the evaluation method for ecosystem service value based on per unit area. J. Nat. Resour. 12, 1243–1254. doi:10.11849/zrzyxb.2015.08.001
Yuan, Y., Wu, S., Yu, Y., Tong, G., Mo, L., Yan, D., et al. (2018). Spatiotemporal interaction between ecosystem services and urbanization: Case study of Nanjing City, China. Ecol. Indic. 95, 917–929. doi:10.1016/jecolind.2018.07.056
Zhai, H., Lv, C., Liu, W., Yang, C., Fan, D., Wang, Z., et al. (2021). Understanding spatio-temporal patterns of land use/land cover change under urbanization in Wuhan, China, 2000–2019. Remote Sens. 13 (16), 3331. doi:10.3390/rs13163331
Zhang, G. Y., and Sun, W. (2016). Research on the practice path of crossing river development in tongling city based on the adjustment of regionalization. China Int. Bus. 10, 36–40. doi:10.19516/j.cnki.10-1438/f.2016.21.013
Zhang, H., Yang, Q., Zhang, H., Zhou, L., and Chen, H. (2021). Optimization of land use based on the source and sink landscape of ecosystem services: A case study of fengdu county in the three gorges reservoir area, China. Land 10, 1242. doi:10.3390/land10111242
Zhang, Y. Q., Liu, S. L., Hou, X. Y., Cheng, F. Y., and Shen, Z. Y. (2019). Landscape- and climate change-induced hydrological alterations in the typically urbanized Beiyun River basin, Beijing, China. Stoch. Environ. Res. Risk. Assess. 33, 149–168. doi:10.1007/s00477-018-1628-8
Keywords: land use change, ecosystem service value, CA-Markov, characteristics, ESV profit and loss
Citation: Liu F, Qin T, Liu S, Wang H and Nie H (2023) Spatial response of urban land use change and ecosystem service value in the lower reaches of the Yangtze River: A case study of Tongling, China. Front. Environ. Sci. 11:1137442. doi: 10.3389/fenvs.2023.1137442
Received: 04 January 2023; Accepted: 14 April 2023;
Published: 03 May 2023.
Edited by:
Seth Munson, U.S. Geological Survey, United StatesReviewed by:
Xiankun Yang, Guangzhou University, ChinaCopyright © 2023 Liu, Qin, Liu, Wang and Nie. This is an open-access article distributed under the terms of the Creative Commons Attribution License (CC BY). The use, distribution or reproduction in other forums is permitted, provided the original author(s) and the copyright owner(s) are credited and that the original publication in this journal is cited, in accordance with accepted academic practice. No use, distribution or reproduction is permitted which does not comply with these terms.
*Correspondence: Tianling Qin, cWludGxAaXdoci5jb20=
Disclaimer: All claims expressed in this article are solely those of the authors and do not necessarily represent those of their affiliated organizations, or those of the publisher, the editors and the reviewers. Any product that may be evaluated in this article or claim that may be made by its manufacturer is not guaranteed or endorsed by the publisher.
Research integrity at Frontiers
Learn more about the work of our research integrity team to safeguard the quality of each article we publish.