 Yuanxin Xu
 Haiyan Guo1,2*
 Rui Sun
- 1Sichuan Climate Center, Laboratory of Climate Resources Application, Sichuan Meteorological Administration, Chengdu, Sichuan, China
- 2Heavy Rain and Drought-Flood Disasters in Plateau and Basin Key Laboratory of Sichuan Province, Chengdu, Sichuan, China
- 3Research Center of Mountain Development, Institute of Mountain Hazards and Environment, Chinese Academy of Science, Chengdu, Sichuan, China
Wildfire events in southwestern China resulted in catastrophic loss of property and human life, and the localized wildfire risks show differentiated trends under global warming scenarios. In the case of quantitating climate impacts and localizing wildfire risks, synthesized assessments of wildfire risks of high-incident areas in southwestern China are established and mapped in this article, constituted by three essential elements: hazard, vulnerability, and disaster prevention/mitigation capacity. The hazard group includes vegetation ignitability and fire spreading related to climate and topography factors. Public and economic characteristic elements belong to the vulnerability and disaster prevention/mitigation capacity group based on their functions and influences on wildfire events. Each aspect and group are rated by the historical wildfire site records and weighted by the entropy weight method and analytic hierarchy process. Assessments indicate that most very high wildfire risk girds are distributed in the west of 103°E and the north of 28°N, covering an area of over 26,500 km2, mainly in low-altitude suburban regions in basins and valleys with high climate hazards. The highly localized wildfire risk maps specified both stresses of fire prevention/mitigation in each grid cell and general spatial patterns of wildfire risks, thereby enhancing the understanding of both current and future patterns of wildfire risks and thus helping improve suppression and prevention policies.
1 Introduction
Under the background of global warming, exposure to wildfire is a growing public health concern worldwide (Flannigan and Harrington, 1988; Flannigan et al., 2000; Ozturk et al., 2010; Diffenbaugh et al., 2017; Hallema et al., 2018; AghaKouchak et al., 2020). In southwestern China, frequency, severity, and extent of wildfire events have increased with the warming and drying trends over this region (Sun et al., 2014). The population growth and expansion of inhabited areas also amplify the risks and vulnerabilities to wildfires (Jolly et al., 2015; Gong et al., 2019a; Artés et al., 2019; Gong et al., 2019b). During 2004–2020, the total burnt areas in the high-wildfire frequency region of southwestern China increased at a rate of nearly 2 km2 per year (Wang et al., 2018), while the annual period of wildfire, referred to as “fire weather season,” extends, with an earlier beginning date and a delayed ending date of wildfire events. Growing risks and vulnerabilities to wildfire result in unprecedented damage and public health problems in both the southwestern region and the whole of China.
Recent evidence suggests that the critical inducing factors of wildfires in southwestern China aim to increase disaster risks under a changing climate (IPCC, 2012; Ma, 2020; Zhao et al., 2021). As the most variable and most prominent drivers of regional wildfires, warmer and dryer weather conditions have led to more severe fires in recent years (Petoukhov et al., 2018; Ball et al., 2021). Since the 1970s, the temperature in southwestern China has been rising at the rate of 0.1°C–0.3°C per decade, and high-latitude areas have become warmer. Precipitation reduces at the rate of 9.4 mm per decade, with an increase in maximum continuous rain-free days, and related humidity decreases at the rate of 0.4% per decade, especially after 2010 (Ma, 2020; Zhao et al., 2021; Zhao et al., 2022). The increase in the number of climate extremes, like heat waves and aridity, also affect wildfire frequency and severity (Gao et al., 2017; Taufik et al., 2017; Wu et al., 2017).
Risk mappings are effective ways to manage natural disaster risks (Jaiswal et al., 2002; Pan et al., 2016; Pickell et al., 2017; Shi and Touge, 2022). Extensive research has shown that wildfire risk mappings can point out locations where a fire is likely to start and locations which enable easy fire spreading, thereby providing precise assessments of wildfire disasters and decisions on solution methods (Goetz et al., 2006; McKenney et al., 2008; Hijmans et al., 2010). Previous research on wildfire risk mapping mainly focuses on topography and vegetation factors (Bessie and Johnson, 1995; Jaiswal et al., 2002; Gralewicz et al., 2012; Collins et al., 2013; Salaheddine et al., 2017) but does not consider climate factors, especially spatial patterns of climate indices, in much detail.
The specific objective of this study is to provide a comprehensive and strict wildfire risk mapping in the areas with exceptionally high wildfire rates in southwestern China. The basic theoretical framework of risk assessment applied in this manuscript follows the natural disaster risk-based zonation method. The analysis of wildfire hazard refers to the probability distribution assessment of natural characteristics of the wildfire-formative environment and inducing factors, and vulnerability refers to the likelihood and severity of wildfire damage (Flannigan et al., 2000). Prevention/mitigation capacities represent the ability to avoid and mitigate possible wildfire damage. The risk of wildfire is the synthesis of hazard, vulnerability, and prevention/mitigation capacities, representing the levels of wildfire damage probability of specific space units. The multi-factor complete analysis method includes the assessments and interactions of climate and environmental inducing factors, vulnerabilities, and disaster prevention/mitigation capacities in this area. The paper is organized as follows: Section 2 provides method description. Section 3 deals with the factors responsible for wildfire risks, vulnerability, and disaster prevention. Section 4 describes each factor group’s weighting processing and mapping results. Section 5 deals with relevant discussion and conclusion.
2 Data and methods
2.1 Study area
The study area is the wildfire high-incident areas in southwestern China, at 25.3°N∼29°N, 99°E∼104°E, covering an area of 120,440 km2, neighboring the Tibet Plateau. Topographic features vary from the western mountain plateau to the eastern valley plain, which stretches over 39 county-level administrative units. Altitudes decline from west to east, and the highest point is located in the northeastern part of the study area with an altitude of 5,958 m (Figure 1). Climate data from 36 gauges are applied in this study, which are evenly distributed in the study area. According to the climatic regionalization of China, the four dominant climatic regions over the study area are the southern subtropical sub-humid zone, the northern and central subtropical humid zones, and the highland temperate humid-sub-humid zone. Most of the study area falls in the middle of the Jinsha River valley, featuring four obscure seasons and clear rainy and dry seasons, abundant sunshine, and intense evaporation; the annual evaporation in this region reaches three times the annual precipitation; 92% of the precipitation in this region falls from June to October, namely, the rainy season. March–May is the driest period in the year, with an average relative humidity of less than 40%.
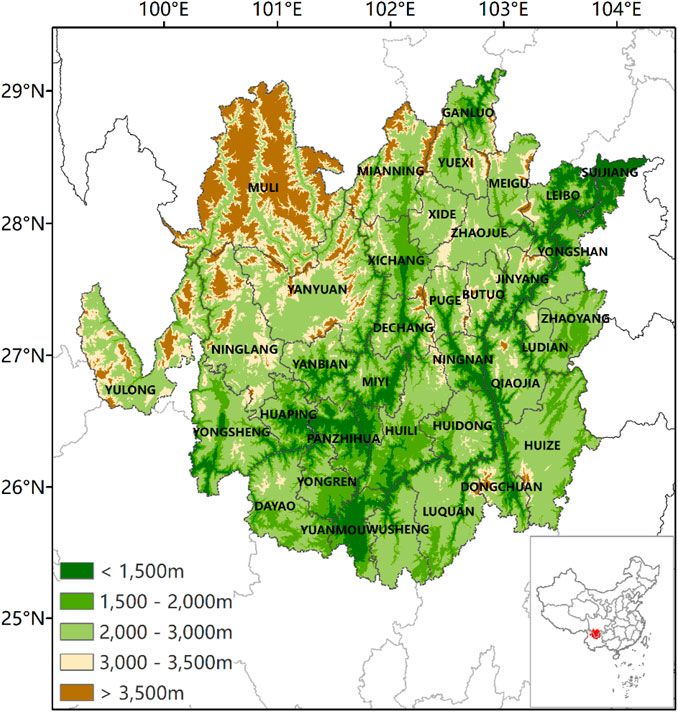
FIGURE 1. Topography and location of the study area.
The study area belongs to the southwestern forest zone. The vegetation in the sunny slope regions is mainly Pinus densata and Chinese pine (Pinus tabuliformis) while in the shady slope and gorge regions is theropencedrymions constituted by hemlocks (Tsuga chinensis), Acer spp., and Betula spp. Subalpine coniferous forests are also distributed in the high-latitude area.
2.2 Data sources
All the climate models are resolved using a 90 m*90 m digital elevation model of the study area, which is constructed using the 2000 global version 4 SRTM 90 m digital elevation data downloaded from the National Tibetan Plateau Data Center.
The observation datasets of daily temperature, precipitation, wind speed, and relative humidity for the period 1981–2021 are provided by the Sichuan Climate Center and Yunnan Climate Center, referring to 36 meteorological stations.
The land cover dataset is obtained from FROM-GLC (Finer Resolution Observation and Monitoring of Global Land Cover) which produces the first 30 m resolution global land cover maps using Landsat Thematic Mapper (TM) and Enhanced Thematic Mapper Plus (ETM+) data (http://data.ess.tsinghua.edu.cn/). The data sets of population density, settlements and road networks are provided by the Geographic Data Sharing Infrastructure of Peking University (http://geodata.pku.edu.cn).
2.3 Interpolation
Partial thin plate splines implemented in ANUSPLIN are applied for smoothing in this study (Hutchinson, 1991; Hutchinson, 1993; Hutchinson, 1995; Hutchinson, 2004). ANUSPLIN is a suite of programs that employs a multi-dimensional Laplacian partial thin plate smoothing spline method. The equation of the theoretical statistic model is listed as follows:
where
In Eq. 1, the function of
where
2.4 Weighting functions
The entropy weight method estimates the weighting coefficient based on the variability of indices. For a specified index, the less the information entropy (
If there are
If
If
The information entropy of index
Then, the entropy weight
2.5 Weighting coefficients
The synthesized wildfire risk mapping over the study area integrates weighted elements of hazard, vulnerability, and prevention/mitigation capacity. Each aspect is sub-superposed by weighted factors. The entropy weight method is applied when there is a linear correlation between a factor and the related risk element. Otherwise, an analytic hierarchy process is employed. Once the weighting results pass the consistency check, all the factors are rated on a scale of 1–5 except the factor of vegetation type (rated on a scale of 1–4). The weighting coefficients of chosen factors and risk mapping elements are listed in Table 1.
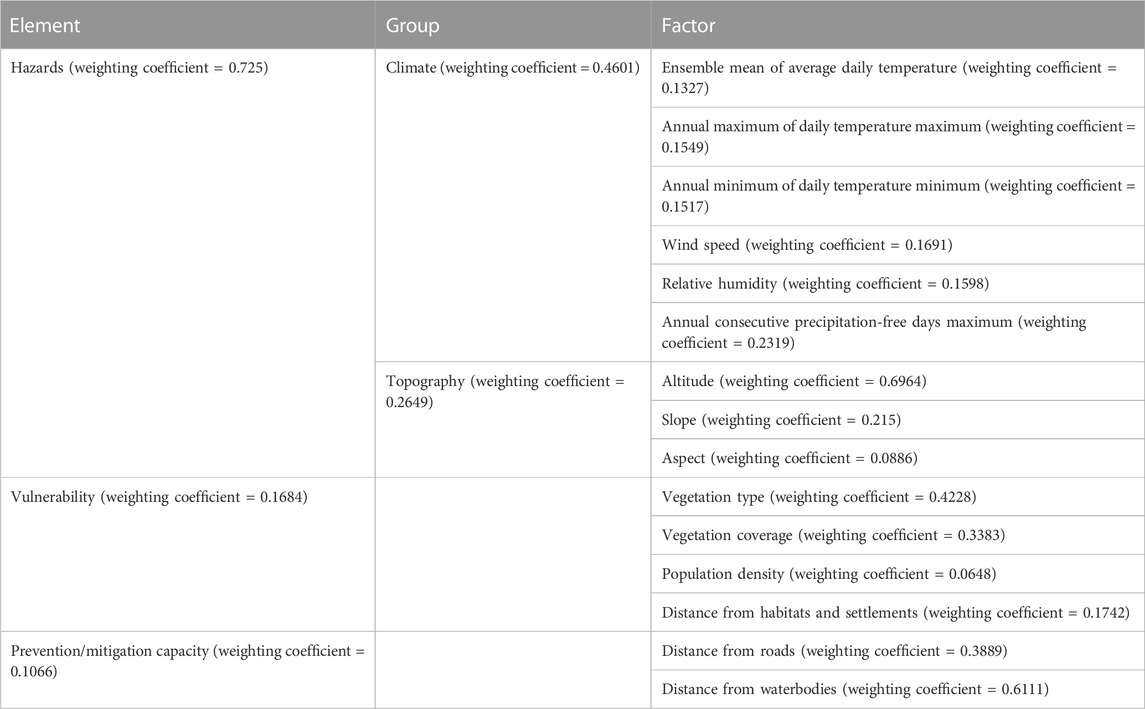
TABLE 1. Weights assigned to factors and groups for wildfire risk modeling.
The weighting result indicates that the dominant factors are altitude and annual consecutive precipitation-free days maximum, followed by relative humidity, wind speed, and vegetation coverage. The factor rating of altitude reflects both human activities and vegetation inflammability. Factors that point to vegetation desiccation and wildfire spreading also play essential roles in risk mapping. Prevention/mitigation capacity holds the lowest weight due to its uncertainty and high dependency on public infrastructures in actual situations.
2.6 Synthesized risk assessment model
According to the forming and spreading conditions of wildfire and hazard criticality assessment methodology, the synthesized assessment model is comprised of three main modules representing the core of the wildfire risk assessment: the hazard (comprising the climate group and topology group), vulnerability, and prevention modules. The modules and each element inside are composed based on the integrated weight linear method. The synthesized wildfire risk assessment model of southwestern China is listed as follows (all of the elements are normalized):
Hazard module: H = 0.4601*(0.1327* ensemble mean of daily temperature average + 0.1549* annual maximum of daily temperature maximum + 0.1517* annual minimum of daily temperature minimum + 0.1691* wind speed − 0.1598* relative humidity + 0.2319* annual consecutive precipitation-free days maximum) + 0.2649*(0.6964* altitude + 0.215* slope + 0.0886* aspect).
Vulnerability module: V = 0.4228* vegetation type + 0.3383* vegetation coverage + 0.0648* population density.
Prevention/mitigation capacity module: p = 0.1742* distance from habitats and settlements + 0.3889* distance from roads + 0.6111* distance from waterbodies.
The synthesized risk assessment model: Risk = 0.725*H + 0.1684*V – 0.1066*P.
3 Factors applied in the risk assessment
3.1 Wildfire hazard criticalities
3.1.1 Climate
The literature on wildfires has highlighted several climate-inducing factors: temperature, wind speed, relative humidity, and precipitation (Sun et al., 2014; Jolly et al., 2015; Pan et al., 2016; Pickell et al., 2017). All of these factors act on vegetation water content and ignition points. Wildfires are easy to start and spread in a high-temperature dry environment and vice versa. This study divides temperature factors into an ensemble mean of the daily average, annual maximum, and annual minimum. A significant advantage of this division is ensuring complete consideration of the effects of extreme temperature spatial patterns of wildfires. With the rapid increase in extreme precipitation events in this area, annual consecutive precipitation-free days maximum characterize the status of vegetation moisture content better than a single index of precipitation amount. The wind speed affects both combustible contents and wildfire spread by expediting evaporation and airflow. The aforementioned three factors are positive indices. Wildfire risks increase with an increase in the three factors. The relative humidity factor is an exception. With the increase in relative humidity, the moisture of vegetation increases, and ignitability declines after that.
All the aforementioned climate factors in a historical baseline of 1981–2020 are interpolated to the study area at a resolution of 100 m*100 m using partial thin plate smoothing splines, as implemented in ANUSPLIN (Hutchinson, 1991; Hutchinson, 2004). These temperature maps show that the southern part of the study area experiences the highest ensemble mean of annual average temperature, especially in the belting river valley area. By comparison, the low-temperature area is mainly distributed in high-altitude localities. It is worth noting that in the northeastern part of the study area, the variations arising between the ensemble means of annual minimum and maximum are relatively less than those arising in the other factors (Figures 2A–C).
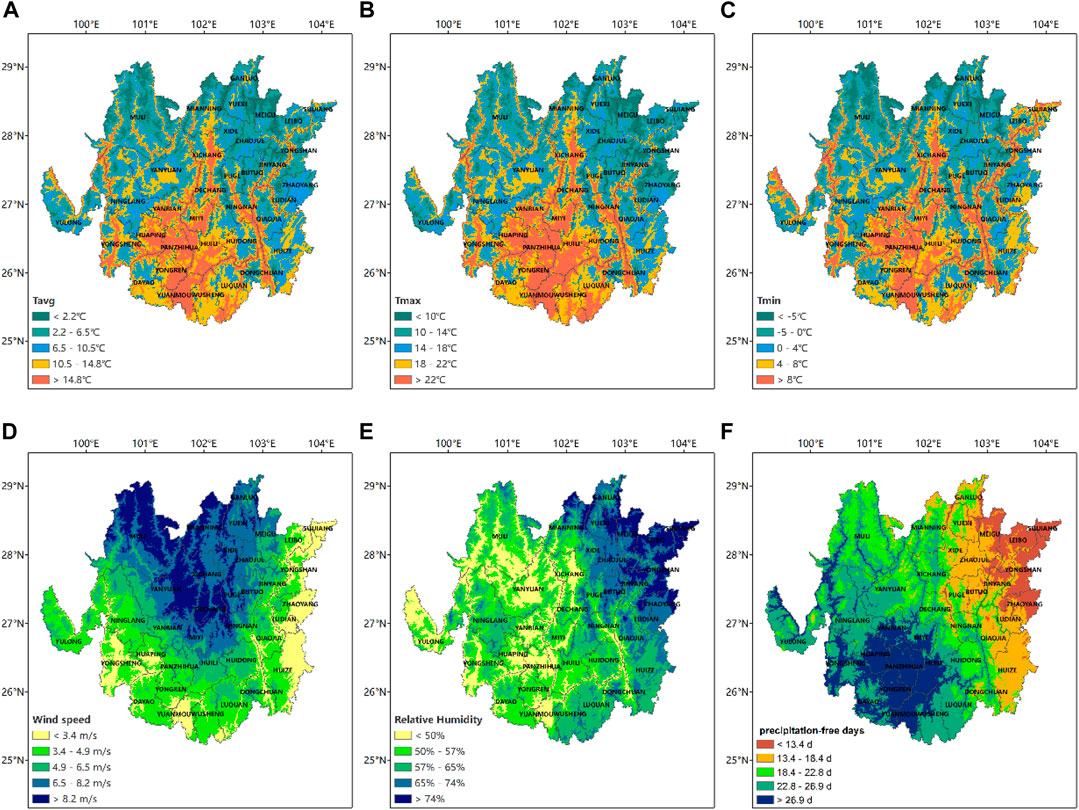
FIGURE 2. Spatial pattern of climate hazard factors in historical baseline (1981–2020) over high wildfire incident area of southwestern China. (A) Ensemble means of daily temperature average. (B) Annual maximum of daily temperature maximum. (C) Annual minimum of daily humidity. (D) Wind speed. (E) Relative humidity. (F) Annual consecutive precipitation-free days maximum.
Annual consecutive precipitation-free day maximum of rain gauge records in the study area ranges from 7.8 to 37.6 d/a, with the highest exceeding 26.9 d/a in the southwestern part and west valley of the study area. Meanwhile, the lowest annual consecutive precipitation-free day maximum, i.e., less than 13.4 d/a, is recorded in the northeastern and eastern mountain areas (Figure 2D).
The ensemble mean of average daily wind speed records ranges from 1.0 to 9.1 m/s. Wind speed greater than 8.2 m/s is reported in the northern and central parts of the study area, which decreases toward the periphery. The lowest wind speed, i.e., less than 3.4 m/s, mainly occurs in the outer ring of the study area. The spatial pattern of wind speed is distinctly different from other climate factors (Figure 2E).
According to previous research, a wildfire is likely to occur when the relative humidity is below 65% (Pan et al., 2016). Relative humidity below 65% occurs in over 69.4% of the study area. Unlike the spatial patterns of temperature, the relative humidity of the study area decreases from west to east in general. Particularly, in the southwestern part, the low relative humidity occurs in low-altitude areas with intensive drainage networks abnormally (Figure 2F).
3.1.2 Topography
Since the relationship between topographical factors and wildfire risks is non-linear, in this study, the wildfire risk levels of altitude, slope degrees, and aspects are grouped based on the study area’s 2017–2021 historical wildfire records, the spatial patterns of topographical factors can be seen in Figure 3. Detailed classifications of altitude, slope degrees, and aspects are listed in Tables 2–4.
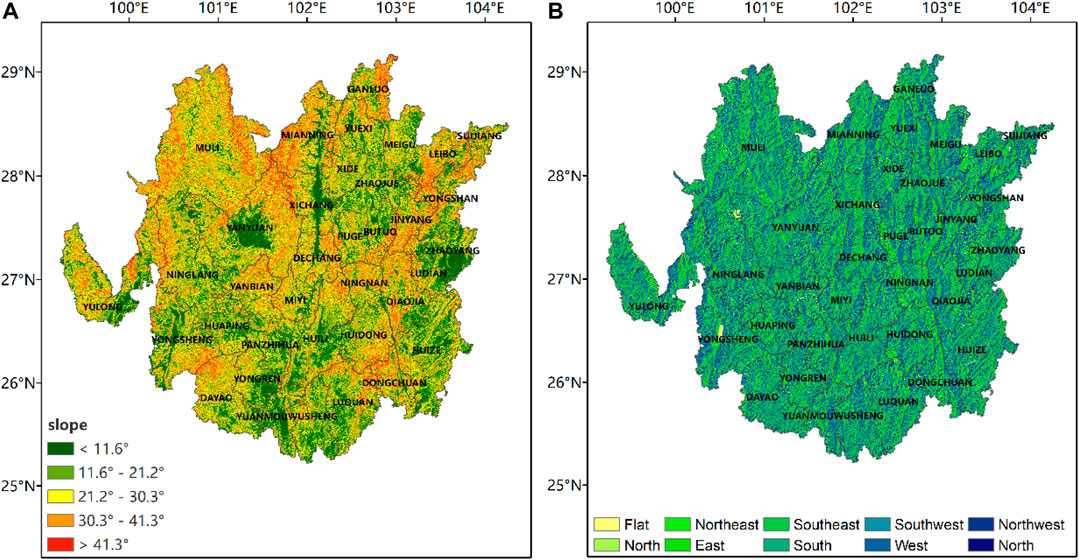
FIGURE 3. Spatial pattern of topography hazard factors over the high-wildfire incident area in southwestern China. (A) Slope. (B) Aspect.
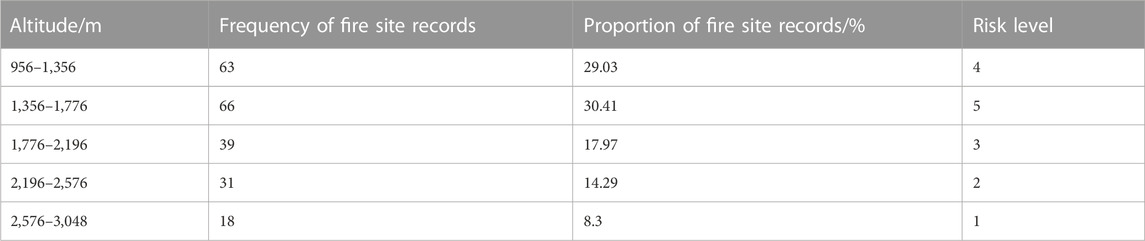
TABLE 2. Classifications of altitudes.
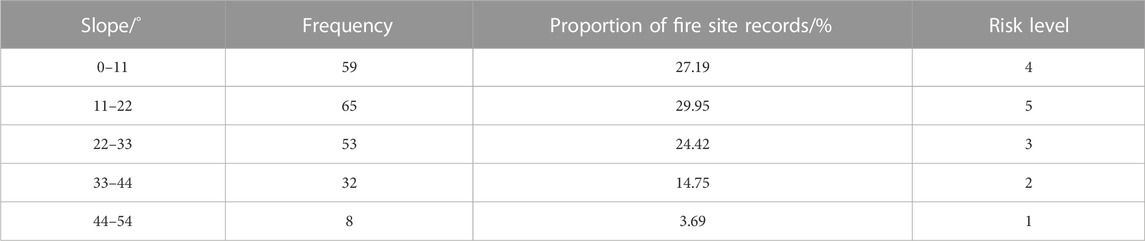
TABLE 3. Classifications of slopes.
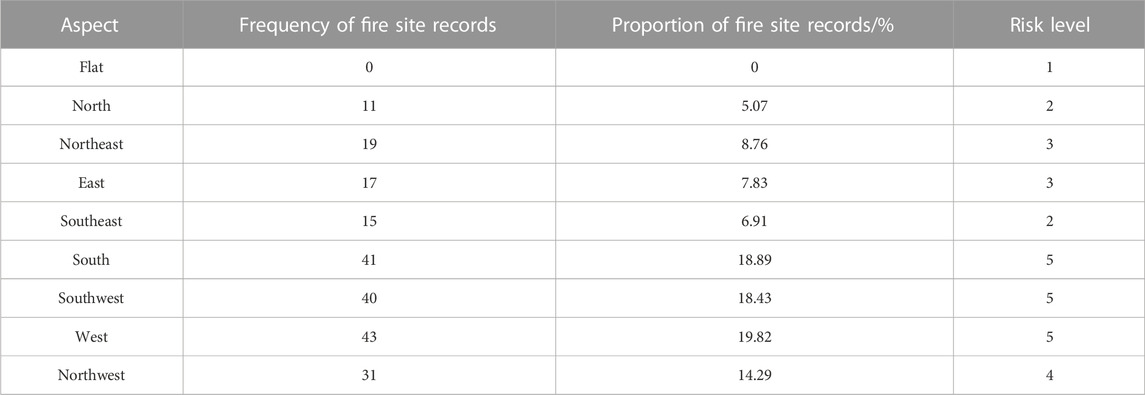
TABLE 4. Classifications of aspects.
3.2 Vulnerability
3.2.1 Vegetation types
According to the inflammability of different vegetation types (Dimitrakopoulos and Papaioannou, 2001; Hall et al., 2010; Corona et al., 2014), the study area is divided into grasslands, bushlands, forests, and other underlying surfaces, and the vulnerabilities of each type decrease in turn. Forests stretch over 57.54% of the study area and account for the most significant proportion. Grasslands hold the highest vulnerability level, accounting for 25.63% of the study area (Figure 4A).
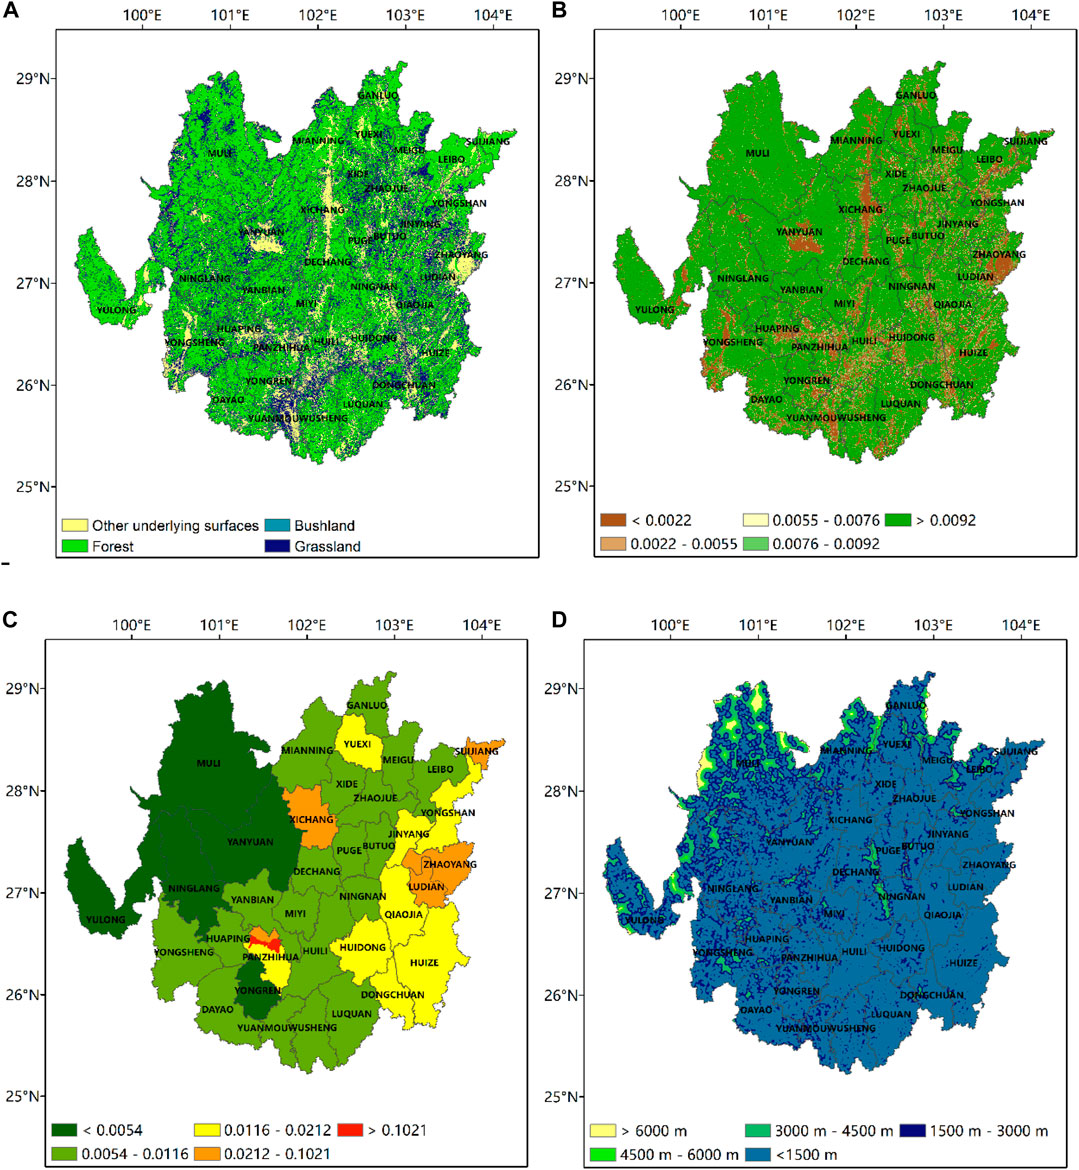
FIGURE 4. Spatial pattern of vulnerability factors over the high-wildfire incident area in southwestern China. (A) Vegetation type. (B) Vegetation coverage. (C) Population density. (D) Distance from habitats and settlements.
3.2.2 Vegetation coverage
The vegetation proportion raster dataset is constituted by the vegetation coverage of each 100 m*100 m grid (Figure 4B). The vegetation coverage in the northeastern part is relatively higher than that in other parts. The distribution illustrates the urbanization rate of the study area as well. The details with low vegetation coverage often refer to urbanized regions.
3.2.3 Population exposure
With the densification of the population, the vulnerability to wildfires increases. The distribution of population density is in accordance with urbanization rates. The lowest population density occurs in the northeastern part of the study area, with a population density of less than 54 people/km2. By comparison, the economic center located in the southern study area has a population density of over 1,000 people/km2 (Figure 4C).
3.2.4 Distance from habitats and settlements
Human activities of habitation and culture can lead to accidental wildfires (Moreira et al., 2012). Meanwhile, the losses of wildfire disasters tend to increase with the distances from habitats and settlements. Wildfires rarely break out or spread very close (e.g., within a distance of 500 m) to habitats and colonies because of the cautious fire use and the rapid putting out. Hence, the correlation between vulnerability and distances from habitats and settlements is non-linear. Based on previous research, wildfire disasters most frequently occur between 1,500 and 3,000 m, followed by a space of less than 1,500 m. No wildfire records are found beyond 9,000 m from habitats and settlements (Figure 4D). The vulnerability levels of distances from habitats and settlements are listed in Table 5.

TABLE 5. Classifications of distance from habitats and settlements.
3.3 Wildfire prevention/mitigation capacity
3.3.1 Distance from roads
Distance from roads is the index that refers to both wildfire proneness and mitigation capacities. On the one hand, frequent human activities near roads induce accidental fire opportunities. On the other hand, emergency departments can monitor wildfires near roads at the preliminary stage, and fire engines and other fire control equipment can rapidly respond to fire alarms. As a factor of wildfire prevention/mitigation capacities, the effect of distances of 2 km from roads could be neglected. In this study, the county-level road networks and distances from roads are considered the practical parts of wildfire prevention/mitigation capacity due to the applicabilities of firefighting infrastructures. The prevention/mitigation capacity levels of distances from roads are listed in Table 6, and the spatial patterns are shown in Figure 5A.
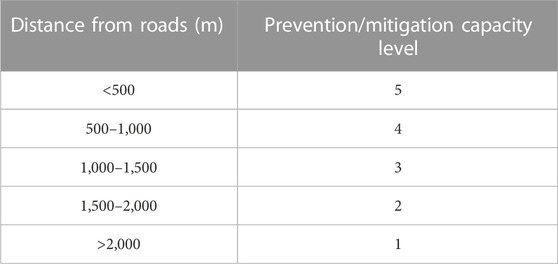
TABLE 6. Classifications of distance from roads.
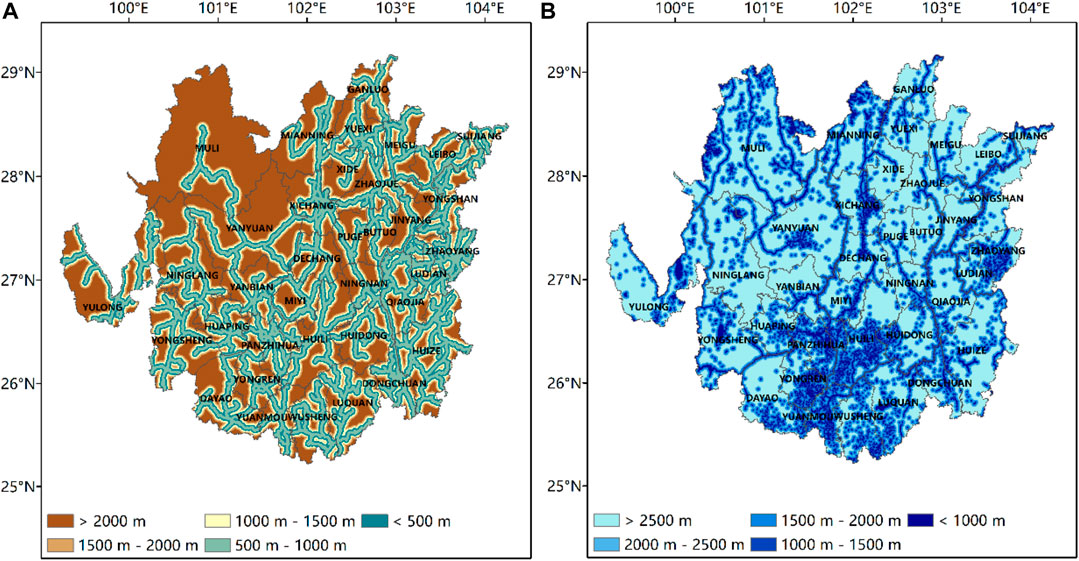
FIGURE 5. Spatial pattern of wildfire prevention/mitigation capacity factors over the high-wildfire incident area in southwestern China. (A) Distance from roads. (B) Distance from waterbodies.
3.3.2 Distance from waterbodies
As the source of the fire water system, the location and availability of natural waterbodies are important elements of wildfire prevention/mitigation capacity. The availability of a natural waterbody declines as the distance between fire points and the waterbody increases. The prevention/mitigation capacity levels of distance from waterbodies are listed in Table 7, and the spatial patterns are shown in Figure 5B.
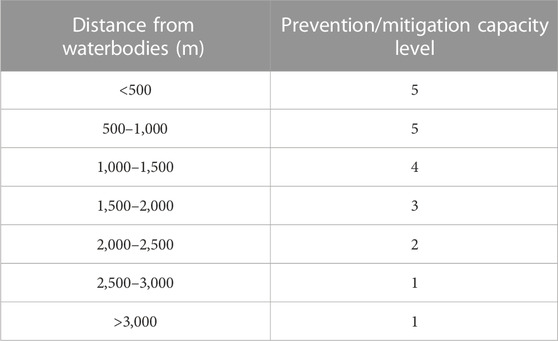
TABLE 7. Classifications of distance from waterbodies.
4 Results
4.1 Hazard criticalities
The element of hazard manifests both ignition possibility and wildfire spreading. High and very high climate hazard areas are mainly located west of 103°E, with belts distributed along valleys and basins, accounting for 45.81% of the study area. Universal features of high and very high climate hazard areas are relatively high temperatures, low relative humidity, and long consecutive precipitation-free days. Very low and low climate hazard areas fall in the northeastern study area, east of 103°E, between 27 and 29°N, accounting for 30.44% of the study area. These areas have relatively high relative humidity, low wind speed, and short consecutive precipitation-free days. Moderate climate hazard areas mainly fall in suburban areas and regions with a relatively low level of development, relatively high temperatures, long consecutive precipitation-free days but low wind speed, and high relative humidity (Figure 6).
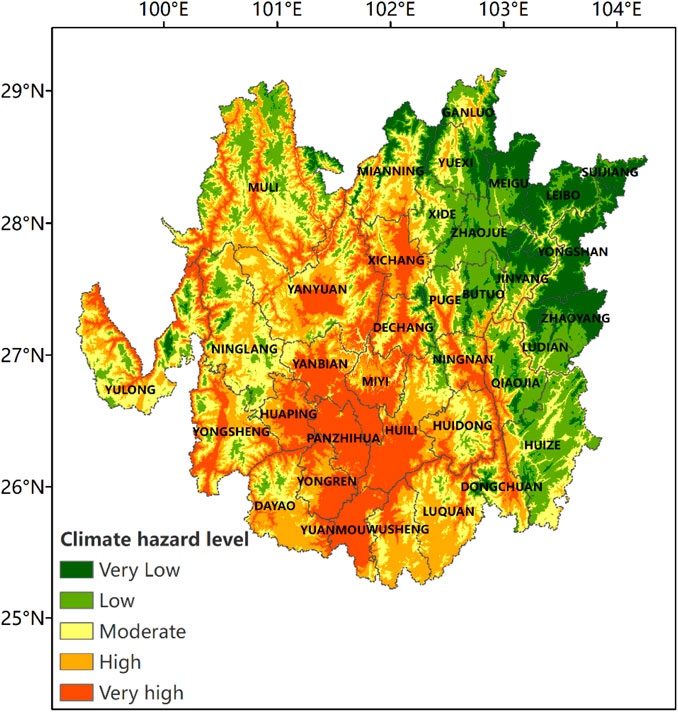
FIGURE 6. Spatial pattern of climate hazards.
Distributions of topography hazards are relatively scattered. Areas with above-moderate-level topography hazards mainly occur in canyons and cliffy mountain regions. Altitudes and slope degrees of these areas are easy for ignition and wildfire spreading, accounting for 47.93% of the study area. Very low topography hazard areas, with belts distributed mainly in valleys with gentle slopes and relatively low altitudes, account for 12.01% of the study area. The exception is the northwestern end of the study area. Although the terrain of this area is eminently steep, the altitude here is overly high for wildfires, making low topography hazards dominant here. Significantly, most very low topography hazard areas have coincided with very high-climate hazard areas except the northeastern corner of the study area (Figure 7).
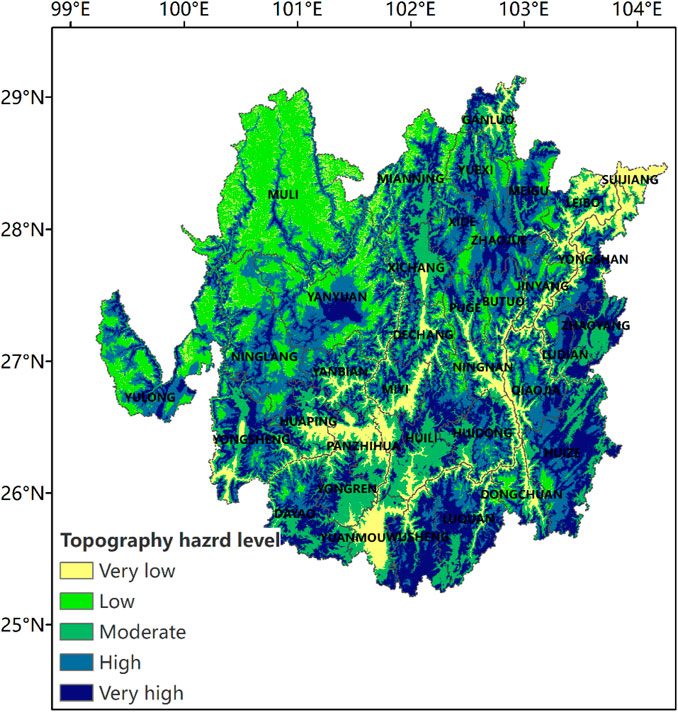
FIGURE 7. Spatial pattern of topography hazards.
4.2 Vulnerability
Grids with high vulnerability levels dominate the entire classified vulnerability distribution, accounting for 57.64% of the study area due to the high vegetation coverage. Divided by the line of 102°E, very high-vulnerability areas in the eastern part are vast stretches, while in the western region, they are more scattered since the habitats and settlements are more concentrated, and the vegetation type of grasslands (with the highest vulnerability level) hold a significant proportion in these regions. Low- and very low-vulnerability areas mainly occur in urban areas and waterbodies, with scarce vegetation coverage and the most inferior vulnerability level surfaces, accounting for 19.86% of the study area. Areas with the moderate vulnerability level account for only 5.48% of the study area, formed in different ways: divided by the lines of 102°E and 27°N, moderate vulnerability areas in the eastern and southern parts are formed by relatively low vegetation coverage and vegetation ignitability, under the background of dense population and habitats/settlements, while in the western and northern parts, vegetation coverage and ignitability are relatively high, but population and habitat/settlement density are relatively low (Figure 8).
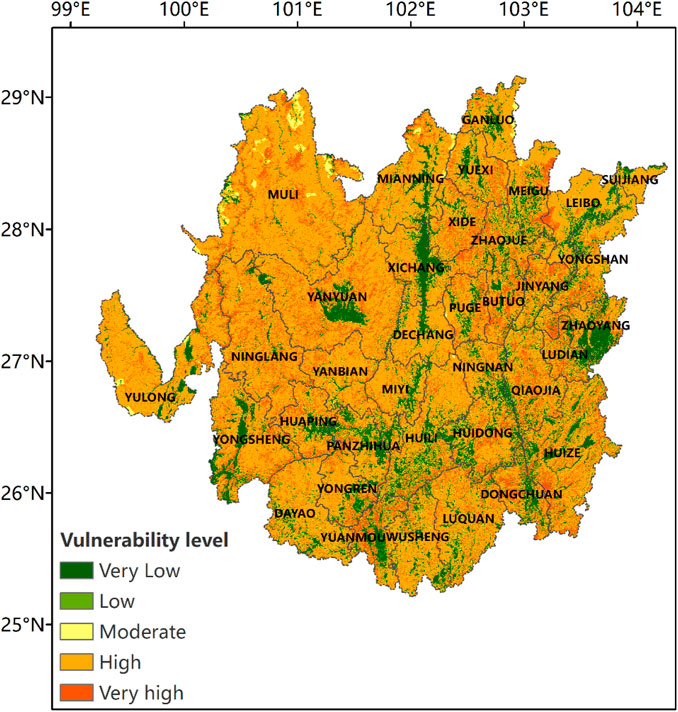
FIGURE 8. Spatial pattern of vulnerability.
4.3 Wildfire prevention/mitigation capacity
Prevention/mitigation capacity is a negative factor in wildfire risk mapping. With the increasing prevention/mitigation capacity, wildfire risks decline. Grids with very high prevention/mitigation levels mainly occur at the intersection of road networks and waterbody surroundings, accounting for 11.53% of the study area. High and moderate prevention/mitigation capacity grids, accounting for 21.57% and 18.09% of the study area, respectively, are areas alongside roads but far away from waterbodies. The most significant proportion held by low prevention/mitigation capacity grids is 25.16%, which mainly occurs in areas with inaccessible waterbody surroundings. Very low prevention/mitigation capacity grids occur in deep forests and upper mountain areas far away from fire water systems. Once these regions get ignited, it is hard to rescue. In general, the prevention/mitigation capacity of the study area is higher in the east of 102°E and the south of 27°N. These two lines can be regarded as the demarcations of wildfire risk mapping over the study area (Figure 9).
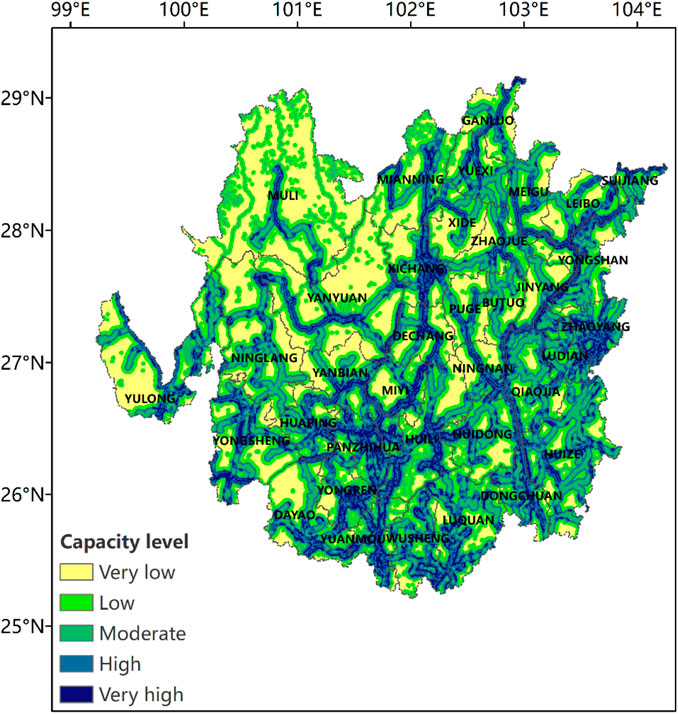
FIGURE 9. Spatial pattern of wildfire prevention/mitigation capacity.
4.4 Synthesized risk mapping
Synthesized risk mapping in this study (Figure 10) reflects the probability of ignition, spreading, and rescue of wildfire: the climate hazard and topography hazard factors influence the inflammability of vegetation and spreading possibility. Vulnerability factors that describe the case of wildfire-inducing damage, combined with the ability of wildfire rescue, constitute the synthesized wildfire risk mapping over the high-incidence area of southwestern China. Most very high wildfire risk girds are distributed in the west of 103°E and the north of 28°N and intensively distributed in 101°E∼102.5°E, 28°N∼26°N. Broad similarities of very high-risk grids are urban area surroundings with relatively frequent human activities and high climate hazard levels, basins and valleys with altitudes between 1,500 and 3,000 m, high vegetation coverage, and areas away from waterbodies and road networks. Very high-risk grids account for 22.05% of the study area, covering over 26,500 km2. There are 14 county-level regions with a very high wildfire risk area proportion of over 50% inside their administrative boundaries. High- and moderate-risk grids dominate the study area, accounting for 28.56% and 26.83%, respectively, covering a total area of over 66,600 km2. Broad similarities between high- and moderate-risk grids are high–very high climate hazards and under-moderate topography hazards, whereas the difference is high and moderate grids at the west of 102.5°E under the background of above-moderate vulnerabilities and under-moderate prevention/mitigation capacities.
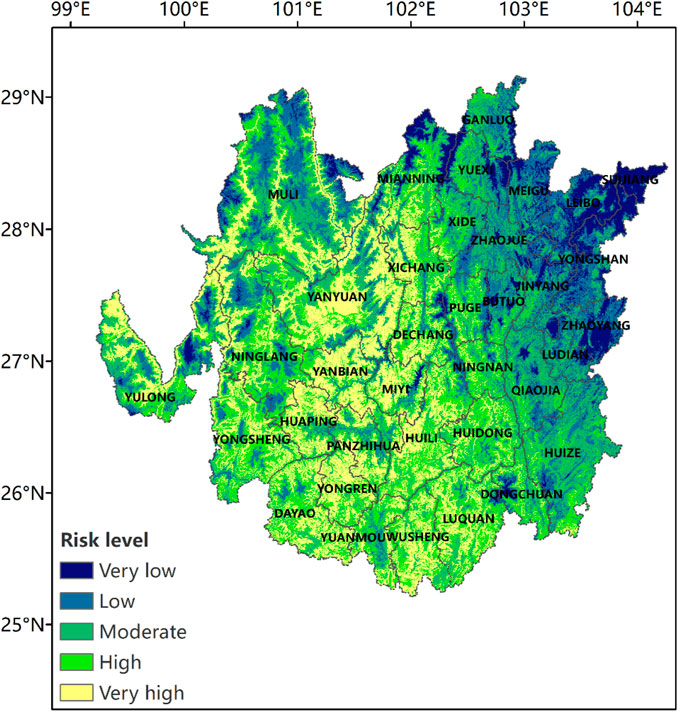
FIGURE 10. Spatial pattern of synthesized risk assessment.
Nonetheless, in the eastern part, the reverse applies. Low- and very low-risk grids are mainly concentrated in the east part of 102°E, with minorities located in a small area between 100°E∼100.5°E and 27°N∼28°N, mainly for high mountain regions and waterbodies. The sum of low- and very low-risk grids accounts for 22.57% of the study area, covering an area of 27,000 km2. Low- and very low-risk areas mainly occur in urban areas with low vegetation and dense public fire prevention infrastructures or humid regions in the northeastern study area. The risk mapping results are in general accordance with the climate regionalization. Areas with wildfire risks above moderate are mainly distributed in the southern subtropical sub-humid zone, while regions with risks below moderate occur in the northern and central subtropical humid zones. The northwestern end of the study area is located at the junction of the highland temperate humid zone and the highland temperate sub-humid zone. The contradictory vulnerability factors, namely, a large number of high ignitability grassland stretches and tiny population exposure, make this region unique over the study area.
5 Discussion and conclusion
Most previous studies of wildfire risk mapping emphasize topography factors, and climate factors are ignored or applied in low-resolution ways, thereby failing to notice some important details of wildfire risks. One instance is, in previous studies, the northwestern end of the study area (ranging from 28°N to 29°N and 100.5°E to 101.5°E) is classified as a low-fire risk area due to its low temperature. When the elevation model-related climate factors are applied, high- and very high-risk regions distributed in the belting ravines are revealed, which coincides with the actual wildfire records. Another fact is that with climate change and increasing precipitation extremes, the ensemble mean of annual precipitation accumulation, which is applied in most previous studies, is insufficient to characterize the humidity of vegetation solitarily. Our study suggests that the annual precipitation accumulation and annual consecutive precipitation-free day maximum are increasing, with a trend of expanded wildfire scales over the study area in recent years. The relationship between precipitation factors and wildfire needs advanced research.
The potential changes in climate hazards are the most critical and predictable factor among all the risk factors. The analysis of climate factors indicates that wind speed and relative humidity decline due to the changes in underlying surfaces under the background of large-scale urbanization. Meanwhile, the synchronous increase in precipitation accumulation and consecutive precipitation-free days points to more intense precipitations and longer dry seasons. Increasing human activities, combined with warming and drying climate conditions, uplift the frequency of wildfires. Nonetheless, wind speed declines limit wildfire spreading, explaining the synchronous increments in occurrences and reductions in scales of wildfire events in actual records.
The wildfire mapping result suggests that the hotspots of wildfire are mainly distributed in the area ranging 101°E∼102.5°E and 26°N∼28.5°N and stretch over 14 county-level administration units. The highly localized wildfire risk maps specified fire prevention/mitigation stresses in each grid cell and general spatial patterns of wildfire risks. With the skyrocketing expansion of population and urbanization in southwestern China, policymakers should take changing climate hazards, localized vulnerabilities, and socio-economic characteristics into full consideration to manage wildfire risks and make tendentious construction policies of transportation systems and fire water systems toward existing and potential wildfire hotspots under the background of global warming.
Data availability statement
The original contributions presented in the study are included in the article/Supplementary Material; further inquiries can be directed to the corresponding author.
Author contributions
YX, JL, and HG contributed to the conception and design of the study. YX and RS collected and organized the original data. YX, JL, and XL performed the statistical analysis. YX wrote the first draft of the manuscript. All authors contributed to manuscript revision, read, and approved the submitted version.
Funding
This research was supported by the Innovation and Development Special Project of the China Meteorological Administration (CXFZ 2021J058) and the Development Project of Plateau Atmosphere and Environment Key Laboratory of Sichuan Province (PAEKL-2022-K07).
Conflict of interest
The authors declare that the research was conducted in the absence of any commercial or financial relationships that could be construed as a potential conflict of interest.
Publisher’s note
All claims expressed in this article are solely those of the authors and do not necessarily represent those of their affiliated organizations, or those of the publisher, the editors, and the reviewers. Any product that may be evaluated in this article, or claim that may be made by its manufacturer, is not guaranteed or endorsed by the publisher.
References
AghaKouchak, A., Chiang, F., Huning, L. S., Love, C. A., Mallakpour, I., Mazdiyasni, O., et al. (2020). Climate extremes and compound hazards in a warming world. Annu. Rev. Earth Planet. Sci. 48, 519–548. doi:10.1146/annurev-earth-071719-055228
Artés, T., Oom, D., de Rigo, D., Durrant, T. H., Maianti, P., Libertà, G., et al. (2019). A global wildfire dataset for the analysis of fire regimes and fire behaviour. Sci. Data 6 (1), 296. doi:10.1038/s41597-019-0312-2
Ball, G., Regier, P., González-Pinzón, R., Reale, J., and Van Horn, D. (2021). Wildfires increasingly impact Western US fluvial networks. Nat. Commun. 12, 2484. doi:10.1038/s41467-021-22747-3
Bessie, W. C., and Johnson, E. A. (1995). The relative importance of fuels and weather on fire behavior in subalpine forests. Ecology 76 (3), 747–762. doi:10.2307/1939341
Collins, R. D., Neufville, R. D., Claro, J., Oiveira, T., and Pacheco, A. P. (2013). Forest fire management to avoid unintended consequences: A case study of Portugal using system dynamics. J. Environ. Manag. 130 (1), 1–9. doi:10.1016/j.jenvman.2013.08.033
Corona, P., Ferrari, B., Cartisano, R., and Barbati, A. (2014). Calibration assessment of forest flammability potential in Italy. For. - Biogeosciences For. 7 (5), 300–305. doi:10.3832/ifor1123-007
Flannigan, M. D., Stocks, B. J., and Wotton, B. M. (2000). Climate change and forest fires. Sci. Total Environ. 262 (3), 221–229.doi:10.1016/S0048-9697(00)00524-6
Diffenbaugh, N. S., Singh, D., Mankin, J. S., Horton, D. E., Swain, D. L., Touma, D., et al. (2017). Quantifying the influence of global warming on unprecedented extreme climate events. Proc. Natl. Acad. Sci. 114 (19), 4881–4886. doi:10.1073/pnas.1618082114
Dimitrakopoulos, A. P., and Papaioannou, K. K. (2001). Flammability assessment of Mediterranean forest fuels. Fire Technol. 37 (2), 143–152. doi:10.1023/A:1011641601076
Flannigan, Md, and Harrington, Jb (1988). A study of the relation of meteorological variables to monthly provincial area burned by wildfire in Canada (1953-80). J. Appl. Meteorol. 27, 441–452. doi:10.1175/1520-0450(1988)027<0441:asotro>2.0.co;2
Flannigan, M. D., Stocks, B. J., and Wotton, B. M. (2000). Climate change and forest fires. Sci. Total Environ. 262, 221–229. doi:10.1016/s0048-9697(00)00524-6
Gao, T., Wang, H. J., and Zhou, T. (2017). Changes of extreme precipitation and nonlinear influence of climate variables over monsoon region in China. Atmospheric Research 197 379–389. doi:10.1016/j.atmosres.2017.07.017
Geographic Data Sharing Infrastructure (2023). Geographic data sharing infrastructure, college of urban and environmental science. Peking University.
Goetz, S. J., Fiske, G. J., and Bunn, A. G. (2006). Using satellite time-series data sets to analyze fire disturbance and forest recovery across Canada. Rem. Sens. Environ. 101, 352–365. doi:10.1016/j.rse.2006.01.011
Gong, P., Li, X. C., and Zhang, W. (2019a). 40-Year(1978-2017) human settlement changes in China reflected by impervious surfaces from satellite remote sensing. Sci. Bull. 64, 756–763. doi:10.1016/j.scib.2019.04.024
Gong, P., Chen, B., Li, X., Liu, H., Wang, J., Bai, Y., et al. (2019b). Mapping essential urban land use categoriesin China (EULUC-China): Preliminary results for 2018. Sci. Bull. 65, 182–187. doi:10.1016/j.scib.2019.12.007
Gralewicz, N. J., Nelson, T. A., and Wulder, M. A. (2012). Factors influencing national scale wildfire susceptibility in Canada, For. Ecol. Environ., 265, 20–29. doi:10.1016/j.foreco.2011.10.031
Hall, S. J., and Marchand, P. J. (2010). Effects of stand density on ecosystem properties of subalpine forests in the southern Rocky Mountains. USA 67 (1), 102. doi:10.1051/forest/2009083
Hallema, D. W., Sun, G., Caldwell, P. V., Norman, S. P., Cohen, E. C., Liu, Y., et al. (2018). Burned forests impact water supplies. Nat. Commun. 9, 1307. doi:10.1038/s41467-018-03735-6
Hijmans, R. J., Cameron, S. E., Parra, J. L., Jones, P. G., and Jarvis, A. (2010). Very high-resolution interpolated climate surfaces for global land areas. Int. J. Climatol. 25 (15), 1965–1978. doi:10.1002/joc.1276
Hutchinson, M. F. (2004). ANUSPLIN version 4.3. Canberra Australia: Centre for Resource and Environmental Studies, Australian National University.
Hutchinson, M. F. (1995). Interpolating mean rainfall using thin plate smoothing splines. Int. J. GIS 9, 385–403. doi:10.1080/02693799508902045
Hutchinson, M. F. (1993). “On thin-plate splines and kriging,” in In: Computing and science in statistics. Editors M. E. Tarter, and M. D. Lock (Berkeley: Interface Foundation of North America, University of California), 25, 55–62.
Hutchinson, M. F. (1991). “The application of thin plate smoothing splines to continent-wide data assimilation,” in BMRC research report No. 27, data assimilation systems. Editor J. D. Jasper (Melbourne: Bureau of Meteorology), 104–113.
IPCC (2012). Managing the risks of extreme events and disasters to advance climate change adaptation: Special report of the intergovernmental panel on climate change. Cambridge, UK, New York, NY: Cambridge University Press.
Jaiswal, R. K., Mukherjee, S., Raju, K. D., and Saxena, R. (2002). Forest fire risk zone mapping from satellite imagery and GIS. Int. J. Appl. Earth Observation Geoinformation 4 (1), 1–10. doi:10.1016/s0303-2434(02)00006-5
Jolly, W. M., Cochrane, M. A., Freeborn, P. H., Holden, Z. A., Brown, T. J., Williamson, G. J., et al. (2015). Climate-induced variations in global wildfire danger from 1979 to 2013. Nat. Commun. 6, 7537. doi:10.1038/ncomms8537
McKenney., D. W., Sophie, P., Poissant., Y., Morris., R., Hutchinson., M., Papadopol., P., et al. (2008). Spatial insolation models for photovoltaic energy in Canada. Sol. Energy 82 (11), 1049–1061. doi:10.1016/j.solener.2008.04.008
Moreira, F., Arianoutsou, M., Corona, P., and De las Heras, J. (2012). Managing forest ecosystems] post-fire management and restoration of southern European forests volume. Fire Hazard Flammabl. Eur. For. Types 24. doi:10.1007/978-94-007-2208-8_4
Ozturk, M., Gucel, S., Kucuk, M., and Sakcali, S. (2010). Forest diversity, climate change and forest fires in the Mediterranean region of Turkey. J. Environ. Biol. 31 (1-2), 1–9.
Pan, J., Wang, W., and Li, J. (2016). Building probabilistic models of fire occurrence and fire risk zoning using logistic regression in Shanxi Province, China. Nat. Hazards 81 (3), 1879–1899. doi:10.1007/s11069-016-2160-0
Petoukhov, V., Petri, S., Kornhuber, K., Thonicke, K., Coumou, D., and Schellnhuber, H. J. (2018). Alberta wildfire 2016: Apt contribution from anomalous planetary wave dynamics. Sci. Rep. 8 (1), 12375. doi:10.1038/s41598-018-30812-z
Pickell, P. D., Coops, N. C., Ferster, C. J., Bater, C. W., Blouin, K. D., Flannigan, M. D., et al. (2017). An early warning system to forecast the close of the spring burning window from satellite-observed greenness. Sci. Rep. 7 (1), 14190. doi:10.1038/s41598-017-14730-0
Salaheddine, E., M'Hamed, H., Mohammed, Y., Mohammed, D., and Fahed, E. A. (2017). Assessment of flammability of Moroccan forest fuels: New approach to estimate the flammability index. Forests 8 (11), 443. doi:10.3390/f8110443
Shi, K., and Touge, Y. (2022). Characterization of global wildfire burned area spatiotemporal patterns and underlying climatic causes. Sci. Rep. 12, 644. doi:10.1038/s41598-021-04726-2
Sun, L., Wang, Q., Wei, S., Hu, H., Guan, D., and Chen, X. (2014). Response characteristics and prospect of forest fire disasters in the context of climate change in China. J. catastrophology 29, 12–17.
Taufik, M., Torfs, P. J. J. F., Uijlenhoet, R., Jones, P. D., Murdiyarso, D., Van Lanen, H. J. A., et al. (2017). Amplification of wildfire area burnt by hydrological drought in the humid tropics. Nat. Clim. Change 7, 428–431. doi:10.1038/nclimate3280
Wang, Y., Zhang, J., Zhang, H., et al. (2018). Application of MODIS AOD Products to Monitoring Forest Fire in Forest Area of Southwestern China. Journal of Arid Meteorology 36 (5), 820–827. doi:10.11755/j.issn.1006-7639(2018)-05-0820
Wu, J., Gao, X., Giorgi, F., and Chen, D. (2017). Changes of effective temperature and cold/hot days in late decades over China based on a high-resolution gridded observation dataset. Int. J. Climatol. 37 (1), 788–800. doi:10.1002/joc.5038
Zhao, P., Xiao, H., Liu, C., and Zhou, Y. (2021). Dependence of warm season cloud-to-ground lightning polarity on environmental conditions over sichuan, southwest China. Adv. Meteorology 2021, 1–12. doi:10.1155/2021/1500470
Keywords: wildfire, climate change, hazard, vulnerability, risk mapping, Southwest China
Citation: Xu Y, Guo H, Liu J, Sun R and Li X (2023) Wildfire risks under a changing climate: Synthesized assessments of wildfire risks over southwestern China. Front. Environ. Sci. 11:1137372. doi: 10.3389/fenvs.2023.1137372
Received: 04 January 2023; Accepted: 17 March 2023;
Published: 11 April 2023.
Edited by:
Shao Sun, Chinese Academy of Meteorological Sciences, ChinaCopyright © 2023 Xu, Guo, Liu, Sun and Li. This is an open-access article distributed under the terms of the Creative Commons Attribution License (CC BY). The use, distribution or reproduction in other forums is permitted, provided the original author(s) and the copyright owner(s) are credited and that the original publication in this journal is cited, in accordance with accepted academic practice. No use, distribution or reproduction is permitted which does not comply with these terms.
*Correspondence: Haiyan Guo, Z2h5LTgyNEAxNjMuY29t