 Jun Bao1,2
 Jiandong Mao
94% of researchers rate our articles as excellent or good
Learn more about the work of our research integrity team to safeguard the quality of each article we publish.
Find out more
ORIGINAL RESEARCH article
Front. Environ. Sci., 18 May 2023
Sec. Atmosphere and Climate
Volume 11 - 2023 | https://doi.org/10.3389/fenvs.2023.1136411
Introduction: Aerosols affect the radiation budget of the Earth’s atmospheric system. The aerosol particle size distribution (PSD) is one of the main parameters for characterizing the effect of aerosol on radiative forcing.
Methods: The extinction coefficient and backscattering coefficient at 355 and 532 nm and backscattering coefficient at 1064 nm of aerosol particles over Yinchuan area, China, which measured by a multi-wavelength lidar developed by North Minzu University, were used to retrieve the aerosol PSD. In view of the disadvantages of traditional regularization methods, the elitist Non-Dominated Sorting Genetic Algorithm (NSGA-II) is selected to retrieve PSD.
Results and Discussion: To verify the feasibility for retrieval of aerosol PSD, the NSGA-II with different errors in the input optical signal was simulated, in which the errors of the inverted PSD are still in the acceptable range when 35% error added into the optical parameters. Moreover, some experiments were carried out under different atmospheric conditions, including background sunny, cloudy and dusty days, and comparisons were performed with Multiple Population Genetic Algorithm (MPGA) and Simple Genetic Alogrithm (SGA) method. The results show that the retrieval effect of NSGA-II was better than that of MPGA and SGA, and the NSGA-II is very suitable for retrieve PSD by using the multi-wavelength lidar data.
Atmospheric aerosols are particles suspended in the atmosphere in a solid or liquid state. Aerosol particles have an impact on the Earth’s radiation budget and have the direct and indirect effect. In addition, the aerosols also have a great impact on the air quality and solar energy production (Carslaw et al., 2010; Paramonov et al., 2013; Querol et al., 2013; Wang et al., 2020; Wang et al., 2021a; Wang et al., 2021b; Lolli, 2021). The direct effect is determined by the optical properties of aerosols, it directly affects the atmospheric radiation balance by absorbing and scattering solar radiation, which is called aerosol-radiation interaction. The indirect effect is determined by the aerosol-cloud interaction, which affects the cloud formation process by acting as cloud condensation nuclei, moreover changing the optical properties of the cloud, cloud cover, cloud lifetime, etc. The indirect effect is specifically divided into “the first indirect effects” and “the secondary indirect effects”. The first indirect effects are also called “Twomey effect”, which means that under the condition that the total amount of water content in the cloud is unchanged, the change in the number concentration and size distribution of aerosols causes changes in the concentration and size distribution of cloud droplets, thereby affecting the albedo of the cloud body (Twomey, 1974; Twomey, 1977). The secondary indirect effect refers to that the change of aerosol number and size will affect the formation rate of cloud droplets, thus changing the cloud thickness, life cycle and probability of precipitation (Albrecht, 1989).
In recent years, some scientists have researched the particle size distribution (PSD) retrieval methods based on active and passive remote sensing. Passive remote sensing refers to the detection system without a radiation source in the remote sensing system. In other words, the detection instrument obtains and records electromagnetic or optical waves emitted or reflected by the target object from a natural radiation source (such as the Sun) itself to achieve atmospheric detection, such as a sun-photometer (Holben et al., 1998) and particle size spectrometer. In 2017, Sellitto et al. measured regional aerosol optical depths (AOD) and plume Ångström parameters using a multi-wavelength sun-photometer, in addition, discussed the effects of different wavelengths on the Ångström parameters. (Sellitto et al., 2018). In the same year, Chen et al. used CIMEL sun-photometer to conduct columnar aerosol measurements of Harbin City, a metropolis at the highest latitude in northeast China, moreover analyzed the local aerosol properties and their changes in different aspects (Chen et al., 2018). In 2019, Mao et al. analyze the aerosol optical and microphysical characteristics, including AOD and PSD, over Yinchuan area, China, using CE-318 sun-photometer and combing the ESR. pack algorithm (Xue et al., 2021).
Active remote sensing refers to a remote sensing system that transmits some form of electromagnetic or light wave to a target from an artificial radiation source on a remote sensing platform, and then receives and records its return signal through a sensor. Its advantage is that it does not rely on solar radiation, can work day and night, and can actively choose emission wavelengths and modes according to different detection purposes. For example, lidar, acoustic radar and infrared radar are all kinds of active remote sensing. In 1985, Muller et al. proposed the possibility of inverting aerosol PSD by the extinction and backscattering coefficient of multi-wavelength lidar. However, from the extinction backscattering coefficient of lidar, the inversion of aerosol PSD still has many difficulties to be solved (Muller and Quenzel, 1985). In 2004, Veselovskii et al. used the extinction and backscattering coefficients of 355, 532, 1,064 nm of lidar to invert the bimodal aerosol PSD, and the uncertainty problem of constrained solutions is reduced to a certain extent (Veselovskii et al., 2004). In 2015, Chemyakin et al. used the multi-wavelength Raman lidar to invert the aerosol volume concentration, proved that non-uniqueness is the main source of retrieval difficulty, and proposed methods that may theoretically partially compensate for this difficulty by limiting the particle radius range (Chemyakin et al., 2016). In 2015, Sitarek et al. constructed a new objective function according to the lidar ratio (ratio of aerosol extinction to backscattering coefficient) to avoid the backscattering coefficient error at 355 nm and 1064 nm channels, to achieve the PSD inversion (Sitarek et al., 2016). In 2017, Lv et al. used the extinction and backscattering coefficient at 355, 532, and 1,064 nm to retrieve CCN concentration, they used 3β+2α to obtain aerosol PSD, then retrieve CCN concentration according to the aerosol hygroscopic growth factor and Kohler theory, and finally made the error analysis (Lv et al., 2018). In 2019, Tan et al. proposed a new method to invert CCN by multi-wavelength Raman lidar, they used relative humidity to obtain the hygroscopic growth factor, then used dry backscattering and extinction to calculate CCN number concentration (Tan et al., 2019). In 2022, Sannino et al. used new Monte Carlo algorithm to obtain aerosol trajectories from lidar, Sun photometer and satellite data, and retrieved the aerosol PSD from the optical data measured by lidar (Sannino et al., 2022).
Generally, the aerosol PSD retrieval belongs to the Fredholm integral equation of the first kind, and the classical method for solving the equation is regularization method. Muller et al. shows that three extinction coefficients and two backscattering coefficients, namely, 3β+2α, are the best combination for regularization method (Muller et al., 1999). However, in fact, 3β+2α only builds five equations. When generally using two or three lognormal functions to represent the aerosol PSD, there will be six or nine unknown parameters need to be determined, so the regularization method cannot get the six or nine unknown parameters.
Genetic algorithm (GA) has high calculation accuracy, short computing time, and good robustness, which has been widely used in many fields and achieved good results on some parameter optimization problems. GA has also had some practical applications in the inversion of aerosol PSD. In 2011, Zuo et al. used linear regression (LR), GA and annealing genetic algorithm (AGA) to study the stability and accuracy of aerosol PSD inversion, and found that by using AGA, the inversion results were slightly better than GA and much better than LR (Zuo and Jing, 2011). In 2016, Mao et al. employed the backscattering coefficients and extinction coefficients of 1,064, 532, and 355 nm obtained from a multi-wavelength lidar to retrieve the aerosol PSD by innovative multiple population genetic algorithm (MPGA), and some experimental validation was also performed in different weather conditions over Yinchuan area, China (Mao et al., 2016a). In 2021, Guo et al. proposed a modified Tikhonv regularization method based on a GA to retrieve the non-spherical aerosol PSD and analyzed the influence of the optical parameter on the inversion algorithm (Guo et al., 2021).
Whether for regularization method or genetic algorithm, the theoretical optical parameters at each wavelength are compared with the optical parameters obtained from the experimental data, and their differences, namely, errors, can be taken as the objective functions. Generally, the sum of these errors is taken as an objective function and is minimized, and the GA can be used to solve this problem. However, The disadvantage of using the total error as objective function is that the impact of the error value at each wavelength on the total error cannot be taken into account. In fact, the regularization method treats the error minimization in the same as multiple population genetic algorithms, which only minimizes the total error of the five optical parameters. If the error of one optical parameter is larger than the remaining four optical parameters, there is a large error in the number concentration at a certain radius. If the error at each wavelength can be taken as an objective function, the contribution of each error to the objective function will be considered, undoubtedly, a multi-objective genetic algorithm is the most appropriate and can comprehensively balance the optical errors of each channel.
In this study, a novel PSD retrieval method based on a multi-objective genetic algorithm was proposed using 3β+2α data from multi-wavelength lidar. The aerosol PSD was obtained by searching for the optimal six parameters from a certain range of data. Some experiments were performed under different weather conditions and the results were analyzed. The inversion method based on the multi-objective genetic algorithm is described in Section 2, the experiment and results analysis are discussed in Section 3, and a conclusion was obtained in Section 4.
Aerosol extinction coefficient and backscattering coefficient are the main optical parameters of aerosols, which can be used to further invert aerosol parameters, such as aerosol PSD, optical refractive index and so on. In this paper, the Fernald method is used to solve the extinction coefficient:
where, z represents the detection height,
In the Fernald method, the lidar ratio must be assumed. Recent observations suggest that lidar ratios range between 40 and 55 Sr In fact, Yinchuan area is located in the mid latitude region, in using the Fernald or Klett methods, in this paper, the lidar ratio of different wavelengths is selected as the constant value, namely, 40, 50 and 50 Sr for the wavelengths of 1,064, 532 and 355 nm, respectively (Mao et al., 2016b).
The color ratio can reflect the size characteristics of the aerosol particles and refers to the ratio of the backscattering coefficient of 1064 nm to the total backscattering coefficient of 532 nm, which is defined as:
where, β532T(z) represents the total backscattering coefficient, namely, the sum of the
The relationship between the aerosol extinction coefficient and the PSD can be expressed by:
where
where,
Similarity, the relationship between the aerosol backscattering coefficient and the PSD can also be expressed by:
where,
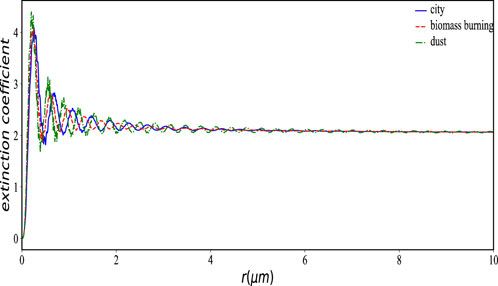
FIGURE 1. The extinction efficiency factors for the three types of aerosols.
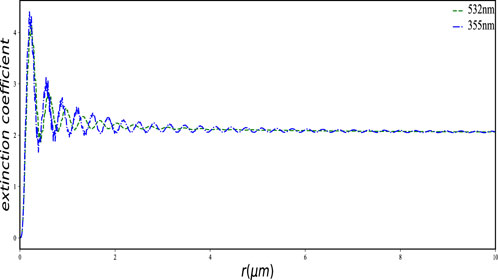
FIGURE 2. The extinction efficiency factors at 355 nm and 532 nm.

FIGURE 3. The backscattering efficiency factors at 355 nm, 532nm, 1,064 nm.
The scattering that occurs when the size of the aerosol particles is close to or greater than the wavelength of the incident laser when the laser is transmitted in the atmosphere is called Mie scattering. The corresponding scattering and extinction efficiency factors for Mie scattering are given by:
where the n can be calculated by the following equation:
According to the size and production mechanism, aerosols can be divided into two types: fine (
where
Another parameter, the aerosols particle effective radius, can be used to describe the physical properties of the aerosol particle, that is, judging the proportion of coarse and fine particles increases or decreases, which is defined as:
GA can find optimal solutions by simulating the “survival of the fittest” principle during natural evolution. In practice, the simple genetic algorithm (SGA) has been popular for the optimization problem application. However, SGA has many disadvantages. For example, SGA is easy to sink into local optima, and its search efficiency is very low. SGA has only one population and all operations aim at this single population.
In contrast, MPGA can use multiple subpopulations to replace a single population of SGA and perform their respective search processes in feasible solution domains. Each subpopulation can evolve in parallel according to different evolutionary strategies and genetic operations. Compared with SGA, MPGA has some obvious advantages. For example, to maintain the evolutionary stability of the best individuals, MPGA can accelerate the evolutionary speed and outcome the premature convergence of SGA to some extent. However, because of the large range of
As mentioned above, the difference between the theoretical optical parameters at each wavelength and the optical parameters obtained by the experimental data can be defined as objective functions and the total sum of errors is as a objective function for minimization. The advantage of using the total error as the objective function is that the algorithm is simple, but the disadvantage is that the impact of the error value at each wavelength on the total error cannot be taken into account. This problem exists in SGA and MPGA. Therefore, if the error at each wavelength is taken as an objective function and the contribution of each error to the objective function is considered, the multi-objective genetic algorithm is undoubtedly the most appropriate. In this paper, the multi-objective genetic algorithm and successive approximation method are selected, which can avoid premature convergence and have significant superiority in optimizing multiple-objective functions.
For multi objective genetic algorithm, the existence of multiple objectives in a problem will in principle produce a group of optimal solutions, rather than a single objective optimal solution. In this paper, the NSGA-II is used to invert the aerosol PSD. The unknown parameters are randomly obtained in a large solution space, which yields different
(1) The parameter ranges of the three models are used to retrieve the PSD. The 40-bit binary string is used to replace the five real parameters, and the binary string is decoded to obtain the parameters within the value range. These unknown parameters
(2) The complex refractive indices
(3) The
(4) The unknown objective functions J1-5 are defined as follows:
(5) If there are parent non-dominant individuals, the first generation subgroup will be generated, if not, performing the non-dominant ranking. The parameters
(6) When the evolutionary generation numbers Gen = 2, the parent generation, and the child generation are merged, and the individual is selected to generate a new parent population, which has four small steps: the non-dominated layering of the individual, calculation of crowding degree, calculation of fitness, and selection based on fitness ranking.
(7) Then the selection, crossover, and mutation process of the chromosome are carried out. If the Gen is more than the maximum generation numbers, the evolution process will be stopped. If it is less than the maximum generation numbers, Gen = Gen+1 and Step (6) will be executed.
Figure 4 shows the flow chart of the aerosol PSD inversion algorithm based on the NSGA-II algorithm.
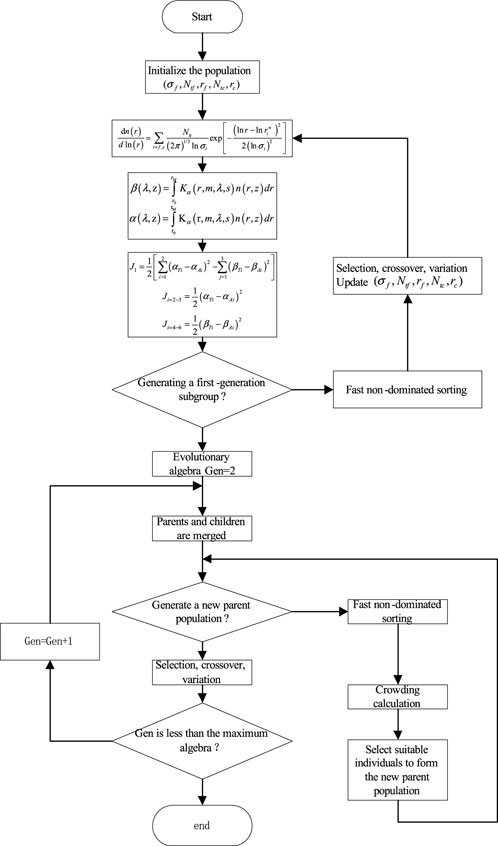
FIGURE 4. The flow chart of the aerosol PSD inversion based on NSGA-II algorithm.
The Fernald method is used to retrieve aerosol extinction coefficient and backscattering coefficient at 355 and 532 nm and backscattering coefficient at 1064 nm.
The value range of the six parameters
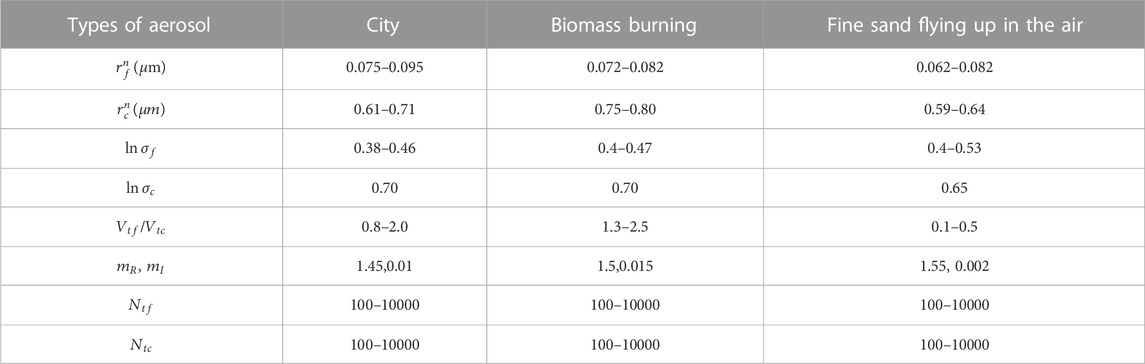
TABLE 1. Three typical parameter ranges for the aerosol bimodal distribution (Dubovik et al., 2002; Veselovskii et al., 2004).
Moreover, the initial parameter setting of the multi-objective genetic algorithm are listed in Table 2.
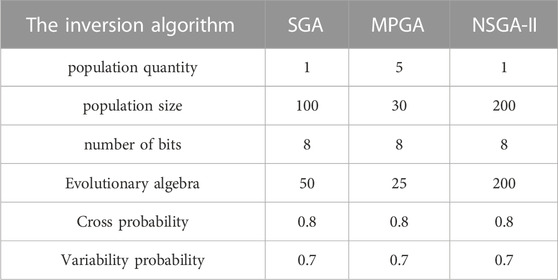
TABLE 2. The initial settings of the three intelligent genetic algorithms.
To verify the feasibility of NSGA-II algorithm for retrieval of aerosol PSD, some simulations, in which the different errors are superimposed on the input optical data, were carried out. A group of data from the parameter ranges of the three models listed in Table 1 was selected to obtain the PSD, which acted as a real value. The group of data is substituted into Eqs 3, 5 to calculate the aerosol extinction coefficient and backscattering coefficient. While a certain error is added to the calculated extinction coefficient and backscattering coefficient to invert the PSD, which is acted as a calculated value, respectively. The inversion average error of the PSD is defined as:
where r is the aerosol particle radius,
Assuming the six parameters of the PSD being 2, 0.7, 0.65, 0.1, 0.45, 0.076 according to Table 1 and substituting these parameters into Eqs 3, 5, the extinction and backscattering coefficient are calculated as
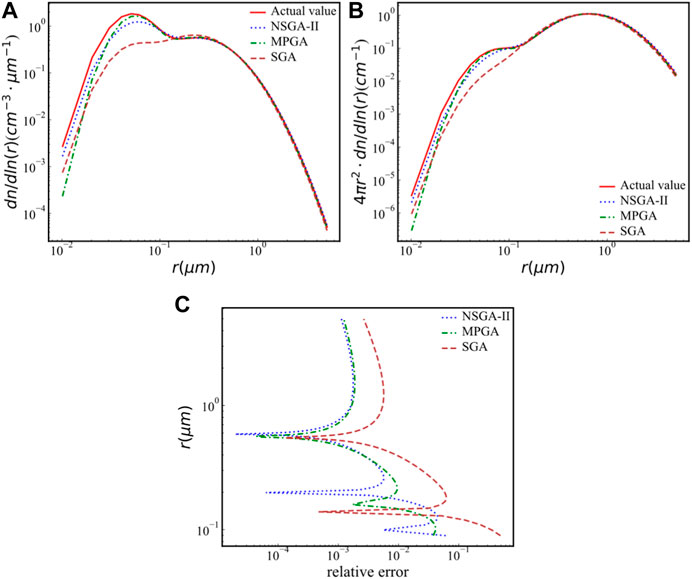
FIGURE 5. The PSD without adding error. (A) The aerosol particle number size distribution; (B) the aerosol particle area size distribution. (C)relative error of the particle number size distribution.
As can be seen from Figure 5C the relative error of the number concentration at the radius greater than 0.8 μm inverted by the NSGA-II algorithm is the smallest of the three, and the relative error is also around 2% at the radius less than 0.8 μm. So the NSGA-II algorithm has certain advantages compared with the other two algorithms.
Figure 6 shows the aerosol PSD using three algorithms when adding 5% error added into the optical parameters of 355, 532 and 1,064 nm channels, respectively. Table 3 lists the inversion relative errors (REs) of the aerosol PSD by three algorithms. It is clear from Figure 6 and Table 3, the error of the 355 nm channel has less effect on the result of the PSD inversion than that of the 532 nm channel. Moreover, for the three algorithms, the error inverted by the NSGA-II algorithm is minimal for all channels.
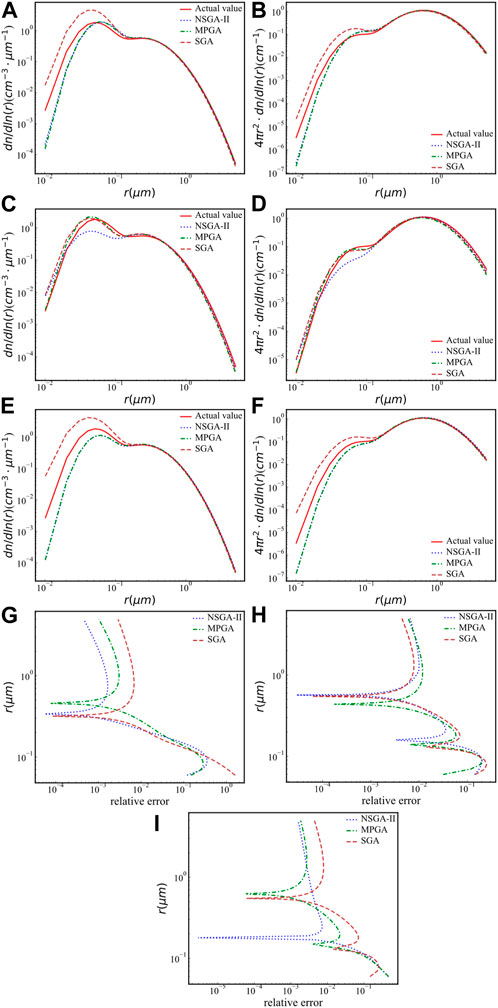
FIGURE 6. The aerosol PSD when adding 5% error added into 355, 532 and 1,064 nm channel, respectively. (A) When adding 5% error added into 355 nm signal, the particle number size distribution; (B) when adding 5% error added into 355 nm signal, the particle area size distribution; (C) when adding 5% error added into 532 nm signal, the particle number size distribution; (D) when adding 5% error added into 532 nm signal, the particle area size distribution; (E) when adding 5% error added into 1,064 nm signal, the particle number size distribution; (F) when adding 5% error added into 1,064 nm signal, the particle area size distribution.(G) when adding 5% error added into 355 nm signal, relative error of the particle number size distribution (H) when adding 5% error added into 532 nm signal, relative error of the particle number size distribution (I) when adding 5% error added into 1,064 nm signal, relative error of the particle number size distribution.
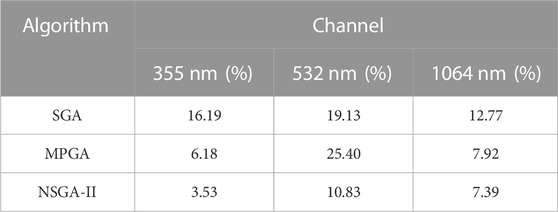
TABLE 3. The inversion REs of the aerosol PSD when adding 5% error added into 355, 532, and 1,064 nm channel, respectively, by three algorithms.
Figure 7 shows the inversion results of the three algorithms when the all five optical parameters are all randomly added with an error of 20%.
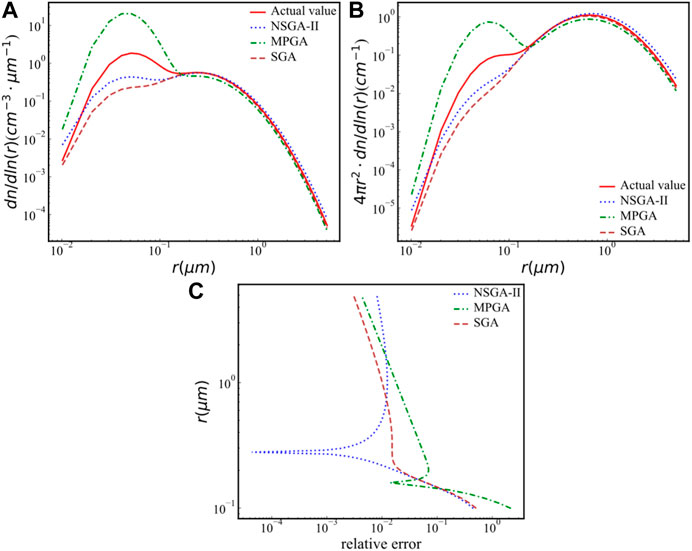
FIGURE 7. The inversion results of the three algorithms when the all five optical parameters are randomly added with an error of 20%. (A) The aerosol particle number size distribution; (B) the aerosol particle area size distribution. (C) the 20% error added into all wavelength, relative error of the particle number size distribution.
From Figure 7, the PSD inverted by NSGA-II is closest to the true value comparing other two algorithm in whole radius range. From Figure 7C, the relative error of the number concentration at a radius less than 0.8 μm retrieved by the NSGA-II algorithm is the smallest among the three, and the relative error at a radius greater than 0.8 μm is very close. So the NSGA-II algorithm has certain advantages compared with the other two algorithms.
Figure 8 shows the REs when the 35% error added in all wavelength. From Figure 8, the inversion error of the NSGA-II algorithm is still acceptable, and REs of the PSD is much smaller than that of the MPGA and SGA algorithms.
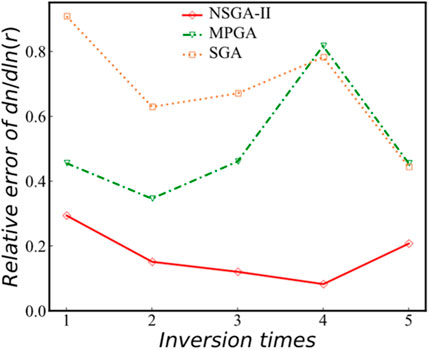
FIGURE 8. The REs when the 35% error added in all wavelength.
Table 4 shows the relative inversion errors of the PSD with several times. Comparing other two algorithms, the inversion effect of NSGA-II algorithm is the best and its inversion errors are still in the acceptable range when 35% error added into the optical parameters, which proves that using NSGA-II algorithm to invert the PSD is feasible.
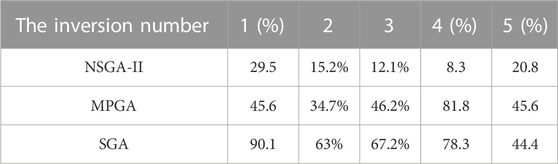
TABLE 4. The REs of the PSD with several times.
As mentioned above, Yinchuan area is located in the northwest of China, surrounded by four deserts. In the west, north and east of Yinchuan area, there are Tengger Desert, Badain Jaran Desert, Ulanbuhe Desert and Maowusu Desert. Yinchuan area belong to the typical continental arid and semi-arid climate, there are four distinct seasons, and there are many sand and dusty weather in spring, with an average annual rainfall of 200 mm. A Multi-wavelength lidar has been devolved and located in Teaching Building 17 at North Minzu University (38°29N, 106°06E) in Yinchuan, China (Mao et al., 2016b). Figure 9 shows the schematic diagram of multi-wavelength lidar system. Table 5 list the parameters of the lidar. To verify the feasibility of using the proposed algorithm, some experiments have been conducted since March 2021.

FIGURE 9. The schematic diagram of all-time six channels multi-wavelength polarization Raman lidar system. BS0-3: Dichroic mirrors, M0-1: Reflector, IF0-4: Interference filters, PMT0-4: Photomutiplier, APD: Avalanche photodiode, L0-6: Lens.
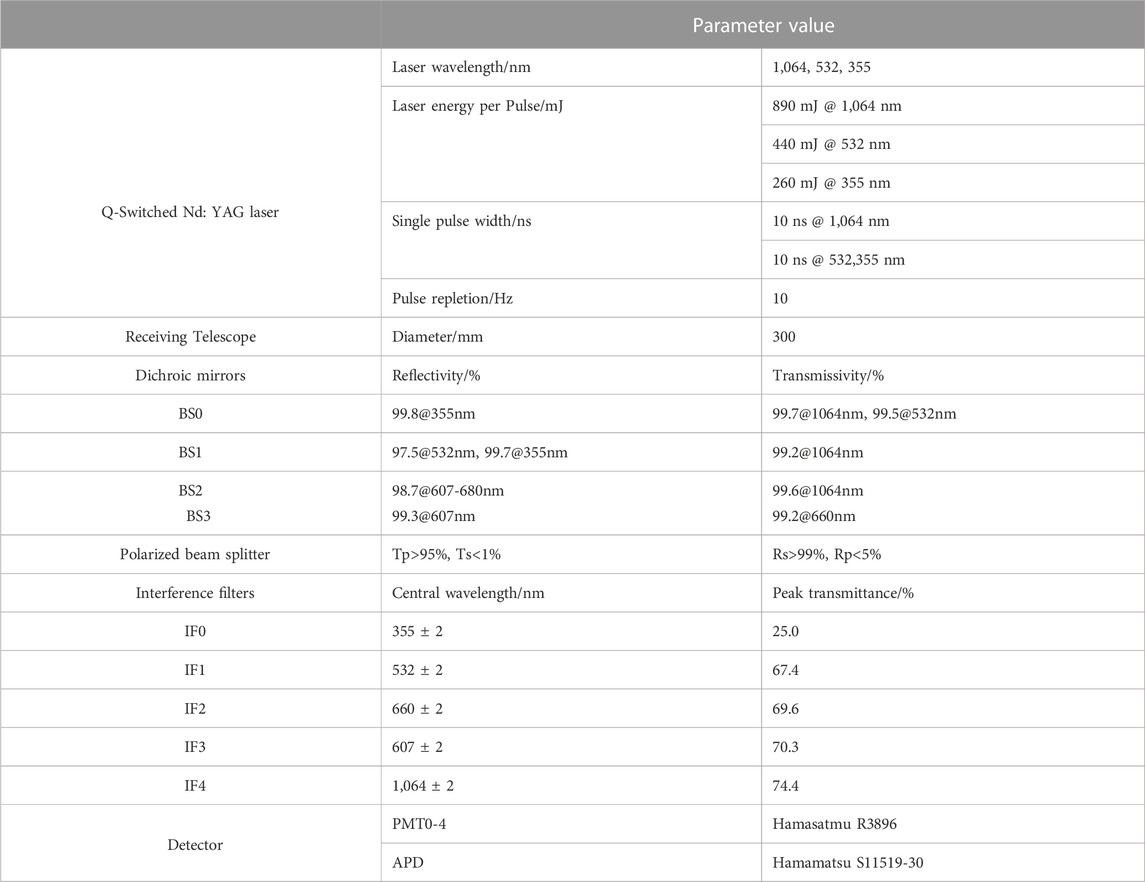
TABLE 5. The system parameters of the lidar system.
Figure 10 shows the extinction coefficients at wavelengths of 1,064, 532, and 355 nm at 21:22 Beijing time on 7 April 2021, as well as the Ångström exponent distributions, aerosol PSDs inverted from the NSGA-II algorithm, effective radius profile of the aerosol particles. It was a sunny on that day.
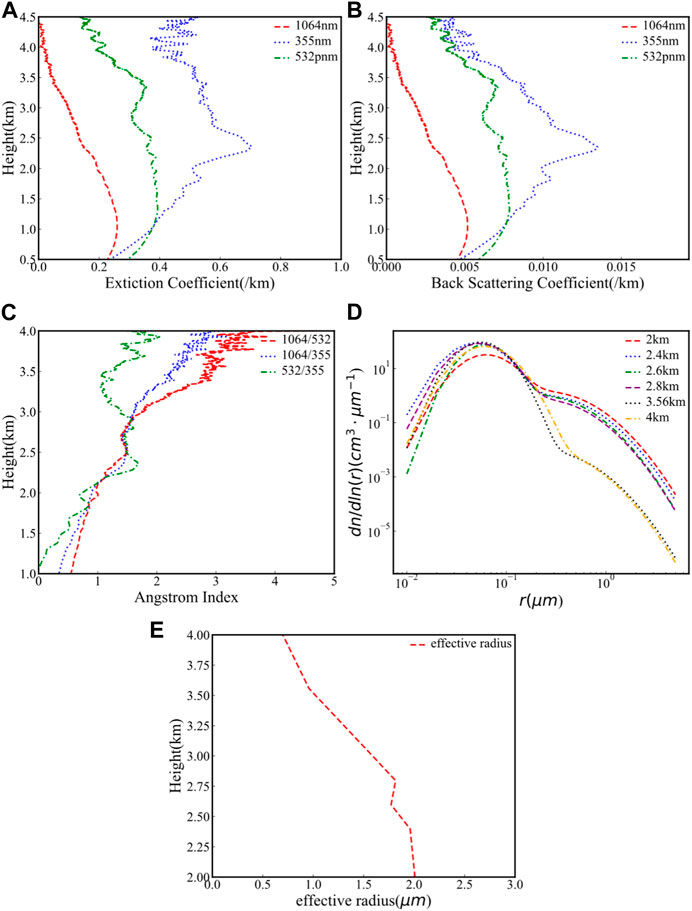
FIGURE 10. The extinction coefficients at different wavelengths at 21:22 Beijing time on 7 April 2021, as well as the Ångström exponential distributions, aerosol PSDs inverted from NSGA-II algorithm. (A) The extinction coefficients at 532, 355, and 1064 nm wavelengths; (B) the Backscattering coefficients at 532, 355, and 1,064 nm wavelengths; (C) the Ångström exponent profiles with 1,064/355, 1,064/532, 532/355; (D) the PSD at different heights inverted by the NSGA-II inversion; (E) the effective radius profile plot of the aerosol particles.
In Figure 10C, the Ångström index at 532/355, 1,064/355, and 1,064/532 from 2 to 2.6 km, 3.3–4 km all increase, so under the lower troposphere, the number of fine particlesincreases with height, and the number of coarse particles decreases with height.
In Figure 10D, when the particle radius is 0.03 < r < 0.1 μm, the aerosol PSD at 2.6 km described by the green curve above the red curve indicates that the number of fine particles is greater than that at 2 km, which is consistent with the conclusion obtained according to the Ångström index above. When the particle radius is 0.07 < r < 0.3 μ m, the aerosol PSD at 4 km of the orange curve above the black curve is indicated the number of fine particles is greater than that at 3.56 km. At r > 1 μ m, the PSDs at 3.56 km and 4 km are less than those at 2, 2.4, 2.6, and 2.8 km, respectively, indicating that the number of coarse particles at 2, 2.4, 2.6 and 2.8 km are all greater than those at 3.56 km and 4 km, which is also consistent with the conclusion.
In Figure 10E, it is obvious that the effective radius of the aerosol particles from 2 km to 4 km is constantly decreasing, which is consistent with the increasing trend of the Ångström index.
Figure 11 shows the extinction coefficients at wavelengths of 1,064, 532, and 355 nm at 21:43 Beijing time on 22 August 2022, as well as the Ångström exponent distributions, aerosol PSDs inverted from the NSGA-II algorithm, effective radius profile of the aerosol particles and depolarization ratio profile at different heights. It was cloudy on that day.
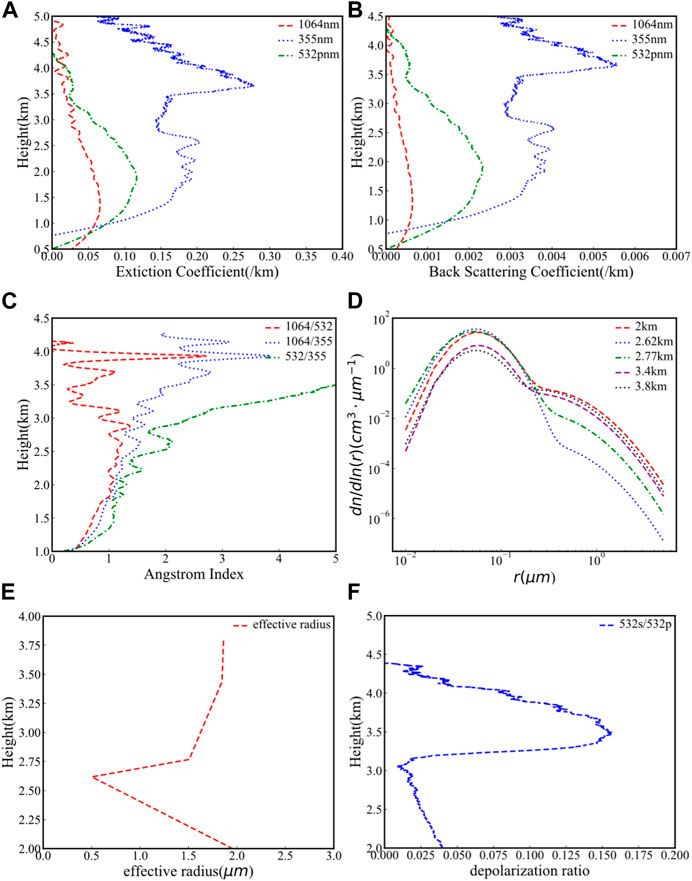
FIGURE 11. The extinction coefficients, PSDs obtained by the NSGA-II inversion and depolarization ratio profile at different heights at 21:43 Beijing on 22 August 2022. (A) The extinction coefficients at 532, 355, and 1064 nm wavelengths; (B) the Backscattering coefficients at 532, 355, and 1,064 nm wavelengths; (C) the Ångström exponent profiles with 1,064/355, 1,064/532, 532/355; (D) the PSD at different heights inverted by the NSGA-II inversion; (E) Effective radius profile plot of the aerosol particles; (F)the depolarization ratio profile calculated from the 532s and 532p channel.
The type of cloud can be preliminarily judged according to the depolarization ratio. Sassen et al. found that the depolarization ratio of water clouds was less than 0.15, and the depolarization ratio of ice-water mixed clouds was between 0.15 and 0.5 (Sassen et al., 1992). From the depolarization ratio profile shown in Figure 11F, there are water clouds at 2.8–4 km. Figure 11C also shows the increasing 1,064/355 Ångström exponent at 2.8–4 km, indicating the coarse particles increase. This further confirms the presence of water clouds at 2.8–4 km. In Figure 11A, the extinction coefficient at 3.8 km is the largest, and in Figure 11D, the number concentration of aerosol at this height with radius greater than 0.2 μm is also the largest (similar to 2 km). From Figure 11E, the effective radius of aerosol particles decreases firstly and then increases significantly after the cloud layer. The depolarization ratio profile, extinction profile and Ångström exponent profile all reflect the accuracy of the inversion trend of the effective radius of aerosol particles.
Figure 12 shows the extinction coefficient, Ångström exponent, PSDs, and effective radius of aerosol particle under dusty weather conditions on 15 March 2021. Due to the dusty weather, in Figure 12C, the Ångström exponent of 1,064/355 and 1,064/532 is decreasing at height 3–3.5 km, while in Figure 12E the aerosol particle effective radius at same height is increasing, which is consistent with Ångström exponent.
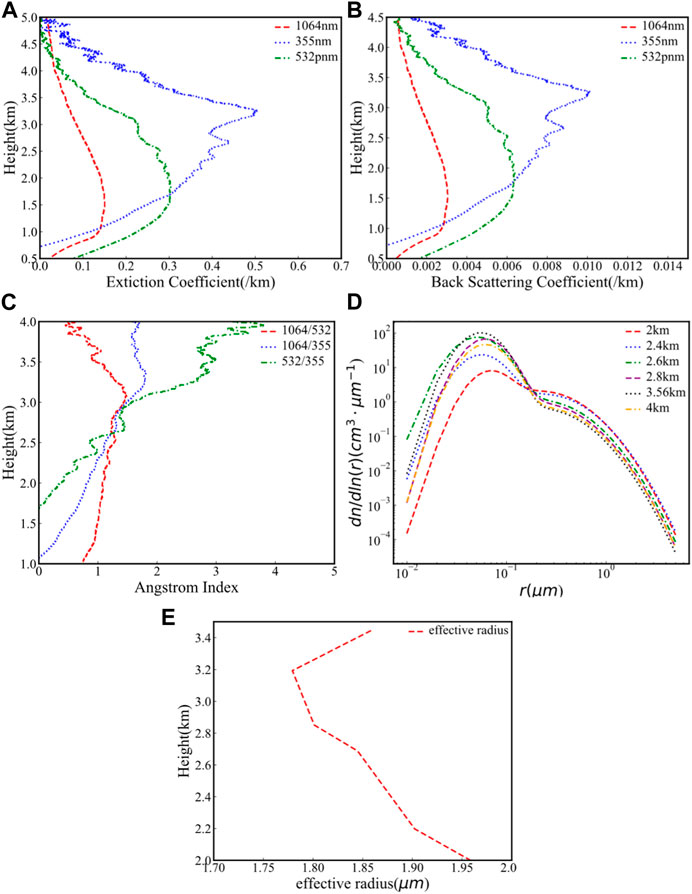
FIGURE 12. The extinction coefficients, backscattering coefficients, Ångström exponent, PSDs and effective radius profile on the condition of dusty weather on 15 March 2021. (A) The extinction coefficients at 532, 355, and 1064 nm wavelengths; (B) the Backscattering coefficients at 532, 355, and 1,064 nm wavelengths; (C) the Ångström exponent profiles with 1,064/355, 1,064/532, 532/355; (D) the PSD at different heights inverted by the NSGA-II inversion; (E) the effective radius profile plot of the aerosol particles.
Figure 13 shows the extinction coefficient, Ångström exponent, PSD, effective radius and color ratio of aerosol particles under dust weather at 02:20 on 16 March 2021. By comparison, the backscattering coefficient of 1,064 nm in Figure 13 is greater than that in Figure 11, and the number concentration of aerosol particles in Figure 13 is much more than that in Figure 11 Moreover, in Figure 13D, the color ratio above 1.6 km ranges from 0.4 to 0.8, consistent with the range of 0.35–1.5 observed for dust aerosol. In Figure 13F there is a small rise at the height of 2.8–3.2 km. In Figure 13C, there is a significant decrease for 1,064/532 Ångström exponent. In Figure 13E, the effective radius of the aerosol particles at the height of 2.8–3.2 km increases slightly.
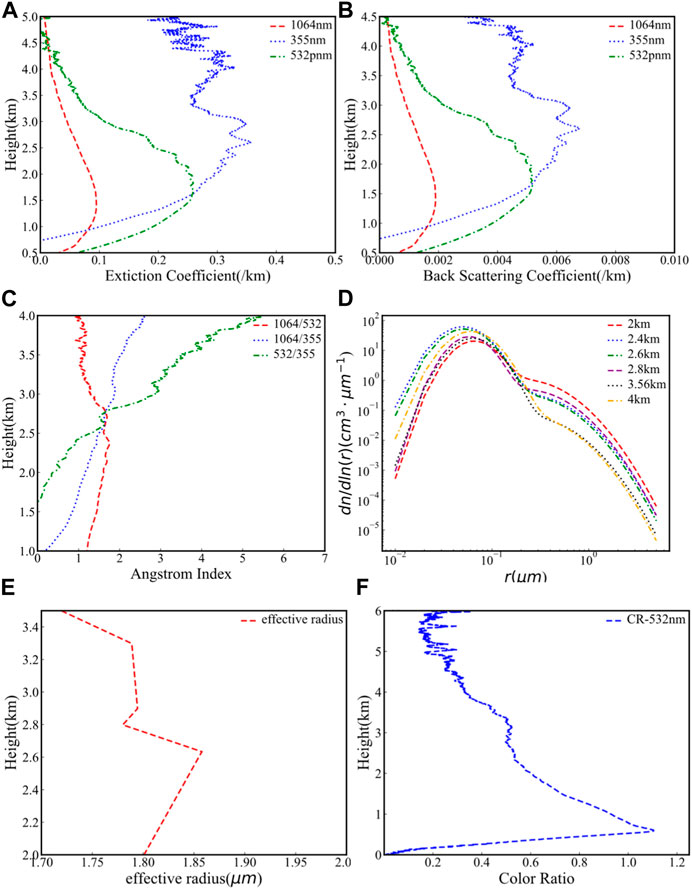
FIGURE 13. The PSDs, extinction coefficients and color ratio profile on the condition of dusty weather at 2:20 on 16 March 2021. (A) The extinction coefficients at 532, 355, and 1064 nm wavelengths; (B) the Backscattering coefficients at 532, 355, and 1,064 nm wavelengths; (C) the Ångström exponent profiles with 1,064/355, 1,064/532, 532/355; (D) the PSD at different heights inverted by the NSGA-II inversion; (E) the effective radius profile of the aerosol particles; (F) the color ratio profiles.
If the five objective functions are linearly weighted and a comprehensive effect function is used to represent the objective of the overall optimization, the solution corresponding to the optimal effect function is considered the optimal solution of the problem, so that the multi-objective optimization problem is transformed into a single objective optimization problem. The MPGA and SGA inversion algorithms use this model. The feature of this model is that the RE of the overall objective function is small, but it is not guaranteed that the relative REs of the five optical parameters are small at the same time. In the actual inversion process, the RE of extinction coefficient at 1,064 nm is always too high. However, the NSGA-II algorithm can balance the RE of the five optical parameters to a certain extent.
For better comparison, the best settings of the three intelligent algorithms listed in Table 2 are used. Figure 14A shows the PSDs at 1.6 km retrieved by the three intelligent algorithms on 8 April 2021. In Figure 14A, the number concentration inverted from the three algorithms are close to each other at a radius greater than 1 μm, but there are great differences at a radius from 0.02 to 1 μm. In Figure 14B, the RE of the 1,064 nm extinction coefficient is relatively large, while the REs of the extinction coefficient of 355, 532 nm and the backscattering coefficient of 355 nm are particularly small. This inversion result is not what we need. Generally, if the RE of all objective functions are close to each other, that the inversion result will be closer to the real value.
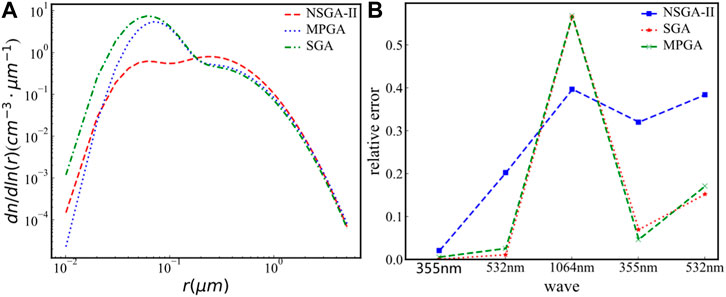
FIGURE 14. The PSDs and REs on 8 April 2021. (A) The PSDs at 1.6 km retrieved by the three intelligent algorithms; (B) the REs of five optical parameters.
In this paper, the dispersion degree of error is taken as the main evaluation reference, including the objective function J (itself is the absolute error with the experimental observation value), the RE, the range of the RE (ED), the standard deviation (SD) and the dispersion coefficient (COV).
where,
Here, the ED, SD, and COV are all used to evaluate the dispersion degree of the overall distribution of the RE. Table 6 lists the REs of the five optical parameters for the three inversion algorithms. The dispersion degree of the RE of MPGA and SGA is much larger than that of NSGA-II in terms of ED, SD, and COV. The REs of the five optical parameters of NSGA-II inversion are relatively closer. Table 7 lists the RE of the total objective function linearly accumulated by the five objective functions, it can be seen that the total RE of the three inversion algorithms is not much different, compared with SGA and MPGA, NSGA-II algorithm has a smaller RE. Therefore, NSGA-II has certain advantages over SGA and MPGA in the inversion of aerosol PSD.
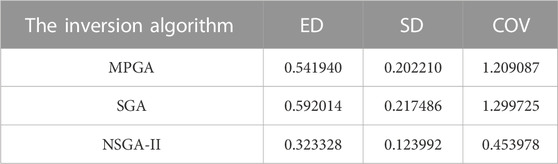
TABLE 6. The REs of the five optical parameters for the three inversion algorithms.

TABLE 7. REs of the total objective function of the three inversion algorithms.
For retrieving PSD, namely, solving the Fredholm integral equation of the first kind, the regularization method is easy to be affected by the noise contained in the signal, which often leads to the solution failure. The SGA and MPGA cannot balance the optical error of each channel well, but the multi objective genetic algorithm NSGA-II can balance the optical error of each channel comprehensively.
In this study, a novel PSD retrieval method based on the NSGA-II algorithm was proposed for multi-wavelength lidar using 3β+2α data, and some simulations and experiments were carried out for verifying the proposed algorithm. In the error simulation experiment, the different errors are superimposed on the input optical data, ranging from 0% to 35%. From inversion results, the PSD retrieved by the NSGA-II algorithm has obvious advantages over that retrieved by MPGA and SGA algorithms. Some experiments were performed to invert PSD under different weather conditions, including sunny days, cloudy days, and dusty days, the results show that the PSD inversion based on the NSGA-II algorithm is feasible. Moreover, In error analysis of the experimental results, NSGA-II is superior to SGA and MPGA in the balance of REs of multiple optical channels. It should be pointed out that the assumption of lidar ratios may produce relatively large uncertainty when using the Fernald method. In our future work, we plan to reduce this uncertainty. Furthermore, our results still need to be calibrated against field data measured by other equipment or instruments.
The original contributions presented in the study are included in the article/supplementary material, further inquiries can be directed to the corresponding author.
Conceptualization, JM; Data curation, JB; Funding acquisition, JM; Methodology, JM; Project administration, JM; Resources, JB and LQ; Software, JB; Supervision, JM; Validation, JB and XG; Writing—Original draft, JB. All authors listed have made a substantial, direct, and intellectual contribution to the work and approved it for publication.
This work was supported by the National Natural Science Foundation of China (Nos 42,265,009 and 42,005,103) the Natural Science Foundation of Ningxia Province (No. 2021AAC02021), the Plan for Leading Talents of the State Ethnic Affairs Commission of the People’s Republic of China, Innovation Team of Lidar Atmosphere Remote Sensing of Ningxia Province, the high-level talent selection and training plan of North Minzu University, the special funds for basic scientific research business expenses of central universities of North Minzu University (No. FWNX20), and the Ningxia First-Class Discipline and Scientific Research Projects (Electronic Science and Technology) (No. NXYLXK 2017A07).
The authors declare that the research was conducted in the absence of any commercial or financial relationships that could be construed as a potential conflict of interest.
All claims expressed in this article are solely those of the authors and do not necessarily represent those of their affiliated organizations, or those of the publisher, the editors and the reviewers. Any product that may be evaluated in this article, or claim that may be made by its manufacturer, is not guaranteed or endorsed by the publisher.
Albrecht, B. A. (1989). Aerosols, cloud microphysics, and fractional cloudiness. Sci. (New York, NY) 245 (4923), 1227–1230. doi:10.1126/science.245.4923.1227
Carslaw, K. S., Boucher, O., Spracklen, D. V., Mann, G. W., Rae, J. G. L., Woodward, S., et al. (2010). A review of natural aerosol interactions and feedbacks within the Earth system. Atmos. Chem. Phys. 10 (4), 1701–1737. doi:10.5194/acp-10-1701-2010
Chemyakin, E., Burton, S., Kolgotin, A., Muller, D., Hostetler, C., and Ferrare, R. (2016). Retrieval of aerosol parameters from multiwavelength lidar: Investigation of the underlying inverse mathematical problem. Appl. Opt. 55 (9), 2188–2202. doi:10.1364/ao.55.002188
Chen, Q., Yuan, Y., Huang, X., He, Z., and Tan, H. (2018). Assessment of column aerosol optical properties using ground-based sun-photometer at urban Harbin, Northeast China. J. Environ. Sci. 74, 50–57. doi:10.1016/j.jes.2018.02.003
Dubovik, O., Holben, B. N., Eck, T. F., Smirnov, A., Kaufman, Y. J., King, M. D., et al. (2002). Variability of absorption and optical properties of key aerosol types observed in worldwide locations. J. Atmos. Sci. 59, 590–608. doi:10.1175/1520-0469(2002)059<0590:voaaop>2.0.co;2
Guo, J., Zhao, H., Xie, Q., Liu, Y., Ma, X., and Qiao, Z. Editors (2021). The tikhonov regularization method improved by genetic algorithm is used to retrieve the non-spherical particle spectral distribution, in 16th IEEE Conference on Industrial Electronics and Applications (ICIEA) (Chengdu, PEOPLES R CHINA.
Holben, B. N., Eck, T. F., Slutsker, I. A., Tanré, D., Buis, J. P., Setzer, A., et al. (1998). AERONET—a federated instrument network and data archive for aerosol characterization. Remote Sens. Environ. 66 (1), 1–16. doi:10.1016/s0034-4257(98)00031-5
Lolli, S. (2021). Is the air too polluted for outdoor activities? Check by using your photovoltaic system as an air-quality monitoring device. Sensors 21 (19), 6342. doi:10.3390/s21196342
Lv, M., Wang, Z., Li, Z., Luo, T., Ferrare, R., Liu, D., et al. (2018). Retrieval of cloud condensation nuclei number concentration profiles from lidar extinction and backscatter data. J. Geophys. Research-Atmospheres 123 (11), 6082–6098. doi:10.1029/2017jd028102
Mao, J., Zhao, H., Sheng, H., and Zhou, C. (2016). Particle size distributions based on a multipopulation genetic algorithm used in multiwavelength lidar. J. Russ. Laser Res. 37, 69–81. doi:10.1007/s10946-016-9546-z
Mao, J., and Li, J. (2014). Dust particle size distribution inversion based on the multi population genetic algorithm. Terr. Atmos. Ocean. Sci. 25, 791. doi:10.3319/tao.2014.06.12.01(a)
Mao, J., Zhao, H., Sheng, H., and Zhou, C. (2016). Particle size distributions based on a multipopulation genetic algorithm used in multiwavelength lidar. J. Russ. Laser Res. 37 (1), 69–81. doi:10.1007/s10946-016-9546-z
Muller, D., Wandinger, U., and Ansmann, A. (1999). Microphysical particle parameters from extinction and backscatter lidar data by inversion with regularization: Theory. Appl. Opt. 38 (12), 2346–2357. doi:10.1364/ao.38.002346
Muller, H., and Quenzel, H. (1985). Information content of multispectral lidar measurements with respect to the aerosol size distribution. Appl. Opt. 24 (5), 648. doi:10.1364/ao.24.000648
Paramonov, M., Aalto, P. P., Asmi, A., Prisle, N., Kerminen, V. M., Kulmala, M., et al. (2013). The analysis of size-segregated cloud condensation nuclei counter (CCNC) data and its implications for cloud droplet activation. Atmos. Chem. Phys. 13 (20), 10285–10301. doi:10.5194/acp-13-10285-2013
Querol, X., Alastuey, A., Viana, M., Moreno, T., Reche, C., Cruz Minguillón, M., et al. (2013). Variability of carbonaceous aerosols in remote, rural, urban and industrial environments in Spain: Implications for air quality policy. Atmos. Chem. Phys. 13, 6185–6206. doi:10.5194/acp-13-6185-2013
Sannino, A., Amoruso, S., Damiano, R., Scollo, S., Sellitto, P., and Boselli, A. (2022). Optical and microphysical characterization of atmospheric aerosol in the Central Mediterranean during simultaneous volcanic ash and desert dust transport events. Atmos. Res. 271, 106099. doi:10.1016/j.atmosres.2022.106099
Sassen, K., Zhao, H., and Dodd, G. C. (1992). Simulated polarization diversity lidar returns from water and precipitating mixed phase clouds. Appl. Opt. 31, 15.
Sellitto, P., Spampinato, L., Salerno, G. G., and La Spina, A. (2018). Aerosol optical properties of pacaya volcano plume measured with a portable sun-photometer. Geosciences 8 (2), 36. doi:10.3390/geosciences8020036
Sitarek, S., Stacewicz, T., and Posyniak, M. (2016). Software for retrieval of aerosol particle size distribution from multiwavelength lidar signals. Comput. Phys. Commun. 199, 53–60. doi:10.1016/j.cpc.2015.08.024
Tan, W., Zhao, G., Yu, Y., Li, C., Li, J., Kang, L., et al. (2019). Method to retrieve cloud condensation nuclei number concentrations using lidar measurements. Atmos. Meas. Tech. 12 (7), 3825–3839. doi:10.5194/amt-12-3825-2019
Veselovskii, I., Kolgotin, A., Griaznov, V., Muller, D., Franke, K., and Whiteman, D. N. (2004). Inversion of multiwavelength Raman lidar data for retrieval of bimodal aerosol size distribution. Appl. Opt. 43 (5), 1180–1195. doi:10.1364/ao.43.001180
Wang, T., Han, Y., Hua, W., Tang, J., Huang, J., Zhou, T., et al. (2021). Profiling dust mass concentration in Northwest China using a joint lidar and sun-photometer setting. Remote Sens. 13, 1099. doi:10.3390/rs13061099
Wang, T., Han, Y., Huang, J., Sun, M., Jian, B., Huang, Z., et al. (2020). Climatology of dust-forced radiative heating over the Tibetan Plateau and its surroundings. J. Geophys. Res. Atmos. 125, e2020JD032942. doi:10.1029/2020jd032942
Wang, T., Tang, J., Sun, M., Liu, X., Huang, Y., Huang, J., et al. (2021). Identifying a transport mechanism of dust aerosols over south asia to the Tibetan plateau: A case study. Sci. Total Environ. 758, 143714. doi:10.1016/j.scitotenv.2020.143714
Xue, L., Mao, J., Li, J., Wang, Q., and Zhang, Y. (2021). Analysis of aerosol optical and microphysical characteristics over Yinchuan (China) in 2019. Int. J. Remote Sens. 42 (18), 7075–7100. doi:10.1080/01431161.2021.1953716
Keywords: aerosol, multi-wavelength lidar, particle size distribution, multi-objective genetic algorithm, NSGA-II
Citation: Bao J, Qi L, Mao J and Gong X (2023) Retrieval of particle size distribution based on a multi-objective genetic algorithm for multi-wavelength lidar. Front. Environ. Sci. 11:1136411. doi: 10.3389/fenvs.2023.1136411
Received: 03 January 2023; Accepted: 09 May 2023;
Published: 18 May 2023.
Edited by:
Longlei Li, Cornell University, United StatesReviewed by:
Simone Lolli, National Research Council (CNR), ItalyCopyright © 2023 Bao, Qi, Mao and Gong. This is an open-access article distributed under the terms of the Creative Commons Attribution License (CC BY). The use, distribution or reproduction in other forums is permitted, provided the original author(s) and the copyright owner(s) are credited and that the original publication in this journal is cited, in accordance with accepted academic practice. No use, distribution or reproduction is permitted which does not comply with these terms.
*Correspondence: Jiandong Mao, bWFvX2ppYW5kb25nQDE2My5jb20=
Disclaimer: All claims expressed in this article are solely those of the authors and do not necessarily represent those of their affiliated organizations, or those of the publisher, the editors and the reviewers. Any product that may be evaluated in this article or claim that may be made by its manufacturer is not guaranteed or endorsed by the publisher.
Research integrity at Frontiers
Learn more about the work of our research integrity team to safeguard the quality of each article we publish.