 Mahesh Chand Singh1*
 Koyel Sur
 Nadhir Al-Ansari
 Anurag Malik
- 1Department of Soil and Water Engineering, Punjab Agricultural University, Ludhiana, Punjab, India
- 2Punjab Remote Sensing Centre, Ludhiana, Punjab, India
- 3Civil, Environmental and Natural Resources Engineering, Lulea University of Technology, Lulea, Sweden
- 4Institute of Human Development, Eastern Regional Centre, Ranchi, India
- 5Punjab Agricultural University, Regional Research Station, Bathinda, Punjab, India
Land degradation has become one of the major threats throughout the globe, affecting about 2.6 billion people in more than 100 countries. The highest rate of land degradation is in Asia, followed by Africa and Europe. Climate change coupled with anthropogenic activities have accelerated the rate of land degradation in developing nations. In India, land degradation has affected about 105.48 million hectares. Thus, modeling and mapping soil loss, and assessing the vulnerability threat of the active erosional processes in a region are the major challenges from the land and water conservation aspects. The present study attempted rigorous modeling to estimate soil loss from the Banas Basin of Rajasthan state, India, using GIS-integrated Revised Universal Soil Loss Equation (RUSLE) equation. Priority ranking was computed for different watersheds in terms of the degree of soil loss from their catchments, so that appropriate conservation measures can be implemented. The total area of Banas basin (68,207.82 km2) was systematically separated into 25 watersheds ranging in area from 113.0 to 7626.8 km2. Rainfall dataset of Indian Meteorological Department for 30 years (1990–2020), FAO based Soil map for soil characterization, ALOS PALSAR digital elevation model for topographic assessment, and Sentinal-2 based land use and land cover map were integrated for modeling and mapping soil erosion/loss risk assessment. The total annual soil loss in the Banas basin was recorded as 21,766,048.8 tons. The areas under very low (0–1 t ha-1 year-1), low (1–5 t ha-1 year-1), medium (5–10 t ha-1 year-1), high (10–50 t ha-1 year-1) and extreme (>50 t ha-1 year-1) soil loss categories were recorded as 24.2, 66.8, 7.3, 0.9, and 0.7%, respectively, whereas the respective average annual soil loss values were obtained as 0.8, 3.0, 6.0, 23.1, and 52.0 t ha-1 year-1. The average annual soil loss among different watersheds was recorded in the range of 1.1–84.9 t ha-1 year-1, being highest (84.9 t ha-1 year-1) in WS18, followed by WS10 (38.4 t ha-1 year-1), SW25 (34.7 t ha-1 year-1) and WS23 (17.9 t ha-1 year-1), whereas it was lowest for WS8 (1.1 t ha-1 year-1). Thus, WS18 obtained the highest/top priority rank in terms of the average annual soil loss (84.9 t ha-1 year-1) to be considered as the first priority for land and water conservation planning and implementation. The quantitative results of this study would be useful for implementation of land and water conservation measures in the problematic areas of the Banas basin for controlling soil loss through water erosion.
1 Introduction
Land and water resources are vital for the sustainable management of the ecosystem (Prăvălie, 2021). Damage of top soil can reduce soil fertility leading to threat and food security (Pal et al., 2021). Land degradation has become one of the serious threats across the globe in terms of decreasing agricultural productivity, reducing soil health, depleting groundwater storage, a capacity loss of reservoirs due to silt inflow, worsening water quality, poverty and distorting ecological balance (Sur and Chauhan, 2019; Eniyew et al., 2021; Kaur et al., 2022). Globally, around 85% of degraded land is causing a 17% decline in crop yield (Borrelli et al., 2020). As per the global climatic projection, disruption in the hydrological cycle is continuously magnifying the problem of land degradation (Ahmad et al., 2020), which in turn intensifies the scale of soil erosion through the water as one of the agent from 30% to 66% (Sharda and Ojasvi, 2016). As per Global Soil Partnership reports of the Food and Agriculture Organization (FAO), about 75 billion tons of soil are at high risk of erosion every year from productive agricultural lands across the globe, which may result in an estimated financial loss of 400 billion US Dollar per year (Kayet et al., 2018).
Land degradation is a major challenge in Asia, where about 663 Mha of the total area is affected by soil erosion and is highest when compared to other continents (Rao et al., 2016). In India, the soil loss is estimated to be 1,559 Mg km-2 year-1 (Reddy, 2003). About 1,100 Mha of land is affected by rainwater erosion, whereas about 550 Mha is affected by wind erosion in India (Dubey and Sharma, 2018; Kumar et al., 2022). Soil erosion accelerated by water and wind affect the production (≈7.2 million tons) of the staple crops, which in turn results in a reduction of GDP in the country by about 1.0%–1.7% (Lal, 2019). This affects the socioeconomic status of the country negatively (Dubey and Sharma, 2018). Previously, Reddy (Reddy, 2003) reported a loss of about 74 million tons of key nutrients in the soil due to soil erosion. From the above facts, it is clear that the systematic assessment of soil erosion is the key solution to saving the Earth’s surface from land degradation.
Banas basin drains into Banas river, which is one of the main tributaries of Chambal. It is located in the South-Eastern part of Rajasthan state of India. It is one of the most crucial sites because it falls under five types of climate zones viz. Semi-arid eastern plains, flood-prone Eastern plains, sub-humid Southern plains, humid Southern plains, and humid South-Eastern plains (Chahar and Dhaka, 2013). Banas River remains almost dry in the summer season, as it is a rain-fed river. Major parts of the Banas River Basin have low rainfall and high evapotranspiration rate, leading to a decrease in soil moisture, which affects plant growth ultimately causing low production of biomass (Pham et al., 2018).
For effective implementation of land and water conservation practices in a watershed, the assessment of soil loss through water erosion and its spatial distribution is significant. In past, numerous empirical and physical models viz. USLE: universal Soil Loss Equation (Park et al., 2011), RUSLE: Revised universal Soil Loss Equation (Tiwari et al., 2000; Ouyang et al., 2010), WEPP: Watershed Erosion Prediction Project (Beasley et al., 1980), SWAT: Soil and Water Assessment Tool (Gosain et al., 2009), ANSWERS: Areal Non-Point Source Watershed Environment Response Simulation (Angima et al., 2003), European Soil Erosion Model, Rule Based Expert System, Hybrid Approach, Sediment Concentration Graph, Renard–Laursenn Model, Unit Sediment Graph, and Instantaneous Unit Sediment Graph (24) have been used for predicting soil loss through water erosion. The empirical models significantly reduce the inputs, and therefore commonly applied for predicting soil loss through water erosion. Whereas, the physical models use non-linear partial differential equations for representing several hydrological processes and involve huge input data (Abdelwahab et al., 2018). Within the above-mentioned models for predicting soil loss through water erosion, RUSLE is the most widely applied empirical model for assessing soil erosion rate/loss. This model computes the soil loss in relation to the prevailing climatic conditions and several features of a watershed (Boufala et al., 2020).
Several authors have tested the performance of RUSLE with other models (Tiwari et al., 2000; Mondal et al., 2016; Chen et al., 2019; Safwan et al., 2021). Tiwari et al. (Tiwari et al., 2000) reported statistically similar results of soil loss using RUSLE and WEPP models. While comparing the performance of the USLE, RUSLE, and WEPP models, Ubierna et al. (Tiwari et al., 2000) reported soil loss estimates of the RUSLE model very close to the actual data. Recently, Safwan et al. (Safwan et al., 2021) also confirmed a good agreement in the soil loss results of RUSLE with the WEPP model. While testing the performance of USLE, RUSLE, and modified Morgan-Morgan-Finney (MMF) models, Mondal et al. (Mondal et al., 2016) also reported the soil loss data of the RUSLE model in close agreement with the actual data. Later on, Abdelwahab et al. (Abdelwahab et al., 2018) reported the soil loss results of RUSLE quite closer to that obtained using SWAT and Agricultural non-point source pollution (AGNPS). Similarly, Boufala et al. (Boufala et al., 2020) confirmed a close agreement in the soil loss results of RUSLE and SWAT models. Thus, it can be said that the RUSLE model, which is as good as WEPP and SWAT models should be integrated with the GIS platform for precise estimation of soil loss. This would be a time-and labor-efficient approach to estimating erosion rate or soil loss from a large area.
Nowadays, remote-sensing and geographic information systems (GIS) are being widely applied for identifying areas susceptible to water erosion and estimating soil erosion. A hydrological model when jointly used with remote sensing and GIS techniques offers great potential in identifying the erosion-prone hotspots, spatial spread of erosion, and estimating soil loss. Remote sensing and GIS applications have made it possible to estimate erosion from a large expanse in a smaller period of time. A digital elevation model (DEM) is useful for extracting the topographical features viz. Slope, flow direction, flow accumulation, and drainage networking of a watershed for assessing the soil loss through water erosion (Mondal et al., 2016). The Remote Sensing and GIS-coupled application of RUSLE is a cost-effective and can be applied over a large area with improved consistency.
RUSLE when combined with GIS, helps to identify the erosion-prone hotspots, predict the cell-by-cell soil erosion/loss, and prioritize the sub-watersheds in a big watershed in relation to the amount of soil loss from their catchments (Chen et al., 2019). The integrated applications of RUSLE with the GIS platform have already been made in past (Renard et al., 1991; Sharma, 2010; Ranzi et al., 2012; Wijesundara et al., 2018; Thapa, 2020). While estimating soil erosion through the integration of RUSLE with the GIS platform, Farhan et al. (Farhan et al., 2014) reported about 31.2% area of the WadiKufranja watershed in Jordan was under severe erosion. Similarly, using RUSLE and GIS jointly, Marondedze and Schütt (Marondedze and Schütt, 2020) reported about 40% of the Epworth district of Zimbabwe is under severe soil erosion. Recently, Amellah and Morabiti (Amellah and El Morabiti, 2021) also used RUSLE jointly with remote sensing and GIS for identifying erosion-prone zones and estimating the soil loss in the OuedLaou basin, Morocco. Using RUSLE and the GIS platform jointly, Srinivasan et al. (Srinivasan et al., 2021) reported about 8.9, 55.0, and 35.0% of areas under severe, medium, and low erosion risk, respectively, in Deccan Plateau, India. Pal and Chakrabortty (2019a); Pal and Chakrabortty (2019b) reported a strong correlation between amount of actual soil loss on ground and estimated soil loss by RUSLE.
Banas River has a length of about 512 km. It is the most important river, as it is one of the major natural water supply sources of arid Rajasthan. It provides water to the entire forest land of Rajasthan, therefore often referred to as “Van ki Asha” by local people. The soil loss through water erosion from the upstream ends of a watershed may adversely affect the storage capacities of the water bodies (dams or reservoirs) located in the downstream areas in relation to silt inflow or sedimentation. Thus, it becomes imperative to assess the soil loss from a watershed for implementation of appropriate land and water conservation measures starting from the area/watershed of the highest priority rank. However, no effort has been made in past to estimate the soil loss from the Banas basin and identify the most water-erosion-affected zones. Thus, the present study was undertaken with the objectives 1) to estimate the soil loss from twenty-five watersheds of Banas Basin (comprising fourteen districts) in Rajasthan state, 2) to study the spatial distribution of soil erosion/loss, and 3) to perform prioritization of the watersheds for implementing land and water conservation practices starting from areas with higher priority in terms of soil erosion/loss.
2 Materials and methods
2.1 Brief description of the study area
The Banas River Basin is located between 24° and 27° N latitude and 73°–77° E longitude in the East South-Central region of Rajasthan (Mundetia et al., 2018; Sharma et al., 2018). Banas River is also colloquially named “Van Ki Asha”. The Banas River is seasonal and often remains dry in the summer months. It has a tropical type of climate. The average maximum and minimum temperature in summer are 40°C and 25.8°C, respectively, whereas in winter the maximum and minimum values are 22°C and 8.3°C, respectively (Everard et al., 2018). The Banas River Basin receives an average annual rainfall of 637 mm compared to all India’s average of 1,100 mm. The humidity level reaches the level of 90% during the monsoon month. It is a major tributary of the Chambal River, which is also a tributary of the Ganga River. The total catchment area (Figure 1) of Banas River Basin is 68207.82 km2and the river has a length of about 512 km and flows entirely within Rajasthan. The Banas River Basin covers 14 districts namely Sikar, Jaipur, Ajmer, Nagaur, Rajsamand, Chittaurgarh, Bundi, Sawai Madhopur, Bhilwara, Dausa, Udaipur, Tonk, Neemuch, and Karauli (Dubey et al., 2015).
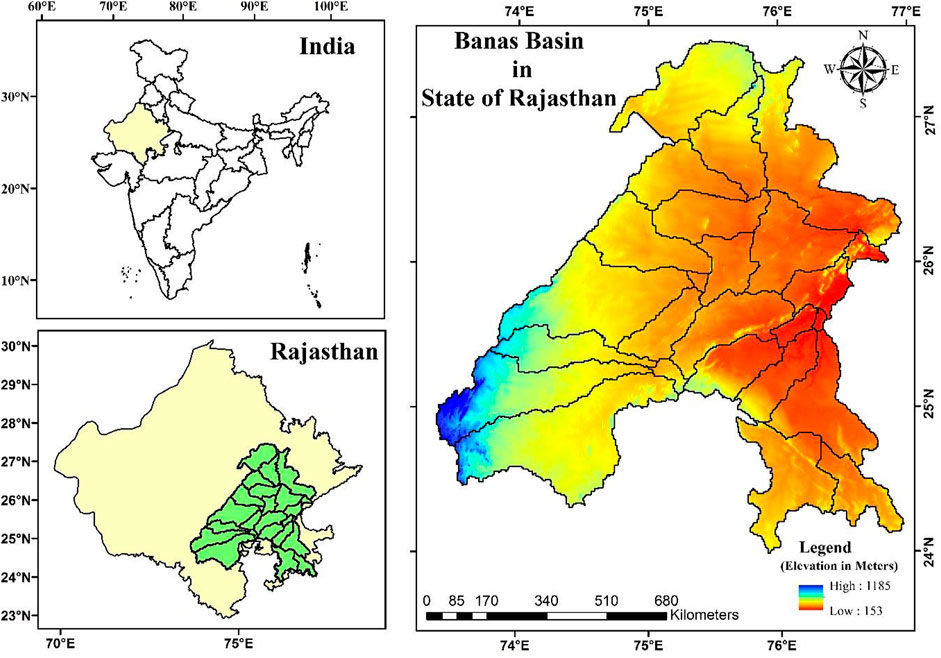
FIGURE 1. Study area map.
2.2 Watershed delineation
The Banas basin of Rajasthan state was demarcated into 25 watersheds by defining their outlet points (pour points) at appropriate places.
2.3 Data collection
The station rainfall data for the 31 years (1990–2020) of the study region was obtained from the Indian Meteorological Department (IMD) for computing rainfall erosivity index/factor. Soil data of 30 arcs second resolution for the year 2012 of FAO was used for computing soil erodibility index/factor. For the computation of the slope length-steepness factor (LS), the elevation data of 12.5 m-spatial resolution for the year 2021 was used. For the computation of support/conservation practices factor p), LULC data of 10 m spatial resolution using Sentinal-2A Google Earth Engine for the year 2021 was used as mentioned in Table 1.
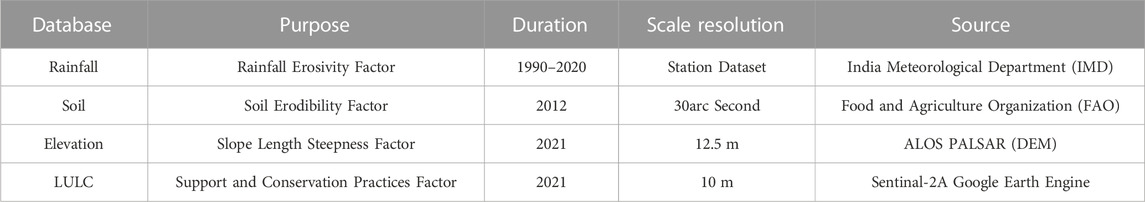
TABLE 1. The database used for estimating soil loss using the RUSLE model.
2.3.1 Land use land cover (LULC) of banas basin
Sentinal-2A based Google Earth Engine product of 10 m-spatial resolution was used for LULC analysis of the Banas basin. The LULC of the study area was categorized into eight classes viz. Forest, shrubland, grassland, cropland, built-up, barren/sparse vegetation, waterbody, and wetland. The LULC classified map was produced by a deep learning model trained using over 5 billion hand-labeled Sentinel-2 pixels, sampled from over 20,000 sites distributed across all major biomes of the world. The underlying deep learning model was supported by information on 6 bands of Sentinel-2 surface reflectance data: visible blue, green, red, near-infrared, and two shortwave infrared bands (Du et al., 2021). Figure 2 shows the LULC map of the Banas basin. This region has prominent seven classes which distinctly show that the area is an agriculturally dominant area with one big city (Jaipur) in the North and a few small cities in the Southern part. The region is covered by small patches of forest land in the Eastern part. Shrubland is a major class covering apart from agriculture in the region. The spread of scrubland in the region proves that the land is not very fertile and therefore not suitable for cultivation and prone to water and wind erosion.
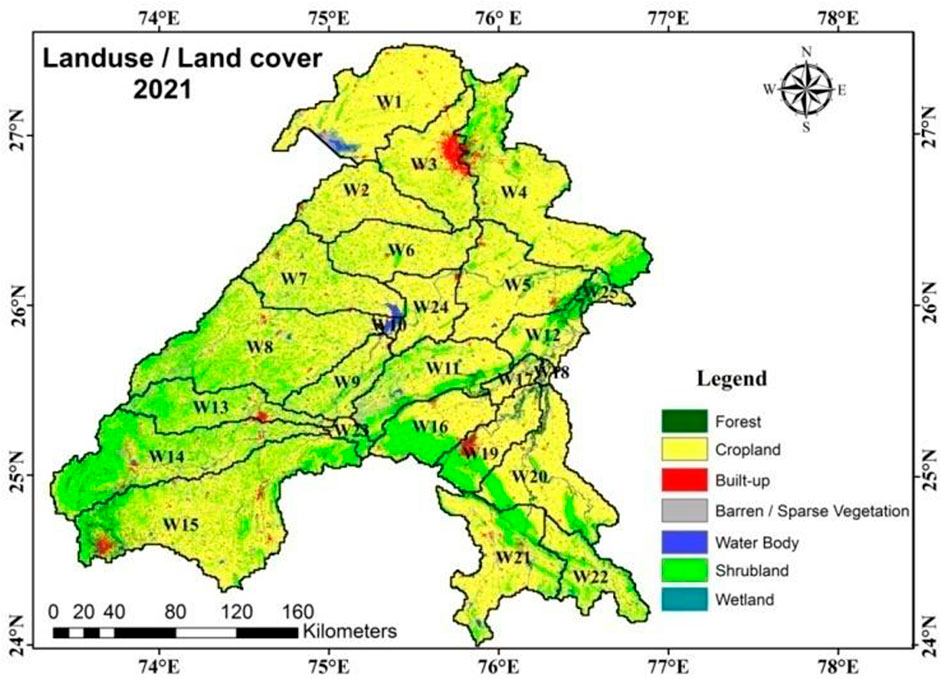
FIGURE 2. LULC map of the Banas basin.
2.3.2 Slope of the basin
Soil erosion/loss is greatly affected by the slope in relation to its direct impact on the hydrological response of the watershed. For a better understanding of the causes of erosion, soil loss, and risk analysis, the topographical data of the watershed is required (Everard et al., 2018). In the present study, the ALOS PALSAR digital elevation model (DEM) of 12.5 m-spatial resolution was used for generating the slope map of the Banas basin in GIS software (Arc GIS Pro 2.8.7).
2.3.3 Estimating parameters of revised universal Soil Loss Equation (RUSLE)
RUSLE is a widely applied empirical model for estimating the average annual soil loss or erosion rate (Sujatha and Sridhar, 2021). Collected datasets were assembled using various data mining techniques coupled with machine learning algorithms to generate thematic layers which served as the input for the RUSLE model (Ruidas et al., 2021; Ruidas et al., 2022a; Ruidas et al., 2022b; Ruidas et al., 2022c; Jaydhar et al., 2022). This model incorporates five factors related to rainfall/precipitation, soil/land, topography/landscape, LULC, and conservation practices. Mathematically, RUSLE is expressed as:
where, A = average annual soil loss (t.ha-1 year-1), R = rainfall erosivity index/factor (MJ.mm.ha-1. h-1 year-1), K = soil erodibility index/factor (t.ha.h.MJ-1 mm-1), LS = slope length and steepness factor (−), C = crop/cover management factor (−), and p = support and conservation practices factor (−).
2.3.4 Rainfall erosivity index/factor (R)
This parameter designates the capability/erosive power of raindrops to detach soil due to high impact force or kinetic energy (Nampak et al., 2018). It has been recognized as the foremost power accountable for higher soil erosion rate/soil loss (Fenta et al., 2016). Here, the mean annual rainfall of 31 years (1990–2020) was utilized for computing R-value using the equation
Where, p = mean annual rainfall (mm).
2.3.5 Soil erodibility index/factor (K)
This index (K value) designates the susceptibility of soil to get erode (Das et al., 2021). It is mainly dependent on the land/soil features, the texture of the soil, organic matter content, and unsaturated hydraulic conductivity. Normally, it varies from 0.0 to 1.0. For the present study, the K value was obtained using the FAO soil map. The soil data of the study site was obtained from a digital soil map of the world published by FAO using GIS software. The textural class of the soil, structural code (S), and permeability (p) were obtained from the soil texture triangle of USDA. As reported by Das et al. (Sujatha and Sridhar, 2021), the K value was obtained using the equation given below:
Where, K = soil erodibility factor (t.ha.h.MJ-1.mm-1), M = particle size parameter (−), OM = organic matter (%), S =soil structure code (1 for very fine granular, 2 for fine granular, 3 for medium and coarse granular, and 4 for blocky, platy or massive), and p = profile permeability class (1 for rapid, 2 for moderate to rapid, 3 for moderate, 4 for slow to moderate, 5 for slow and 6 for very slow).
2.3.6 Slope length steepness factor (LS)
This is a combined factor for indicating the joint effect of slope length (L) and slope steepness (S) on soil erosion rate/soil loss (Amsalu and Mengaw, 2014). The LS factor was appraised using the “flow accumulation” raster, which contains data on the cumulative number of pixels contributing to flow into a specific cell. The flow direction matrix was used for obtaining the flow accumulation matrix. The “flow direction matrix” governs the natural drainage direction/path for all cells in a DEM. On the basis of the low accumulation matrix, the size of each pixel and pixel slope, and LS factor were computed using a raster calculator in GIS based environment. The equation for computing the LS factor as reported by Panagos et al. (Panagos et al., 2015) is given below:
Where, flow accumulation = accumulate dup-slope contributing area for a given cell, cell size = size of a grid cell (i.e., 12.5 m × 12.5 m in the present case), and slope = cell slope (%).
2.3.7 Cover/crop management factor (C)
This parameter governs the effect of LULC on soil erosion rate or soil loss in relation to the kinetic energy and impact of raindrops on land/soil surface (Sujatha and Sridhar, 2018). The crop/plant cover on the ground/land surface prevents splash/raindrop erosion through a reduction in raindrop impact force. It is dependent on plant type, stage of growth, and extent of land use cover. The C-value varies from 0.0 to 1.0. The higher C-value (nearly 1.0) designates a higher vulnerability of the soil to erosion (Ganasri and Ramesh, 2016). Here, the C-value was allocated as per the type of land use as given in Table 2 (USDA, 1972; Marondedze and Schütt, 2020). The map of the C-factor was created by reclassifying the LULC map.
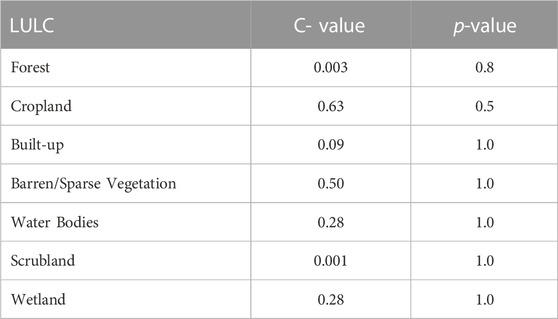
TABLE 2. C and p factors for different LULC.
2.3.8 Support and conservation practices factor (P)
This parameter (p) shows the effect of different conservation practices such as contouring, strip cropping, and bunding on soil erosion/loss rate. It is termed as a ratio of soil loss from a piece of land under a particular support/conservation practice to the equivalent soil loss with no support/conservation practice. The p-value varies from 0.0 to 1.0, being highest for up and down cultivation. The databases used to formulate input files for the RUSLE model are presented in Table 1. The p-value in the present case was allotted on the basis of land use types (Table 2).
2.3.9 Soil loss (A)
Considering the appraised factors of RUSLE as different layers in the map calculator, the average soil loss was estimated on annual basis, along with its dispersal in the region under consideration. For the factors R, K, C, and p, the raster layers were created in 10 m × 10 m resolution, whereas, for the LS factor, it was in 12.5 m × 12.5 m resolution. Further, the DEM was resampled into 10 m × 10 m resolution using the “bilinear method” for creating the LS map for carrying out the perfect overlay analysis. The average annual soil loss was estimated using pixel-based information of all the factors of the RUSLE model for each pixel having a spatial resolution of 10 m × 10 m. For developing erosion severity map of the study area, the assessed soil loss was characterized as very low (0.0–1.0 t ha-1 year-1), low (1.0–5.0 t ha-1 year-1), medium (5.0–10.0 t ha-1 year-1), high (10.0–50.0 t ha-1 year-1) and extreme (>50.0 t ha-1 year-1). This classification was adopted by Pham et al. (Pham et al., 2018). Figure 3 demonstrates the complete methodology adopted for the implementation of the present study.
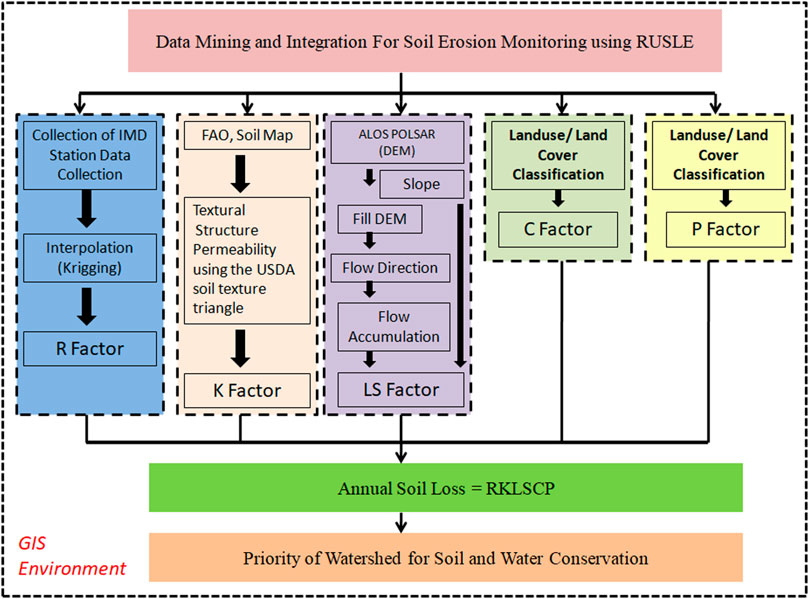
FIGURE 3. Complete work flow diagram of the adopted methodology.
2.4 Prioritization of watersheds
After the estimation of the soil loss, a priority ranking of all 25 sub-watersheds was done for identifying the highly erosion/soil loss-affected area. The watersheds having the highest and lowest values of average annual soil loss were designated with highest and lowest ranks, respectively for implementation of land and water conservation measures.
3 Results and discussion
3.1 Land use land cover (LULC) of the study area
The study area is mainly occupied by cropland (66.35%), three major crops (wheat, barley, and maize) are grown over this region (Dubey and Sharma, 2018) followed by grassland (17.54%), shrub land (5.43%), barren/sparse vegetation (4.14%), built-up (2.85%), forest (2.34%), water body (1.30%) and wetland (0.05%). The area under cropland varies from 35.69% to 86.64%, being the lowest and highest in WS25 and WS1, respectively. The area under grassland ranges from 0.0% to 35.06%, being the lowest and highest in WS18 and WS16, respectively. The area under shrubland varies from 0.0% to 15.88%, being the lowest and highest shares in WS18 and WS25, respectively. The area under barren/Sparsh vegetation ranges from 1.56% to 15.01%, being the lowest and highest in WS10 and WS17, respectively. The area under built-up varies from 0.63% to 10.33%, being the lowest and highest in WS25 and WS3, respectively. The area under forest varies from 0.04% to 15.57%, being the lowest and highest in WS1 and WS25, respectively. The area under water bodies varies from 0.09% to 36.62%, being lowest and highest in WS3 and SW10, respectively. The area under wetland varies from 0.0% to 0.78%, being highest in WS25. The area under different LULCs is given in Table 3.
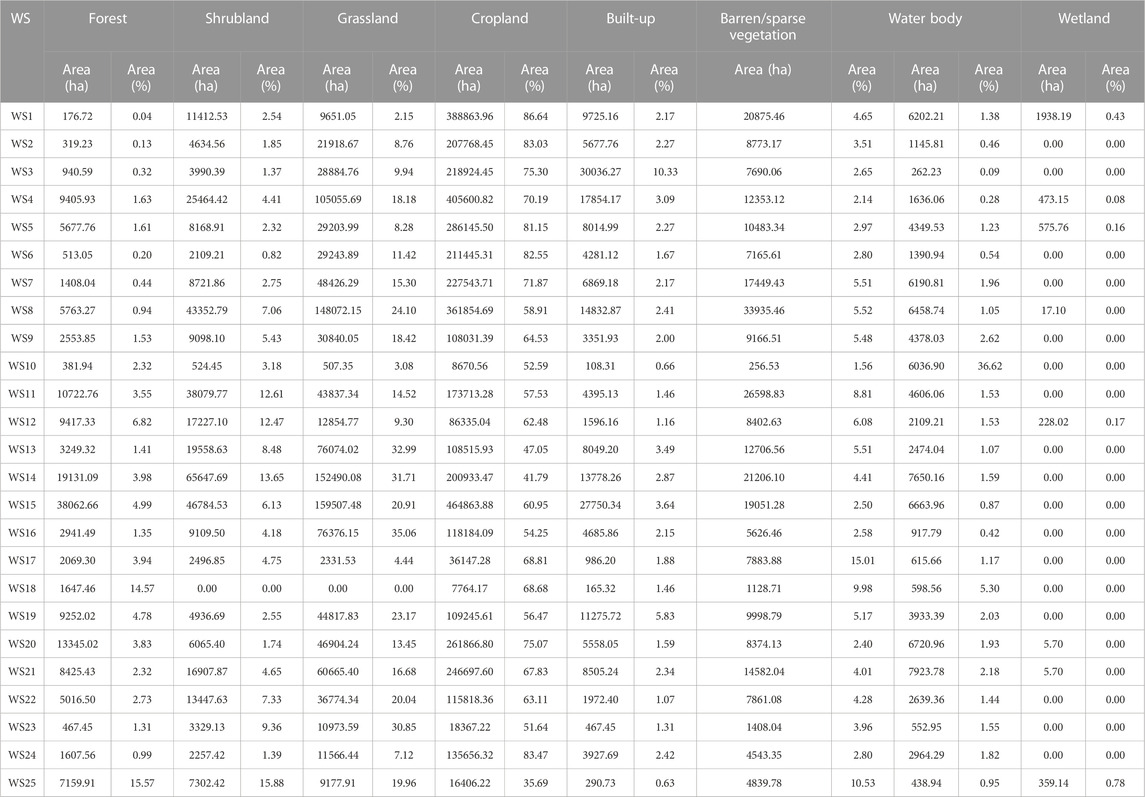
TABLE 3. LULC status in different watersheds in the study area.
3.2 Watershed slope
The slope of the Banas basin varied from <2 to 90% as indicated in Figure 4. The greater slopes of watersheds in this basin make this region highly susceptible to soil loss in relation to the generation of speedy runoff, resulting in severe water erosion with minimum scope for groundwater recharge. The Aravalli axis divides this region into two-halves; therefore, the region exhibits a sharp change from steep land to a flat river plain.

FIGURE 4. Slope map of the study area.
3.3 Parameters of RUSLE
The R-value varied in the range of 147.41–443.85 MJ.mm.ha-1.h-1 year-1 in the Banas basin. Figure 5 shows the map indicating the low to high values of R with different colors. The red and dark blue colors indicate the lowest and highest R values, respectively. The erosivity rate is high in the eastern part than in the western part of the basin due to the high rainfall amount in the eastern part. Studies report that the north-eastern part of the Banas River Basin shows high potential evapotranspiration, therefore erosivity is higher due to less of soil moisture in the soil, while the rest of the area shows low potential evapotranspiration rate indicating less erosivity in the region (Kalyan et al., 2021). The K-factor varied in the range of 011–0.15 t.ha.h.MJ-1.mm-1 as indicated in Figure 6. The maximum area of the basin was dominated by K-value in the range of 0.12–0.13 t.ha.h.MJ-1.mm-1, followed by 0.13–0.15 t.ha.h.MJ-1.mm-1 and 0.11–0.12 t.ha.h.MJ-1.mm-1. The LS factor varied from <0.06 to 56.76%. The major part of the basin is dominated by and LS-value of 56.31%–56.76%, followed by 55.87%–56.31%, 54.31%–55.87%, and 0.06%–54.31%. Figure 7 shows the LS-factor map of the basin. LS-factor helps to identify the places with a sudden change in slope, which are more prone to erosion as a result of the accelerated motion of the river channels in this region. Earlier studies have also reported presence of tectonic sub-blocks in the region from hypsometric analysis of this basin showing horst-graben structures (Sinha-Roy, 2002), therefore it is clear that water erosion is active in this region due to unstable slope. The C-factor of the basin varied from 0.001 to 0.629. The basin is dominated by C-value in the range of 0.280–0.629, followed by 0.001–0.003, 0.090–0.280, and 0.003–0.090. Figure 8 shows the C-factor map of the basin. The C-value is directly proportional to the LULC spread over the region. Therefore, the major land cover spread has two distinct ranges of C-factor as 0.280–0.680, which represents the agricultural area, and 0.001 or 0.003 is the area covered by shrub or barren land. The P-factor varied from 0.5 to 1.0, indicating the non-applicability of the conservation strategies in the basin for soil management. The basin is dominated with a p-value of 0.5, followed by 0.8–1.0 and 0.5–0.8. The entire arable land falls under p-value 0.5 as forest land and built-up, and scrub. Shrubland falls under the p-value of 0.8–1.0. The p-value ranging from 0.5 to 0.8 is almost insignificant in the region. Figure 9 shows the P-factor map of the basin.
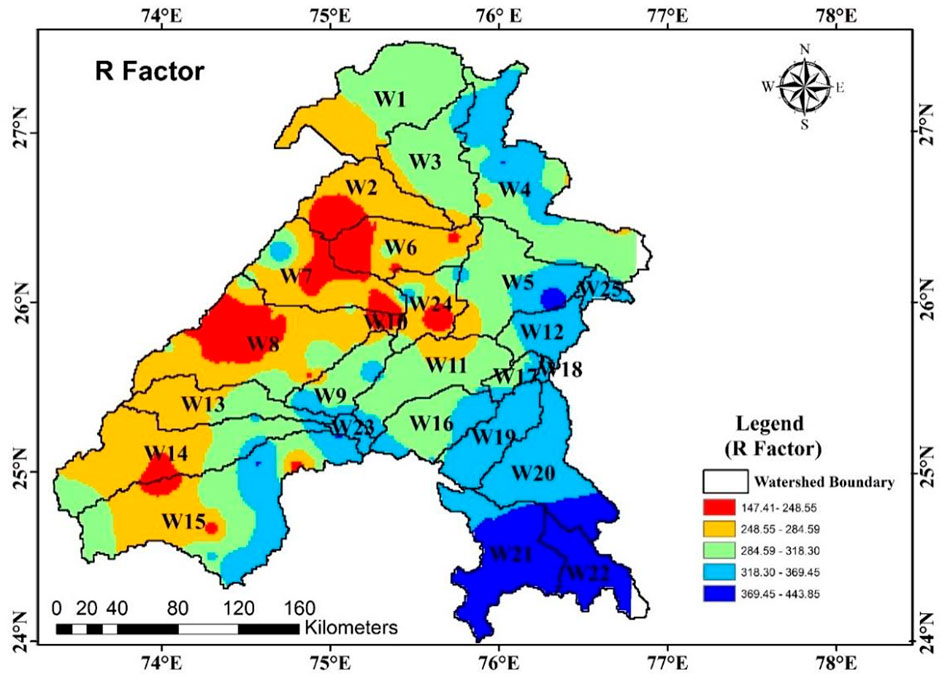
FIGURE 5. R factor map of the study basin.
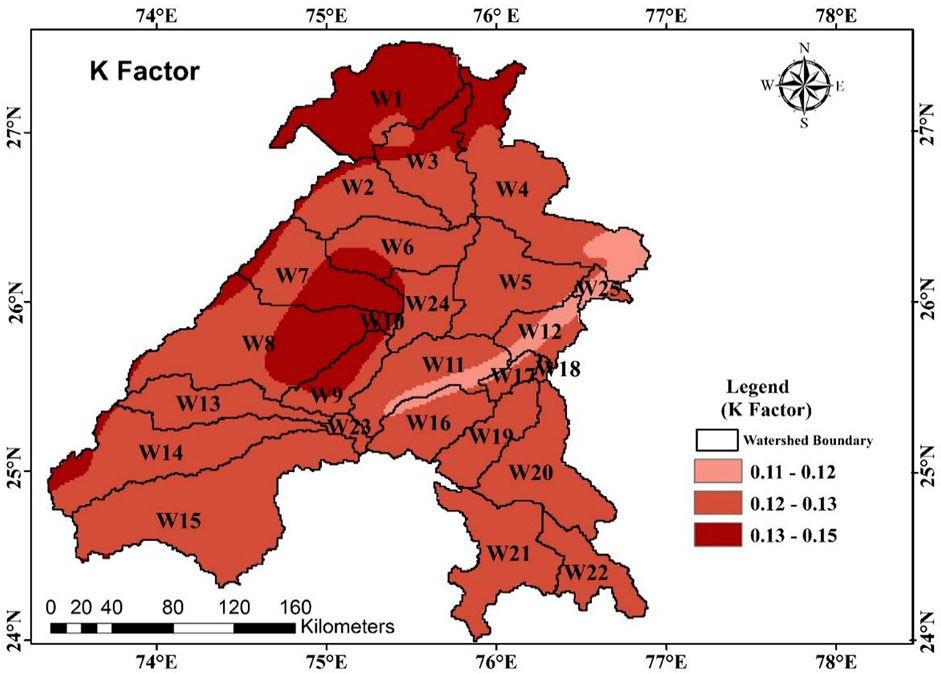
FIGURE 6. K factor map of the study basin.
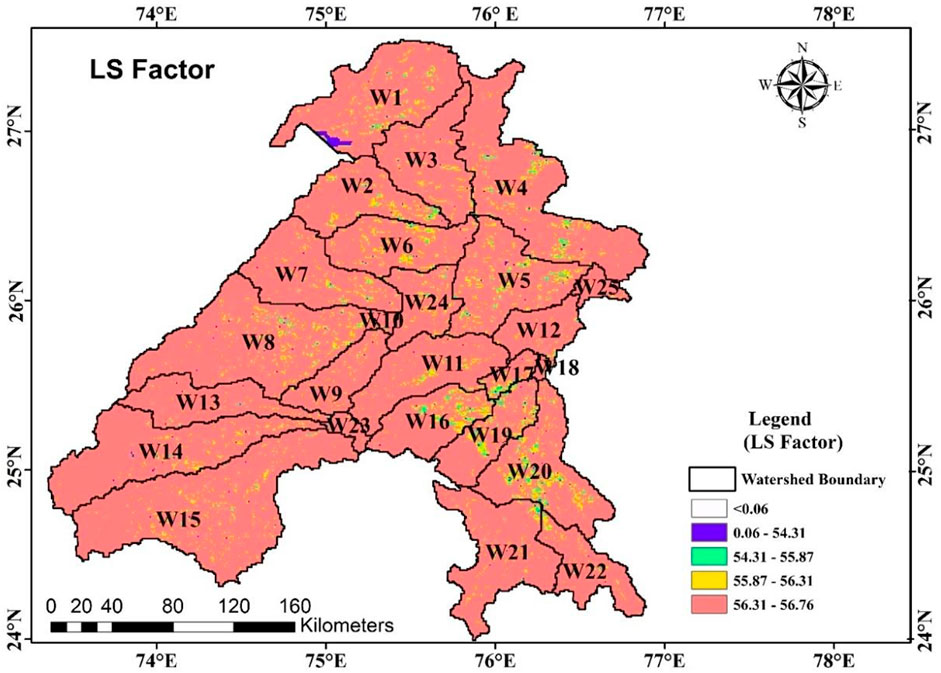
FIGURE 7. LS factor map of the study basin.
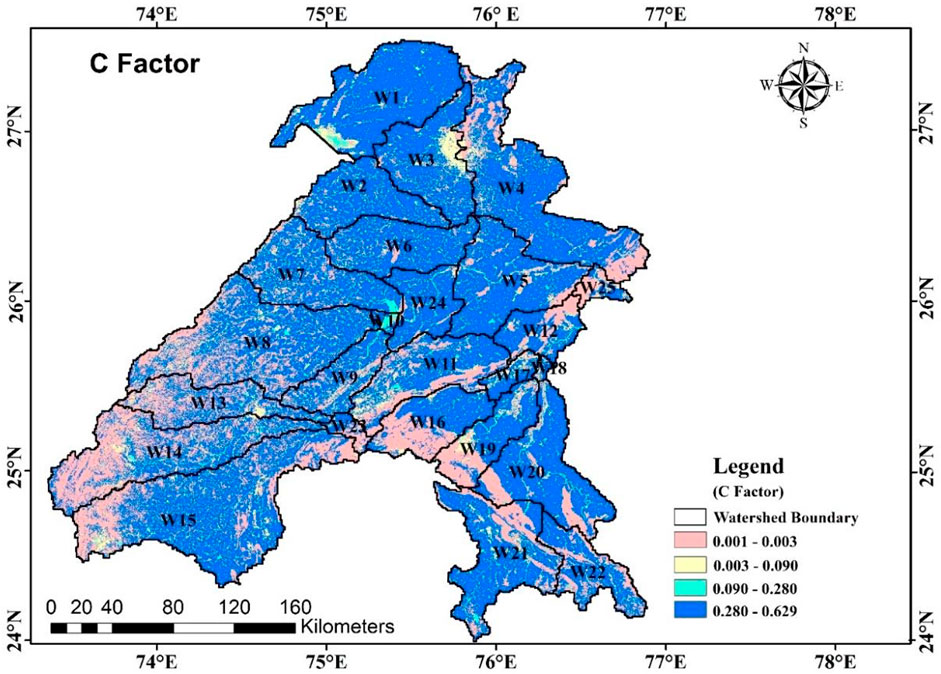
FIGURE 8. C factor map of the study basin.
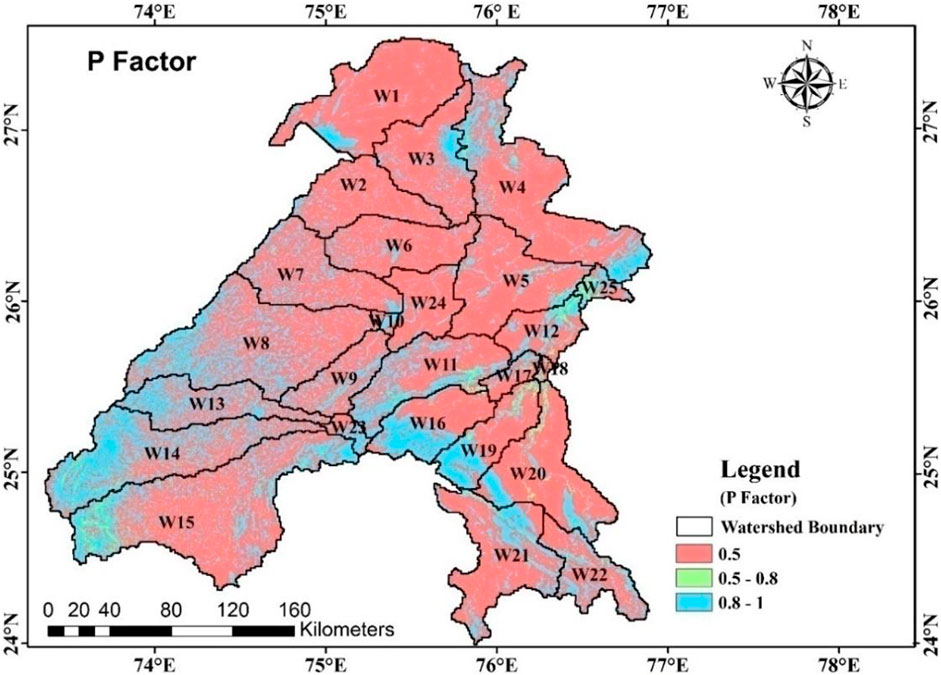
FIGURE 9. p factor map of the study basin.
3.4 Area under different soil loss categories
The areas under different severity classes (very low, low, medium, high, and extreme) of soil loss are reported in Table 4. The area under the very low category of soil loss was recorded in the range of 0.1%–14.4%, being lowest (2,134 ha) and highest (238,743 ha) in WS18 and WS14, respectively. Under the low soil loss category, the area varied from 0.1% to 10.3%, being lowest (4,742 ha) and highest (469,900 ha) in WS10 and WS15, respectively. The area under the medium soil loss category varied in the range of 0.2%–10.3%, being lowest (952 ha) and highest (51,755 ha) in WS23 and WS4, respectively. Under the high soil loss category, the area varied in the range of 0.0%–20.5%, being lowest (0.0 ha) and highest (12,803 ha) in WS12 and WS21, respectively. The area under the extreme soil loss category varied from 0.0% to 20.0%, being lowest (0.0 ha) and highest (9,720 ha) in WS7 and WS21, respectively. Irrespective of the different soil loss categories, the area under soil loss was recorded in the range of 0.2%–11.2%, being lowest (16,486 ha) and highest (762,684 ha) in WS10 and WS15, respectively.
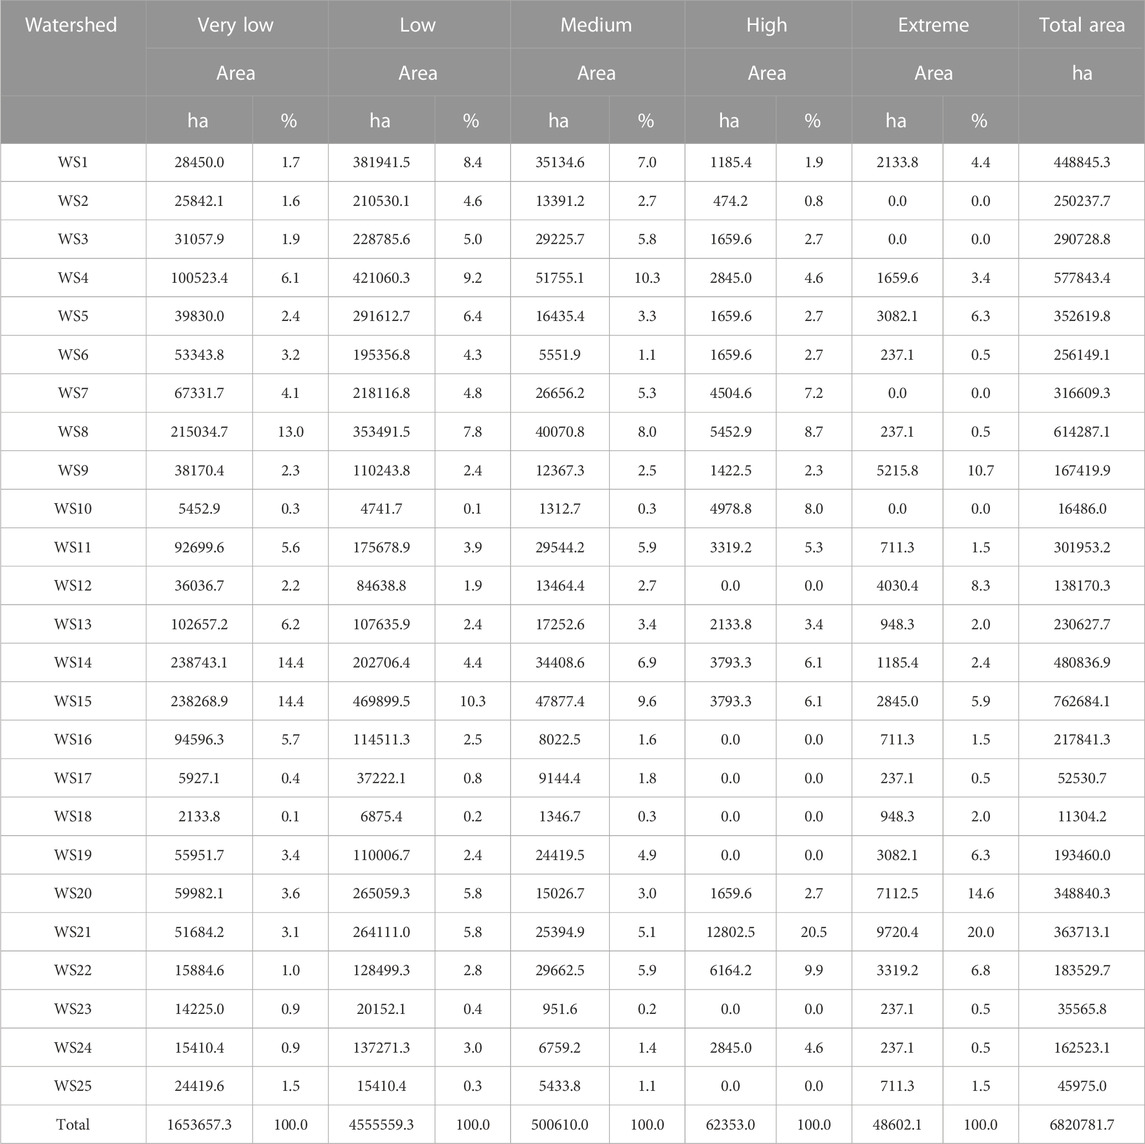
TABLE 4. The area under different severity classes (very low, low, medium, high, and extreme) of soil loss.
3.5 Soil loss and priority ranking of watersheds
The total area under very low, low, medium, high, and extreme soil loss categories was recorded as 24.2, 66.8, 7.3, 0.9, and 0.7%, being the lowest and highest under extreme and low soil loss categories, respectively. The total soil loss was computed as 5.8% (1261427.6 t year-1), 62.2% (13547258.3 t year-1), 13.8% (2993754.3 t year-1), 6.6% (1437416.5 t.year-1) and 11.6% (2526192.2 t year-1) under very low, low, medium, high and extreme soil loss categories (Table 5), being lowest and highest under very low and low soil loss categories. The average annual soil loss under five respective defined categories was obtained as 0.8, 3.0, 6.0, 23.1, and 52.0 t ha-1.year-1, being lowest and highest under very low and extreme soil loss categories, respectively. Figure 10 shows the soil loss under different severity categories. The soil loss under the very low soil loss category was recorded in the range of 1.0%–7.9%, being lowest (12,268 t year-1) and highest in WS2 (99,768 t year-1) and WS25, respectively. Under the low category, the soil loss was computed as 1.5%–18.8%, being lowest (209,400 t year-1) and highest (2,541,100 t year-1) in WS17 and WS1, respectively. In the medium category, the soil loss ranged from 0.6% to 11.7%, being lowest (17,450 t. year-1) and highest (350,650 t year-1) in WS2 and WS18, respectively. Similarly, under the high category, the soil loss was computed in the range of 0.6%–7.8%, being lowest (9,205 t year-1) and highest (112,500 t year-1) in WS18 and WS1, respectively. Under the extreme category, the soil loss was computed in the range of 1.2%–7.9%, being lowest (30,645 t year-1) and highest (199,045 t year-1) in WS22 and WS19, respectively. Irrespective of the different soil loss categories, the total soil loss varied in the range of 2.4%–13.3%, being lowest (512,768 t year-1) and highest (2,884,064 t year-1) in WS7 and WS1, respectively. The average annual soil loss varied from 0.4% to 34.7%, being lowest (1.1 t ha-1 year-1) and highest (84.9 t ha-1 year-1) in WS8 and WS18, respectively. The average annual soil loss among different watersheds was recorded in the range of 1.1–84.9 t ha-1 year-1. It was recorded to be highest (84.9 t ha-1.year-1), followed by WS10 (38.4 t ha-1 year-1), SW25 (34.7 t ha-1 year-1) and WS23 (17.9 t ha-1.year-1), whereas lowest was recorded in WS8 (1.1 t ha-1 year-1), WS18 obtained the highest/top priority rank in terms of the average annual soil loss (84.9 t ha-1 year-1) to be considered for land and water conservation planning and implementation (Figure 11). Table 4 demonstrates the area under different severity classes of soil loss. The soil loss under different severity classes and priority ranking of watersheds in terms of average annual soil loss is presented in Table 6.
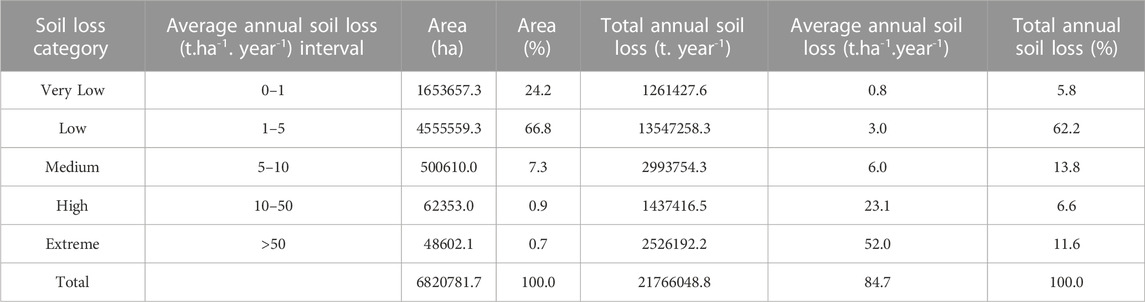
TABLE 5. Average annual soil loss under different severity classes in Banas basin.
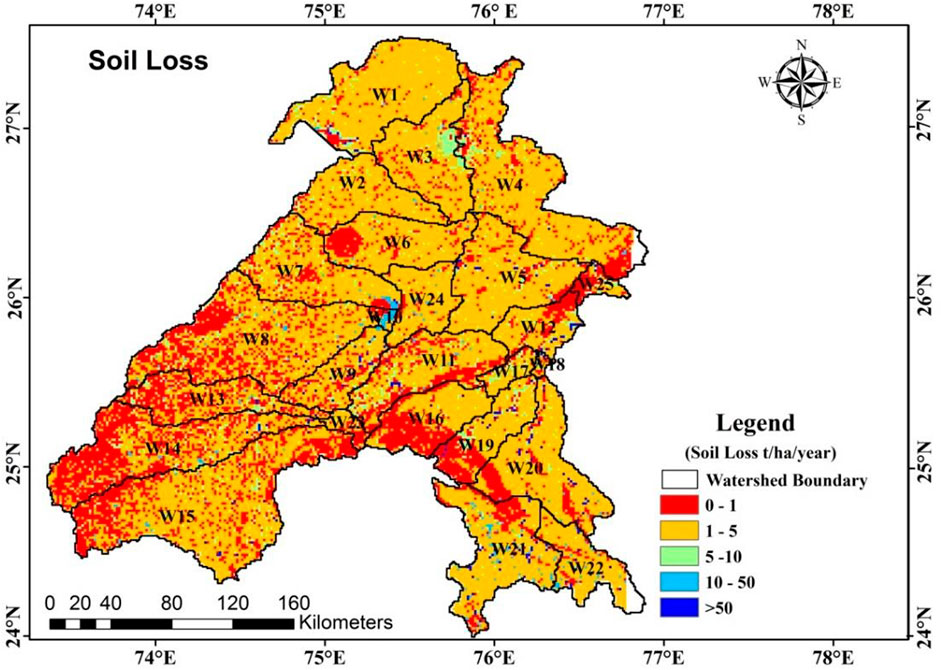
FIGURE 10. Soil loss map of the basin.
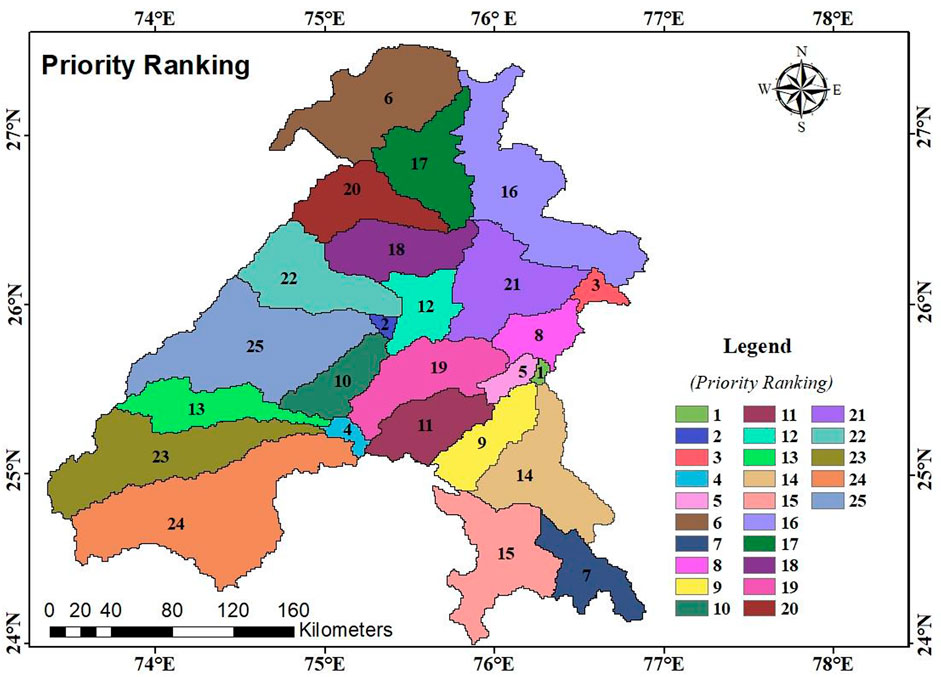
FIGURE 11. Priority ranking of the watershed in relation to the severity of soil loss from their catchments.
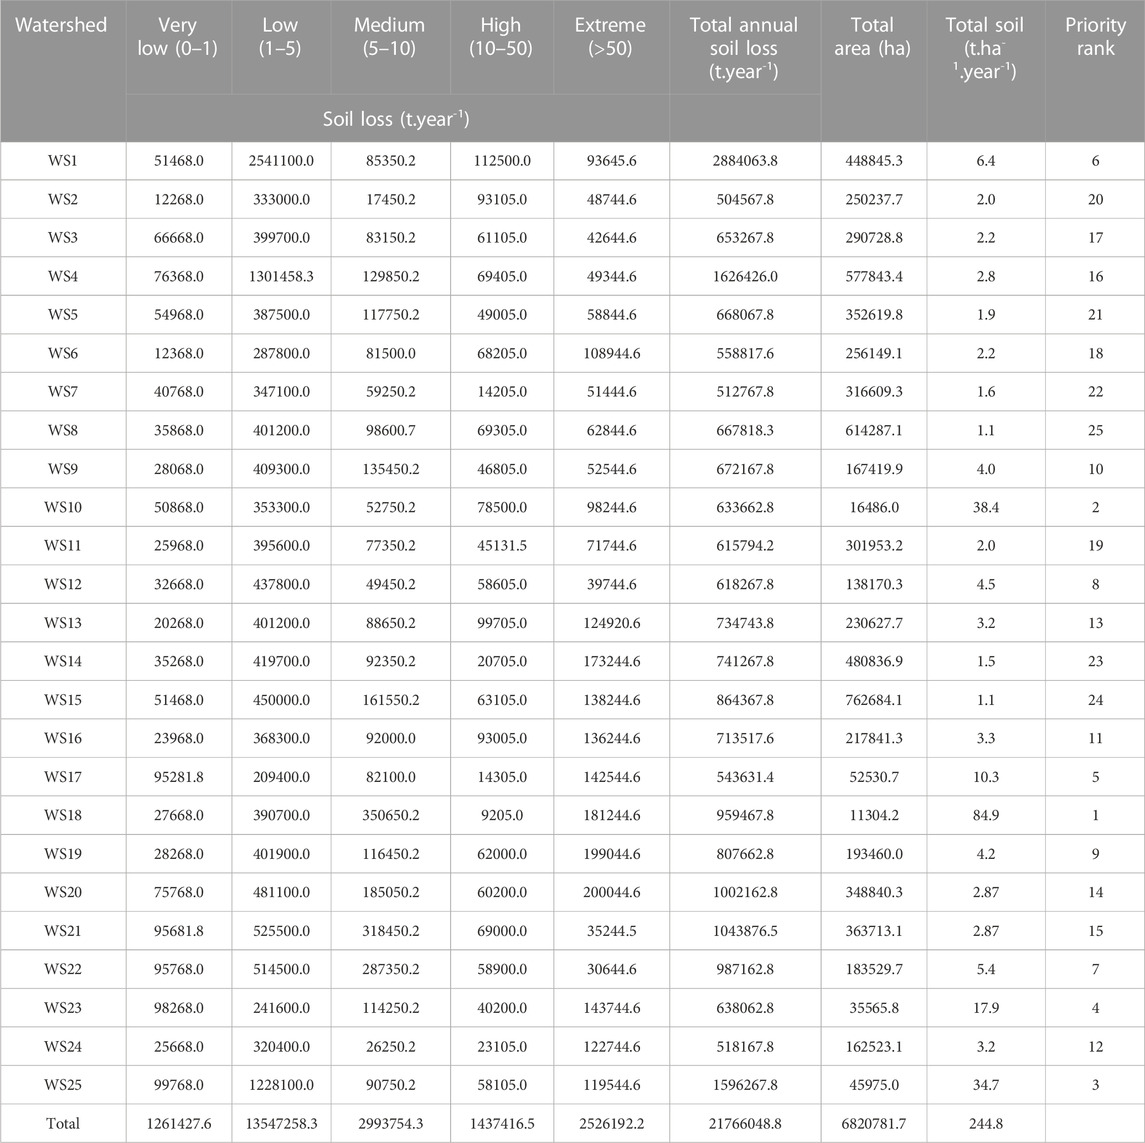
TABLE 6. Soil loss under different severity classes and priority ranking of watersheds in terms of average annual soil loss.
4 Conclusion
Application of the RUSLE model integrated with the GIS environment proved to be the easiest approach for computing soil loss through sheet and rill erosion and predicting erosion risk zones in the Banas basin. The remote sensing and GIS coupled use of the RUSLE model predicted the average annual soil loss of about 0.8, 3.0, 6.0, 23.1, and 52.0 t ha-1year-1 under the soil loss categories of very low (0–1 t ha-1 year-1), low (1–5 t ha-1 year-1), medium (5–10 t ha-1 year-1), high (10–50 t ha-1 year-1) and extreme (>50 t ha-1 year-1), respectively. The soil loss was recorded to be highest (84.9 t ha-1 year-1) in WS18 (1st rank), because this region is the junction point where the Aravalli hills take a steep slope and divides the flow of Banas river in two major directions towards the East and West, followed by WS10 (38.4 t ha-1 year-1), which is located in the semi-arid part of the basin and prone to high erosion, as it is the fringe area where the climatic and anthropogenic units change abruptly, SW25 (34.7 t ha-1 year-1) which is a region affected by the high inflow of the Banas river in the Eastern part and WS23 (17.9 t ha-1 year-1), whereas it was lowest (25th rank) for WS8 (1.1 t ha-1 year-1), which is located in a stable region without much interference of the river, climate and anthropogenic activities. The total annual soil loss from the basin was recorded as 21766048.8 tons. About 24.2, 66.8, 7.3, 0.9, and 0.7% area of the Banas basin fall under very low, low, medium, high, and extreme soil loss categories, respectively. This study opens the eyes of researchers working in the domain of land and water management. It is strongly recommended to carry out studies pertaining to the estimation of soil loss through gully erosion using high-resolution datasets to understand micro level impacts because this increases rate of land degradation and also affects dams or reservoirs located on the catchments, which further impacts the socio-economic life of the people in the region. Most erosion-affected watersheds of the basin in relation to priority ranking should be considered for land and water conservation planning and implementation. The output of the present study would be useful to policymakers, land use planners, and decision-makers in planning and implementing land and water conservation measures in the problematic areas/watersheds of the Banas basin for controlling soil loss through water erosion.
Data availability statement
The raw data supporting the conclusion of this article will be made available by the authors, without undue reservation.
Author contributions
Conceptualization, MS and KS; methodology, MS; software, KS; validation, MS, PA and VV; formal analysis, KS; investigation, MS and KS; writing—original draft preparation, MS, KS, NA-A, PA, VV, and AM; writing—review and editing, MS, KS, NA-A, PA, VV, and AM; visualization, MS, KS, NA-A, PA, VV, and AM; supervision, MS, KS, NA-A, PA, VV, and AM; project administration, NA-A; funding acquisition, NA-A All authors have read and agreed to the published version of the manuscript.
Conflict of interest
The authors declare that the research was conducted in the absence of any commercial or financial relationships that could be construed as a potential conflict of interest.
Publisher’s note
All claims expressed in this article are solely those of the authors and do not necessarily represent those of their affiliated organizations, or those of the publisher, the editors and the reviewers. Any product that may be evaluated in this article, or claim that may be made by its manufacturer, is not guaranteed or endorsed by the publisher.
References
Abdelwahab, O. M., Ricci, G. F., DeGirolamo, A. M., and Gentile, F. (2018). Modelling soil erosion in a mediterranean watershed: Comparison between SWAT and ann AGNPS models. Environ. Res. 166, 363–376. doi:10.1016/j.envres.2018.06.029
Ahmad, N. S., Mustafa, F. B., and Didams, G. A. (2020). Systematic review of soil erosion control practices on the agricultural land in Asia. Int. Soil Water Conserv. Res. 8, 103–115. doi:10.1016/j.iswcr.2020.04.001
Amellah, O., and El Morabiti, K. (2021). Assessment of soil erosion risk severity using GIS, remote sensing and RUSLE model in OuedLaou Basin (north Morocco). Soil Sci. annu. 72, 1–11. doi:10.37501/soilsa/142530
Amsalu, T., and Mengaw, A. (2014). GIS based soil loss estimation using RUSLE model: The case of jabi tehinan woreda, ANRS, Ethiopia. Resour 05, 616–626. doi:10.4236/nr.2014.511054
Angima, S. D., Stott, D. E., O’Neill, M. K., Ong, C. K., and Weesies, G. A. (2003). Soil erosion prediction using RUSLE for central Kenyan highland conditions. Agric. Ecosyst. Environ. 97, 295–308. doi:10.1016/s0167-8809(03)00011-2
Beasley, D. B., Huggins, L. F., and Monke, A. (1980). Answers: A model for watershed planning. Trans. ASAE 23, 0938–0944. doi:10.13031/2013.34692
Borrelli, P., Robinson, D. A., Panagos, P., Lugato, E., Yang, J. E., Alewell, C., et al. (2020). Land use and climate change impacts on global soil erosion by water (2015–2070). Proc. Natl. Acad. Sci. U. S. A. 117, 21994–22001. doi:10.1073/pnas.2001403117
Boufala, M., ElHmaidf, A., Chadli, K., Essahlaoui, A., ElOuali, A., and Lahjouj, A. (2020). Assessment of the risk of soil erosion using RUSLE method and SWAT model at the M’dez Watershed, Middle Atlas, Morocco. E3S Web Conf. 150, 03014. doi:10.1051/e3sconf/202015003014
Chahar, B. R., and Dhaka, S. K. (2013). “Groundwater modeling of Banas River basin,” in World environmental and water resources congress (Cincinnati, Ohio: Showcasing the Future), 450–459. doi:10.1061/9780784412947.044
Chen, Z., Wang, L., Wei, A., Gao, J., Lu, Y., and Zhou, J. (2019). Land-use change from arable lands to orchards reduced soil erosion and increased nutrient loss in a small catchment. Sci. Total Environ. 648, 1097–1104. doi:10.1016/j.scitotenv.2018.08.141
Das, S., Deb, P., Bora, P. K., and Katre, P. (2021). Comparison of RUSLE and MMF soil loss models and evaluation of catchment scale best management practices for a mountainous watershed in India. Sustainability 13, 232. doi:10.3390/su13010232
Du, Q., Li, G., Chen, D., Zhou, Y., Qi, S., Wu, G., et al. (2021). SBAS-InSAR-Based analysis of surface deformation in the eastern tianshan mountains, China. Front. Earth Sci. 9, 729454. doi:10.3389/feart.2021.729454
Dubey, S. K., and Sharma, D. (2018). Assessment of climate change impact on yield of major crops in the Banas River Basin, India. Total Environ. 635, 10–19. doi:10.1016/j.scitotenv.2018.03.343
Dubey, S. K., Sharma, D., and Mundetia, N. (2015). Morphometric analysis of the Banas River Basin using the geographical information system, Rajasthan, India. J. Hydrol. 3, 47–54. doi:10.11648/j.hyd.20150305.11
Eniyew, S., Teshome, M., Sisay, E., and Bezabih, T. (2021). IntegratingRUSLE model with remote sensing and GIS for evaluation soilerosion in Telkwonz Watershed, Northwestern Ethiopia. Remote. Sens. Appl. Soc. Environ. 24, 100623. doi:10.1016/j.rsase.2021.100623
Everard, M., Sharma, O. P., Vishwakarma, V. K., Khandal, D., Sahu, Y. K., Bhatnagar, R., et al. (2018). Assessing the feasibility of integrating ecosystem-based with engineered water resource governance and management for water security in semi-arid landscapes: A case study in the Banas catchment, Rajasthan, India. Total Environ. 612, 1249–1265. doi:10.1016/j.scitotenv.2017.08.308
Farhan, Y., Zregat, D., and Nawaiseh, S. (2014). Assessing the influence of physical factors on spatial soil erosion risk in. North. Jordan. Am. J. Sci. 10 (7), 29–39.
Fenta, A. A., Yasuda, H., Shimizu, K., Haregeweyn, N., and Negussie, A. (2016). Dynamics of soil erosion as influenced by watershed management practices: A case study of the agula watershed in the semi-arid highlands of northern Ethiopia. Manage 58, 889–905. doi:10.1007/s00267-016-0757-4
Ganasri, B. P., and Ramesh, H. (2016). Assessment of soil erosion by RUSLE model using remote sensing and GIS - a case study of Nethra-vathi Basin. Geo. Sci. Front. 7, 953–961. doi:10.1016/j.gsf.2015.10.007
Gosain, A. K., Mani, A., and Dwidevi, C. (2009). Hydrological modelling-literature review. Adv. Fluid Mech. 339, 63–70.
Jaydhar, A. K., Pal, S. C., Saha, A., Islam, A. R., and Ruidas, D. (2022). Hydrogeochemical evaluation and corresponding health risk from elevated arsenic and fluoride contamination in recurrent coastal multi-aquifers of eastern India. J. Clean. Prod. 369, 133150. doi:10.1016/j.jclepro.2022.133150
Kalyan, S., Sharma, D., and Sharma, A. (2021). Spatio-temporal variation in desert vulnerability using desertification index over the Banas River Basin in Rajasthan, India. Arab. J. Geosci. 14, 54. doi:10.1007/s12517-020-06417-0
Kaur, B., Sur, K., Verma, V. K., and Pateriya, B. (2022). Implications of watershed management programs for sustainable development in rural scenario—a case study from foothills of Punjab state, India. Water Conserv. 7, 647–655. doi:10.1007/s41101-022-00170-z
Kayet, N., Pathak, K., Chakrabarty, A., and Sahoo, S. (2018). Evaluation of soil loss estimation using the RUSLE model and SCS-CN method in hillslope mining areas. Int. Soil Water Conserv. Res. 6, 31–42. doi:10.1016/j.iswcr.2017.11.002
Kumar, R., Deshmukh, B., and Kumar, A. (2022). Using Google earth engine and GIS for basin scale soil erosion risk assessment: A case study of Chambal River Basin, central India. J. Earth SystSci 131, 228. doi:10.1007/s12040-022-01977-z
Lal, R. (2019). “Adaptation and mitigation of climate change by improving agriculture in India,” in Climate change and agriculture in India: Impact and adaptation (Cham: Springer), 217–227. doi:10.1007/978-3-319-90086-5_17
Marondedze, A. K., and Schütt, B. (2020). Assessment of soil erosion using the RUSLE model for the Epworth district of the Harare Metropolitan Province, Zimbabwe. Sustainability 12, 8531. doi:10.3390/su12208531
Mondal, A., Khare, D., and Kundu, S. (2016). A comparative study of soil erosion modelling by MMF, USLE and RUSLE. Geo. Carto. Int. 33, 89–103. doi:10.1080/10106049.2016.1232313
Mundetia, N., Sharma, D., and Dubey, S. K. (2018). Morphometric assessment and sub-watershed prioritization of Khari River basin in semi-arid region of Rajasthan, India. Arab. J. Geo. Sci. 11, 530. doi:10.1007/s12517-018-3819-5
Nampak, H., Pradhan, B., Mojaddadi, R. H., and Park, H. J. (2018). Assessment of land cover and land use change impact on soil loss in a tropi-cal catchment by using multi temporal SPOT -5 satellite images and revised universal soilloss equation model. Land Degrad. Dev. 29, 3440–3455. doi:10.1002/ldr.3112
Ouyang, W., Hao, F., Skidmore, A. K., and Toxopeus, A. G. (2010). Soil erosion and sediment yield and their relationships with vegetation cover in upper stream of the Yellow River. Yellow River. Sci. Total Environ. 409, 396–403. doi:10.1016/j.scitotenv.2010.10.020
Pal, S. C., and Chakrabortty, R. (2019a). Simulating the impact of climate change on soil erosion in sub-tropical monsoon dominated watershed based on RUSLE, SCS runoff and MIROC5 climatic model. Adv. Space Res. 64, 352–377. doi:10.1016/j.asr.2019.04.033
Pal, S. C., and Chakrabortty, R. (2019b). Modeling of water induced surface soil erosion and the potential risk zone prediction in a sub-tropical watershed of Eastern India. Environ 5, 369–393. doi:10.1007/s40808-018-0540-z
Pal, S. C., Chakrabortty, R., Roy, P., Chowdhuri, I., Das, B., Saha, A., et al. (2021). Changing climate and land use of 21st century influences soil erosion in India. Gondwana Res. 94, 164–185. doi:10.1016/j.gr.2021.02.021
Panagos, P., Borrelli, P., Meusburger, K., Poesen, J., Alewell, C., vanderZanden, E. H., et al. (2015). Modelling the effect of support practices (P-factor) on the reduction of soil erosion by water at European scale. Environ. Sci. Policy 51, 23–34. doi:10.1016/j.envsci.2015.03.012
Park, S., Oh, C., Jeon, S., Jung, H., and Choi, C. (2011). Soil erosion risk in Korean watersheds, assessed using the revised universal soil loss equation. J. Hydrol. 399, 263–273. doi:10.1016/j.jhydrol.2011.01.004
Pham, T. G., Degener, J., and Kappas, M. (2018). Integrated universal soil loss equation (USLE) and Geographical Information System (GIS) for soil erosion estimation in A Sap basin: Central Vietnam. Int. Soil Water Conserv. Res. 6, 99–110. doi:10.1016/j.iswcr.2018.01.001
Prăvălie, R. (2021). Exploring the multiple land degradation pathways across the planet. Earth-Science Rev. 220, 103689. doi:10.1016/j.earscirev.2021.103689
Ranzi, R., Le, T. H., and Rulli, M. C. (2012). A RUSLE approach to model sus-pended sediment load in the Lo River (Vietnam): Effects of res-ervoirs and land use changes. J. Hydrol. 422–423, 17–29. doi:10.1016/j.jhydrol.2011.12.009
Rao, C. S., Gopinath, K. A., Prasad, J. V. N. S., and Singh, A. K. (2016). Climate resilient villages for sustainable food security in tropical India: Concept, process, technologies, institutions, and impacts. Adv. Agron. 140, 101–214. doi:10.1016/bs.agron.2016.06.003
Reddy, R. (2003). Land degradation in India: Extent, costs and determinants. Econ. Polit. Wkly. 38, 4700–4713.
Renard, K. G., Foster, G. R., Weesies, G. A., and Porter, J. P. (1991). Rusle: Revised universal soil loss equation. J. Soil Water Conserv. 46, 30–33.
Ruidas, D., Pal, S. C., Islam, A. R. M., and Saha, A. (2021). Characterization of groundwater potential zones in water-scarce hardrock regions using data driven model. Environ. Earth Sci. 80, 1–18. doi:10.1007/s12665-021-10116-8
Ruidas, D., Chandra Pal, S., Saha, A., Chowdhuri, I., and Shit, M. (2022). Hydrogeochemical characterization based water resources vulnerability assessment in India's first Ramsar site of Chilkalake. Mar. Pollut. Bull. 184, 114107. doi:10.1016/j.marpolbul.2022.114107
Ruidas, D., Chakrabortty, R., Reza Md Islam, A., Saha, A., and Pal, S. C. (2022). A novel hybrid of meta-optimization approach for flash flood-susceptibility assessment in a monsoon-dominated watershed, Eastern India.". Environ. Earth Sci. 81, 145–222. doi:10.1007/s12665-022-10269-0
Ruidas, D., Pal, S. C., Islam, T., Md, A. R., and Saha, A. (2022). Hydrogeochemical evaluation of groundwater aquifers and associated health hazard risk mapping using ensemble data driven model in a water scares plateau region of eastern India. Expo. Health 14, 1–19. doi:10.1007/s12403-022-00480-6
Safwan, M., Alaa, K., Omran, A., Quoc, B. P., Nguyen, T. T. L., Van, N. T., et al. (2021). Predicting soil erosion hazard in Lattakia Governorate (WSyria). Int. J. Sediment. Res. 36, 207–220. doi:10.1016/j.ijsrc.2020.06.005
Sharda, V. N., and Ojasvi, P. R. (2016). A revised soil erosion budget for India:role of reservoir sedimentation and land-use protection meas-ures: A revised soil erosion budget for India. Earth Surf. Process. Landf. 41, 2007–2023. doi:10.1002/esp.3965
Sharma, A. (2010). Integrating terrain and vegetation indices for identifying potential soil erosion risk area. Geo. Spat. Inf. Sci. 13, 201–209. doi:10.1007/s11806-010-0342-6
Sharma, A., Sharma, D., Panda, S. K., Dubey, S. K., and Pradhan, R. K. (2018). Investigation of temperature and its indices under climate change scenarios over different regions of Rajasthan state in India. Planet Chang. 161, 82–96. doi:10.1016/j.gloplacha.2017.12.008
Sinha-Roy, S. (2002). Hypsometry and landform evolution: A case study in the Banas drainage basin, Rajasthan, with implications for Aravalli uplift. Journal-Geological Soc. India 60 (1), 7–26.
Srinivasan, R., Karthika, K. S., Suputhra, S. A., Chandrakala, M., and Hegde, R. (2021). Mapping of soil erosion and probability zones using remote sensing and GIS in arid part of south Deccan Plateau India. J. Ind. Soc. Remote Sens. 2021 (49), 2407–2423. doi:10.1007/s12524-021-01396-5
Sujatha, E. R., and Sridhar, V. (2021). Landslide susceptibility analysis: A logistic regression model case study in coonoor, India. India Hydrol. 8, 41. doi:10.3390/hydrology8010041
Sujatha, E., and Sridhar, V. (2018). Spatial prediction of erosion risk of a small mountainous watershed using RUSLE: A case-study of the palarsub-watershed in kodaikanal, south India. Water 10, 1608. doi:10.3390/w10111608
Sur, K., and Chauhan, P. (2019). Imaging spectroscopic approach for land degradation studies: A case study from the arid land of India. Geomatics, Nat. Hazards Risk 10, 898–911. doi:10.1080/19475705.2018.1552629
Thapa, P. (2020). Spatial estimation of soil erosion using RUSLE modeling: A case study of dolakha district, Nepal. Environ. Syst. Res. 9, 15. doi:10.1186/s40068-020-00177-2
Tiwari, A. K., Risse, L. M., and Nearing, M. A. (2000). Evaluation of WEPP and its comparison with USLE and RUSLE. Trans. ASAE 43, 1129–1135. doi:10.13031/2013.3005
USDA (1972). “Soil conservation service, national engineering handbook, section 4 chapters,” in Hydrology (Washington, D.C, 4–10.
Keywords: banas basin, prioritization, soil loss, RUSLE, GIS
Citation: Singh MC, Sur K, Al-Ansari N, Arya PK, Verma VK and Malik A (2023) GIS integrated RUSLE model-based soil loss estimation and watershed prioritization for land and water conservation aspects. Front. Environ. Sci. 11:1136243. doi: 10.3389/fenvs.2023.1136243
Received: 02 January 2023; Accepted: 21 February 2023;
Published: 03 March 2023.
Edited by:
Faisal Mumtaz, Aerospace Information Research Institute (CAS), ChinaReviewed by:
Subodh Chandra Pal, University of Burdwan, IndiaWani Suhail Ahmad, Aligarh Muslim University, India
Copyright © 2023 Singh, Sur, Al-Ansari, Arya, Verma and Malik. This is an open-access article distributed under the terms of the Creative Commons Attribution License (CC BY). The use, distribution or reproduction in other forums is permitted, provided the original author(s) and the copyright owner(s) are credited and that the original publication in this journal is cited, in accordance with accepted academic practice. No use, distribution or reproduction is permitted which does not comply with these terms.
*Correspondence: Anurag Malik, YW1hbGlrMTlAcGF1LmVkdQ==; Mahesh Chand Singh, bXNyYXdhdEBwYXUuZWR1