 Dongping Bai1
 Lin Liu
 Zizhen Dong
94% of researchers rate our articles as excellent or good
Learn more about the work of our research integrity team to safeguard the quality of each article we publish.
Find out more
ORIGINAL RESEARCH article
Front. Environ. Sci., 08 February 2023
Sec. Atmosphere and Climate
Volume 11 - 2023 | https://doi.org/10.3389/fenvs.2023.1134940
This article is part of the Research TopicClimate-Environment Interactions under Global WarmingView all 25 articles
High air pollutions of PM2.5 concentrations have become a serious environmental problem in China during recent decades, causing significant influences on urban air quality and human health. In the study, we investigate the variations of the December PM2.5 in Eastern China and the possible causes during 2000–2020. The empirical orthogonal function (EOF) analysis is employed to reveal the dominant patterns of PM2.5 variability in Eastern China. The EOF1 shows a consistent variability in the whole of the Eastern China, which reflects a consistent emission pattern in Eastern China in past two decades. The EOF2 exhibits a North-South dipole pattern, which is closely tied to the changes of atmospheric circulations. The increase of PM2.5 in the North Eastern China is mainly related to the decrease of wind speed, the decrease of boundary layer height and the increase of inversion temperature, while the decrease of PM2.5 in the South Eastern China is affected by the increase of local precipitation. Two atmospheric wave trains are identified that affect the dipole distribution of PM2.5 in Eastern China. The southern one is affected by ENSO, and the northern one is jointly affected by ENSO, sea surface temperature of Labrador Sea and sea ice concentration near Kara Sea. Finally, we reconstructed a comprehensive atmospheric external forcing index based on these factors. We find that the comprehensive index can well reproduce the North-South dipole distribution of PM2.5 in Eastern China, indicating the plausible effects of the atmospheric external forcings and the prediction potential for the variations of PM2.5 in Eastern China.
In recent decades, particulate pollution featured by high concentrations of PM2.5 (aerosol particle with aerodynamic diameter less than 2.5 µm) has become a serious environmental problem in China, exerting great effects on visibility impairment, urban air quality, and human health (Pui et al., 2014; Li et al., 2015; Li G. et al., 2016; Chen Z. et al., 2020). For example, in January 2013, a hazardous dense haze covered 1.4 million km2 of China and affected more than 800 million people (Xu et al., 2013). As the most densely populated region in China, the Eastern China usually experiences the severest particulate pollution in the past decades (Zhang et al., 2015; Wang and Chen, 2016; Zhang et al., 2020). Therefore, understanding the mechanisms responsible for the occurrence and variation of particulate pollution in Eastern China is of great importance on social and scientific development.
As indicated by previous studies, the high-PM2.5 events in China are usually associated with local meteorological conditions such as the changes of East Asian winter monsoon (EAWM). For example, low-level southerly anomalies associated with the weakened East Asian winter monsoon (EAWM), higher humidity, enhanced low-level static stability, and deficient precipitation are usually conducive to the formation of haze pollution (Zhang et al., 2014; Li Q. et al., 2016; Gong et al., 2018; Cheng et al., 2021). The EAWM variability is closely tied to the changes of large-scale atmospheric circulation, such as atmospheric teleconnections over mid- and high latitudes of Northern Hemisphere (e.g., Gong et al., 2019a; 2019b; 2019c). Apart from the direct atmospheric circulation factors, the atmospheric external forcings also have great impacts on PM2.5 pollution in Eastern China. It is well known that the El Niño–Southern Oscillation (ENSO) is the most prominent atmosphere-ocean coupled climate phenomena in the tropics on the interannual timescales. It has the strongest impacts on Eastern China in winter than in other seasons (e.g., Gong et al., 2014; 2015). Previous studies have shown that ENSO may have different impacts on the interannual variations of haze pollution over the Beijing–Tianjin–Hebei (BTH) in early winter (November–December) and late winter (January–February) (Zhao et al., 2022). ENSO can induce the southerly wind anomaly, which is responsible for more haze days over North China by generating an anomalous anticyclone over the North eastern Asia (He et al., 2019; Yu et al., 2020). In addition, He et al. (2019) found that ENSO had negative influence on the winter haze days on southern China by inducing the deficient (excessive) precipitation during La Niña (El Niño) events. Other factors such as the Arctic Sea Ice (ASI), the Pacific Decadal Oscillation (PDO), and the Eurasian snowpack may also be conducive to the variations of the PM2.5 pollution in China (Zhao et al., 2016; Zou et al., 2017; Yin et al., 2019).
However, the above studies mostly concentrated on the haze pollution in BTH, which experienced the most serious haze pollution in China due to the high anthropogenic emissions associated with rapid industrialization and urbanization (Zhang et al., 2017; Dang and Liao, 2019; Wang et al., 2019). There is little attention paid to air pollution over the whole of Eastern China. In addition, most previous works are conducted based on the atmospheric visibility data. For example, some scholars studied the air pollution by defining a winter haze days (WHD) index which is derived from observations of visibility (Wang and Chen, 2016; Mao et al., 2018; He et al., 2019). Other studies calculated the dry extinction coefficient (DEC) based on the observational visibility data to objectively describe haze pollution (Guo et al., 2017; Chen S. et al., 2020; Zhao et al., 2022). Nevertheless, the researches directly based on PM2.5 concentration data are very limited due to the deficiency of long-term PM2.5 observation data. In this study, the new published reconstructed high-quality PM2.5 data are used to study the spatiotemporal variations of PM2.5 in December over Eastern China and the possible causes.
The rest of this analysis is structured as follows. The data and methods utilized in the study are described in Section 2. Section 3 demonstrates the spatiotemporal characteristics of PM2.5 in December over Eastern China. The possible mechanisms associated with the variations of PM2.5 in Eastern China are also investigated. Finally, the summary and discussions are provided in Section 4.
In this study, PM2.5 data were obtained from the Tracking Air Pollution (TAP), which is provided by Tsinghua University (Xiao et al., 2021a; 2021b; 2022; Geng et al., 2021), with a horizontal resolution of 0.1 × 0.1 covering the period from 2000 to present. Monthly atmospheric reanalysis data including the zonal and meridional winds, the air temperature, the geopotential height (HGT), the sea level pressure (SLP) and the boundary layer height (BLH), were obtained from the ERA5 dataset with a horizontal resolution of 1.0 × 1.0 covering the period from 1959 to present (Hersbach et al., 2020), which is the latest reanalysis product provided by the European Centre for Medium-Range Weather Forecasts (ECMWF). The monthly sea ice concentration (SIC) data was obtained from the Met Office Hadley Centre, whose horizontal resolution is 1.0 × 1.0 globally (HadISST, Rayner et al., 2003). The sea surface temperature (SST) data were obtained from the NOAA Extended Reconstructed SST (ERSST) dataset, version 5 (Huang et al., 2017). The monthly precipitation data was obtained from the Global Precipitation Climatology Project (GPCP), which was gridded by 2.5 × 2.5 in latitude and longitude (Adler et al., 2003). In the study, we focus on the period from 2000 to 2020, which is covered by the TAP dataset and is overlapped among other datasets.
Our study focuses on December because haze pollution in winter especially in December over Eastern China is usually the most serious, and the influencing mechanisms might be different between December and other months. The empirical orthogonal function (EOF) method is used in the study, and its significance test is estimated by the North test (Hirsch et al., 1982), which can determine whether the EOF mode can be significantly separated from other modes. In order to examine the atmospheric Rossby wave pathway, the horizontal wave activity flux (or T-N flux) is applied that was derived from the conservation of wave-activity momentum defined by Takaya and Nakamura (2001). The meridional and zonal components of the T-N wave activity flux can be written as:
where ψ is the geostrophic stream function which is defined as Φ⁄f (Φ and f is the seasonal mean geopotential height anomaly and Coriolis parameter, respectively); U and V represent the mean zonal and meridional climatological winds, respectively; and |U| is the magnitude of the mean horizontal winds. The overbars represent the basic states and primes represent perturbations.
Figure 1A presents the spatial distribution of PM2.5 climatology in Eastern China in December during 2000–2020. There are evident regional differences of the climatology, and the PM2.5 concentration was the highest in North China Plain (NCP) with more than 100 μg/m3 concentration. Figure 1B shows the time series of the area-mean PM2.5 concentration in Eastern China. It is clear that the PM2.5 concentration is featured by remarkable interannual variations, reaching a peak (70.9 μg/m3) in 2007, and decreased significantly since 2013. Such a decrease of PM2.5 concentration may attribute to the Clean Air Action and the Blue Sky Protection Campaigns in China (Zhang et al., 2019). Figure 2 shows the first two EOF modes of the PM2.5 concentration in Eastern China. These two modes can be significantly separated from each other via the North Test. The first EOF pattern, explaining 59.05% of the total variance, indicates the consistent spatial characteristics of PM2.5 in the whole of Eastern China. The highest PM2.5 is located in the NCP, indicating that the PM2.5 variability in this region is the largest. Figure 2B shows the normalized principal component (PC1) time series corresponding to EOF1, and the correlation coefficient of PC1 with the area-averaged PM2.5 time series (Figure 1B) is 0.98, exceeding the 99% confidence level. Therefore, EOF1 mainly shows a consistent spatial variability of PM2.5 in Eastern China, and reflects the consistent anthropogenic emission in the whole region. The second EOF pattern and its time series are shown in Figures 2C, D, and the percentage contributions of PC2 to the total variance is 13.82%. EOF2 presents a North-South dipole pattern of PM2.5 in the Eastern China (Figure 2C), and it reflects the opposite variability characteristics of PM2.5 in the North and South of Eastern China, which may be related to different impacts of large-scale atmospheric circulations on the North Eastern and South Eastern China.
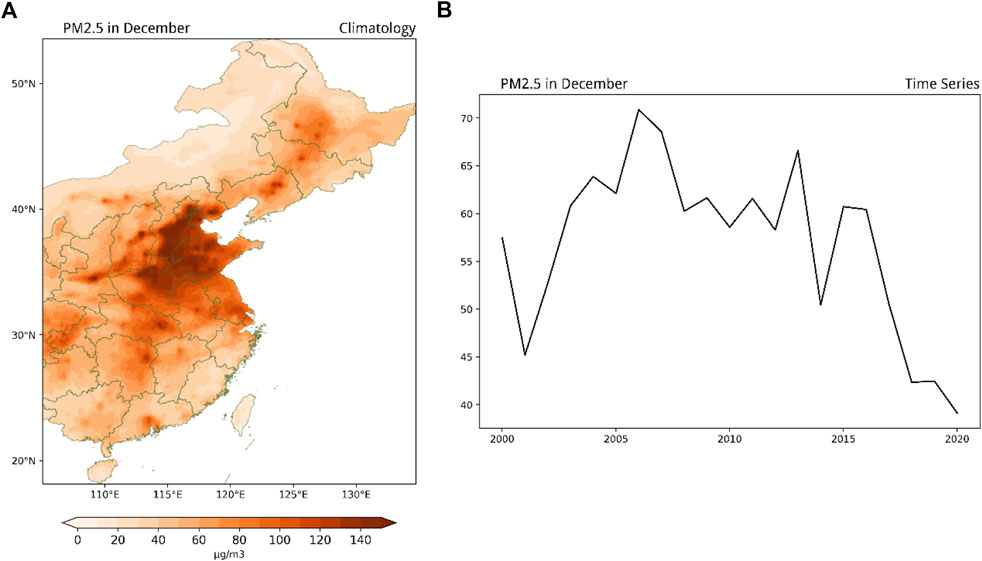
FIGURE 1. (A) Spatial distribution of PM2.5 climatology in Eastern China in December during 2000–2020. (B) Area-mean time series of PM2.5 in Eastern China during 2000–2020.
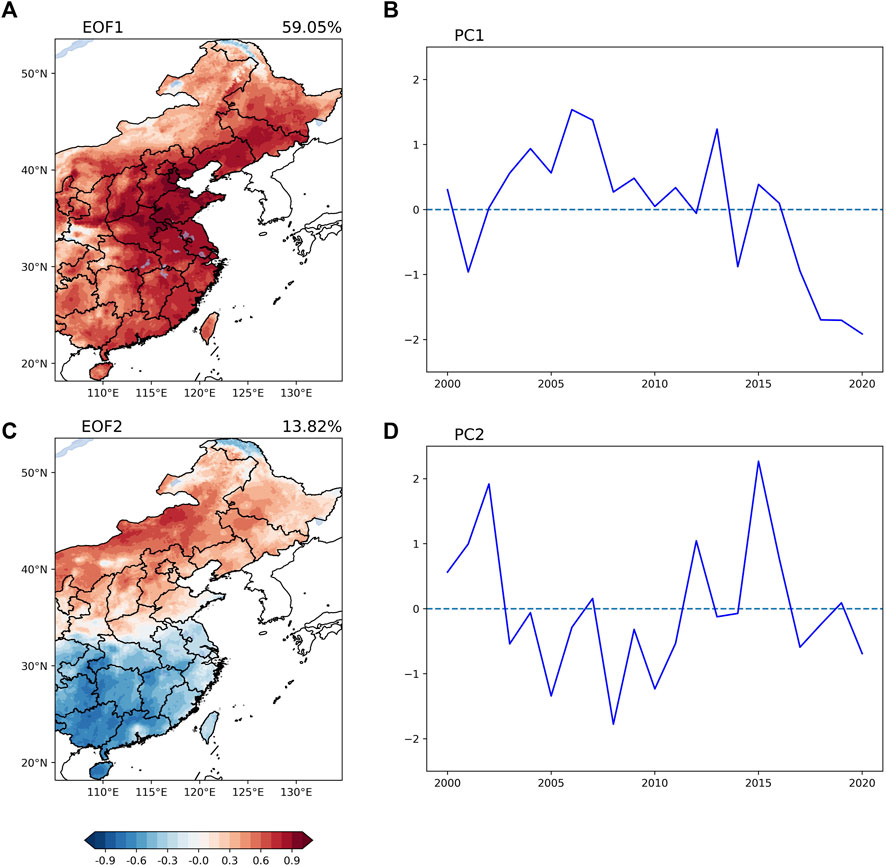
FIGURE 2. (A) The first EOF spatial pattern of PM2.5 over Eastern China in December, (B) the PC1 corresponding to (A) EOF1. (C, D) As in (A, B), but for EOF2 and PC2, respectively.
In order to study the influence of atmospheric circulation on PM2.5 in Eastern China, we primarily focus on the EOF2 pattern with the North-South dipole distribution in the following analysis. Figure 3 presents the regression patterns of atmospheric circulation onto the normalized PC2. Significant anomalies of local meteorological conditions associated with the positive phase of PC2 can be observed in the Eastern China. The positive PM2.5 concentrations in the North China are associated with the weakened surface wind speed, the decreased boundary layer height (BLH), and the increased inversion of air temperature (Figures 3A–C). The weak wind speed and the decreased BLH suppress the horizontal and vertical dispersion of the pollutants (Han et al., 2017; Wang et al., 2018). Temperature inversion in the lower troposphere usually increases the atmospheric stability and suppresses the vertical diffusion of pollutant, which finally results in more-than-normal PM2.5 pollution accumulated in the North Eastern China. In contrast, in the South Eastern China, the increased precipitation is conducive to PM2.5 dispersion by wet deposition (Figure 3D). Although BLH decreased slightly and temperature inversion increased over South Eastern China (Figures 3B, C), these meteorological variables are unfavorable for haze pollution over South Eastern China compared with precipitation (He et al., 2019). Hence, these results indicate that the local meteorological conditions favorable for the variations of PM2.5 pollution are completely different in the South Eastern China and in the North Eastern China.
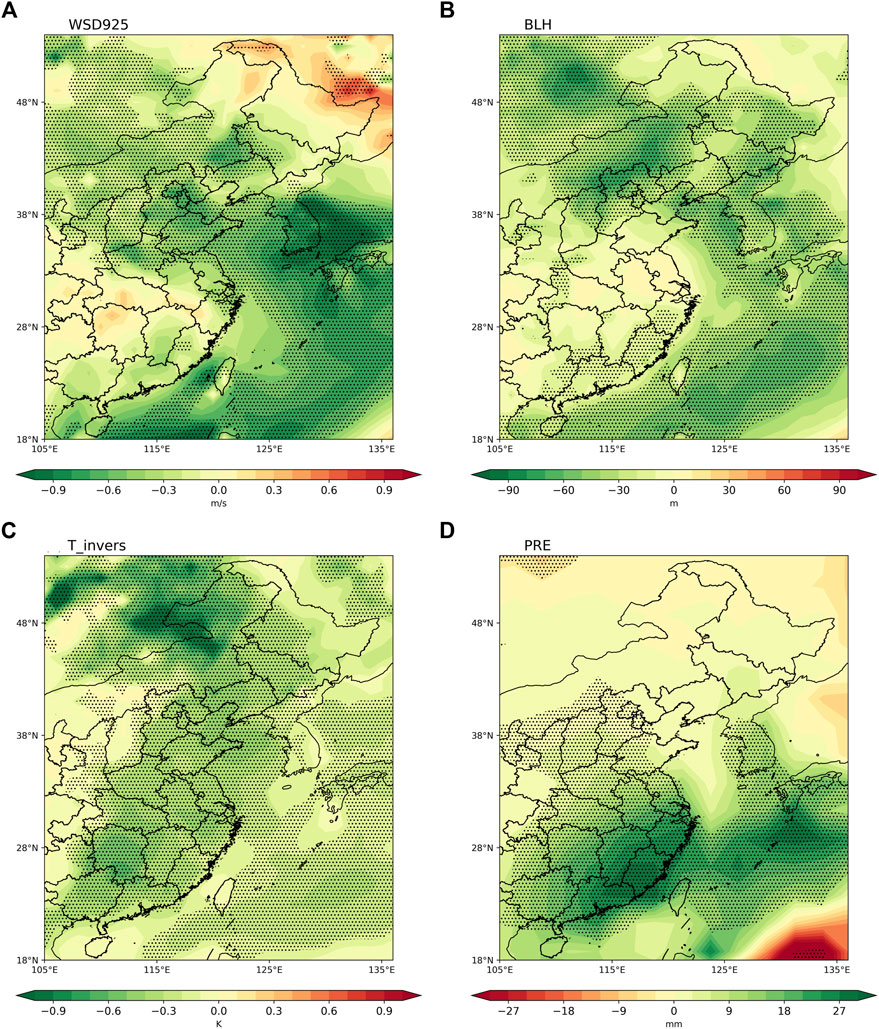
FIGURE 3. Anomalies for (A) wind speed at 925 hPa (WSD925), (B) boundary layer height (BLH), (C) vertical differences of air temperature between 850 and 925 hPa (T_invers), (D) precipitation (PRE) obtained by regression upon the normalized PC2. Stippling regions indicate the significance at the 90% confidence level.
The spatial patterns of atmospheric circulation anomalies related to the PC2 show an equivalent barotropic structure from the lower troposphere to the upper troposphere (Figures 4, 5). The 850-hPa wind presents a strong anticyclonic anomaly over the North Eastern China, accompanied with a prominent southerly anomaly over the East China (Figure 4). The southerly anomalies reduce the climatological mean northerly (Supplementary Figure S9), and result in the decreased surface wind speed (Figure 3A) and suppress the horizontal dispersion of the pollutants, thus causing more serious PM2.5 pollution in the North Eastern China. Figure 5A shows the results of 250-hPa geopotential height and T-N wave flux regressed onto the normalized PC2 index during 2000–2020. An atmospheric wave train is evidently observed extending from the Atlantic to the Eurasia. When the wave train arrives the Eastern Europe, it splits into two branches. The north wave train passes through the Ural Mountains arriving at the North Eastern China, while the South wave train propagates through the northern Indian toward the Eastern China. These two wave trains converge in Eastern China, and are in favor of the formation of an anticyclone in the North and a weak cyclone in the South of Eastern China, respectively, consistent with the North-South dipole pattern of the PM2.5 concentrations (Figure 2C).
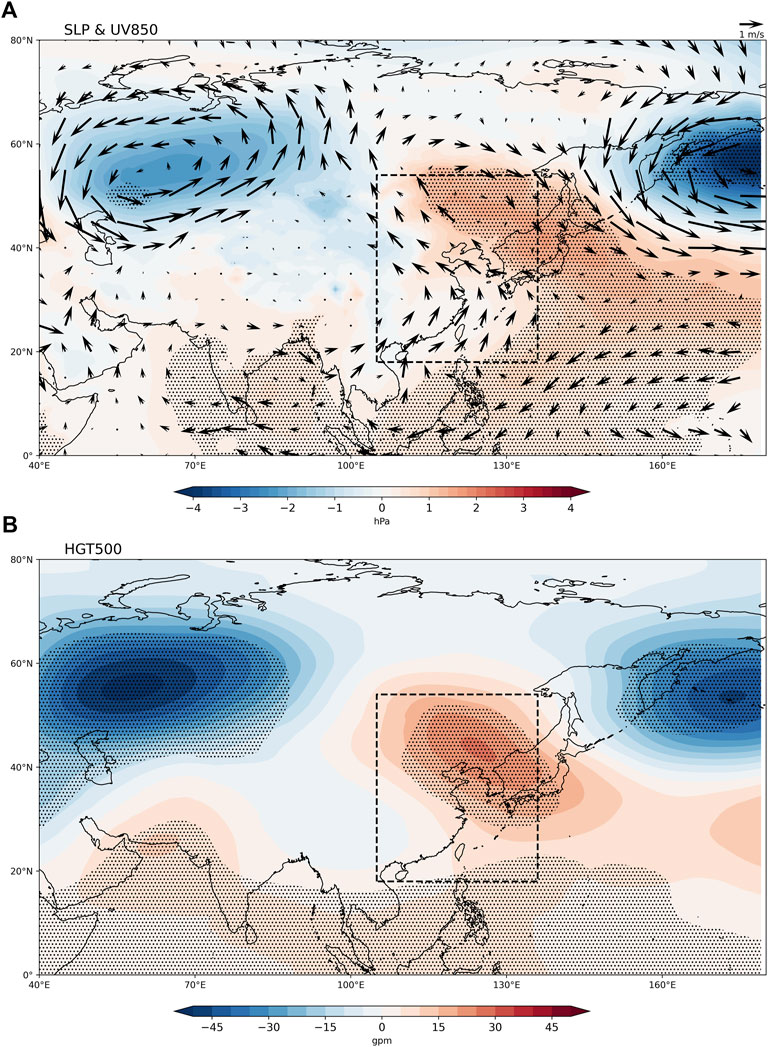
FIGURE 4. As in Figure 3, but for (A) sea level pressure (SLP, shading) and 850-hPa winds (UV850, vectors), (B) geopotential height at 500 hPa (HGT500). Stippling regions indicate the significance at the 90% confidence level.
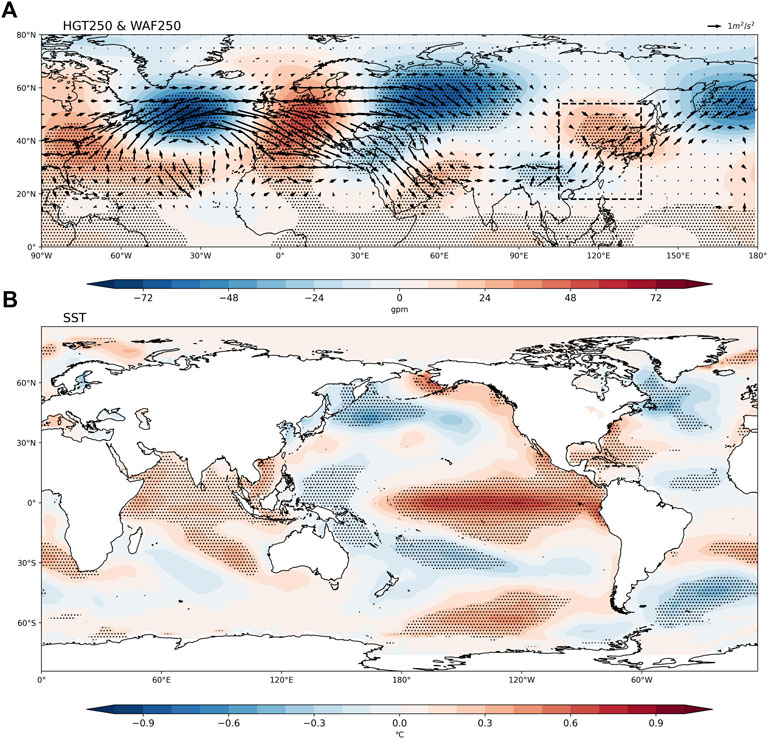
FIGURE 5. As in Figure 3, but for (A) geopotential height at 250hpa (HGT250, shading) and corresponding wave activity flux (WAF250, vectors), (B) sea surface temperature (SST). Stippling regions indicate the significance at the 90% confidence level.
In order to explore the formation mechanism of the North wave train and the South wave train, the simultaneous sea surface temperature (SST) are further regressed onto the normalized PC2 index during 2000–2020 (Figure 5B). It is clear that there are obvious SST anomalies (SSTAs) in the central and eastern equatorial Pacific, presenting the most significantly positive SSTAs similar to ENSO. It indicates that the ENSO may have the possibility to affect the dipole distribution of PM2.5 concentration in Eastern China. In order to investigate the possible effects of ENSO, the Niño-3.4 index is calculated as the area-mean SSTAs over 5°S-5°N, 120°-170°W. The correlation coefficient between the Niño-3.4 index and the PC2 was 0.52 above the 95% significance level. It indicates that ENSO can explain about 27.0% of the total variance of the PC2. Figure 6 displays the geopotential height and wave activity fluxes at 250-hPa obtained by regression upon the Niño-3.4 index. It should be noted that the regression results of the South wave train are similar with that regressed by the normalized PC2 (Figure 5A), but the North wave train is weaker compared with PC2 regressed ones. The results indicate that ENSO contribute greatly to the formation of the South wave train, and can also partly lead to the formation of the North wave train. Actually, according to previous studies, ENSO may induce a wave train that splits into two branches in Eurasia or cause a strong wave train to spread from mid-high latitudes to eastern China (Sun et al., 2019; An et al., 2022). Ma et al. (2022) pointed out that ENSO can induce significant precipitation anomalies in the eastern Indian Ocean/western Pacific through the double Walker circulation, which in turn affects the atmospheric circulations and results in a wave train similar to the South wave train in the upper troposphere. However, ENSO may indirectly have an effect on the North wave train because ENSO can affect the SST over the remote North Atlantic through the effects of atmospheric bridge, which in turn spreads its influences on the East Asian climate. Hence, to confirm the effects of ENSO on the PM2.5 in Eastern China, Figure 7 shows the local meteorological elements associated with the Niño-3.4 index, which displays a large resemblance to those in Figure 3. For example, the decreased wind speed and the BLH and the increased inversion temperature emerge in the North of Eastern China. The increased precipitation anomalies occur in the South of Eastern China. The results suggest that ENSO can affect the dipole distribution of PM2.5 in Eastern China by affecting the atmospheric wave train. The North wave train may also be affected by other atmospheric external forcing signals other than ENSO because of the weaker North wave train related to ENSO.
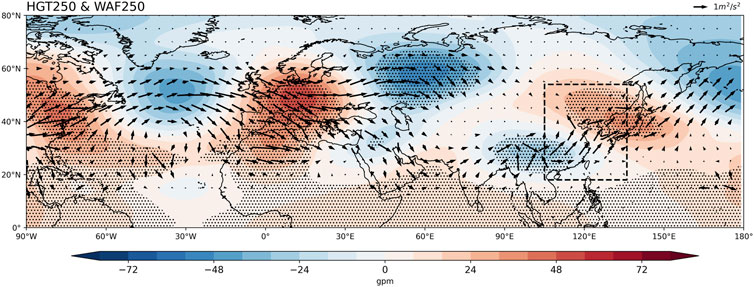
FIGURE 6. As in Figure 5A, but for Nino-3.4 index. Stippling regions indicate the significance at the 90% confidence level.
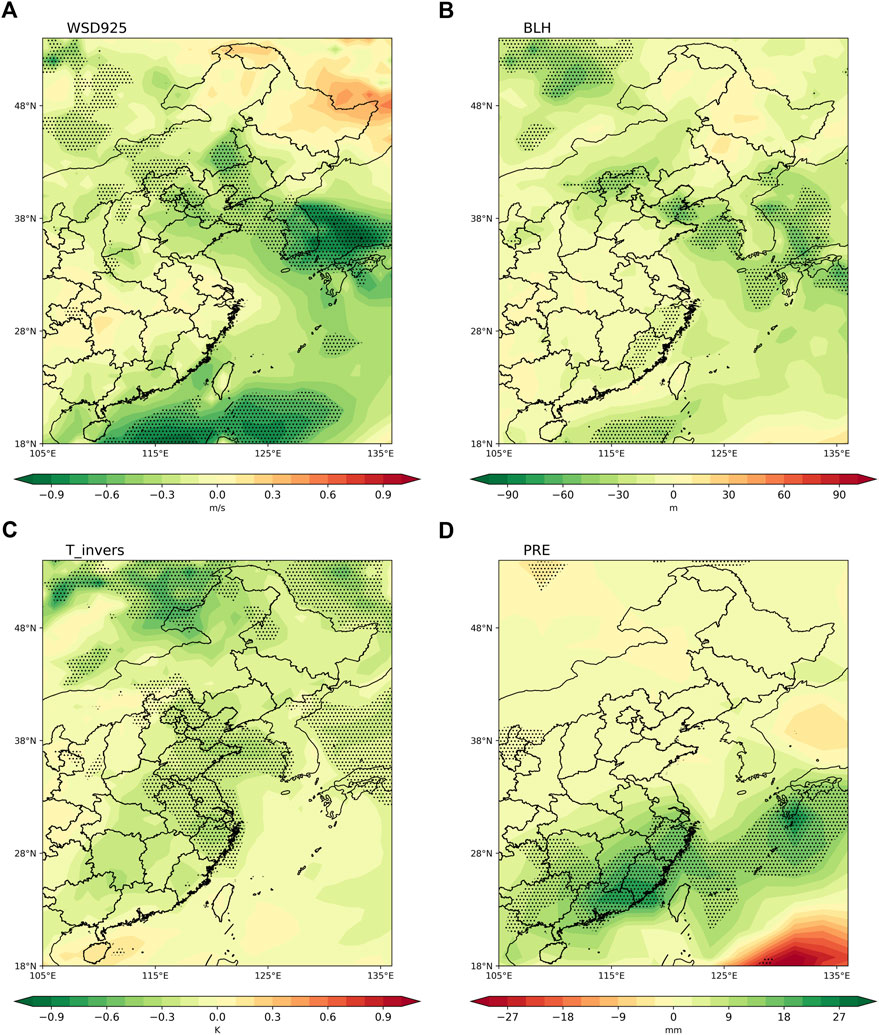
FIGURE 7. Anomalies for (A) wind speed at 925 hPa (WSD925), (B) boundary layer height (BLH), (C) vertical differences of air temperature between 850 and 925 hPa (T_invers), (D), precipitation (PRE) obtained by regression upon normalized Nino-3.4 index. Stippling regions in (A–D) indicate the significance at the 90% confidence level.
In order to study the influence of other atmospheric external forcing signals rather than ENSO on the North wave train, we use the partial regression method to eliminate the ENSO signal from the PC2, the SST and the SIC fields. Figure 8A displays anomalies of simultaneous SST obtained by regression upon the normalized PC2 after removing the ENSO signals. It is clear that there are still significant cold SSTAs in the Labrador Sea of the North Atlantic. Hence, we further define the Labrador Sea SST index (LSI) as the spatially weighted SST anomalies over the North Atlantic (50°–62°N, 60°–47°W). Figure 9A shows the regression patterns of the geopotential height and wave activity fluxes at 250-hPa upon the LSI. A North wave train that originates from the Atlantic and propagates eastward toward the Eastern China can be clearly found when the Labrador SST was warm. Similarly; Figure 8B shows the regression patterns of November SIC upon the normalized PC2 after eliminating ENSO signals. It is found that there is a significant sea ice reduction anomaly near the Kara Sea. As a result, the Kara Sea ice index (KSI) is then defined as the spatially weighted SIC over 78°–85°N and 90°–114°E. The 250-hPa geopotential height and T-N wave flux associated with the decreased KSI (Figure 9B) present a similar North wave train propagating toward North of the Eastern China. These results indicate that besides ENSO, the Labrador Sea SST and preceding Kara Sea ice can also affect the formation of the North wave train and may contribute to the variations of PM2.5 in Eastern China. This is consistent with the previous studies (Ma et al., 2021).
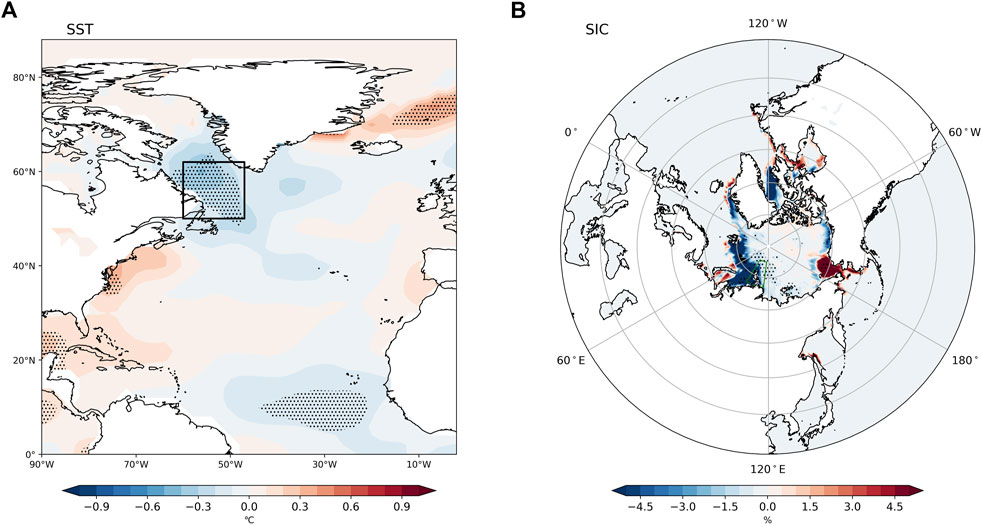
FIGURE 8. Regression maps of (A) SST in the North Atlantic in December and (B) sea ice concentration (SIC) in November onto the PC2 time series after removing ENSO signal. Stippling regions indicate the significance at the 90% confidence level.
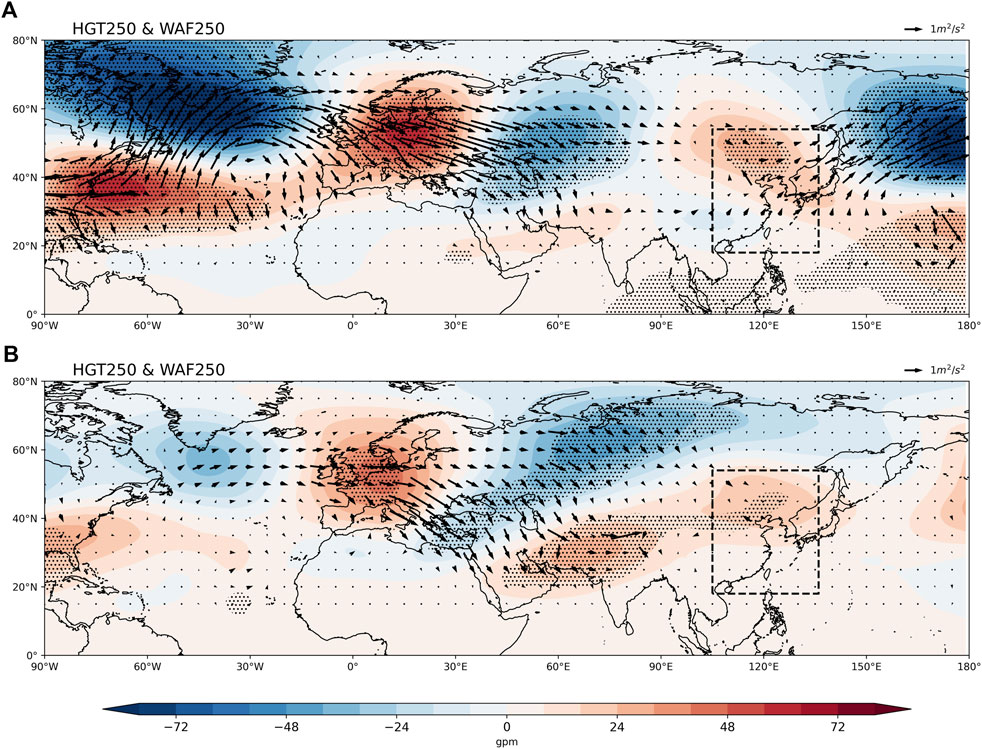
FIGURE 9. As in Figure 6, but for (A) LSI index and (B) KSI index, respectively. Stippling regions indicate the significance at the 90% confidence level.
The above analysis shows that the ENSO, the Labrador Sea SST and the Kara Sea ice all can affect the dipole pattern of PM2.5 in Eastern China. To comprehensively characterize the effect of these atmospheric external forcing signals on the dipole structure of the PM2.5 concentrations in Eastern China, we define a reconstructed index (REC), REC= (r1* Niño-3.4 + r2*LSI + r3*KSI)/(|r1|+|r2|+|r3|), where r1, r2, and r3 are the correlation coefficients of Niño-3.4, LSI, and KSI with the PC2 (Niño-3.4, LSI, and KSI are independent of each other). Figure 10A shows that the correlation coefficient between the REC and PC2 can reach 0.72 exceeding the 99% significance test; Figures 10B, C show the anomalous patterns of the sea level pressure, 850-hPa wind, 250-hPa geopotential height and T-N wave flux regressed upon the normalized REC index during 2000–2020. During the positive phase of the REC index, an anticyclonic circulation and the southerly anomaly are significant in the North China (Figure 10B). In addition, the North and South wave trains regressed by the REC index (Figure 10C) are also similar to those onto the PC2 index (Figure 4A; Figure 5A). These atmospheric circulations facilitate the PM2.5 anomalies in Eastern China to present a North-South dipoles pattern. Hence, the reconstruction index defined in the study can better explain the EOF2 pattern of the PM2.5 in Eastern China, and may provide the prediction potential for the PM2.5 in Eastern China in December.
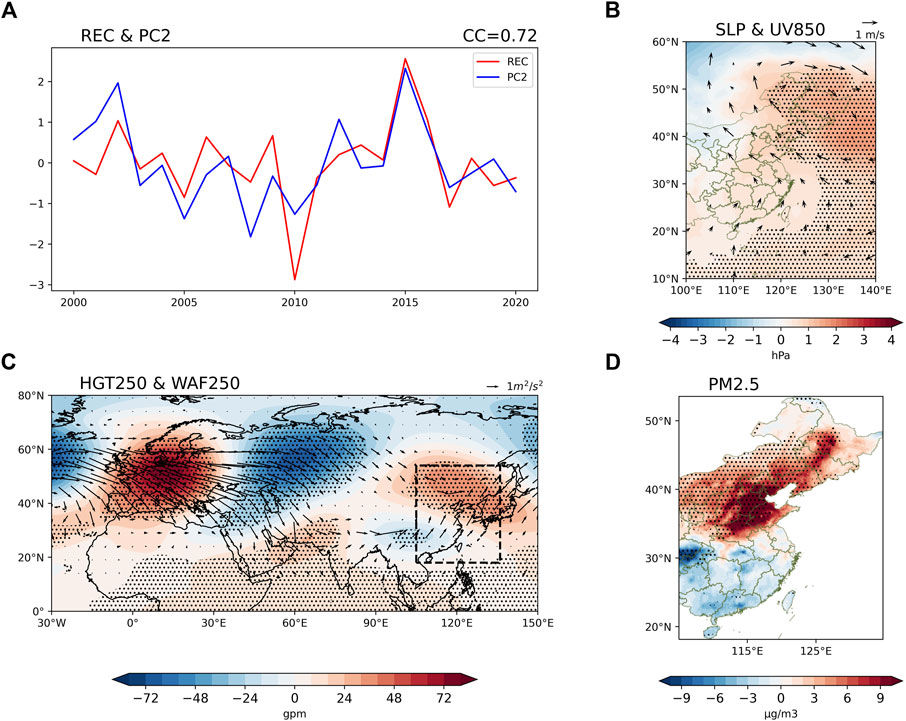
FIGURE 10. (A) Time series of reconstructed index (REC) based on multiple climate factors (red line) and PC2 (blue line) during 2000–2020. (B) Anomalies of SLP and 850-hPa winds (UV850) obtained by regression upon the REC. (C, D) As in (B), but for HGT and WAF at 250hPa, and PM2.5 in Eastern China, respectively. Stippling regions in (B, D) indicate the significance at the 90% confidence level.
In this study, we used the latest PM2.5 data provided by Tsinghua University to study the temporal-spatial distribution and mechanism of PM2.5 over Eastern China in December. Our study found that during 2000–2020, the PM2.5 climatology in Eastern China displays significant regional differences, with the maximum values located in the North China Plain. The area-mean PM2.5 index in Eastern China presents obvious interannual variations, and also experiences a significantly decadal decline after 2013, which may be closely related to national emission reduction policy in recent years. Then, an EOF method is used to investigate the leading temporal and spatial modes of the PM2.5 in Eastern China. Two significant and separated EOF modes are obtained. The EOF1 shows a consistent variability in the whole of the Eastern China, and explains about 59.05% of the total variance. The correlation coefficient between the PC1 and the original area-mean PM2.5 index is 0.98, indicating that the first pattern mainly reveals the emission trend of PM2.5 in Eastern China. The EOF2 presents a North-South dipole pattern in Eastern China, which reflects the opposite influence of atmospheric circulations on PM2.5 in the North and South of Eastern China.
To explore the formation mechanism of the North-South dipole pattern in Eastern China, the atmospheric variables, sea surface temperature, and sea ice are regressed upon the normalized PC2 index. Results show that the increase of PM2.5 concentrations in the North of Eastern China is related to the decrease of surface wind speed, the decrease of boundary layer height and the increase of inversion temperature. In contrast, the decrease of PM2.5 concentrations in the South of Eastern China is associated with the increase of precipitation. There are two atmospheric wave trains in the upper troposphere affecting the North-South dipole pattern of PM2.5 concentrations in Eastern China. The North wave train induces an anticyclone formed in the North China, and the South wave train induces a cyclone in the South China. The South wave train is mainly affected by the precipitation anomaly in the eastern Indian Ocean/western Pacific through a double Walker circulation induced by ENSO, which is helpful to the formation of the South wave train (Ma et al., 2022). The North wave train is jointly affected by ENSO, the sea surface temperature over the Labrador Sea and the preceding sea ice over the Kara Sea. In order to comprehensively characterize the influence of atmospheric external forcing signals on the South and North wave trains, we use the Niño-3.4, LSI, KSI index to define a reconstructed index, The correlation coefficient between the REC and PC2 can reach 0.72, exceeding the 99% confidence level. In addition, the regression patterns of the atmospheric circulations and PM2.5 concentrations onto the normalized REC index present a large similarity to those regressed onto the PC2 index. We perform a parallel analysis using atmospheric circulation data from JRA-55 and SST data from HadISST in the period 2000–2020. The results are basically consistent with those based on ERA5 and ERSST data (Supplementary Figures S1S8). Hence, it suggests that the variations of the dipole pattern of PM2.5 in Eastern China can be attributed to these atmospheric external forcing signals, which may provide some prediction potential. However, there is no particularly in-depth analysis of the sources of each external signal, which deserves a further study in the future.
The original contributions presented in the study are included in the article/Supplementary Material, further inquiries can be directed to the corresponding author. The Tracking Air Pollution data are available online via http://tapdata.org.cn/. The ERA5, SIC, SST, and GPCP data are available online (https://www.ecmwf.int/en/forecasts/dataset/ecmwf-reanalysis-v5), (https://www.metoffice.gov.uk/hadobs/hadisst/), (https://psl.noaa.gov/data/gridded/data.noaa.ersst.v5.html), and (https://psl.noaa.gov/data/gridded/data.gpcp.html), respectively.
LL designed the research, DB performed the analysis. DB and LL wrote the paper. ZD, KM, and YH help to improve the manuscript.
The National Natural Science Foundation of China Major Project (42090030). This work was supported by the National Natural Science Foundation of China Major Project (42090030).
The authors declare that the research was conducted in the absence of any commercial or financial relationships that could be construed as a potential conflict of interest.
All claims expressed in this article are solely those of the authors and do not necessarily represent those of their affiliated organizations, or those of the publisher, the editors and the reviewers. Any product that may be evaluated in this article, or claim that may be made by its manufacturer, is not guaranteed or endorsed by the publisher.
The Supplementary Material for this article can be found online at: https://www.frontiersin.org/articles/10.3389/fenvs.2023.1134940/full#supplementary-material
Adler, R. F., Huffman, G. J., Chang, A., Ferraro, R., Xie, P. P., Janowiak, J., et al. (2003). The version-2 global precipitation climatology project (GPCP) monthly precipitation analysis (1979-present). J. Hydrometeorol. 4, 1147–1167. doi:10.1175/1525-7541(2003)004<1147:tvgpcp>2.0.co;2
An, X., Chen, W., Fu, S., Hu, P., Li, C., and Sheng, L. (2022). Possible dynamic mechanisms of high- and low-latitude wave trains over Eurasia and their impacts on air pollution over the North China Plain in early winter. J. Geophys. Res-Atmos 127. doi:10.1029/2022JD036732
Chen, S., Guo, J., Song, L., Cohen, J. B., and Wang, Y. (2020). Temporal disparity of the atmospheric systems contributing to interannual variation of wintertime haze pollution in the North China Plain. Int. J. Climatol. 40, 128–144. doi:10.1002/joc.6198
Chen, Z., Chen, D., Zhao, C., Kwan, M.-p., Cai, J., Zhuang, Y., et al. (2020). Influence of meteorological conditions on PM2.5 concentrations across China: A review of methodology and mechanism. Environ. Int. 139, 105558. doi:10.1016/j.envint.2020.105558
Cheng, X. G., Liu, J., Zhao, T. L., Gong, S. L., Xu, X. D., Xie, X. N., et al. (2021). A teleconnection between sea surface temperature in the central and eastern Pacific and wintertime haze variations in southern China. Theor. Appl. Climatol. 143, 349–359. doi:10.1007/s00704-020-03434-7
Dang, R. J., and Liao, H. (2019). Severe winter haze days in the Beijing-Tianjin-Hebei region from 1985 to 2017 and the roles of anthropogenic emissions and meteorology. Atmos. Chem. Phy. 19, 10801–10816. doi:10.5194/acp-19-10801-2019
Geng, G., Xiao, Q., Liu, S., Liu, X., Cheng, J., Zheng, Y., et al. (2021). Tracking air pollution in China: Near real-time PM2.5 retrievals from multisource data fusion. Environ. Sci. Technol. 55, 12106–12115. doi:10.1021/acs.est.1c01863
Gong, H., Wang, L., and Chen, W. (2019c). Multidecadal changes in the influence of the arctic oscillation on the East asian surface air temperature in boreal winter. Atmos 10, 757. doi:10.3390/atmos10120757
Gong, H., Wang, L., Chen, W., Nath, D., Huang, G., and Tao, W. (2015). Diverse influences of ENSO on the East Asian-western Pacific winter climate tied to different ENSO properties in CMIP5 models. J. Clim. 28, 2187–2202. doi:10.1175/jcli-d-14-00405.1
Gong, H., Wang, L., Chen, W., and Wu, R. (2019a). Attribution of the East Asian winter temperature trends during 1979-2018: Role of external forcing and internal variability. Geophys. Res. Lett. 46, 10874–10881. doi:10.1029/2019gl084154
Gong, H., Wang, L., Chen, W., Wu, R., Wei, K., and Cui, X. (2014). The climatology and interannual variability of the East Asian winter monsoon in CMIP5 models. J. Clim. 27, 1659–1678. doi:10.1175/jcli-d-13-00039.1
Gong, H., Wang, L., Chen, W., Wu, R., Zhou, W., Liu, L., et al. (2019b). Diversity of the wintertime arctic oscillation pattern among CMIP5 models: Role of the stratospheric polar vortex. J. Clim. 32, 5235–5250. doi:10.1175/jcli-d-18-0603.1
Gong, H., Wang, L., Zhou, W., Chen, W., Wu, R., Liu, L., et al. (2018). Revisiting the northern mode of East Asian winter monsoon variation and its response to global warming. J. Clim. 31, 9001–9014. doi:10.1175/jcli-d-18-0136.1
Guo, J., Su, T., Li, Z., Miao, Y., Li, J., Liu, H., et al. (2017). Declining frequency of summertime local-scale precipitation over eastern China from 1970 to 2010 and its potential link to aerosols. Geophys. Res. Lett. 44, 5700–5708. doi:10.1002/2017gl073533
Han, Z., Zhou, B., Xu, Y., Wu, J., and Shi, Y. (2017). Projected changes in haze pollution potential in China: An ensemble of regional climate model simulations. Atmos. Chem. Phys. 17, 10109–10123. doi:10.5194/acp-17-10109-2017
He, C., Liu, R., Wang, X., Liu, S. C., Zhou, T., and Liao, W. (2019). How does El Nino-Southern Oscillation modulate the interannual variability of winter haze days over eastern China? Sci. Total Environ. 651, 1892–1902. doi:10.1016/j.scitotenv.2018.10.100
Hersbach, H., Bell, B., Berrisford, P., Hirahara, S., Horanyi, A., Munoz-Sabater, J., et al. (2020). The ERA5 global reanalysis. Q. J. R. Meteorological Soc. 146, 1999–2049. doi:10.1002/qj.3803
Hirsch, R. M., Slack, J. R., and Smith, and R. A. (1982). Techniques of trend analysis for monthly water-quality data. Water Resour. Res. 18, 107–121. doi:10.1029/wr018i001p00107
Huang, B., Thorne, P. W., Banzon, V. F., Boyer, T., Chepurin, G., Lawrimore, J. H., et al. (2017). Extended reconstructed Sea Surface temperature, version 5 (ERSSTv5): Upgrades, validations, and intercomparisons. J. Clim. 30, 8179–8205. doi:10.1175/jcli-d-16-0836.1
Li, G., Fang, C., Wang, S., and Sun, S. (2016). The effect of economic growth, urbanization, and industrialization on fine particulate matter (PM2.5) concentrations in China. Environ. Sci. Technol. 50, 11452–11459. doi:10.1021/acs.est.6b02562
Li, Q., Zhang, R. H., and Wang, Y. (2016). Interannual variation of the wintertime fog-haze days across central and eastern China and its relation with East Asian winter monsoon. Int. J. Climatol. 36, 346–354. doi:10.1002/joc.4350
Li, S., Ren, A., Guo, B., Du, Z., Zhang, S., Tian, M., et al. (2015). Influence of meteorological factors and VOCs on PM(2.5)during severe air pollution period in shijiazhuang in winter. Chongqing: PEOPLES R CHINA, 588–592.
Ma, Q., Zhang, J., Ma, Y., Game, A. T., Chen, Z., Chang, Y., et al. (2021). How do Multiscale Interactions affect extreme precipitation in eastern central Asia? J. Clim. 34, 7475–7491. doi:10.1175/jcli-d-20-0763.1
Ma, T., Chen, W., Chen, S., Garfinkel, C. I., Ding, S., Song, L., et al. (2022). Different ENSO teleconnections over east Asia in early and late winter: Role of precipitation anomalies in the tropical Indian ocean and far western pacific. J. Clim. 35, 4319–4335. doi:10.1175/jcli-d-21-0805.1
Mao, L., Liu, R., Liao, W., Wang, X., Shao, M., Liu, S. C., et al. (2018). An observation-based perspective of winter haze days in four major polluted regions of China. Natl. Sci. Rev. 6, 515–523. doi:10.1093/nsr/nwy118
Pui, D. Y. H., Chen, S. C., and Zuo, Z. L. (2014). PM2.5 in China: Measurements, sources, visibility and health effects, and mitigation. Particuology 13, 1–26. doi:10.1016/j.partic.2013.11.001
Rayner, N. A., Parker, D. E., Horton, E. B., Folland, C. K., Alexander, L. V., Rowell, D. P., et al. (2003). Global analyses of sea surface temperature, sea ice, and night marine air temperature since the late nineteenth century. J. Geophys. Res-Atmos. 108, 4407. doi:10.1029/2002JD002670
Sun, B., Wang, H., and Zhou, B. (2019). Interdecadal variation of the relationship between East Asian water vapor transport and tropical Pacific Sea Surface temperatures during january and associated mechanisms. J. Clim. 32, 7575–7594. doi:10.1175/jcli-d-19-0290.1
Takaya, K., and Nakamura, H. (2001). A formulation of a phase-independent wave-activity flux for stationary and migratory quasigeostrophic eddies on a zonally varying basic flow. J. Atmos. Sci. 58, 608–627. doi:10.1175/1520-0469(2001)058<0608:afoapi>2.0.co;2
Wang, H. J., and Chen, H. P. (2016). Understanding the recent trend of haze pollution in eastern China: Roles of climate change. Atmos. Chem. Phys. 16, 4205–4211. doi:10.5194/acp-16-4205-2016
Wang, J., Zhu, Z., Qi, L., Zhao, Q., He, J., and Wang, J. X. L. (2019). Two pathways of how remote SST anomalies drive the interannual variability of autumnal haze days in the Beijing–Tianjin–Hebei region, China. Atmos. Chem. Phys. 19, 1521–1535. doi:10.5194/acp-19-1521-2019
Wang, X. Y., Dickinson, R. E., Su, L. Y., Zhou, C. L. E., and Wang, K. C. (2018). PM2.5 pollution in China and how it has been exacerbated by terrain and meteorological conditions. B. Am. Meteorol. Soc. 99, 105–119. doi:10.1175/bams-d-16-0301.1
Xiao, Q., Geng, G., Cheng, J., Liang, F., Li, R., Meng, X., et al. (2021a). Evaluation of gap-filling approaches in satellite-based daily PM2.5 prediction models. Atmos. Environ. 244, 117921. doi:10.1016/j.atmosenv.2020.117921
Xiao, Q., Geng, G., Liu, S., Liu, J., Meng, X., and Zhang, Q. (2022). Spatiotemporal continuous estimates of daily 1-km PM2.5 from 2000 to present under the Tracking Air Pollution in China (TAP) framework. Atmos. Chem. Phys. 22, 13229–13242. doi:10.5194/acp-22-13229-2022
Xiao, Q., Zheng, Y., Geng, G., Chen, C., Huang, X., Che, H., et al. (2021b). Separating emission and meteorological contributions to long-term PM2.5 trends over eastern China during 2000–2018. Atmos. Chem. Phys. 21, 9475–9496. doi:10.5194/acp-21-9475-2021
Xu, P., Chen, Y. F., and Ye, X. J. (2013). Haze, air pollution, and health in China. Lancet 382, 2067. doi:10.1016/s0140-6736(13)62693-8
Yin, Z., Wang, H., and Ma, X. (2019). Possible relationship between the chukchi Sea Ice in the early winter and the february haze pollution in the North China plain. J. Clim. 32, 5179–5190. doi:10.1175/jcli-d-18-0634.1
Yu, X. C., Wang, Z. L., Zhang, H., He, J. J., and Li, Y. (2020). Contrasting impacts of two types of El Nino events on winter haze days in China's Jing-Jin-Ji region. Atmos. Chem. Phys. 20, 10279–10293. doi:10.5194/acp-20-10279-2020
Zhang, Q., Zheng, Y. X., Tong, D., Shao, M., Wang, S. X., Zhang, Y. H., et al. (2019). Drivers of improved PM2.5 air quality in China from 2013 to 2017. P. Natl. Acad. Sci. USA. 116, 24463–24469. doi:10.1073/pnas.1907956116
Zhang, R. H., Li, Q., and Zhang, R. N. (2014). Meteorological conditions for the persistent severe fog and haze event over eastern China in January 2013. Sci. China Earth Sci. 57, 26–35. doi:10.1007/s11430-013-4774-3
Zhang, X. Y., Wang, L., Wang, W. H., Cao, D. J., Wang, X., and Ye, D. X. (2015). Long-term trend and spatiotemporal variations of haze over China by satellite observations from 1979 to 2013. Atmos. Environ. 119, 362–373. doi:10.1016/j.atmosenv.2015.08.053
Zhang, Y., Yin, Z., and Wang, H. (2020). Roles of climate variability on the rapid increases of early winter haze pollution in North China after 2010. Atmos. Chem. Phys. 20, 12211–12221. doi:10.5194/acp-20-12211-2020
Zhang, Z. Z., Wang, W. X., Cheng, M. M., Liu, S. J., Xu, J., He, Y. J., et al. (2017). The contribution of residential coal combustion to PM2.5 pollution over China's Beijing-Tianjin-Hebei region in winter. Atmos. Environ. 159, 147–161. doi:10.1016/j.atmosenv.2017.03.054
Zhao, S., Li, J., and Sun, C. (2016). Decadal variability in the occurrence of wintertime haze in central eastern China tied to the Pacific Decadal Oscillation. Sci. Rep. 6, 27424. doi:10.1038/srep27424
Zhao, W., Chen, S., Zhang, H., Wang, J., Chen, W., Wu, R., et al. (2022). Distinct impacts of ENSO on haze pollution in the beijing–tianjin–hebei region between early and late winters. J. Clim. 35, 687–704. doi:10.1175/jcli-d-21-0459.1
Keywords: PM2.5, EOF, ENSO (El Nino), Arctic sea ice, Eastern China
Citation: Bai D, Liu L, Dong Z, Ma K and Huo Y (2023) Variations and possible causes of the December PM2.5 in Eastern China during 2000–2020. Front. Environ. Sci. 11:1134940. doi: 10.3389/fenvs.2023.1134940
Received: 31 December 2022; Accepted: 17 January 2023;
Published: 08 February 2023.
Edited by:
Zhiyuan Hu, Sun Yat-sen University, ChinaReviewed by:
Shanshan Wang, Lanzhou University, ChinaCopyright © 2023 Bai, Liu, Dong, Ma and Huo. This is an open-access article distributed under the terms of the Creative Commons Attribution License (CC BY). The use, distribution or reproduction in other forums is permitted, provided the original author(s) and the copyright owner(s) are credited and that the original publication in this journal is cited, in accordance with accepted academic practice. No use, distribution or reproduction is permitted which does not comply with these terms.
*Correspondence: Lin Liu, bGlubGl1QGNtYS5nb3YuY24=
Disclaimer: All claims expressed in this article are solely those of the authors and do not necessarily represent those of their affiliated organizations, or those of the publisher, the editors and the reviewers. Any product that may be evaluated in this article or claim that may be made by its manufacturer is not guaranteed or endorsed by the publisher.
Research integrity at Frontiers
Learn more about the work of our research integrity team to safeguard the quality of each article we publish.