
94% of researchers rate our articles as excellent or good
Learn more about the work of our research integrity team to safeguard the quality of each article we publish.
Find out more
ORIGINAL RESEARCH article
Front. Environ. Sci., 30 May 2023
Sec. Environmental Informatics and Remote Sensing
Volume 11 - 2023 | https://doi.org/10.3389/fenvs.2023.1134917
This article is part of the Research TopicAdvances in Characterizing and Monitoring Land Cover/Use and Associated Ecosystem Changes Using Remote Sensing DataView all 13 articles
 Shenglin Mao
 Zhouping Shangguan*
In this study, we determined whether changes in vegetation net primary productivity (NPP) can be used to characterize the quality of terrestrial ecosystems, which is critical for global change and carbon balance. We first explored the spatial correlation of NPP and its impact on vegetation restoration. MOD17A3 remote sensing products were used to analyze the temporal and spatial changes in NPP on the Loess Plateau (LP) over the last two decades (2000–2020). The resulting spatial autocorrelation indices identified cold and hot spots in the spatial clustering patterns. The effects of climate change and human activities on the anomalous clustering of NPP were assessed using Pearson correlation analysis and multi-temporal land use land cover data. The results indicate that i) Temporally, from 2000 to 2020, the NPP of the LP increased significantly by 6.88
Global warming has significantly affected the structure, processes, and functions of terrestrial ecosystems and regional ecological environment. As an important component of terrestrial ecosystems, vegetation provides essential materials for humans and plays an inestimable role in regulating climate change, supporting ecological environments, maintaining a carbon balance, and developing renewable resources. Vegetation net primary productivity (NPP) refers to the amount of organic carbon fixed by plant photosynthesis (GPP) minus the amount consumed by its respiration and growth (Goldewijk and Leemans, 1995; Yuan et al., 2021). NPP is an important index to measure the structure and function of terrestrial ecosystems and has been used in global and regional ecological environment monitoring and crop yield estimation (Wu et al., 2020; Zhang et al., 2022). Increasing carbon storage capacity may be the most effective way to limit global warming to 1.5°C. As a major factor in evaluating carbon sources and sinks, quantitative assessment of the dynamic changes in NPP not only expand our understanding of the interactions between climate change and ecosystems but also provides theoretical support for early realization of “carbon peaking” and “carbon neutrality” in ecologically fragile areas (Lei et al., 2020).
With the rapid development of remote sensing technology, the estimation of NPP may extend from sample plots to a regional or global scale. It is possible to evaluate the NPP of terrestrial ecosystems using field measurements and model validation; however, the cost of field surveys may be a major limitation. NPP has been a research hot spot at the regional level (Wu et al., 2014; Guo et al., 2021). Currently, the CASA model of the light energy utilization model (parametric model) and the MOD17A3HGF remote sensing product calculated using the BIOME-BGC model have been widely used (Wang et al., 2020; Li et al., 2021; Xiao et al., 2022). Guided by various international conventions on global climate change, the prohibition of deforestation has become a legal provision, and productivity estimates can only be obtained either directly from the field or via remote sensing data. Although the CASA model has recently been improved (Zhu et al., 2007; Pei et al., 2018), and the MOD17A3 HGF data have been refined from 500 m to 250 m, their reliability warrants improvement. In different natural environmental conditions in other regions, the application scope varies, while our understanding of the mechanism regulating various interactions of NPP remains rudimentary, thereby hindering parameter regulations (Kolby Smith et al., 2016). Therefore, there are errors in NPP estimations. A common method used in ecology and geology is the linear regression from the regional to pixel-by-pixel scale to reveal the temporal and spatial changes in vegetation NPP and its response to climate change. Cui et al. (2018) analyzed the growth trend in vegetation NPP in China from 1982 to 2011 based on the GLOPEM-CEVSA model, revealing a growth rate of 5.66
LP is an important ecological barrier in China, which has one of the most serious soil erosion areas. Prior to the 1990s, China controlled soil erosion by constructing terraces and silt dams and implementing management projects for slopes and small watersheds. Since 2000, China has initiated large-scale projects such as the Grain for Green Project (GGP), gully control, and land reclamation. Thus, the rate of vegetation coverage increased from 31.6% in 1999 to 65% in 2017. In 2016, China has launched the first batch of pilot projects for the ecological protection of mountains, rivers, forests, fields, and lakes. State policies have continuously promoted the construction of rural revitalization and ecological civilization projects. Improving the vegetation coverage of the LP through natural restoration has achieved remarkable results. Although the Grain for Green Project has been implemented to alleviate the problems caused by human activities and natural factors, the local ecological environment remains very fragile, and problems such as insufficient vegetation carrying capacity are becoming increasingly prominent (He et al., 2006; Fu et al., 2011). Vegetation restoration has had several effects on this ecosystem (Lü et al., 2012; Zhao et al., 2013; Zhang et al., 2018), and the vegetation NPP of the LP has evident spatial heterogeneity with interannual variation. Prior to 1990, many scholars explored the changes in vegetation on LP in historical periods using pollen data and other technologies (Liu et al., 1996; Jiang and Ding, 2005). Given the severe soil and water loss, the correlation between vegetation restoration and soil environment after afforestation has been investigated using sample plots (Shangguan and Zheng, 2006). After 2000, remote sensing methods were used to reveal the changes in vegetation cover in the LP, and their association with climate and social factors and also analyze the influencing factors of vegetation change (Chen et al., 2007). At the plot scale, the interaction and mechanism between vegetation and soil erosion, soil and water conservation and organic carbon has attracted attention. The relationship between water and vegetation has been well demonstrated. How to limit the dry layer of soil and sustainably manage regional vegetation has become a hot research topic (Zhang et al., 2016; Ma et al., 2022).
Data on the spatial autocorrelation of vegetation NPP on the LP are limited. We hypothesize that the vegetation NPP on LP has a spatial autocorrelation and correlates with natural factors and human activities. Therefore, we aimed to (1) reveal the temporal and spatial distribution patterns and NPP variation on the LP from 2000 to 2020, (2) explore the spatial dependence and heterogeneity of NPP in the LP from 2000 to 2020 by exploiting global and local autocorrelations, and (3) quantify the impact and contribution of climatic factors and human activities on NPP using Pearson correlation analysis and the land use transition matrix. Our results provide important information to better manage ecological resources for successful vegetation restoration in various regions of the LP and can help to facilitate high-quality development in the LP.
The LP is located in the middle of the Yellow River basin (33°41′–41°16′N, 100°52′–114°31′E), with a total area of approximately 6.4 × 10⁵ km2, spanning the provinces of Gansu, Henan, Inner Mongolia, Ningxia, Qinghai, Shanxi, and Shaanxi in China (Figure 1). The overall topography of the LP presents a downward trend of high in the northwest and low in the southeast. It is located in the semi-humid and semi-arid regions of China, with typical temperate continental monsoon climate characteristics. The multi-year average temperature and precipitation are approximately 8°C and 400 mm, respectively. The heavy and concentrated rainstorms in summer, coupled with high evaporation, high sediment content in the water system, and loose loess soil, cause serious soil erosion. According to the national classification standard of China, we used the land use data set of 2000–2020 produced by Zhang et al. (2021), and divide the land use types of LP into grassland, cultivated, forest, and unused lands, construction land, and wetland and water areas. In recent decades, the implementation of restoration projects (such as the Grain for Green project), rapid urbanization, and global warming have significantly altered the vegetation cover and land structure of the LP (Song et al., 2014), impacting the regional ecological environment.
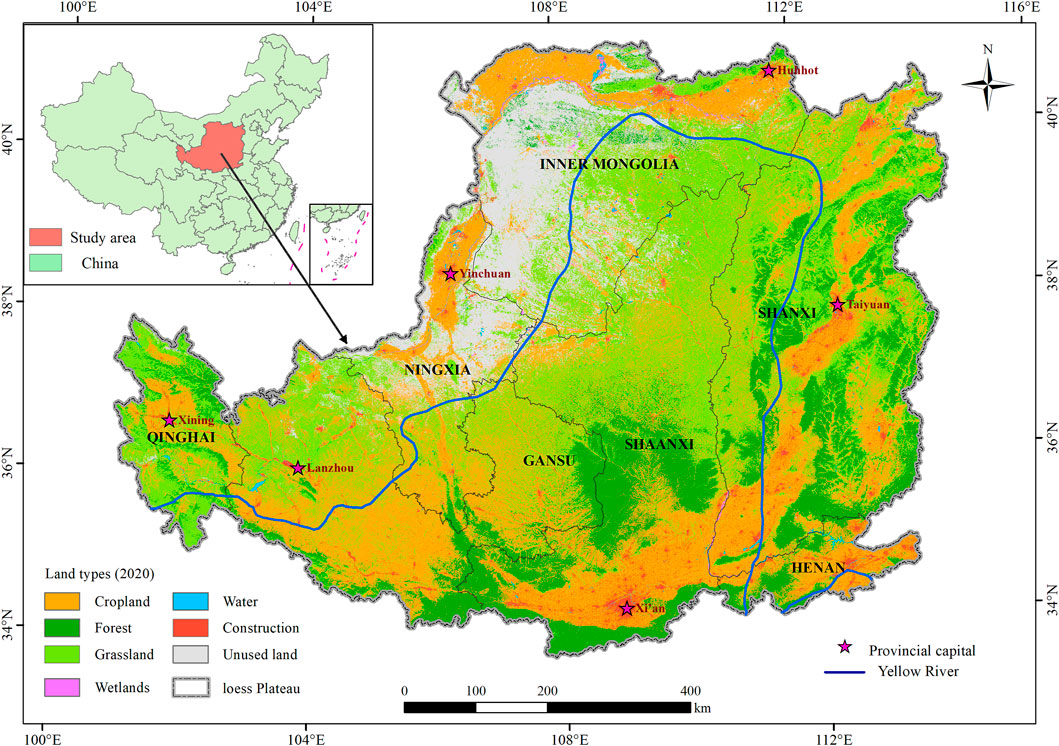
FIGURE 1. Topographic map of the Loess Plateau (LP). Note: the spatial distribution map of land use classification is the vegetation type map of the LP in 2020 with a resolution of 30 m.
The NPP data are based on the MODIS satellite-generated MOD17A3HGF V006 product provided by NASA (https://lpdaac.usgs.gov/products), which provides annual NPP information at the 500-m pixel resolution. Annual NPP was derived from the addition of all 8-day net photosynthesis (PSN) products (MOD17A2H) for a given year, calculated using the BIOME-BGC model to derive the global terrestrial vegetation NPP interannual data. Previous research has verified the reliability of the MOD17A3 NPP data with the measured data used in the analysis of the study area (Liu et al., 2018; Li et al., 2020). We used the MODIS Reprojection Tool (MRT) and ArcGIS 10.8 software to eliminate outliers and invalid values, and uniformly cropped data from the LP area. Due to the elimination of cloud pollution, we used the nearest neighbor method to resample a 1 km dataset in our analysis.
The meteorological data (1 km × 1 km) were originated from the LP Sub Center, National Earth System Science Data Center of China (http://loess.geodata.cn), which generates monthly temperature and precipitation data for China from 2000 to 2020 busing a Delta spatial downscaling scheme. The LP region was generated via mask extraction.
The multi-temporal land use land cover dataset was obtained from the Institute of Aerospace Information Research, Chinese Academy of Sciences (https://doi.org/10.5194), which produces global 30-m land-cover results every 5 years, from 1985 to 2020 on the Google Earth Engine platform using all Landsat satellite data from 1984 to 2020. The overall accuracy of this dataset is >80% (Zhang et al., 2021); hence, we used it in this study. We selected land-cover data from 2000 to 2020 (i.e., 2000, 2005, 2010, 2015, and 2020) for the dynamic study of NPP on LP by tailoring the data. A field investigation combined with the actual land types of the LP enabled us to divide the dataset into the seven categories, with an overall validation accuracy of 96.4% (Table 1). According to the classification standard of Zhang et al.’s data set and the actual land types of the LP, we reclassified the land types into seven types.
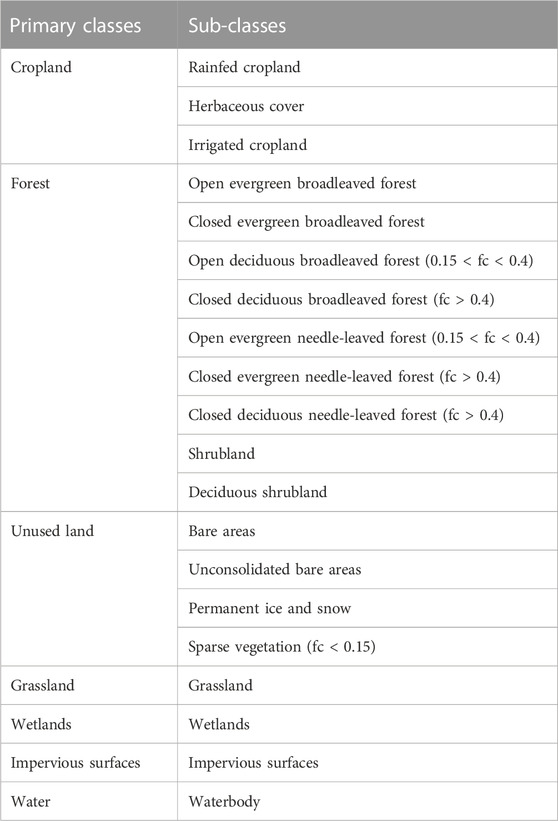
TABLE 1. Classification of the land use land cover (LULC) dataset used in this study.
The fishing net (10 km × 10 km) was created using the processed NPP data, following which the NPP of each matrix unit was assigned using the partitioned table. Finally, the global spatial autocorrelation test was performed in ArcGIS on the NPP data of the LP from 2000 to 2020. If the results showed a significant global correlation, then a local spatial autocorrelation analysis was performed.
The global Moran’s I index and high/low clustering (Getis-Ord General G) characterized whether the NPP of the LP from 2000 to 2020 had clustered or outliers in space (Swetnam et al., 2015; Cheniti et al., 2021). The formula for calculating the global Moran’s I index is as follows:
where
To test the significance of the spatial autocorrelation relationship, the standardized statistic
where
The General G and its expected value
If General G is greater than
To explore whether the high and/or low local spatial observations were concentrated, we used the Hot Spot Analysis (Getis-Ord Gi*) and Anselin Local Moran’s I tools in ArcGIS 10.8 to perform a local spatial autocorrelation analysis. Getis-Ord Gi* identified statistically significant hot and cold spots (Getis and Ord, 2010). Anselin Local Moran’s I identified spatial clusters of features with high or low values, as well as spatial outliers (Anselin, 1995; Liu K. et al., 2022).
The Getis-Ord Gi* is as follows:
where
The standardized statistic for the Anselin Local Moran’s I statistical test is similar to the global Moran’s I index and distinguishes statistically significant clusters of high values (HH), clusters of low values (LL), outliers (HL) where high values are mostly surrounded by low values, and outliers (LH) where low values are mostly surrounded by high values.
Pearson correlation analysis is used to determine the linear correlation between multiple variables and ranges from −1 to 1 (Gbagir et al., 2022). The MATLAB R2021 software generated the codes to analyze the pixel-by-pixel correlations between NPP temperature and NPP rainfall, as well as the regional contribution of temperature and rainfall to NPP. The correlations were combined with spatial autocorrelations to analyze the spatial anomalous changes in vegetation NPP. The correlation coefficient
where,
The annual mean value of vegetation NPP on the LP from 2000 to 2020 followed a fluctuating upward trend (p < 0.05), with a growth rate of 6.88
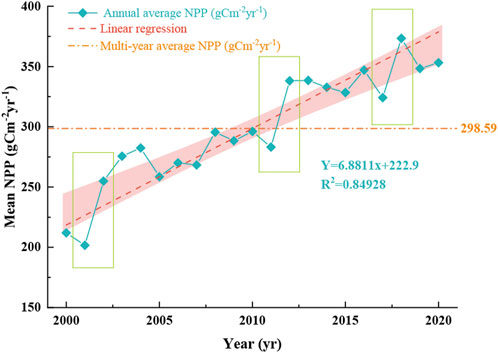
FIGURE 2. Annual trend in the net primary productivity variation on the Loess Plateau from 2000 to 2020.
Three obvious mutation periods were more intense than other years, namely 2001 to 2002, 2011 to 2012, and 2017 to 2018. The average annual NPP of each province in the LP from 2000 to 2020 is listed in Table 2. Henan Province had the highest average annual NPP (391.57
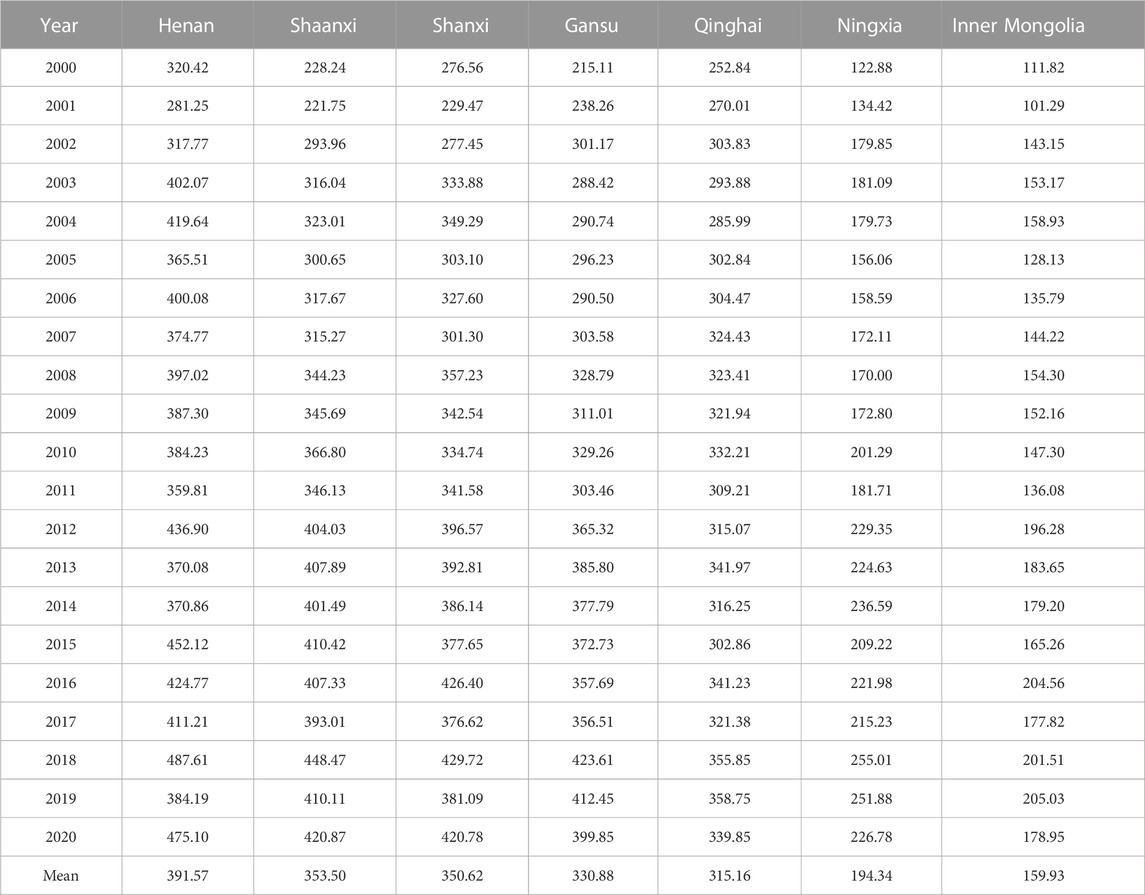
TABLE 2. Annual average net primary productivity of each province in the Loess Plateau from 2000 to 2020 (
The inter-annual NPP of the LP presented a spatial distribution pattern of low in the northwest and high in the southeast. The areas with the highest NPP were situated primarily in the central and southeast LP (Figure 3). Approximately 16%–55% of the total area had an average annual NPP below 200
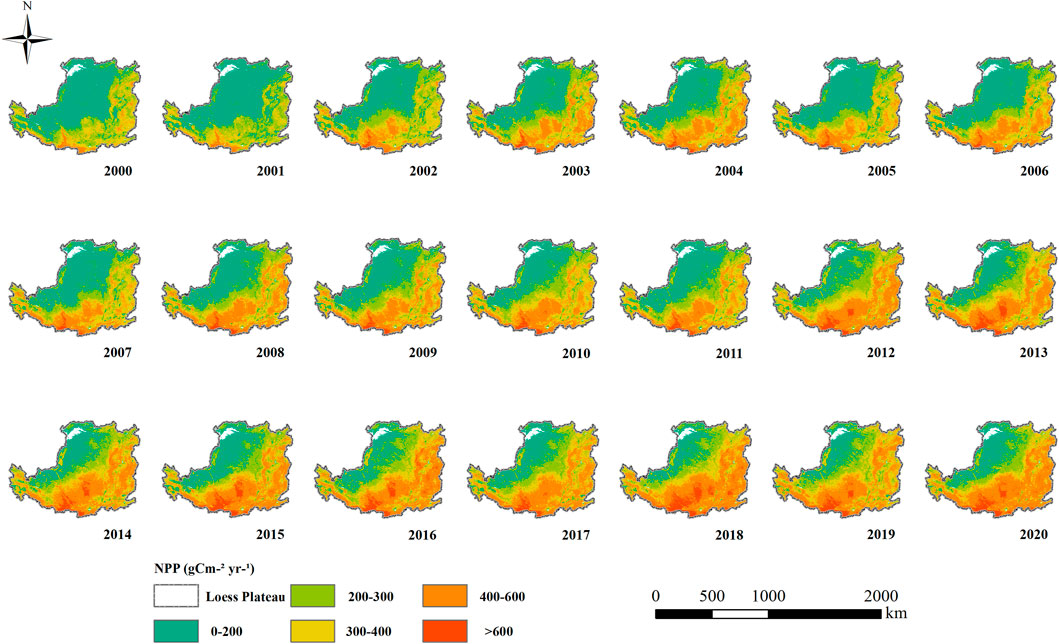
FIGURE 3. Spatial distribution of vegetation net primary productivity on the Loess Plateau from 2000 to 2020.
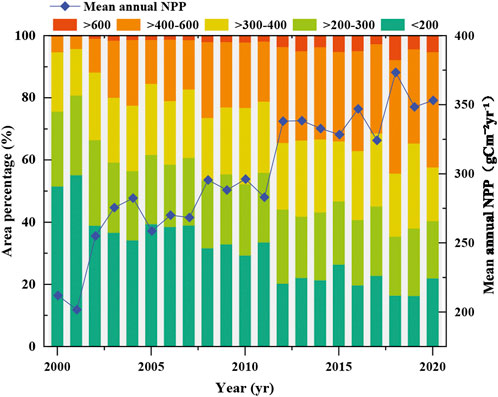
FIGURE 4. Ratio of the average annual area of net primary productivity in the Loess Plateau from 2000 to 2020.
Our results also indicated that before 2002, there were almost no areas with an average NPP above 600
The land cover variations impacted the terrestrial ecosystem structure. The variations in NPP of different vegetation types from 2000 to 2020 are illustrated in Figure 5. The mean NPP values of different vegetation types (from high to low) were: forest (447.87
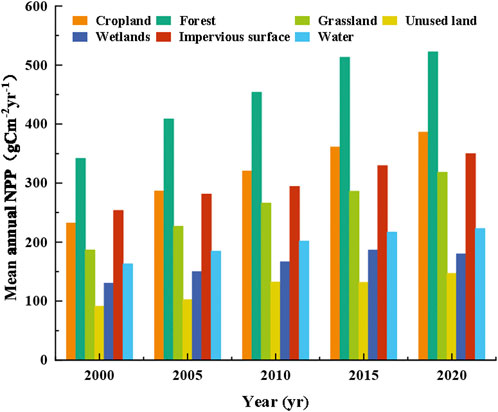
FIGURE 5. Distribution of mean net primary productivity for different land cover types.
Global spatial autocorrelations explore the spatial agglomeration characteristics of carbon sequestration of vegetation NPP on the LP. As listed in Table 3, we calculated the global Moran’s I index, General G, and their z-scores, expectation values, variance, and p-value of NPP from 2000 to 2020. The annual global Moran’s I index varied from 0.95 to 0.97, and the Moran’s I index of the multi-year average NPP was 0.961, extremely close to 1. At the same time, the Z-score of each year was positive and above 106 (Z(I) > 2.58), indicating that the NPP of the LP in 2000–2020 showed a very significant agglomeration effect on the interannual spatial distribution and had a strong positive spatial correlation (p< 0.01). Correspondingly, the annual General G was greater than E(G) (p-value <0.001), and Z(d) was also much higher than 2.58 [P(G) < 0.01], which indicated that the overall spatial distribution pattern of NPP in the study area had high clustering. The global autocorrelation did not reveal the specific clustering pattern at the fine scale; therefore, the local Moran’s I was needed to further identify the spatial clustering pattern of NPP.
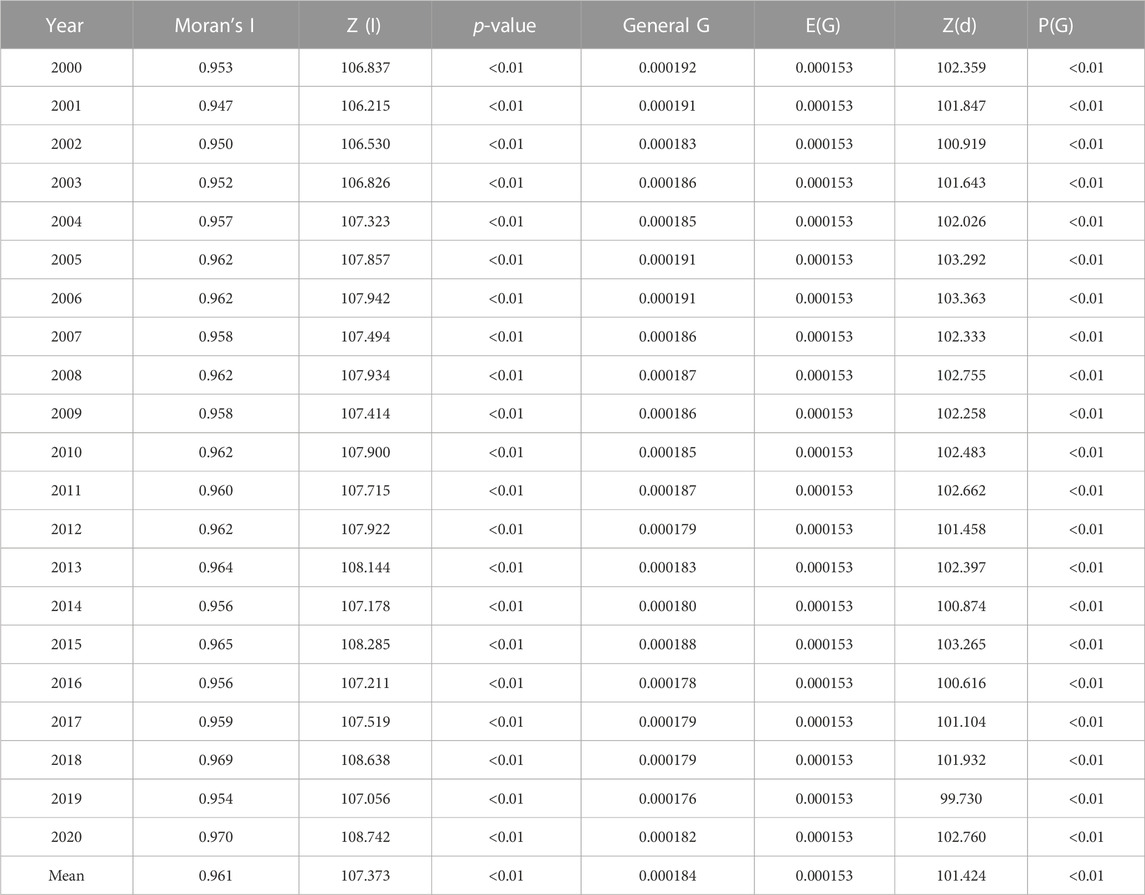
TABLE 3. Global autocorrelation of net primary productivity in the Loess Plateau from 2000 to 2020.
The hot spot analysis tool identified the statistically significant hot and cold areas of NPP in the LP. The hot and cold spot areas were polarized. The cold spots were mainly distributed in the northwest of Ningxia, Inner Mongolia (Ordos and Bayannur), and Gansu (Lanzhou and Baiyin), while the hot spots were distributed in the southern and eastern regions, mainly covering Gansu (Tianshui, Pingliang, Qingyang), central Shaanxi, and Henan (Sanmenxia, Luoyang).
From 2000 to 2020, the overall distribution pattern of the cold spot areas did not vary, but the area containing an NPP with a 99% confidence level gradually expanded and incorporated Ordos City, Inner Mongolia. In addition, the cold spot area of the Yulin City started to gradually disappear in 2009, while the cities of Bayannur and Shizuishan changed from insignificant to cold spot areas. There were also local anomalies in Lanzhou’s NPP in 2007, 2018, and 2019 (Figure 6).
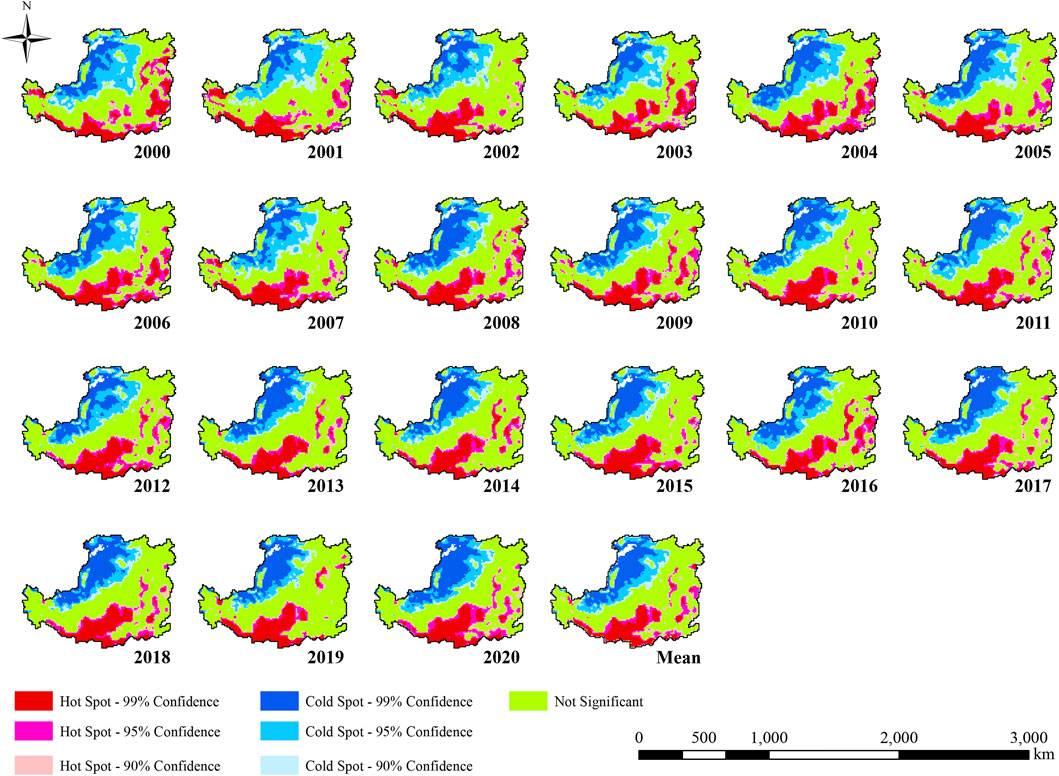
FIGURE 6. Spatiotemporal variation characteristics of net primary productivity cold and hot spots in the Loess Plateau from 2000 to 2020.
The cold spot area (at the 99% confidence level) showed an increasing trend and its proportion increased to 15%. The cold spot area gradually decreased at 95% and 90% confidence levels. However, the insignificant areas remained dominant, accounting for 41%–50%. Conversely, the hot spot areas were stable at the 99%, 95%, and 90% confidence levels, accounting for approximately 11%, 8.5%, and 5.4%, respectively, indicating that the hot spot areas were transferred into different spatial locations. For instance, the NPP in the south of the hot spot area gradually expanded from 2000 to 2020, from Tianshui, Baoji, and Xi’an to Xianyang, Pingliang, and Yan’an. Other hot spots were sporadically distributed in Shanxi and Henan Province, and the high NPP pattern in the eastern region (Changzhi, Jincheng, Jinzhong City) almost disappeared in 2002, 2007, 2010, and 2019. Generally, the hot spots of NPP in the eastern region are likely to continue to shrink.
To further identify the specific clustering patterns of hot and cold areas, clustering and outlier analyses were performed. The NPP had spatial heterogeneity in the spatial distribution and the inter-annual local spatial pattern was dominated by the HH and LL clustering patterns; the clustering model of the multi-year average vegetation NPP was similar to each year (Figure 7). HH was mainly distributed in southeastern Gansu, southern Shaanxi, and central Henan (which encompasses 16%–22% of the area of the LP). The LL was concentrated in the Inner Mongolia Autonomous Region, northern Ningxia, northwestern Gansu, and northeastern Shaanxi (23%–30%). The gray areas were insignificant, accounting for 50%–60%, revealing no spatial autocorrelation patterns (Figure 7).

FIGURE 7. Local clustering and outlier changes in the Loess Plateau from 2000 to 2020.
To further explore the spatial-temporal variations and spatial anomalous clustering changes in vegetation NPP, we analyzed the responses of precipitation and temperature to vegetation NPP.
There was a positive correlation between NPP and precipitation in 94.09% of the LP, with only approximately 5.91% of the region revealing a negative correlation (Figure 8). A total of 58.92% of the regions had a significant positive correlation, mainly in Inner Mongolia, Ningxia and Shaanxi, southern Gansu and western Shanxi, and 35.17% of the regions showed significant irrelevance. Conversely, 5.90% of the regions showed no significant negative correlation, these areas were concentrated in Xi’an, southeastern Baoji in Shaanxi, and Sanmenxia and Luoyang in Henan, there were almost no significant negative correlations.
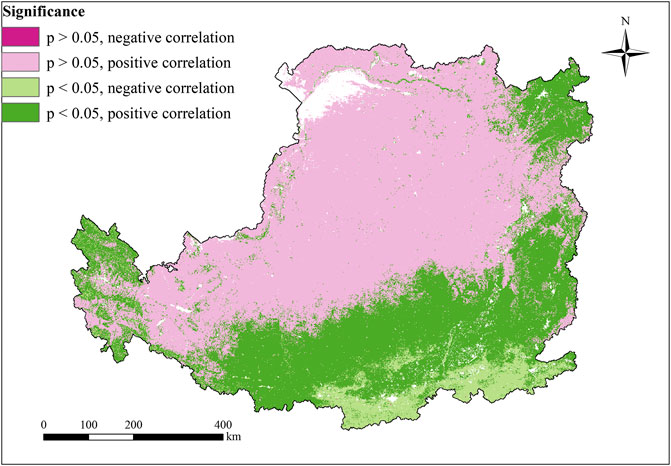
FIGURE 8. Spatial distribution of the Pearson correlation results between net primary productivity and precipitation in the Loess Plateau from 2000 to 2020.
Compared with the variations in response to precipitation, the temperature influences on vegetation NPP in the LP were not obvious over many years. In terms of spatial distribution, 76.99% of the regions showed a positive correlation, while 23.01% showed a negative correlation. There were almost no significant positive or negative correlations in the LP, as demonstrated in Figure 9.
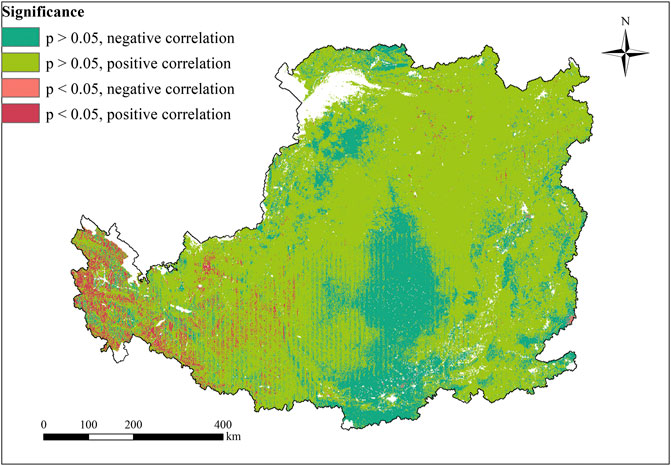
FIGURE 9. Spatial distribution of the Pearson correlation results between net primary productivity and temperature in the Loess Plateau from 2000 to 2020.
In the study area, 73.73% of the regions showed an insignificant positive correlation, mainly in the southeast of Gansu Province, Ningxia, and Shanxi Province. Conversely, 22.86% of the region showed an insignificant negative correlation, in Yan ‘an, Xianyang, and Xi ‘an in the Shaanxi Province (Figure 9). The results indicate the impact of temperature rise on vegetation NPP has not had significant effects.
To further quantitatively explore the contributing factors to the vegetation NPP on the LP, we used correlation analyses. We compared the p-values of the correlation coefficients of precipitation and temperature; the least significant correlation coefficient was extracted as the highest value correlation coefficient (Figure 10). The two climatic factors (temperature and precipitation) on the LP and the highest significant NPP correlation revealed significant correlations in 48.96% of the regions, mainly in the northwest and northeastern Shanxi, with no significance in the southeast LP. A total of 48.96% of the NPP on LP was significantly influenced by temperature and precipitation, mainly in the northwest and northeast of Shanxi, while the influence of climatic factors was insignificant on NPP in the south and east of the LP (Figure 10A). On the LP, 86.31% of the area is heavily dependent on precipitation for vegetation NPP, whereas only 13.70% of the area relies mainly on temperature. Therefore, precipitation is the main climatic factor affecting variations in vegetation NPP on the LP (Figure 10B). Moreover, for provinces and cities, the areas mainly influenced by temperature were the Shaanxi Province (Xianyang, Tongchuan, Baoji, Xi’an), Guyuan City in Ningxia, Pingliang City in Gansu, Xining City in Qinghai, and Sanmenxia City in Henan, while other areas were mainly influenced by precipitation factors.
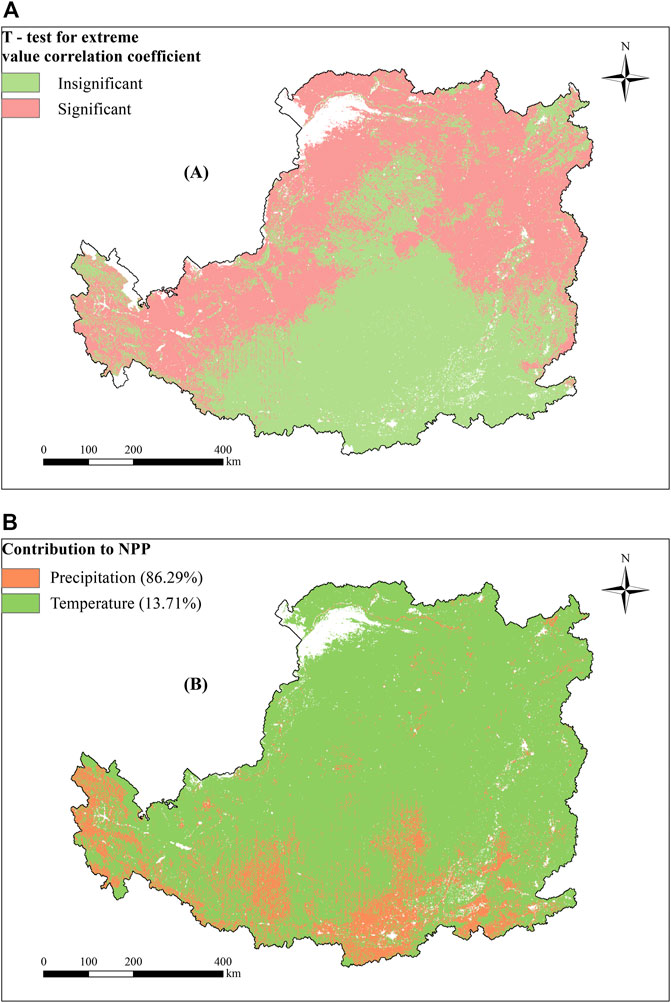
FIGURE 10. Spatial distribution (A) of the most significant correlation coefficients from the t-test results with precipitation and temperature; (B) contributions of precipitation and temperature to the significant net primary productivity results on the Loess Plateau for 2000–2020.
The interannual variation in NPP had “multi-peak” fluctuation increases since the implementation of the Grain for Green project on the LP. These peaks may be attributed to ecological engineering coupled with the effects of climate change and human activities. With global warming over the past 20 years, the climate of the LP has gradually increased in temperature and humidity; temperature and precipitation play an important role in vegetation growth (Sun et al., 2020). Additionally, many ecological construction projects have been implemented, including the natural forest protection project, the comprehensive management of small watersheds, and the Grain for Green Project. From artificial afforestation to natural restoration, the LP has an obvious “greening” trend (Li et al., 2017; Zhao et al., 2018; Deng and ShangGuan, 2021), thereby enhancing the carbon sequestration capacity of the vegetation. Our results are in line with previous findings (Feng et al., 2013; Jiang et al., 2019).
Interestingly, there are three distinct spikes in the NPP (2001–2002, 2011–2012, and 2017–2018). On the regional scale, the sudden increase in NPP from 2001 to 2002 corresponded with the pilot projects in Shaanxi and Gansu in 1999. After 2000, the pilot projects of returning farmland to forests were expanded to include 17 provinces in the central and western regions. The wave of forestry projects has continued, and vegetation growth improved as plants develop. The extreme NPP during 2011–2012 may be due to two factors, the implementation of a new round of Grain for Green Projects and sudden change in extreme temperatures which accelerated vegetation growth and abundance, improving NPP (Liu P. et al., 2022). In 2017, the State Council approved the conversion of Cropland to forests and grasslands in 17 provinces to expand the scale of agriculture and forestry in the region. The State Council also initiated rural revitalization and the mountains-rivers-forests-farmlands-lakes-grasslands program has favorably promoted the grand vision of “green waters and green mountains” (Li and Liu, 2022), which led to a sudden rise in NPP from 2017 to 2018. Moreover, the extreme precipitation levels correlated with NPP, especially the P-min with NPP, indicating that extreme precipitation may have strongly influenced the sudden increase in NPP (Figure 11). Similarly, at the provincial scale, the timing of sudden increases in vegetation NPP in each province also clustered with the three stages of distinct spikes. For example, the NPP in Shaanxi Province increased by 72.21
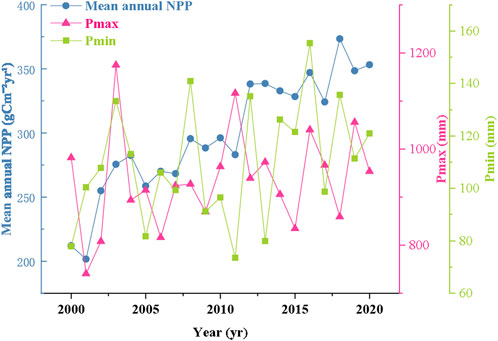
FIGURE 11. Association between vegetation net primary productivity and extreme precipitation levels on the Loess Plateau from 2000 to 2020.
The annual average vegetation NPP on the LP had a significant gradient from southeast to northwest. The area with an NPP above 400
Most previous studies have focused on the linear relationship and driving factors based on the “first-order effect,” ignoring the advantage of spatial autocorrelation which can remove the assumption of sample independence in classical statistics and performs well with potentially dependent samples. Presently, few studies have used the spatial autocorrelation method to analyze spatial variation in NPP (Ren et al., 2020). Therefore, we used the “second-order effect” via spatial grid to explore the spatial correlation and heterogeneity of NPP in the LP. Our results reveal that the NPP of the LP from 2000 to 2020 had a strong spatial positive correlation (p< 0.01), and an agglomeration effect, indicating that the ecosystems between the regions are not independent, yet interrelated with a tendency to gather. To avoid global autocorrelation masking local anomalies or instability, we explored the degree of local spatial aggregation on the LP and observed obvious polarization of cold and hot spots. The local spatial pattern of the LP is dominated by HH and LL clustering patterns, with a prominent hot spot area (p< 0.01), which is similar to previous research (Wang and Gong, 2022). The HH is dominated by forests and cultivated land with vast carbon storage and is located in the warm temperate zone, which allows for an effective carbon sequestration. Focused conversion of farmland to forests involved sloping farmland converted into forest and grassland; the net forest area increased to 4,726 km2 in 2020 (Table 4). Forests promote the accumulation of forest carbon and areas with high forest cover have significantly higher NPP than other habitats. In the past 21 years, Ordos and Bayannur (cities in Inner Mongolia, northern Ningxia) and Baiyin City in the Gansu Province remain a LL district (cold spot), as previously indicated (Ren et al., 2020). The carbon sequestration services of ecosystems in the northwest of the LP remain low, with the fragile ecological environments impacting the success of vegetation restoration in this area.
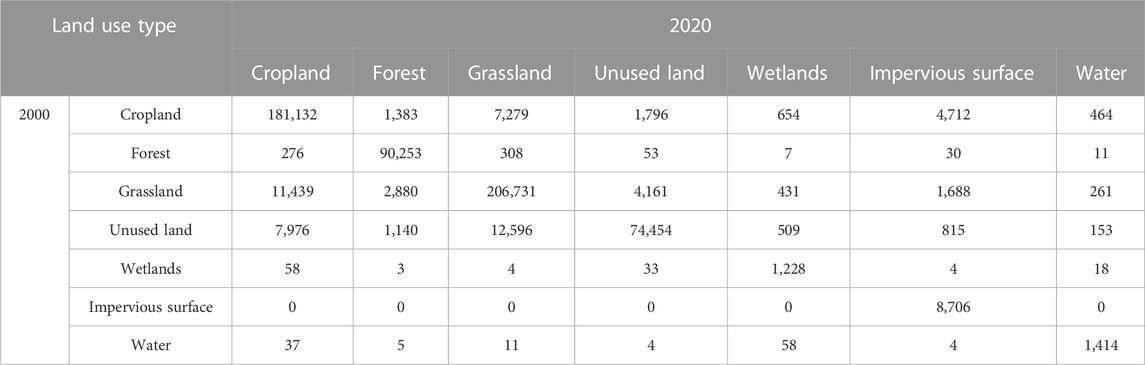
TABLE 4. Land use transfer matrix of the Loess Plateau from 2000 to 2020 (km2).
The transfer matrix revealed the worst land categories (unused land and grassland) in Inner Mongolia, which accounted for 79.58% (Table 4) of this land category. In addition, the location is a temperate desert steppe zone with serious desertification of Mu Us sandy land. The ongoing coal mining in the Ordos City has also adversely impacted local vegetation and caused soil erosion.
Recently, the government has improved the area through ecological restoration, although vegetation rehabilitation remains slow (Wu et al., 2022).
To further explore the heterogeneity in the clustering patterns, we calculated the clustering patterns between counties and combined the annual average NPP of each county with LULC data to explore the abnormal changes between HH and LL and the significance levels of each stage.
The main reason for the disappearance of the LL in Ansai, Wuqi, Yanchang County, and Yan’an City in the Shaanxi Province and Shanxi (Xi and Yonghe County) from 2000 to 2005 was the transformation of sloping farmland into forest and grassland and of unused land into grassland, which increased the vegetation cover. The reason for the disappearance of the HH in Shanxi Province may be attributed to the conversion of grassland to cultivated land and the expansion of cultivated land to impervious surfaces, including the transfer of 76 km2 in Yuanping County (from 2000 to 2005).
The main reason for the disappearance of HH from 2005 to 2010 was the transfer of cropland and grassland to impervious surfaces in some counties in Shanxi Province. For example, 11 km2 of cropland and grassland in Gaoping County was changed to impervious surfaces. The expansion of urban construction has accelerated urbanization, thereby reducing the ability for vegetation to sequester carbon in many arable lands and grasslands. The emergence of LL is mainly the degradation of grassland. For example, the grassland was converted into unused land in Hangjin Banner in Inner Mongolia, creating an additional 90 km2 of unused land from 2005 to 2010. The conversion of unused land to forest and grassland (in 2010–2015) was the main reason for the disappearance of the LL. Other clusters were less affected by land use changes. The disappearance of the LL in 2015–2020 and the expansion of the HH may be related to the transfer of grassland to cropland.
The local spatial anomaly of the NPP in the LP is driven by human-land relationship and natural factors. The effect of temperature on NPP was much smaller than that of precipitation, which is consistent with the results of Xie et al. (2014), however, Xie et al. (2014) did not provide the specific spatial distribution of NPP which is affected by climate indicators. This study revealed a positive correlation between NPP and precipitation in 94.09% on the LP, which indicates that precipitation has a strong synergy with plant photosynthesis and vegetation growth. The increased precipitation in the Qinling Mountains did not correspondingly increase the NPP or reduce vegetation resilience. Northwest China (especially Inner Mongolia, Gansu, and Shaanxi) is in arid and semi-arid areas. The lack of precipitation weakens the net primary production capacity of the vegetation, which might have caused consistent LL in the area. The quantitative results of the extreme value analysis revealed that the contribution of precipitation to NPP reached 86.31%; therefore, precipitation was the dominant climatic factor affecting variations in NPP in the LP. Combined with spatial autocorrelation analysis, the cold spot area was mainly influenced by precipitation, while the temperature had a stronger correlation with the hot spot area. This suggests that precipitation plays a decisive role in vegetation change in arid and semi-arid areas in the northwest of the LP, which is consistent with previous research on the impact of climate change on vegetation NPP in China (Ge et al., 2021). The southeast LP is in a warm temperate zone with abundant precipitation where vegetation growth is strongly affected by light conditions.
Our analysis of precipitation impacts identified a very close synergistic relationship between the interannual variation in NPP mean and minimum precipitation levels on the LP. There is both coordination and a tradeoff between the minimum and maximum precipitation.
The year of the tradeoff between the NPP and maximum precipitation almost coincides with the abnormal year in the local clustering model in the Shanxi and Henan provinces, which indicates that the heterogeneity of this spatial clustering model was affected by P-max (Figure 11). Hence, future studies should focus on the impact of extreme precipitation on vegetation restoration (Fischer et al., 2013).
The spatial autocorrelation model is based on the first law of geography and regularly applied in various industries. However, in ecology (especially in the application of remote sensing data) some mechanistic discussions have not been fully investigated. For example, Geoda and ArcGIS software is superior to previous ecological research which has not clearly defined data distance and the selection and rationality of thresholds, such as NPP. This study focused on a single variable in the spatial autocorrelations to reveal the spatial variation in vegetation NPP on the LP. Future studies should combine multivariate spatial correlation analysis with economic, natural, and other indicators to explore the high and low clustering relationship between the factors and vegetation NPP to advise effective ecological construction.
Global warming remains a major global challenge. As an ecologically fragile area, we focused on temperature and rainfall as the natural factors influencing LP and identified gaps in the land cover data in a specific year. There may be deficiencies in our selection of indicators. Previous research has suggested that altitude and species diversity can also impact vegetation NPP. In the future, we will increase the diversity of valuable indicators in our exploration of the driving forces in vegetation carbon sequestration capacity to achieve the dual-carbon goal in China and the world.
In general, the vegetation NPP in the LP possessed a strong spatial autocorrelation. This spatial heterogeneity and dependence are driven by both natural factors and human activities. The results reveal that extreme NPP are a response to natural factors and violent disturbances by human activities and clarify the driving mechanism underlying vegetation carbon sequestration on the LP, revealing the spatial dependence of vegetation NPP and relationships between regions to support ecological management plans and provide suggestions to formulate double carbon plans. Future studies and relevant government departments should focus on fragile areas for vegetation restoration and, using the results of this study, accurately identify these vulnerable locations. By exploring the driving factors in vegetation restoration in each county, the correlations between the vegetation restoration impacts on the adjacent areas in space can be comprehensively explored. The potential future risks are predicted so that measures can be taken to prevent them. Reasonable regulation of land resources should solve issues of optimal allocation of space resources, which is especially important in the northwest region which has a weak vegetation carbon sequestration capacity, due to the inferior local conditions for ecological construction. Our results support the realization of ecological protection and high-quality development in the LP.
The average annual NPP of the LP showed an increasing trend with varying degrees. There was a sharp increase in the NPP over three periods. The spatial distribution pattern of NPP increased mainly in the middle and southeast of the LP. Furthermore, the average annual NPP of different types of vegetation increased significantly, while the unused land had great potential for carbon sequestration. The NPP of vegetation in the study area has a strong spatial correlation (p< 0.01), and the spatial clustering model is mainly HH and LL. HH accounts for 16%–22% of the LP, whereas LL accounts for 23%–30%.
Climate has a strong influence on vegetation NPP; however, recently the frequent land transformation due to human activities has greatly disturbed the spatial distribution of vegetation ecosystems. Additionally, changes among HH, LL, and insignificant areas are greatly affected by LUCC. The contribution of precipitation to regional NPP is much higher than temperature. Moreover, there is a strong synergistic relationship between the minimum value of precipitation and annual NPP. Future ecological management and decision makers should consider land planning and the important role of water resource allocation on vegetation growth. Finally, addressing problems such as the insufficient vegetation carrying capacity in the LP, and providing feasible schemes for green, low-carbon, and high-quality development of the LP remain to be accomplished.
The original contributions presented in the study are included in the article/Supplementary Material, further inquiries can be directed to the corresponding author.
SM: conceptualization, methodology, formal analysis, investigation, data curation, writing—original draft. ZS: conceptualization, methodology, validation, supervision, writing—review and editing, funding acquisition. All authors contributed to the article and approved the submitted version.
This study was funded by the Major projects of the National Social Science Fund of China (22&ZD083).
We would like to thank Editage (www.editage.cn) for English language editing.
The authors declare that the research was conducted in the absence of any commercial or financial relationships that could be construed as a potential conflict of interest.
All claims expressed in this article are solely those of the authors and do not necessarily represent those of their affiliated organizations, or those of the publisher, the editors and the reviewers. Any product that may be evaluated in this article, or claim that may be made by its manufacturer, is not guaranteed or endorsed by the publisher.
The Supplementary Material for this article can be found online at: https://www.frontiersin.org/articles/10.3389/fenvs.2023.1134917/full#supplementary-material
Anselin, L. (1995). Local indicators of spatial association—lisa. Geogr. Anal. 27, 93–115. doi:10.1111/j.1538-4632.1995.tb00338.x
Chen, L. D., Huang, Z. L., Gong, J., Fu, B. J., and Huang, Y. L. (2007). The effect of land cover/vegetation on soil water dynamic in the hilly area of the loess plateau, China. CATENA 70, 200–208. doi:10.1016/j.catena.2006.08.007
Cheniti, H., Cheniti, M., and Brahamia, K. (2021). Use of GIS and Moran’s I to support residential solid waste recycling in the city of Annaba, Algeria. Environ. Sci. Pollut. Res. 28, 34027–34041. doi:10.1007/s11356-020-10911-z
Cui, L. L., Shi, J., and Xiao, F. J. (2018). Impacts of climatic factors and El Niño/La Niña events on the changes of terrestrial ecosystem NPP in China. Acta Geogr. Sin. 73, 53–66. doi:10.11821/dlxb201801005
Deng, L., and ShangGuan, Z. P. (2021). High quality developmental approach for soil and water conservation and ecological protection on the Loess Plateau. Front. Agr. Sci. Eng. 8, 501–511. doi:10.15302/j-fase-2021425
Fan, C., and Myint, S. (2014). A comparison of spatial autocorrelation indices and landscape metrics in measuring urban landscape fragmentation. Landsc. Urban Plann. 121, 117–128. doi:10.1016/j.landurbplan.2013.10.002
Feng, X. M., Fu, B. J., Lu, N., Zeng, Y., and Wu, B. F. (2013). How ecological restoration alters ecosystem services: An analysis of carbon sequestration in China's Loess Plateau. Sci. Rep. 3, 1–5. doi:10.1038/srep02846
Fischer, E. M., Beyerle, U., and Knutti, R. (2013). Robust spatially aggregated projections of climate extremes. Nat. Clim. Change 3, 1033–1038. doi:10.1038/NCLIMATE2051
Fu, B. J., Liu, Y., Lü, Y. H., He, C. S., Zeng, Y., and Wu, B. F. (2011). Assessing the soil erosion control service of ecosystems change in the Loess Plateau of China. Ecol. Complex. 8, 284–293. doi:10.1016/j.ecocom.2011.07.003
Gbagir, A. M. G., Sikopo, C. S., Matengu, K. K., and Colpaert, A. (2022). Assessing the impact of wildlife on vegetation cover change, northeast Namibia, based on MODIS satellite imagery (2002-2021). Sensors 22.4006 doi:10.3390/s22114006
Ge, W. Y., Deng, L. Q., Wang, F., and Han, J. Q. (2021). Quantifying the contributions of human activities and climate change to vegetation net primary productivity dynamics in China from 2001 to 2016. Sci. Total Environ. 773, 145648. doi:10.1016/j.scitotenv.2021.145648
Getis, A., and Ord, J. K. (2010). The analysis of spatial association by use of distance statistics, Perspectives on spatial data analysis. Berlin, Germany Springer. pp 127-145.
Goldewijk, K. K., and Leemans, R. (1995). Systems models of terrestrial carbon cycling. Berlin, Germany: Springer Berlin Heidelberg. pp 129-151.
Guo, D., Song, X. N., Hu, R. H., Cai, S. H., Zhu, X. M., and Hao, Y. B. (2021). Grassland type-dependent spatiotemporal characteristics of productivity in Inner Mongolia and its response to climate factors. Sci. Total Environ. 775, 145644. doi:10.1016/j.scitotenv.2021.145644
He, X. B., Zhou, J., Zhang, X. B., and Tang, K. L. (2006). Soil erosion response to climatic change and human activity during the Quaternary on the Loess Plateau. China. Reg. Environ. Change. 6, 62–70. doi:10.1007/s10113-005-0004-7
Huang, Y., Wang, Y. J., Li, X. S., Hu, Z. L., and Liu, G. P. (2013). Graphic analysis of spatio-temporal effect for vegetation disturbance caused by coal mining: A case of datong coal mine area. Acta Ecol. Sin. 33, 7035–7043. doi:10.5846/stxb201207080952
Jiang, H. C., and Ding, Z. L. (2005). Temporal and spatial changes of vegetation cover on the Chinese Loess Plateau through the last glacial cycle: Evidence from spore-pollen records. Rev. Palaeobot. Palyno 133, 23–37. doi:10.1016/j.revpalbo.2004.08.003
Jiang, X. D., Shen, W., and Bai, X. Y. (2019). Response of net primary productivity to vegetation restoration in Chinese Loess Plateau during 1986-2015. PLoS ONE 14.e0219270 doi:10.1371/journal.pone.0219270
Kolby Smith, W., Reed, S. C., Cleveland, C. C., Ballantyne, A. P., Anderegg, W. R. L., Wieder, W. R., et al. (2016). Large divergence of satellite and Earth system model estimates of global terrestrial CO2 fertilization. Nat. Clim. Change 6, 306–310. doi:10.1038/NCLIMATE2879
Lei, T., Feng, J., Lv, J., Wang, J., Song, H., Song, W., et al. (2020). Net Primary Productivity Loss under different drought levels in different grassland ecosystems. J. Environ. Manage. 274, 111144. doi:10.1016/j.jenvman.2020.111144
Li, C. H., Wang, Y. T., Wu, X. D., Cao, H. J., Li, W. P., and Wu, T. H. (2021). Reducing human activity promotes environmental restoration in arid and semi-arid regions: A case study in northwest China. Sci. Total Environ. 768, 144525. doi:10.1016/j.scitotenv.2020.144525
Li, H. W., Ding, J. H., Zhang, J., Yang, Z. N., Yang, B., Zhu, Q., et al. (2020). Effects of land cover changes on net primary productivity in the terrestrial ecosystems of China from 2001 to 2012. Land-Basel 9. doi:10.3390/land9120480
Li, J. J., Peng, S. Z., and Li, Z. (2017). Detecting and attributing vegetation changes on China’s Loess Plateau. Agric. For. Meteorol. 247, 260–270. doi:10.1016/j.agrformet.2017.08.005
Li, S. D., and Liu, M. C. (2022). The development process, current situation and prospects of the conversion of farmland to forests and grasses project in China. J. Resour. Ecol. 13, 120–128. doi:10.5814/j.issn.1674-764x.2022.01.014
Liu, H. X., Zhang, A. B., Jiang, T., Zhao, A. Z., Zhao, Y. L., and Wang, D. L. (2018). Response of vegetation productivity to climate change and human activities in the shaanxi-gansu-ningxia region, China. J. Indian Soc. Remote 46, 1081–1092. doi:10.1007/s12524-018-0769-z
Liu, K., Liu, W. R., Wu, J. L., Chen, Z. F., Zhang, W., and Liu, F. (2022a). Spatial differences and influencing factors of urban water utilization efficiency in China. Front. Environ. Sci. 10, 593. doi:10.3389/fenvs.2022.890187
Liu, P., Zhao, X. N., Gao, X. D., Yu, L. Y., and Ren, M. (2022b). Characteristics of extreme temperature variation in the Loess Plateau and its correlation with average temperature. Chin. J. Appl. Ecol. 33, 1975–1982. doi:10.13287/j.1001-9332.202207.024
Liu, T. S., Guo, Z. T., Wu, N. Q., and Lu, H. Y. (1996). Prehistoric vegetation on the Loess Plateau: Steppe or forest? J. S. Asian Earth 13, 341–346. doi:10.1016/0743-9547(96)00041-4
Lü, Y. H., Fu, B. J., Feng, X. M., Zeng, Y., Liu, Y., Chang, R. Y., et al. (2012). A policy-driven large scale ecological restoration: Quantifying ecosystem services changes in the Loess Plateau of China. PLoS ONE 7, e31782. doi:10.1371/journal.pone.0031782
Ma, R. X., Wang, D. C., Cui, X. M., Yao, X. J., Li, S. S., Wang, H. S., et al. (2022). Distribution and driving force of water use efficiency under vegetation restoration on the Loess Plateau. Remote Sens-Basel 14. doi:10.3390/rs14184513
Pan, J. H., and Dong, L. L. (2018). Spatio-temporal variation in vegetation net primary productivity and its relationship with climatic factors in the Shule River basin from 2001 to 2010. Hum. Ecol. Risk. Assess. 24, 797–818. doi:10.1080/10807039.2017.1400373
Pei, Y. Y., Huang, J. L., Wang, L. H., Chi, H., and Zhao, Y. j. (2018). An improved phenology-based CASA model for estimating net primary production of forest in central China based on Landsat images. Int. J. Remote Sens. 39, 7664–7692. doi:10.1080/01431161.2018.1478464
Peng, J., Shen, H., Wu, W. H., Liu, Y. X., and Wang, Y. L. (2016). Net primary productivity (NPP) dynamics and associated urbanization driving forces in metropolitan areas: A case study in beijing city, China. Landsc. Ecol. 31, 1077–1092. doi:10.1007/s10980-015-0319-9
Ren, H. R., Shang, Y. J., and Zhang, S. (2020). Measuring the spatiotemporal variations of vegetation net primary productivity in Inner Mongolia using spatial autocorrelation. Ecol. Indic. 112, 106108. doi:10.1016/j.ecolind.2020.106108
Shangguan, Z. P., and Zheng, S. X. (2006). Ecological properties of soil water and effects on forest vegetation in the Loess Plateau. Int. J. Sustain. Dev. World Ecol. 13, 307–314. doi:10.1080/13504500609469682
Song, X. Z., Peng, C. H., Zhou, G. M., Jiang, H., and Wang, W. F. (2014). Chinese grain for green program led to highly increased soil organic carbon levels: A meta-analysis. Sci. Rep. 4, 1–7. doi:10.1038/srep04460
Sun, R., Chen, S. H., and Su, H. B. (2020). Spatiotemporal variation of NDVI in different ecotypes on the Loess Plateau and its response to climate change. Geogr. Res. 39, 1200–1214. doi:10.11821/dlyj020190399
Swetnam, T. L., Lynch, A. M., Falk, D. A., Yool, S. R., and Guertin, D. P. (2015). Discriminating disturbance from natural variation with LiDAR in semi-arid forests in the southwestern USA. Ecosphere 6. 1-22. doi:10.1890/Es14-00384.1
Wang, T. F., and Gong, Z. W. (2022). Evaluation and analysis of water conservation function of ecosystem in Shaanxi Province in China based on “Grain for Green” Projects. Environ. Sci. Pollut. Res. 29, 1–19. doi:10.1007/s11356-022-21730-9
Wang, Y. W., Yue, H. B., Peng, Q., He, C., Hong, S., and Bryan, B. A. (2020). Recent responses of grassland net primary productivity to climatic and anthropogenic factors in Kyrgyzstan. Land Degrad. Dev. 31, 2490–2506. doi:10.1002/ldr.3623
Wei, X. D., Yang, J., Luo, P. P., Lin, L. G., Lin, K. L., and Guan, J. M. (2022). Assessment of the variation and influencing factors of vegetation NPP and carbon sink capacity under different natural conditions. Ecol. Indic. 138, 108834. doi:10.1016/j.ecolind.2022.108834
Wu, D. H., Piao, S. L., Zhu, D., Wang, X. H., Ciais, P., Bastos, A., et al. (2020). Accelerated terrestrial ecosystem carbon turnover and its drivers. Glob. Change Biol. 26, 5052–5062. doi:10.1111/gcb.15224
Wu, Q. Y., Yao, X. J., Liang, J., Zhang, S. L., Yang, Y. J., and Hou, H. P. (2022). Spatial and temporal intensity of vegetation cover improvement and degradation in coal mining areas of Erdos city. J. Arid Land Resour. Environ. 36, 101–109. doi:10.13448/j.cnki.jalre.2022.205
Wu, S. H., Zhou, S. L., Chen, D. X., Wei, Z. Q., Dai, L., and Li, X. G. (2014). Determining the contributions of urbanisation and climate change to NPP variations over the last decade in the Yangtze River Delta, China. Sci. Total Environ. 472, 397–406. doi:10.1016/j.scitotenv.2013.10.128
Xiao, F. J., Liu, Q. F., and Xu, Y. Q. (2022). Estimation of terrestrial net primary productivity in the Yellow River Basin of China using light use efficiency model. Sustainability 14. 7399 doi:10.3390/su14127399
Xie, B. N., Qin, Z. F., Wang, Y., and Chang, Q. R. (2014). Spatial and temporal variation in terrestrial net primary productivity on Chinese Loess Plateau and its influential factors. Trans. Chin. Soc. Agric. Eng. 30, 244–253. doi:10.3969/j.issn.1002-6819.2014.11.030
Yang, A. L., zhang, X. P., Li, Z. S., li, Y. C., and Nan, F. S. (2023). Quantitative analysis of the impacts of climate change and human activities on vegetation NPP in the Qilian Mountain National Park. Acta Ecol. Sin. 43, 1–9. doi:10.5846/stxb202202050295
Yuan, Z., Wang, Y. Q., Xu, J. J., and Wu, Z. G. (2021). Effects of climatic factors on the net primary productivity in the source region of Yangtze River, China. Sci. Rep. 11. 1-11. doi:10.1038/s41598-020-80494-9
Zhang, B. Q., He, C. S., Burnham, M., and Zhang, L. H. (2016). Evaluating the coupling effects of climate aridity and vegetation restoration on soil erosion over the Loess Plateau in China. Sci. Total Environ. 539, 436–449. doi:10.1016/j.scitotenv.2015.08.132
Zhang, M., Yuan, N. Q., Lin, H., Liu, Y., and Zhang, H. Q. (2022). Quantitative estimation of the factors impacting spatiotemporal variation in NPP in the Dongting Lake wetlands using Landsat time series data for the last two decades. Ecol. Indic. 135, 108544. doi:10.1016/j.ecolind.2022.109478
Zhang, S. L., Yang, D. W., Yang, Y., Piao, S. L., Yang, H. B., Lei, H. M., et al. (2018). Excessive afforestation and soil drying on China's Loess Plateau. J. Geophys. Res. Biogeosci. 123, 923–935. doi:10.1002/2017JG004038
Zhang, T., Peng, J., Liang, W., Yang, Y. T., and Liu, Y. X. (2016). Spatial–temporal patterns of water use efficiency and climate controls in China's Loess Plateau during 2000–2010. Sci. Total Environ. 565, 105–122. doi:10.1016/j.scitotenv.2016.04.126
Zhang, X., Liu, L. Y., Chen, X. D., Gao, Y., Xie, S., and Mi, J. (2021). GLC_FCS30: Global land-cover product with fine classification system at 30 m using time-series Landsat imagery. Earth Syst. Sci. Data 13, 2753–2776. doi:10.5194/essd-13-2753-2021
Zhao, G. J., Mu, X. M., Wen, Z. M., Wang, F., and Gao, P. (2013). Soil erosion, conservation, and eco-environment changes in the Loess Plateau of China. Land Degrad. Dev. 24, 499–510. doi:10.1002/ldr.2246
Zhao, H. F., He, H. M., Wang, J. J., Bai, C. Y., and Zhang, C. J. (2018). Vegetation restoration and its environmental effects on the Loess Plateau. Sustainability 10, 4676. doi:10.3390/su10124676
Keywords: net primary productivity, spatial autocorrelation, climate change, human activities, land use land cover, Loess Plateau
Citation: Mao S and Shangguan Z (2023) Evolution of spatiotemporal patterns in vegetation net primary productivity and the driving forces on the Loess Plateau. Front. Environ. Sci. 11:1134917. doi: 10.3389/fenvs.2023.1134917
Received: 31 December 2022; Accepted: 19 May 2023;
Published: 30 May 2023.
Edited by:
Li Wen, NSW Department of Planning, Industry and Environment, AustraliaReviewed by:
Lunche Wang, China University of Geosciences Wuhan, ChinaCopyright © 2023 Mao and Shangguan. This is an open-access article distributed under the terms of the Creative Commons Attribution License (CC BY). The use, distribution or reproduction in other forums is permitted, provided the original author(s) and the copyright owner(s) are credited and that the original publication in this journal is cited, in accordance with accepted academic practice. No use, distribution or reproduction is permitted which does not comply with these terms.
*Correspondence: Zhouping Shangguan, c2hhbmdndWFuQG1zLmlzd2MuYWMuY24=
Disclaimer: All claims expressed in this article are solely those of the authors and do not necessarily represent those of their affiliated organizations, or those of the publisher, the editors and the reviewers. Any product that may be evaluated in this article or claim that may be made by its manufacturer is not guaranteed or endorsed by the publisher.
Research integrity at Frontiers
Learn more about the work of our research integrity team to safeguard the quality of each article we publish.