 Zongjia Zhang
 Xinyao Jian
 Yiye Chen2
 Junguo Liu
94% of researchers rate our articles as excellent or good
Learn more about the work of our research integrity team to safeguard the quality of each article we publish.
Find out more
ORIGINAL RESEARCH article
Front. Environ. Sci., 13 April 2023
Sec. Water and Wastewater Management
Volume 11 - 2023 | https://doi.org/10.3389/fenvs.2023.1131954
This article is part of the Research TopicNature-Based Solutions for Urban Water ManagementView all 11 articles
In recent years, the frequency of extreme weather has increased, and urban waterlogging caused by sudden rainfall has occurred from time to time. With the development of urbanization, a large amount of land has been developed and the proportion of impervious area has increased, intensifying the risk of urban waterlogging. How to use the available meteorological data for accurate prediction and early warning of waterlogging hazards has become a key issue in the field of disaster prevention and risk assessment. In this paper, based on historical meteorological data, we combine domain knowledge and model parameters to experimentally extract rainfall time series related features for future waterlogging depth prediction. A novel waterlogging depth prediction model that applies only rainfall data as input is proposed by machine learning algorithms. By analyzing a large amount of historical flooding monitoring data, a “rainfall-waterlogging amplification factor” based on the geographical features of monitoring stations is constructed to quantify the mapping relationship between rainfall and waterlogging depths at different locations. After the model is trained and corrected by the measured data, the prediction error for short-time rainfall basically reaches within 2 cm. This method improves prediction performance by a factor of 2.5–3 over featureless time series methods. It effectively overcomes the limitations of small coverage of monitoring stations and insufficient historical waterlogging data, and can achieve more accurate short-term waterlogging prediction. At the same time, it can provide reference suggestions for the government to conduct waterlogging risk analysis and add new sensor stations by counting the amplification factor of other locations.
Influenced by global climate change, the frequency and scale of extreme weather events have been on the rise in recent years, and urban flooding disasters caused by extreme weather events such as typhoons and short-lived heavy rainstorms have been increasing (Ferreira et al., 2015; Zhang et al., 2017). The intensity of extreme precipitation in most regions of the world shows a trend towards intensification and a concentration of rainfall events (Yin et al., 2022). Yin used simulations from a large climate–hydrology model ensemble of 111 members, their results provide crucial insights towards assessing and mitigating adverse effects of compound hazards on ecosystems and human wellbeing (Yin et al., 2023). Urbanization increases hardened area, reduces infiltration, increases runoff and triggers higher and faster peak water flow (Nayeb Yazdi et al., 2019; Sofia et al., 2019). It has reduced groundwater recharge from natural infiltration and has contributed to the high runoff (Nath et al., 2021). A large number of low-lying areas prone to flooding are incorporated into urban development plans, and the lack of drainage capacity further exacerbates the risk of flooding (Du et al., 2012). With increasing impervious cover in urban areas driving dramatic changes in rainfall infiltration and storage capacity, which lead that urban flood appear sudden and frequent (Mu et al., 2020).
Waterlogging events on a global scale may have a serious and direct impact on the economy and humanitarianism, as well as continue to adversely affect economic development (Arshad et al., 2019). Globally, the occurrence of urban floods has been unprecedented resulting in huge economic and social losses (Sundaram et al., 2021). In July 2021, the rainstorm in Zhengzhou, China caused 380 deaths and a direct economic loss of 120.06 billion yuan. Urban flood disaster has become a crucial problem restricting the healthy development of China’s economy and society (Duan et al., 2022; Li et al., 2022). Urban floods can cause huge economic losses and casualties, and countries all over the world attach great importance to urban flood warning and mitigation. Therefore, obtaining timely and highly accurate waterlogging depth information with wide coverage is urgently needed for emergency response and risk mitigation, especially using an affordable, accurate, and widespread approach (Deo and Wen, 2016). Nowadays, more and more researchers have started to pay attention to urban waterlogging (Yin et al., 2015). Among them, accurate prediction of inland flooding is a hot research problem in the field. For accurate prediction and warning of the extent and depth of internal flooding, there are mainly numerical simulation methods, hydrological methods, and data-driven methods.
Numerical simulation method. Based on the principles of hydrodynamics, the model uses the underlying surface and elevation factors comprehensively in waterlogging process; it performs the whole process of city waterlogging formation in detail. Its simulation results are waterlogging distribution and waterlogging depth maps of a certain time step (Xue et al., 2016). Numerical simulation methods allow easy estimation of waterlogging under each recurrence period rainfall. It is interesting to note that under different urbanization and rainfall scenarios, the urban waterlogging susceptibility has a considerable variation (Explicit the urban waterlogging spatial variation and its driving factors: The stepwise cluster analysis model and hierarchical partitioning analysis approach). The hydrological and hydrodynamic model couples the distributed hydrological model and two-dimensional hydrodynamic model, which not only ensures the accuracy of the model but also has good calculation efficiency. It is a promising research direction for the flood model (Liu et al., 2022a). On the other hand, it also shortens waterlogging simulation time, and finally improves the applicability of waterlogging simulation (Zounemat-Kermani et al., 2020). But the disadvantage is that small number of data mining model parameters, such as the obscure physical implications of model parameters and the insufficient amount of simulation training, the simulation is prone to the problem of different arguments (Tang et al., 2021). Furthermore, the computational efficiency of numerical models is too low to meet the requirements of urban emergency management. Thus, many coupled methods of numerical simulation and other methods such as machine learning have emerged. A new method was established by combining a long short-term memory neural network model with a numerical model, which can quickly predict the waterlogging depth. The principle is to train the long and short-term memory neural network to predict and simulate the internal flooding process by using the numerical simulation results as training samples (Liu et al., 2022a). However, the disadvantage of this method is that the accuracy of LSTM results is extremely dependent on the results of previous numerical simulation. If the error of numerical simulation results is large, the results are difficult to guarantee.
In recent years, with the application of water sensor, many cities have established urban waterlogging monitoring and early warning system. But water level sensors are expensive and cannot be deployed all over the city (Loftis et al., 2018). Moreover, the simple monitoring data can only reflect the real-time depth of water accumulation, which does not have robust forecasting function (Liu et al., 2022b). As more and more water level sensors acquire large amounts of historical waterlogging data, some studies are beginning to train models based on historical real waterlogging data, or to use coupled models to improve the performance of prediction methods. The most representative of these is the data-driven method based on time series. Ding et al. proposed an explicable spatiotemporal attention long—short memory model (STA-LSTM) based on LSTM and attention mechanism, and established the model using dynamic attention mechanism and LSTM method to make explicable analysis of flood prediction (Ding et al., 2020). Yan et al. proposed a prediction model of the maximum water depth in time and space employing a neural network-numerical simulation model on the basis of coupling a two-dimensional hydrological and hydrodynamic model and a statistical analysis model. But due to data limitations, the actual rainfall and waterlogging data were not added to the database for training. Therefore, although the performance of the prediction model is satisfactory, its accuracy can be improved further after collecting enough data (Yan et al., 2021). Wu et al. established a real-time prediction model of flood depth based on waterlogging point by using GBDT algorithm based on multi-factor analysis and verified the validity and applicability of the model for real-time prediction of waterlogging process. However, the model that Wu used only be predicted when rainfall occurs, and cannot predict the flood depth after rainfall (Wu et al., 2020a).
However, some recent studies have shown that the prediction performance of a single method or model is always limited. Accounting for model structure, parameter and input forcing uncertainty in flood inundation modeling using Bayesian model averaging. The combination of multiple models can effectively improve the prediction performance. Multi-model combination methods to deal with model uncertainty and improve model performance (Yan and Hamid, 2016). Zhou et al. proposed an extreme flood information estimation method considering the uncertainty of distribution and model structure using the BMA method. They construct a comprehensive prediction model by BMA and three machine learning methods (support vector machines (SVM), Back Propagation Neural Network (BPNN) and Adaptive Boosting (AdaBoost)) use rainfall forecast data to drive BMA model for fine early warning of urban flood. The analysis of early warning in two different urban flood events indicates that BMA is more suitable for the prediction of severe waterlogging and illustrates the great potential and prospects of BMA in urban flood early warning (Zhou et al., 2022). Naive Bayes (NB) and Random Forest (RF) algorithm were used to forecast the waterlogging point and the waterlogging process at the waterlogging point respectively to achieve the goal of predicting the whole process of urban waterlogging (Wang et al., 2021). Historical flooding events and the value of flood contributing factors are used as inputs for the model. These input data are converted to raster layers with help of GIS tools. Our dependent variable would be a one-hot encoded vector stating whether or not it was flooded with those conditions (Khatri et al., 2022). The stochastic forest (RF), Logistic model tree (LMT) and other bivariate models combined with data mining tools can be used to simulate flood susceptibility. The study found that the LMT has good predictive power, so the model can be used for future flood mitigation in specific areas (Shahabi et al., 2020). Data warehouse and deep learning algorithm were used to assess urban flood risk. The GBDT model shows 88.48% accuracy in the depth of water accumulation prediction (Wu et al., 2020b). An application of data-driven models using artificial neural network was presented, support vector regression and long-short term memory approaches and distributed forcing data for runoff predictions. The results showed that the long-short term memory and support vector regression models outperforms artificial neural network model for hourly runoff forecasting, and the predictive performance of the models was greater during the wet seasons compared to the dry seasons (Han and Morrison, 2021). Puttinaovarat and Horkaew proposed a novel flood forecasting system based on fusing meteorological, hydrological, geospatial, and crowdsource big data in an adaptive machine learning framework (Puttinaovarat and Horkaew, 2020).
Existing studies have not sufficiently analyzed rainfall time series. Combined with waterlogging sensor data, more accurate predictions of waterlogging depths can be obtained with an accuracy of centimeters or even millimeters. The input condition used in this paper is rainfall data, which is free from the limitation of waterlogging sensors. The transfer of the model prediction capability can be achieved at locations where the features are similar to the sensor points.
This study follows this framework (Figure 1) by selecting features for training from the original rainfall time series using domain knowledge, VIF verification and parameter correction. After sliding window slicing and processing the data, the input-output matrix is constructed and the waterlogging prediction is performed by using machine learning regressors. Geographic features around the station are extracted from the geographic information, their influence on the amplification factor is analyzed, and this is used to regional waterlogging risk analysis.
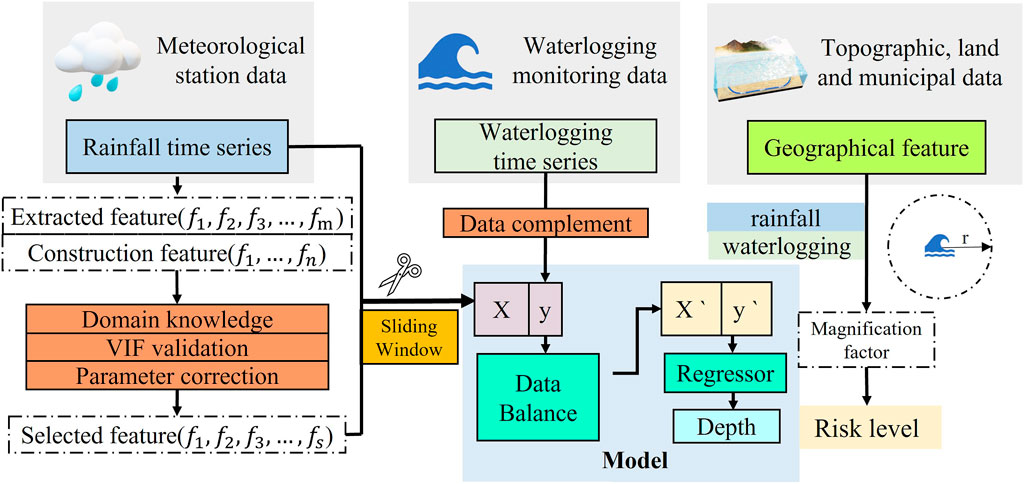
FIGURE 1. The framework of the method.
In this paper, the historical rainfall dataset and the waterlogging depth dataset are used to predict the future waterlogging depth. The amplification factor is established by characterization of geographic feature data. Data processing is divided into five main steps: 1) Data cleaning. Considering the possible sensor failure or low sensor sensitivity, the initial screening of valid stations is done according to the number of valid data in the cumulative flooding dataset. 2) Construction of uniform structured data. Uniform start and end time nodes, the different total working hours of different sensors lead to inconsistent start and end dates of collected data, here by truncating and artificially adding 0 nodes, so that the data sets of different stations can keep the same length. 3) Resampling. Considering the different working mechanisms of different sensors, their sampling intervals are not consistent, here the resampling function of Python is used to unify the sampling interval for subsequent model training. 4) Data interpolation. Use data interpolation to fill in the missing values in the data after resampling to make the time series continuous and in line with reality. 5) Sliding window slicing and data integration. According to the structural requirements of the training model and the prediction strategy, the time series are segmented by sliding windows, reconstructed with the extracted time series features, and the data are integrated into the model.
In order to extract more valuable information for the model from the time series, this paper uses statistical methods and domain knowledge to extract and construct new feature vectors to improve the model prediction performance.
The rainfall data in this paper are sliding rainfall, which can reflect the total amount of rainfall in the previous period but lack direct description of the rainfall in the current period, which will lose the rainfall intensity information. The current rainfall intensity will largely affect the subsequent waterlogging. Therefore, an iterative algorithm is used here to calculate the unit rainfall (UR) from the sliding rainfall Eq. 1.
where
In addition to the amount of rainfall, the ability of the ground surface to form waterlogging is mainly influenced by the runoff coefficient. The runoff coefficient is mainly related to the type of land cover, slope, soil aridity and infiltration capacity. The process of runoff generation is also influenced by multiple factors such as latitude, climate zone, monsoon, and season (Tarasova et al., 2018). Differences in air humidity, air pressure, and temperature brought about by seasonal changes will directly affect the water content in the air and soil. During the dry season, the water content in the soil is low, rainfall is easily absorbed by the soil, and the intensity of rainfall is relatively low during the dry season, resulting in less occurrence of waterlogging (Burak et al., 2020). During the rainy season, the water content in the soil is high and even nearly saturated in some areas (e.g., seasonal wetlands). Rainfall is not easily absorbed by the soil, and the rainfall intensity is relatively high and transient during the rainy season, leading to relatively easy waterlogging (Zavala et al., 2008). Therefore, the seasonality coefficient S is defined and the dry months (MD), rainy months (MR) and transition months (MT) are determined based on the multi-year monthly average rainfall statistics (Table 1).
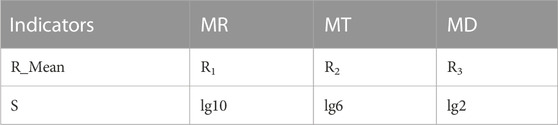
TABLE 1. Seasonal factor of the month to which the event belongs.
The period between rainfall events affects the infiltration capacity and runoff coefficient. When two rainfall events are separated by a long interval, the water content in the soil or surface is already at a low level due to sufficient infiltration and evaporation. In contrast, when the water content between two rainfall events is high, surface runoff is more likely to form and thus converge to produce waterlogging when the rainfall occurs again (Ran et al., 2012). In this paper, we define the rainfall interval
where
The rainfall time series itself contains many features in its statistics. The mean value
The statistical features extracted from the rainfall time series and the features constructed based on domain knowledge together form the feature set. However, sometimes some features may not correlate well with the model mechanism and do not have good predictive ability and may even negatively affect the model. By filtering the features through domain knowledge, model experiments and VIF validation, we can remove the insignificant features and thus improve the accuracy of the model. It can also reduce the computational cost and improve the interpretability of the model (Khalid et al., 2014).
A uniform rainfall slice length
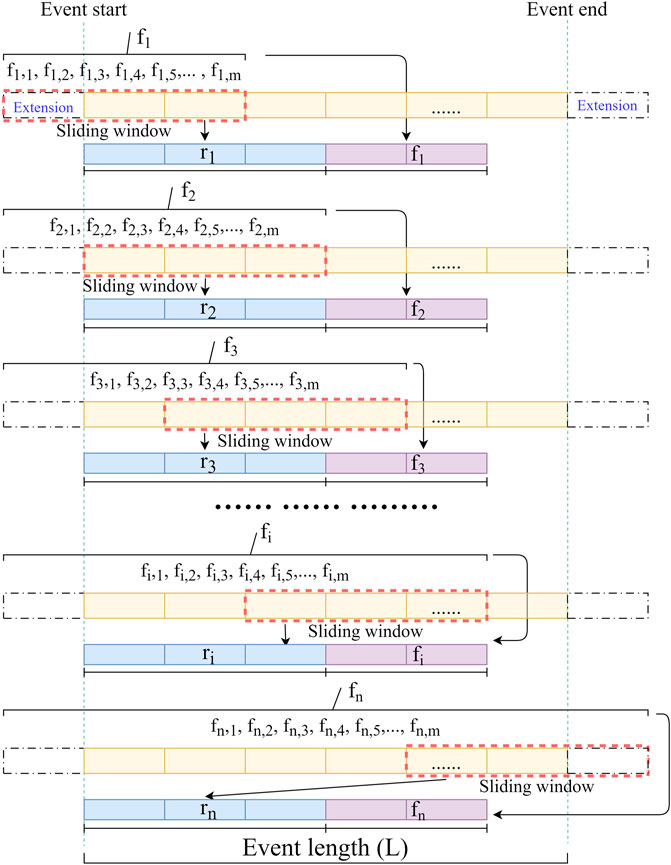
FIGURE 2. Schematic diagram of data slicing and integration.
The rainfall input vector
The rainfall time series feature vector
The single input vector of the model can be expressed as Eq. 7.
The combined input matrix X can be expressed as Eq. 8, and the output matrix as Eq. 9. The input-output relationship in regression model can be expressed as Eq. 10.
After processing the data, the model is trained and tested in the ratio of 70% and 30% of the training and test sets. The testing was carried out by random sampling method. Samples were imported into the regression model. The optimal parameters, including slice length, number of features, feature combination method and prediction strategy, are determined by testing. The performance of several machine learning algorithms is compared to obtain the optimal model configuration.
Through multi-source data analysis of meteorology, waterlogging, topography and municipality, the geographical features including topography terrain, land cover type and drainage network distribution within 500 m diameter of the station are integrated. The amplification factor (AF) between rainfall and waterlogging depth is calculated from historical data, and the risk of waterlogging in the area is also analyzed according to the amplification factor; the larger the AF, the higher the possibility of generating deeper waterlogging.
Shenzhen is one of the core cities of the Guangdong-Hong Kong-Macao Greater Bay Area. Over the past 40 years, Shenzhen’s GDP has grown rapidly from 270 million yuan in 1980 to 2,767.02 billion yuan in 2021. The annual average rainfall is 1935.8 mm, and the time distribution shows that the rainfall is mainly concentrated in April to September, with a spatial trend of decreasing rainfall from the southeast to the northwest. Typhoons and rainstorms are the most frequently occurring hazards in Shenzhen (Gong et al., 2022). Shenzhen is prone to frequent short-duration rainstorms, which often result in severe waterlogging in the city and, sometimes, can even cause casualties (Liu et al., 2020). Shenzhen City had an extreme rainstorm on 11 April 2019, resulting in an internal waterlogging event that killed 11 people in the city. Therefore, it is important to be able to predict and warn the occurrence of waterlogging disasters in advance to protect the safety of citizens as well as to improve the disaster prevention and mitigation capacity of the city. Figure 3 shows the location of Shenzhen and the area involved in the study, and Table 2 shows the data used for the case.
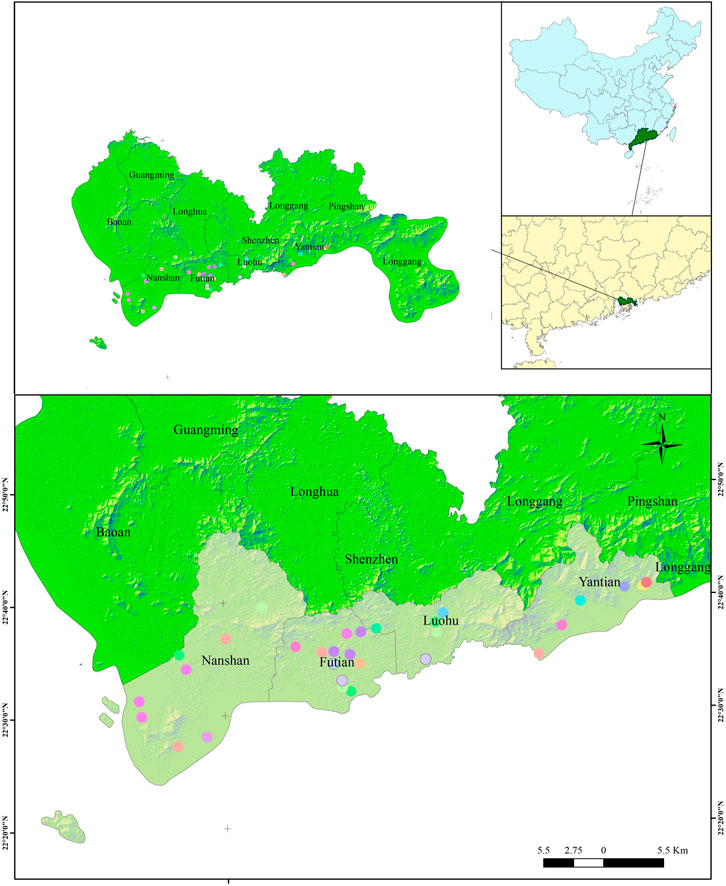
FIGURE 3. Study area of Shenzhen, China.
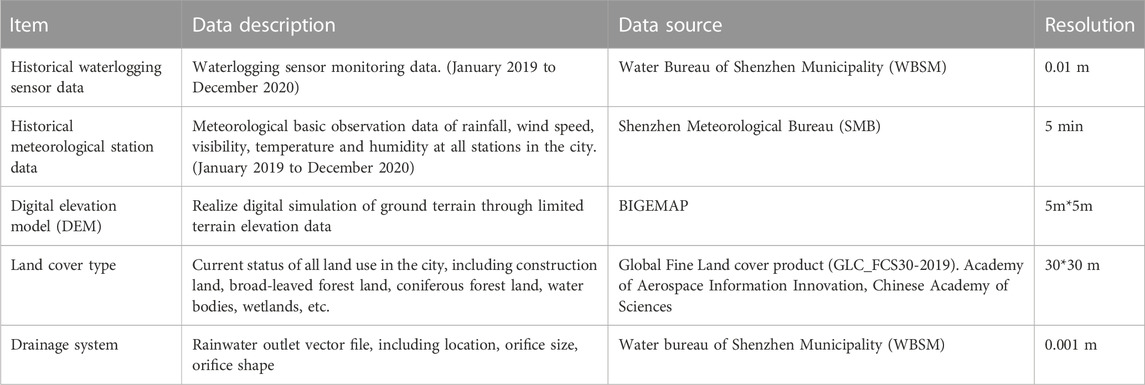
TABLE 2. Data description and sources.
The paper conducted experiments on four monitoring stations. As shown in Table 3, in the comparison of the three algorithms, Random Forest (RF) has the smallest MSE except at station D, where RF has a slightly larger MSE than Gradient Boosting Decision Tree (GBDT), indicating that RF is better adapted to this prediction task.
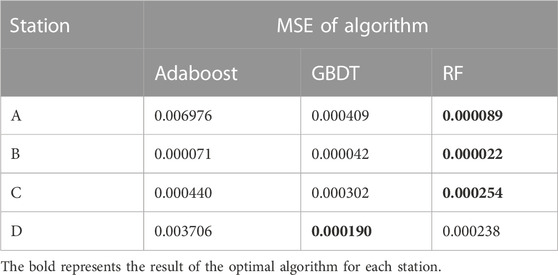
TABLE 3. Comparison of machine learning algorithms.
Compared to direct prediction using the original time series, the method of adding extracted features achieves a larger improvement at all four stations (Table 4). It indicates that using features for training can improve the prediction ability of the model to a greater extent.
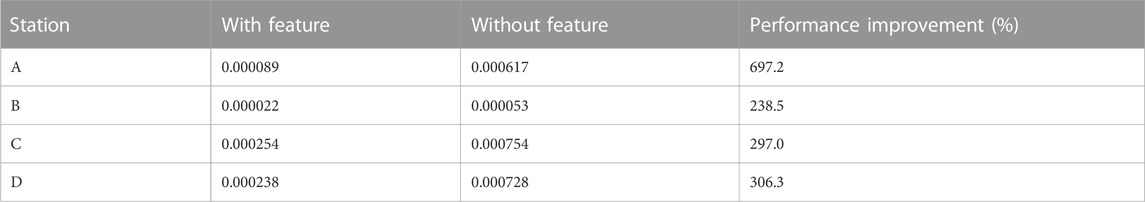
TABLE 4. Comparison of results of methods with and without features.
As shown in Figure 4, the constructed and extracted features possess different weights, and with the algorithmic feature visualization function, we conclude. The
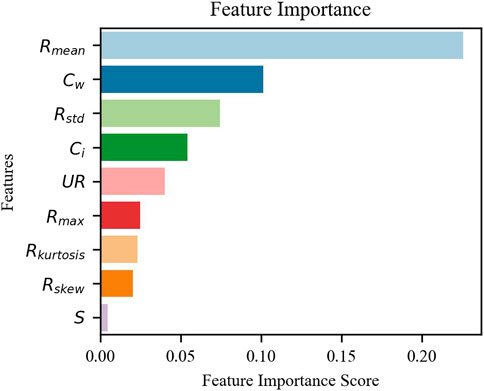
FIGURE 4. The weight value of 9 features in the model.
After the configuration combination experiments, the configuration with the best results was finally selected as follows: when selecting the original rainfall data, it is better to use the 1-h sliding rainfall, which can enhance the fine waterlogging prediction. Of the total number of features constructed and extracted, 9 feature combinations were determined to balance computational efficiency and prediction accuracy (rain dry, rain month, rain min, rain AUC and rain cum were removed). Nine features did not overfit on 4 stations, proving that our feature construction makes sense. The experimental results of the three algorithms were compared, and the RF algorithm had superior robustness.
In Figure 5, the blue curve is the rainfall and the orange curve is the waterlogging depth, and it can be seen that there is a strong correlation between the two. Figure 6 shows the predicted and true values of the waterlogging depth, and it can be seen that the model can predict the change trend well, with an average error within 2 cm. Prediction model evaluation for four stations can be seen in Table 5.
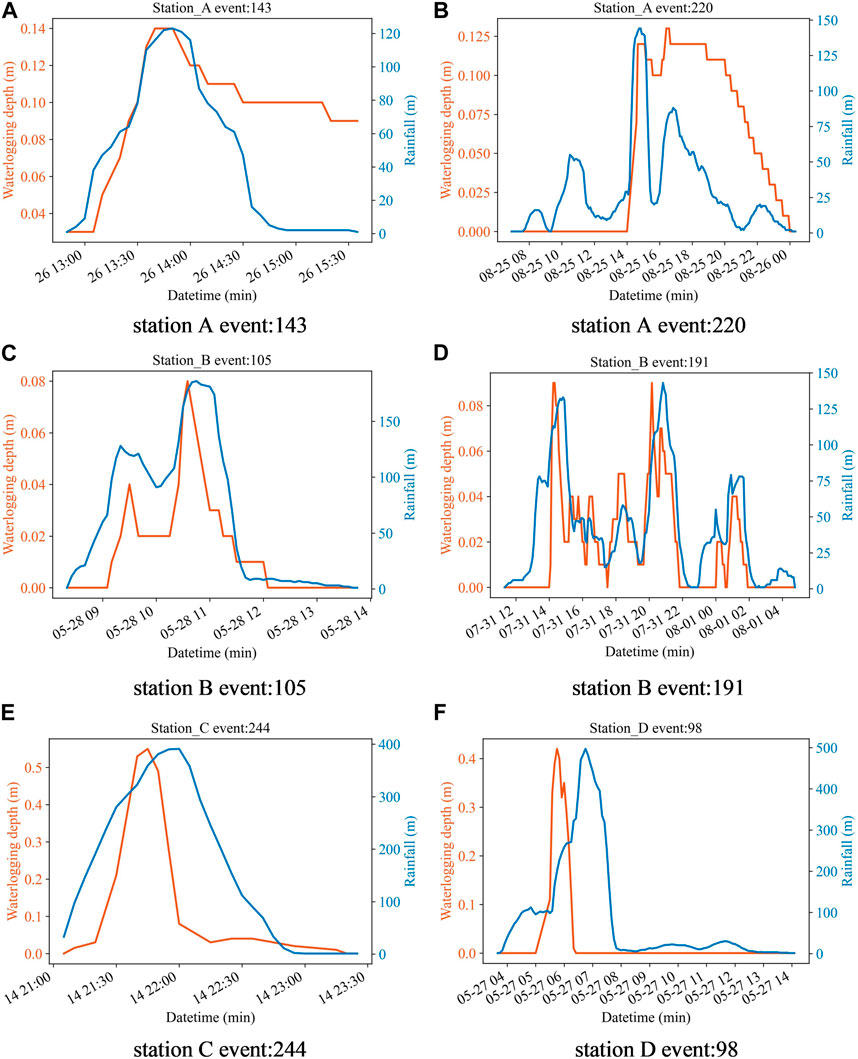
FIGURE 5. Rainfall and waterlogging curves for events in four stations. (A) station A event: 143; (B) station A event: 220; (C) station B event: 105; (D) station B event: 191; (E) station C event: 244; (F) station D event: 98.
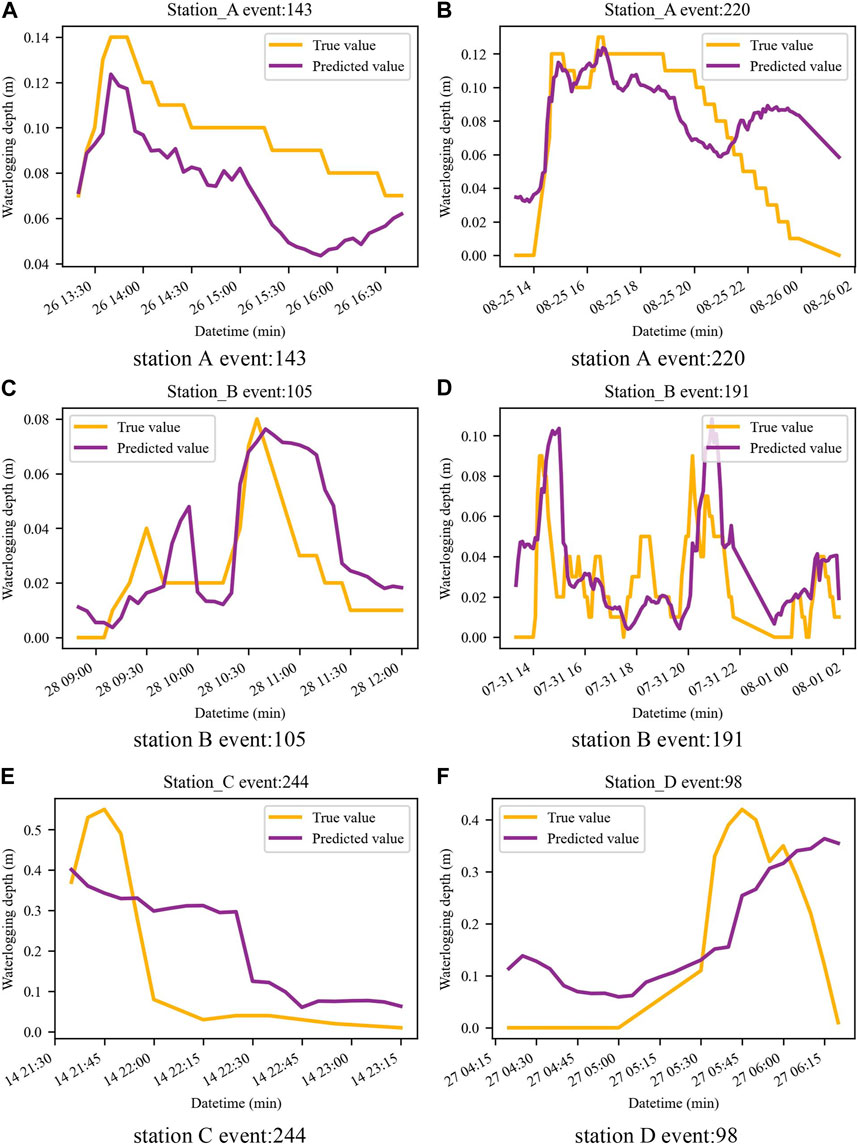
FIGURE 6. Predicted depth of waterlogging at four stations. (A) station A event: 143; (B) station A event: 220; (C) station B event: 105; (D) station B event: 191; (E) station C event: 244; (F) station D event: 98.
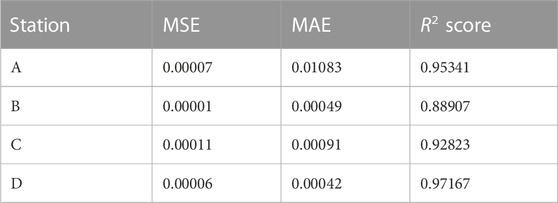
TABLE 5. Prediction model evaluation for four stations.
1) The method in this paper has a smaller MSE and more accurate prediction results than the results obtained by directly using the original rainfall event series. The model enhances the performance and robustness by time series feature extraction. Better prediction results are achieved by adjusting the feature parameters when the model is not over-fitted.
2) Figure 7 shows the ratio of rainfall (m) to waterlogging depth (m) for each of the four stations in each slice of the waterlogging event, which we define here as the Amplification factor. Because the number of waterlogging events at each station is different from the length of time, the amount of data at station A is much larger than that at stations C and D. The curves reflect the vulnerability of each station to rainfall mitigation capacity in terms of waterlogging events. The AF of station A is generally larger, indicating that station A is more likely to form deeper water under the same rainfall event. The AF of station D is generally smaller, indicating its better ability to withstand waterlogging hazards. As seen in Table 6. Statistical results of geographical characteristics of the four stations., station A has the least drainage outlet area in the area and the drainage volume is at a lower level. As seen in Figure 8, the topography of station A is the flattest among the four stations (Table 6, variance of DEM is only 3.91), and the central terrain of the area is in a significant depression, so its is more likely to form standing water. In terms of the number of waterlogging events, station A also has the most, reaching 13.7 times that of station D.
3) The results of flow cumulative values extracted from the topographic data can reflect the runoff direction and flow results. From Table 6, the combined regional flow cumulative value of station A reaches 2,151,063, and it can be seen from Figure 9 that the area of station A contains a flow vector with a larger cumulative value. The combined factors mentioned in 1) constitute the result of a larger AF at station A.
4) Station D has the best comprehensive drainage capacity among the four stations. With other geographical features similar to B, the total waterlogging time at station D is only 24.63% of that at station B. This indicates that the better the regional drainage facilities, the lower the risk of waterlogging.
5) It can be seen from Figure 8 that all four waterlogging monitoring stations are set up in the more low-lying areas of the region. It indicates that the setting of monitoring stations is generally oriented to the occurrence of waterlogging hazards, and the priority of construction is higher in places with high frequency of occurrence. The results of this study on geographic features can be used to find areas with similar geographic features and thus provide reference for the additional waterlogging monitoring stations.
6) The four selected waterlogging monitoring stations are all in urban built-up areas, and the land cover type is impervious surface. This type of land surface possesses a runoff coefficient of about 0.95–1, so the infiltration capacity of rainfall is weak. If the percentage of impervious surface on the surrounding ground is high, it will further increase the risk of waterlogging formation.
7) The proportion of waterlogging events in the total events is low, which can affect the prediction effect of the model. By selecting a sample of waterlogging events in advance, the positive sample weights are enhanced through stratified sampling and data balancing, which can improve the model prediction ability and reduce errors.
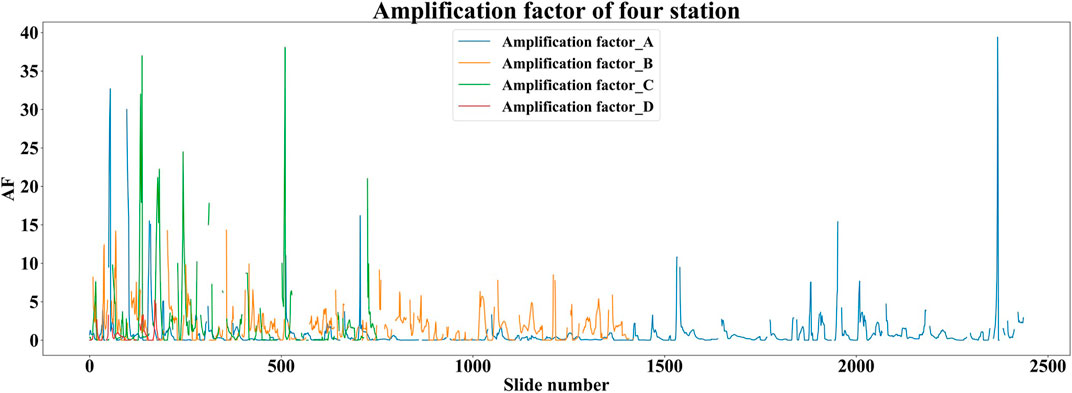
FIGURE 7. Results of amplification factors for the four stations.
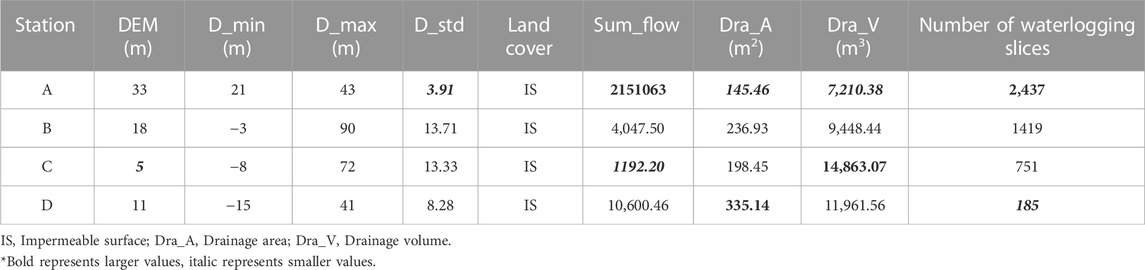
TABLE 6. Statistical results of geographical characteristics of the four stations.
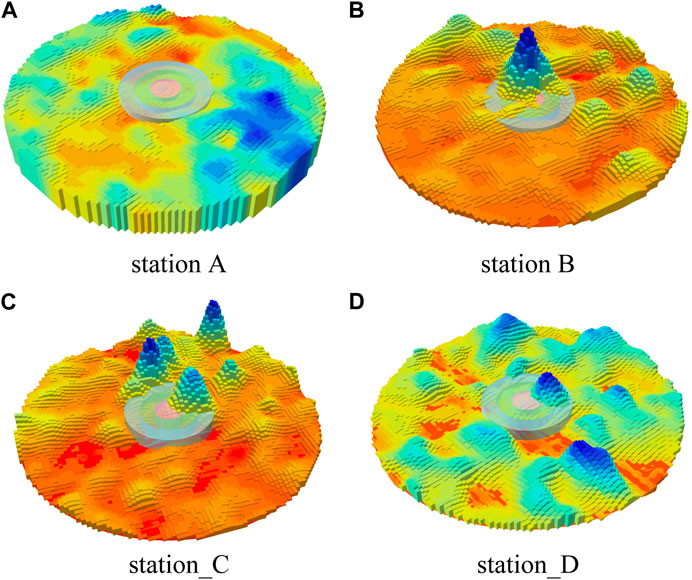
FIGURE 8. Topography within a 500 m radius of stations. (A) Station A; (B) station B; (C) station C; (D) station (D). Blue represents higher elevation values and red represents lower elevation values. The middle circles represent the zones of 50, 100, 150 m from the station. (The terrain is stretched, with a stretch factor of 3).
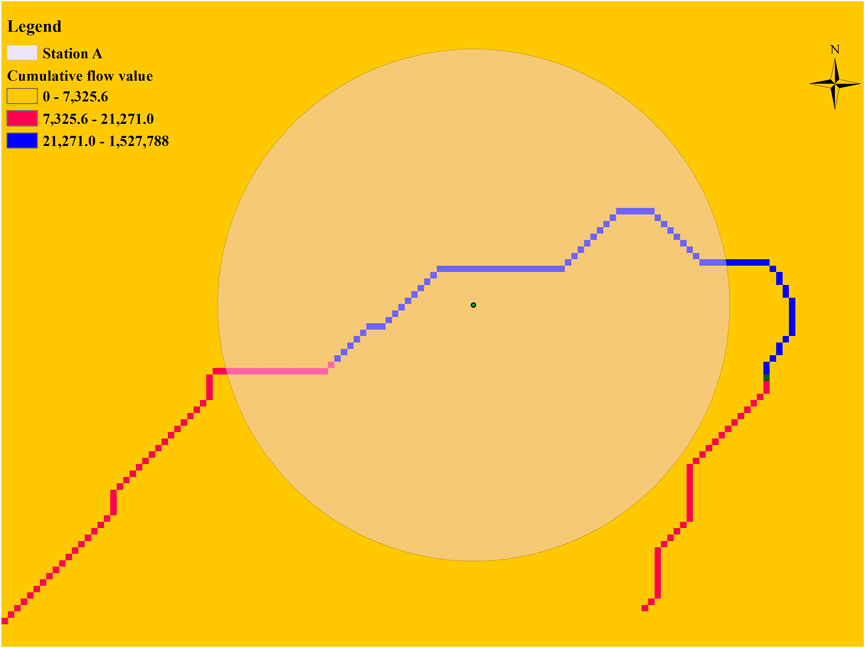
FIGURE 9. Cumulative value of flow in the area of station A.
Short-term prediction of waterlogging has been a hot issue for research, because earlier warning can reduce casualties and property damage from disasters. Due to the Markovian character of itself, future waterlogging can be predicted using the waterlogging of previous periods. However, how to use rainfall data to predict waterlogging where there are no sensors becomes an urgent problem. In this study, a time-series machine learning model using feature extraction for rainfall events significantly improves the prediction with an average error of less than 2 cm. The nine features extracted are validated and proved to be really beneficial and reasonable for model capability improvement. Combined with future rainfall forecast information, it is possible to calculate whether waterlogging will form at a point in the short-term future time period. Based on the prediction results, the government can dispatch rescue forces or block the relevant roads in advance. It provides a reliable basis for government emergency decision-making and risk analysis.
The original contributions presented in the study are included in the article/supplementary materials, further inquiries can be directed to the corresponding author.
ZZ and LY contributed to conception and design of the study. ZZ and YC organized the database. ZZ, XJ, and YC performed the statistical analysis. ZZ and XJ completed the code compilation and method. ZH and JL revised the manuscript. LY and JL managed the implementation of the research activities and reviewed the manuscript All authors contributed to manuscript revision, read, and approved the submitted version.
This research was funded by National Key R&D Program of China (2018YFC0807000), Natural Science Foundation of China (71771113), National Key R&D Program of China (2019YFC0810705), Shenzhen Scientific Research Funding (Grant No. K22627501), and Shenzhen Science and Technology Plan platform and carrier special (Grant So. ZDSYS20210623092007023). It was also partly supported by the Shenzhen Science and Technology Program (KCXFZ20201221173601003) and the Henan Provincial Key Laboratory of Hydrosphere and Watershed Water Security.
The authors declare that the research was conducted in the absence of any commercial or financial relationships that could be construed as a potential conflict of interest.
All claims expressed in this article are solely those of the authors and do not necessarily represent those of their affiliated organizations, or those of the publisher, the editors and the reviewers. Any product that may be evaluated in this article, or claim that may be made by its manufacturer, is not guaranteed or endorsed by the publisher.
Arshad, B., Ogie, R., Barthelemy, J., Pradhan, B., Verstaevel, N., and Perez, P. (2019). Computer vision and IoT-based sensors in flood monitoring and mapping: A systematic review. Sensors (Basel) 19 (22), 5012. doi:10.3390/s19225012
Burak, S., Bilge, A., and Ülker, D. (2020). Computation of monthly runoff coefficients for Istanbul. Therm. Sci. 25, 1561–1572. doi:10.2298/TSCI191102147B
David, N., Alpert, P., and Messer, H. (2013). The potential of cellular network infrastructures for sudden rainfall monitoring in dry climate regions. Atmos. Res. 131, 13–21. doi:10.1016/j.atmosres.2013.01.004
Deo, R., Wen, X., and Qi, F. (2016). A wavelet-coupled support vector machine model for forecasting global incident solar radiation using limited meteorological dataset. Appl. Energy 168, 568–593. doi:10.1016/j.apenergy.2016.01.130
Ding, Y., Zhu, Y., Feng, J., Zhang, P., and Cheng, Z. (2020). Interpretable spatio-temporal attention LSTM model for flood forecasting. Neurocomputing 403, 348–359. doi:10.1016/j.neucom.2020.04.110
Du, J., Fang, J., Xu, W., and Shi, P. (2012). Analysis of dry/wet conditions using the standardized precipitation index and its potential usefulness for drought/flood monitoring in Hunan Province, China. Stoch. Environ. Res. Risk Assess. 27, 377–387. doi:10.1007/s00477-012-0589-6
Duan, Y., Gao, Y., Zhang, Y., Huawei, L., Li, Z., Zhou, Z., et al. (2022). The 20 july 2021 major flood event” in greater Zhengzhou, China: A case study of flooding severity and landscape characteristics. Land 11, 1921. doi:10.3390/land11111921
Ferreira, C., Walsh, R. P. D., Shakesby, R., Keizer, J. J., Soares, D., gonzalez-pelayo, O., et al. (2015). Differences in overland flow, hydrophobicity and soil moisture dynamics between Mediterranean woodland types in a peri-urban catchment in Portugal. J. Hydrology 533, 473–485. doi:10.1016/j.jhydrol.2015.12.040
Gong, W., Jiang, J., and Yang, L. (2022). Dynamic risk assessment of compound hazards based on VFS–IEM–IDM: A case study of typhoon–rainstorm hazards in shenzhen, China. Nat. Hazards Earth Syst. Sci. 22, 3271–3283. doi:10.5194/nhess-22-3271-2022
Han, H., and Morrison, R. (2021). Data-driven approaches for runoff prediction using distributed data. Stoch. Environ. Res. Risk Assess. 36, 2153–2171. doi:10.1007/s00477-021-01993-3
Khalid, S., Shehryar, T., and Nasreen, S. (2014). “A survey of feature selection and feature extraction techniques in machine learning,” in Proceedings of the 2014 science and information conference, London, UK, August 2014.
Khatri, S., Kokane, P., Kumar, V., and Pawar, S. (2022). Prediction of waterlogged zones under heavy rainfall conditions using machine learning and GIS tools: A case study of Mumbai. GeoJournal 87, 1–15. doi:10.1007/s10708-022-10731-3
Li, X., Li, M., Cui, K., Lu, T., Xie, Y., and Liu, D. (2022). Evaluation of comprehensive emergency capacity to urban flood disaster: An example from Zhengzhou city in henan province, China. Sustainability 14, 13710. doi:10.3390/su142113710
Liu, Y., Li, L., Liu, Y., Chan, P. W., and Zhang, W. (2020). Dynamic spatial-temporal precipitation distribution models for short-duration rainstorms in Shenzhen, China based on machine learning. Atmos. Res. 237, 104861. doi:10.1016/j.atmosres.2020.104861
Liu, Y., Yesen, L., Zheng, J., Chai, F., and Ren, H. (2022a). Intelligent prediction method for waterlogging risk based on AI and numerical model. Water 14, 2282. doi:10.3390/w14152282
Liu, Y., Zhang, W., Yan, Y., Li, Z., Xia, Y., and Song, S. (2022b). An effective rainfall–ponding multi-step prediction model based on LSTM for urban waterlogging points. Appl. Sci. 12, 12334. doi:10.3390/app122312334
Loftis, J., Forrest, D., Katragadda, S., Spencer, K., Organski, T., Nguyen, C., et al. (2018). StormSense: A new integrated network of IoT water level sensors in the smart cities of hampton roads, va. Mar. Technol. Soc. J. 52, 56–67. doi:10.4031/MTSJ.52.2.7
Mu, D., Luo, P., Lyu, J., Zhou, M., Huo, A., Duan, W., et al. (2020). Impact of temporal rainfall patterns on flash floods in Hue City, Vietnam. J. Flood Risk Manag. 14. doi:10.1111/jfr3.12668
Nath, B., Ni-Meister, W., and Choudhury, R. (2021). Impact of urbanization on land use and land cover change in Guwahati city, India and its implication on declining groundwater level. Groundw. Sustain. Dev. 12, 100500. doi:10.1016/j.gsd.2020.100500
Nayeb Yazdi, M., Ketabchy, M., Sample, D., Scott, D., and Liao, H. (2019). An evaluation of HSPF and SWMM for simulating streamflow regimes in an urban watershed. Environ. Model. Softw. 118, 211–225. doi:10.1016/j.envsoft.2019.05.008
Puttinaovarat, S., and Horkaew, P. (2020). Flood forecasting system based on integrated big and crowdsource data by using machine learning techniques. IEEE Access 8, 5885–5905. doi:10.1109/access.2019.2963819
Ran, Q., Su, D., Li, P., and He, Z. (2012). Experimental study of the impact of rainfall characteristics on runoff generation and soil erosion. J. Hydrology 424, 99–111. doi:10.1016/j.jhydrol.2011.12.035
Shahabi, H., Shirzadi, A., Ghaderi, K., Omidvar, E., Al-Ansari, N., Clague, J. J., et al. (2020). Flood detection and susceptibility mapping using sentinel-1 remote sensing data and a machine learning approach: Hybrid intelligence of bagging ensemble based on K-nearest neighbor classifier. Remote Sens. 12 (2), 266. doi:10.3390/rs12020266
Sofia, G., Ragazzi, F., Giandon, P., Dalla Fontana, G., and Tarolli, P. (2019). On the linkage between runoff generation, land drainage, soil properties, and temporal patterns of precipitation in agricultural floodplains. Adv. Water Resour. 124, 120–138. doi:10.1016/j.advwatres.2018.12.003
Sundaram, S., Devaraj, S., and Yarrakula, K. (2021). Modeling, mapping and analysis of urban floods in India-a review on geospatial methodologies. Environ. Sci. Pollut. Res. 28, 67940–67956. doi:10.1007/s11356-021-16747-5
Tang, X., Li, J., Li, L., Yu, H., and Wang, F. (2021). A method to increase the number of positive samples for machine learning-based urban waterlogging susceptibility assessments. Stoch. Environ. Res. Risk Assess. 36, 1–18. doi:10.1007/s00477-021-02035-8
Tarasova, L., Basso, S., Zink, M., and Merz, R. (2018). Exploring controls on rainfall-runoff events: 1. Time series-based event separation and temporal dynamics of event runoff response in Germany. Water Resour. Res. 54 (10), 7711–7732. doi:10.1029/2018WR022587
Wang, H., Zhao, Y., Zhu, Y., and Wang, H. (2021). Prediction of urban water accumulation points and water accumulation process based on machine learning. Earth Sci. Inf. 14, 2317–2328. doi:10.1007/s12145-021-00700-8
Wu, Z., Zhou, Y., Wang, H., and Jiang, Z. (2020b). Depth prediction of urban flood under different rainfall return periods based on deep learning and data warehouse. Sci. Total Environ. 716, 137077. doi:10.1016/j.scitotenv.2020.137077
Wu, Z., Zhou, Y., and Wang, H. (2020a). Real-time prediction of the water accumulation process of urban stormy accumulation points based on deep learning. IEEE Access 8, 1. doi:10.1109/ACCESS.2020.3017277
Xue, F., Huang, M., Wang, W., and Zou, L. (2016). Numerical simulation of urban waterlogging based on FloodArea model. Adv. Meteorology 2016, 1–9. doi:10.1155/2016/3940707
Yan, H., and Hamid, M. (2016). Toward more robust extreme flood prediction by bayesian hierarchical and multimodeling. Nat. Hazards 81, 203–225. doi:10.1007/s11069-015-2070-6
Yan, X., Xu, K., Feng, W., and Chen, J. (2021). A rapid prediction model of urban flood inundation in a high-risk area coupling machine learning and numerical simulation approaches. Int. J. Disaster Risk Sci. 12, 903–918. doi:10.1007/s13753-021-00384-0
Yang, M., Zhang, Y., and Pan, X. (2020). Improving the Horton infiltration equation by considering soil moisture variation. J. Hydrology 586, 124864. doi:10.1016/j.jhydrol.2020.124864
Yin, J., Gentine, P., Slater, L., Gu, L., Pokhrel, Y., Hanasaki, N., et al. (2023). Future socio-ecosystem productivity threatened by compound drought–heatwave events. Nat. Sustain. 6, 259–272. doi:10.1038/s41893-022-01024-1
Yin, J., Guo, S., Wang, J., Chen, J., Zhang, Q., Gu, L., et al. (2022). Thermodynamic driving mechanisms for the formation of global precipitation extremes and ecohydrological effects. Sci. China Earth Sci. 66, 92–110. doi:10.1007/s11430-022-9987-0
Yin, J., Ye, M., Yin, Z., and Xu, S. (2015). A review of advances in urban flood risk analysis over China. Stoch. Environ. Res. Risk Assess. 29, 1063–1070. doi:10.1007/s00477-014-0939-7
Zavala, L., Jordán, A., and Bellinfante, N. (2008). Seasonal variability of runoff and soil loss on forest road backslopes under simulated rainfall. Catena 74, 73–79. doi:10.1016/j.catena.2008.03.006
Zhang, H., Wu, C., Chen, W., and Huang, G. (2017). Assessing the impact of climate change on the waterlogging risk in coastal cities: A case study of guangzhou, south China. J. Hydrometeorol. 18, 1549–1562. doi:10.1175/JHM-D-16-0157.1
Zhang, Z., Zeng, Y., Huang, Z., Liu, J., and Yang, L. (2023). Multi-source data fusion and hydrodynamics for urban waterlogging risk identification. Int. J. Environ. Res. Public Health 20 (3), 2528. doi:10.3390/ijerph20032528
Zhou, Y., Wu, Z., Xu, H., and Wang, H. (2022). Prediction and early warning method of inundation process at waterlogging points based on Bayesian model average and data-driven. J. Hydrology Regional Stud. 44, 101248. doi:10.1016/j.ejrh.2022.101248
Keywords: urban waterlogging, time series, risk assessment, machine learning, rainfall, Shenzhen
Citation: Zhang Z, Jian X, Chen Y, Huang Z, Liu J and Yang L (2023) Urban waterlogging prediction and risk analysis based on rainfall time series features: A case study of Shenzhen. Front. Environ. Sci. 11:1131954. doi: 10.3389/fenvs.2023.1131954
Received: 26 December 2022; Accepted: 03 April 2023;
Published: 13 April 2023.
Edited by:
Huiyu Dong, Chinese Academy of Sciences (CAS), ChinaReviewed by:
Konstantinos Nikolopoulos, Durham University, United KingdomCopyright © 2023 Zhang, Jian, Chen, Huang, Liu and Yang. This is an open-access article distributed under the terms of the Creative Commons Attribution License (CC BY). The use, distribution or reproduction in other forums is permitted, provided the original author(s) and the copyright owner(s) are credited and that the original publication in this journal is cited, in accordance with accepted academic practice. No use, distribution or reproduction is permitted which does not comply with these terms.
*Correspondence: Lili Yang, eWFuZ2xsQHN1c3RlY2guZWR1LmNu
Disclaimer: All claims expressed in this article are solely those of the authors and do not necessarily represent those of their affiliated organizations, or those of the publisher, the editors and the reviewers. Any product that may be evaluated in this article or claim that may be made by its manufacturer is not guaranteed or endorsed by the publisher.
Research integrity at Frontiers
Learn more about the work of our research integrity team to safeguard the quality of each article we publish.