- Collaborative Innovation Center on Forecast and Evaluation of Meteorological Disasters (CIC-FEMD)/Jiangsu Collaborative Innovation Center of Atmospheric Environment and Equipment Technology (CICAEET)/Jiangsu Key Laboratory of Big Data Analysis Technology, Nanjing University of Information Science and Technology, Nanjing, China
Detecting the distance and orientation of long-distance thunderstorms has very important practical significance. The multi-station lightning location system relies on a high-precision time module and good network communication capabilities, but in some cases these conditions cannot be met, but there is still a need for lightning activity monitoring, and it is very important to establish a single-site lightning location system. In this paper, we have established a long-distance single-site lightning location station, and in order to improve the accuracy of distance estimation, a numerical algorithm is used to obtain the relationship between the ground wave arrival time delay and the propagation distance, and it is used to revise the time difference between the peak value of the skywave and ground wave. Moreover, we used multi-station lightning location data to revise the site-error in magnetic direction finder method to improve the accuracy of the direction calculation. The results show that the effective detection range of the single-site we have been established is 200 km–2000 km, and the revised average direction deviation dropped from 12.3° to 8.6°. The verification results of thunderstorms within the effective detection range show that the relative error of single-site lightning location is 8.4%–18.6% after the revision.
1 Introduction
Lightning location data has become an integral part of meteorological data observations, especially in the early warning of severe weather, which has led to continuous improvements in ground-based and space-based lightning location systems (DiGangi et al., 2022). Now, ground-based lightning location systems (LLSs) typically use multiple detection stations (≥4 stations) to detect lightning electromagnetic pulses (LEMP) from lightning radiation (Koshak et al., 2004; Pohjola and Mäkelä, 2013; Wu et al., 2018; Liu et al., 2020; Wang et al., 2020). Lightning discharges generate broadband electromagnetic radiation, mainly in the frequency band from 1 Hz to 300 MHz (Gu et al., 2022), among them, electromagnetic pulses in the very-low-frequency (VLF; 3–30 kHz) band are widely used in long-range lightning location. Such signals are also called sferics, which can propagate thousands of kilometers in the Earth-ionosphere waveguide (EIWG) with little attenuation (∼2–3 dB/1,000 km) (Ammar and Ghalila, 2020). The LLSs mainly use the time of arrival (TOA) method and the time difference of arrival (TDOA) method, which uses the time difference between the LEMP signal and the station to location, so LLSs can obtain high lightning location accuracy, and the average error is generally on the order of hundred meters (Zhang et al., 2010; Shi et al., 2017; Wang et al., 2021). This also requires that each station is equipped with a high-precision time module and good network communication so that the LEMP collected at each station can be aggregated to the data processing center to give real-time lightning location results (Wu et al., 2018).
Due to the constraints of the site environment, some places do not have good network transmission capabilities or have many restrictions on transmission with external networks, a single-site can be used to determine the lightning location and also help save operation and maintenance (O&M) costs. Because of the good mobility and flexibility of single-site, it has unique superiority in lightning location in civil aviation, military activities and other fields. Single-site lightning location technology is a combination of propagation distance estimation and direction-finding technology, what matters is how to improve the accuracy of single-site lightning location. In contrast, the magnetic direction finder (MDF) method can detect sferics thousands of kilometers away, a typical magnetic sensor usually consists of two orthogonal magnetic antennas. However, the method suffers from an angular uncertainty of 180°, and an electric field antenna is usually added to determine the lightning polarity, thus eliminating the angular uncertainty (Herrman et al., 1976; Rakov, 2013; Nag et al., 2014). Ramachandran et al. (Ramachandran et al., 2007) used the period and delay extracted from the quasi-periodic waveform of the electric field received at the station to estimate distance, the error of the distance estimate reported in the text is 8.8%. Nagano et al. (Nagano et al., 2007) used sferics pulses to locate lightning (direction and distance) at close range with an error of about 10% with less interference from noise. Mostajabi et al. (Mostajabi et al., 2019) combines the Electromagnetic Time Reversal (EMTR) and Machine Learning (ML) to propose a new method for single-site lightning location, which is more suitable for application in mountainous areas, the model gives an average error of 253 m for six return strikes (RS) occurring at a distance of 14.7 km. Wang et al. (Wang et al., 2022) proposed a single-site location method, The method is based on deep learning and predicts the LEMP propagation distance by learning the characteristic points of sferics waveforms with different propagation distances. Within the detection range of 1,000 km, the relative error of this method is 4.91%–15.26%. Zhang et al. (Antunes de Sa and Marshall, 2020) used a single-station magnetic orientation method to locate narrow bipolar events (NBEs), they found that the positive NBEs produced between 7 km and 15 km and negative NBEs produced above 14 km. Andre et al. (Zhang et al., 2016) used the time difference between ground wave and the first skywave combined with ML to realize the lightning distance estimation by a single-site, 68% of the data error is within 32 km.
In single-site lightning location that relies on MDF to obtain lightning directions, there are unavoidable system errors that arise from two main factors: random errors (from non-vertical lightning channels, background noise and electronics differences) and site errors (from the surrounding terrain and secondary radiation from surrounding conductive structures), with the former typically having an effect of 1–2° on the orientation results, while the latter has a much larger effect, possibly in the range of 10–30° (Mach et al., 1986; Chen et al., 2013; Lu et al., 2017). Due to the curvature of the earth and the finite conductivity of the ground, the electromagnetic waves generated by lightning will be attenuated when propagating along the ground at long distances, and there will be some deviation when estimating the lightning distance (Honma et al., 1998; Shao and Jacobson, 2009). To obtain the direction and distance of lightning relative to a single-site, we use a combination of the ionosphere reflection model and MDF, and also use an analytical algorithm to simulate the relationship between ground wave arrival time delay and distance and use LLSs established in China to obtain the site-error in single-site lightning location, revise the estimation results of distance and direction respectively, so as to obtain more accurate single-site lightning location results.
2 Data analysis method
2.1 Description of experimental instrument and data
The multi-station lightning location data used in this paper are from a VLF LLSs established in China (Li et al., 2022; Zhang et al., 2022), the single-site equipment installed in Nanjing, Jiangsu Province, China. The single-site receives lightning signals in the range of about 100 Hz to 80 kHz, records LEMP waveform data by continuous acquisition, and stores them in a hard disk drive (HDD). The sensors used for detection include a fast electric field antenna and two orthogonal magnetic antennas, induce the electric field signal and the magnetic field signal in the east-west (EW) and north-south (NS) directions, respectively. The sampling frequency of the equipment is 1MS/s, and the GPS receiver provides an output of one-pulse-per-second output (1 PPS) as a reference source for tagging data sample times, with an accuracy of ±50 ns. A trigger threshold will be set according to the background noise, and the original waveform data greater than the threshold will be extracted. The record length of the extracted waveform is 1000 µs, and the pre-trigger time is 300 µs, while the extracted signal is de-noised by the Modified Empirical Wavelet Transform (MEWT) method based on the Empirical Wavelet Transform (EWT) (Dai et al., 2022).
The data used in this paper are from August 7, and August 11-15 August 2022, during which frequent thunderstorm activities occurred, the location data from August 11-August 15 are used to revise the site-error by comparing it with the multi-station lightning location results, while some sustained all-day thunderstorm activity recorded by multiple stations during these days will also be used to calculate the ionosphere equivalent reflection height, and the data from August 7 are used to verify the effect of the revision. Figure 1 shows the lightning that occurs in different areas on different days. These data will be used to calculate the trend of the ionosphere equivalent reflection height over a 24-h period. Since the data in the same area on August 12 is not continuous for most of the time, this will affect the reliability of the results, so the dates of this day are not used to calculate the ionosphere equivalent reflection height. Since the ionosphere reflection regions calculated in Figures 1A–D are relatively close to each other. Therefore, in this paper, the ionosphere reflection region calculated by Figures 1A, B is referred to as region A, and the ionospheric reflection region calculated by Figures 1C, D is referred to as region B.
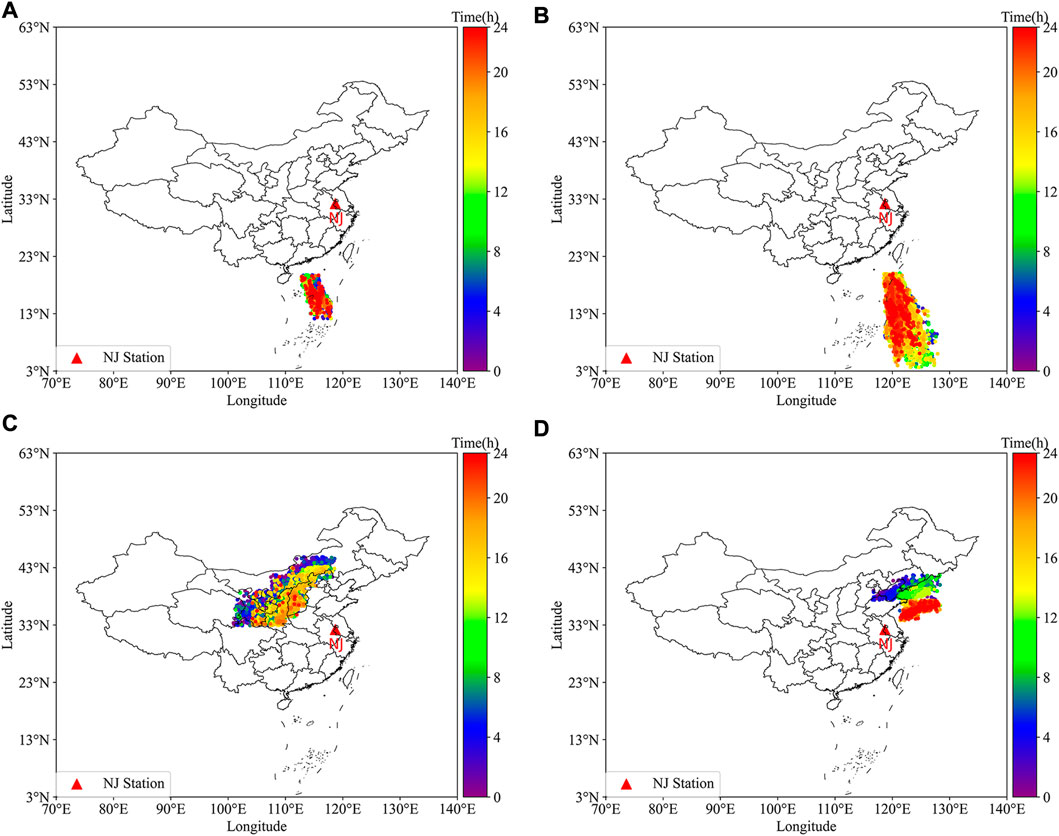
FIGURE 1. The distribution of lightning events in selected regions (A) From 00:00 to 23:59 on 11 August2022 (local time); (B) From 00:00 to 23:59 on 13 August2022 (local time); (C) From 00:00 to 23:59 on 14 August2022 (local time); (D) From 00:00 to 23:59 on 15 August2022 (local time).
2.2 Direction calculation
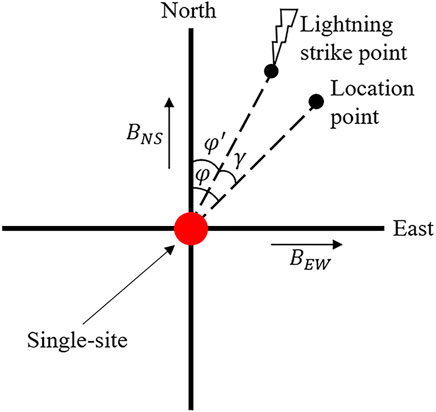
The MDF method has been widely used in the study of lightning location, assuming that lightning is a dipole discharge approximately perpendicular to the ground, and two orthogonal magnetic antennas to measure the horizontal magnetic field generated by lightning. According to the ratio of the induced voltage of the lightning magnetic field in the two vertical directions, the direction of the lightning relative to the detection station can be determined. For long-distance lightning location, the scale of the discharge channel is smaller relative to the detection distance, and the hypothesis of dipole is reasonable. According to the above-mentioned method, the value of the azimuth
In Eq. 1,
The accurate azimuth angle
2.3 Time delay revision
2.3.1 Ground wave time delay revision
However, when electromagnetic waves radiated by lightning discharges propagate along the surface of the earth, they will be affected by irregular ground conductivity distribution and complex terrain on the propagation path, especially during long-distance propagation. The propagation speed of electromagnetic waves will be less than the speed of light, and the arrival time will lag behind the ideal arrival time, this phenomenon has appeared in both simulation and actual observations (Shao and Jacobson, 2009; Hou et al., 2018). In this article,
The numerical algorithm used in this paper is based on the propagation theory of ground waves in finite conductivity proposed by Hill and Wait (Hill and Wait, 1980) Considering the propagation effect the limited ground conductivity and the propagation effect due to the curved surface of the earth, the attenuation coefficient in the frequency domain is calculated as (Wait, 1974):
In Eqs 3–7:
In this paper, three different lightning current sources are considered as the typical first return stroke (RS), subsequent RS, and dipole source. The model used is a modified transmission line model with exponential current attenuation with height (MTLE) mode (Nucci, 1988). Among them, the current source of the first RS and the subsequent RS assumes that as the lightning current travels on the lightning channel, the amplitude decreases exponentially with the increase of height, the waveform is in the form of a double Heidler function (Heidler et al., 1999). While the current waveform of the dipole source is assumed to be uniform along the lightning discharge channel.
Table 1 shows the typical lightning-based current waveforms of the First RS and Subsequent RS commonly used in engineering calculations (Rachidi et al., 2001).
The return stroke current waveform of the dipole source is assumed to be uniform along the lightning discharge channel and given as:
Where
The ground conductivity used in this paper is taken to be a typical value of 0.01 S/m, which corresponds to the wet ground condition. Figure 3A shows the current waveforms of the typical first RS and subsequent RS, Figure 3B shows the current waveform of the dipole source. The rising edge of the subsequent RS is steeper than the other two current sources and contains more high-frequency components. Figure 3C shows the ground wave arrival time delay at different distances, compared with the arrival time propagated at the speed of light. That is, the difference between the ideal ground wave arrival time and the actual ground wave arrival time, which is
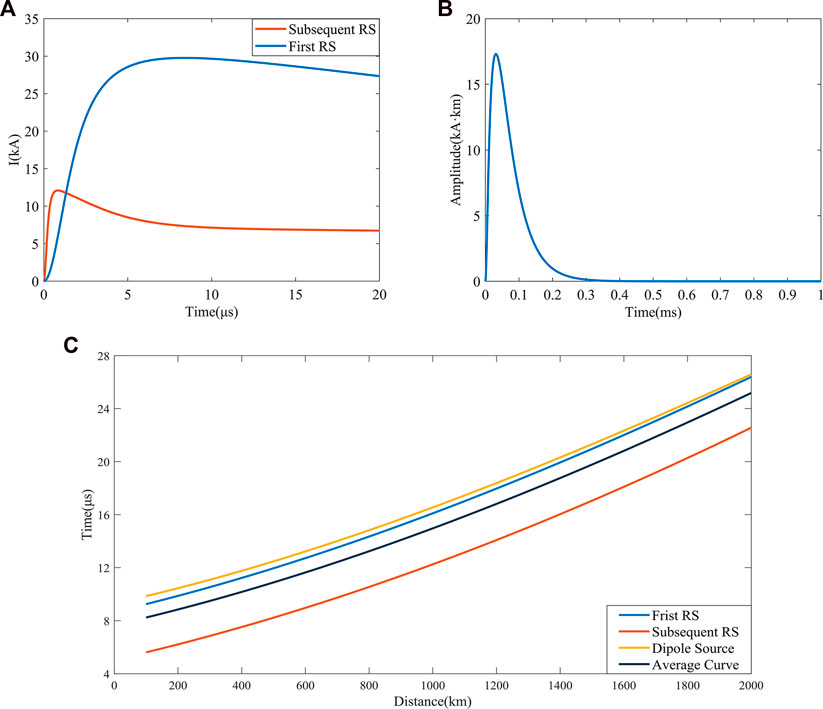
FIGURE 3. The lightning current waveforms and ground wave arrival time delay. (A) Current waveforms of the typical first RS and subsequent RS; (B) current waveform of the dipole source; (C) Delay of ground wave peak arrival time compared to
2.3.2 Ionospheric reflection model
Figure 4A shows the geometric model of sferics propagating in EIWG. The signal propagates through multiple specular reflections of the earth’s surface and the ionospheric D layer in the EIWG, the signal received by the station that arrives directly along the surface is called ground wave, and the signal that arrives after reflection from the ionosphere is called skywave (Li et al., 2022). Figure 4B shows a set of electric and magnetic field waveforms received by the single-site. A black asterisk is used to indicate the peak points of the ground wave and the first skywave. The propagation speed of electromagnetic waves is assumed to be the speed of light in the model, and the ground is a good conductor. With this model, it is possible to calculate the ionosphere equivalent reflection heights for different directions and regions based on the lightning location results obtained from LLS, and compare if significant differences exist. Using the ionosphere equivalent reflection heights, the lightning distance occurred can also be estimated.
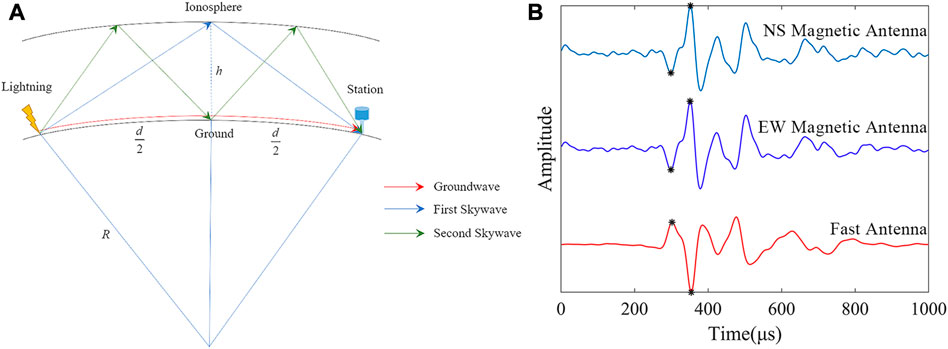
FIGURE 4. Lightning signal propagation in EIWG. (A) Schematic diagram of the first and second skywave reflections in EIWG; (B) Lightning waveform.
The reflection height (
In Eq. 11,
However, when propagating over long distances, using the above equation, the estimation results are often biased due to the ground wave peak time delay. In general, electromagnetic wave propagation over terrain with lower ground conductivity brings a larger arrival time delay. The ground wave arrival time delay caused by the propagation effect is considered in this work, and the theoretical time difference between the arrival time of the skywave and the ground wave is assumed to be
We substitute the distance (
The model can also be used to estimate the lightning distance by bringing the time of receiving the LEMP waveform and the ionosphere equivalent reflection height corresponding to that time into Eq. 11, and the distance between the lightning strike point and the single-site is obtained by iterative solution.
In Section 2.2, and Section 2.3, we obtained the direction and distance of the lightning relative to the single-site, respectively. While the location of the single-site is known, we use the Bessel geodesic problem algorithm to first establish an auxiliary sphere centered on the ellipsoid with any length as the radius, and then project ellipsoid elements onto the spherical surface according to certain conditions, solve the earth problem on the spherical surface, and finally convert the obtained spherical elements into ellipsoid elements according to the corresponding projection relationship. The reference system used in this paper is the WGS84 coordinate system, from which we can finally rely on a single-site to obtain the location of the lightning strike point.
3 Results and analysis
3.1 The ionosphere equivalent reflection height changes over 24-h
Figures 5A, B shows the line graphs of ionosphere equivalent reflection height with time delay considered. From Figure 5A, it can be seen that even in different regions, the difference in the ionosphere equivalent reflection height is not very large, especially at night (00:00–05:00). The reason for the fluctuations during the daytime period (06:00–18:00) on August 14 and August 15 was that the amount of data during that period was very small, which also brought unexpected fluctuations. The trend of changes in the
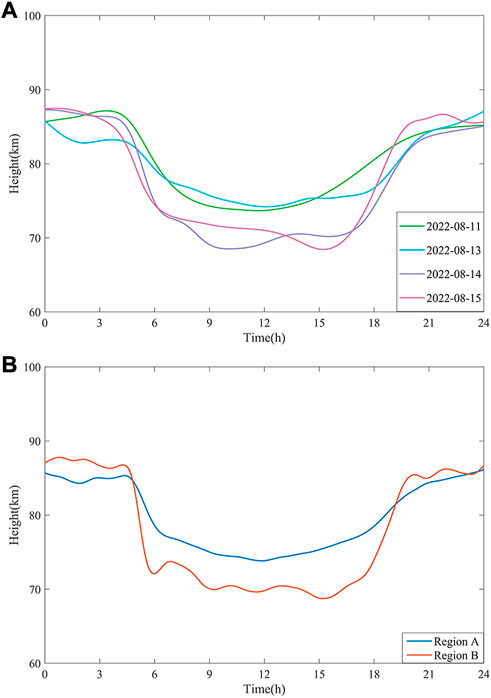
FIGURE 5. Ionosphere equivalent reflection height variations of continuous 24 h. (A) On different dates; (B) On different regions.
In Figure 5B, during the night time from 00:00 to 05:00, the
3.2 Distance estimation
In this section, we bring the revised arrival time difference between the ground wave and the first skywave (
Figure 6 shows the effect of the revised ground wave arrival time delay on the accuracy of distance estimation, it can be seen that when the lightning strike point is close to the station, the arrival time delay of the ground wave is small, the revised method brings greater errors. And as the propagation distance increases, the impact of the propagation effect becomes more pronounced, the time difference between the ground wave and the skywave in the actual received waveform is less than the ideal situation, resulting in the estimated distance is smaller than the actual propagation distance, thus bringing a greater deviation. As the propagation distance increases, the distance deviation of the revised method decreases rapidly, and reaches the lowest point at 600km, then rises, and remains relatively stable at 800 km–1200 km. When the propagation distance is greater than 1200 km, the distance deviation of the revised method has a small increase, and the distance estimation deviation has increased by 59 km. When the propagation distance is greater than 1600 km, the distance estimation deviation has decreased slightly, which is 46 km lower than the maximum average deviation. Overall, the distance deviation of the revised method remains within a relatively stable and credible range, and there is no failure as the propagation distance increases.
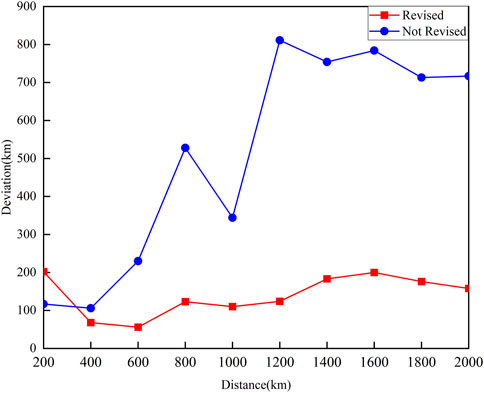
FIGURE 6. Comparison of the mean deviations of the revised and not revised methods at different distances.
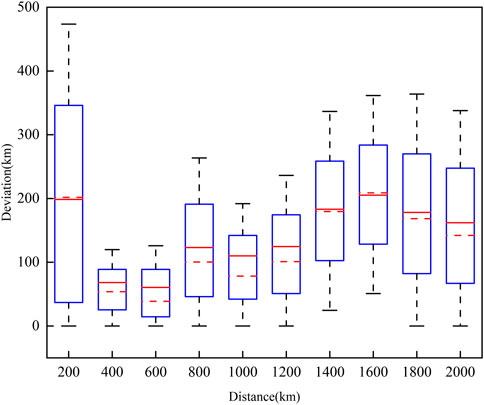
Figure 7 gives the changing trend of the deviation with distance from lightning to the station, where the red dashed line represents the median deviation and the red solid line represents the mean deviation. When lightning occurs within 400 km from the station, the deviation is large. This is because when the propagation distance is short, the arrival time delay of the ground wave is not obvious, and the revised arrival time difference between the ground wave and skywave is greater than the not revised, resulting in a larger deviation. With the increase of the propagation distance, affected by the propagation effect, the arrival time of the ground wave lags behind the arrival time of the lightspeed. In this way, the revised method mentioned in this paper can be used to compensate for the ground wave arrival time well, so that it is closer to the ideal situation. Therefore, in the range of 400 km–2000 km, compared with the multi-station lightning location dates, the mean deviation of the estimated distance obtained by the single-site is 7.9%–17.0%.
3.3 Site-error revision
Figure 8 shows the scatter plot of the site error distribution obtained from August 11 to August 15. The five graphs in the left column are the calculated results based on the ground wave peak in the signal received by the two orthogonal magnetic antennas, while five graphs on the right column are the results calculated based on the skywave peak. The azimuth is defined as the angle rotated by clockwise rotation starting from north, the due north direction of Nanjing Single station is 0°. It can be seen from the figure that the number of lightning that occurred in the direction of 120°–150° in these 5 days is very small, while other times the scatter shows almost the same distribution. At the same time, it can be seen from the distribution of scattered points that the site errors obtained by the skywave peak are more concentrated, which also means that if the results obtained by the skywave peak are used to revise the site errors, the effect will be better.
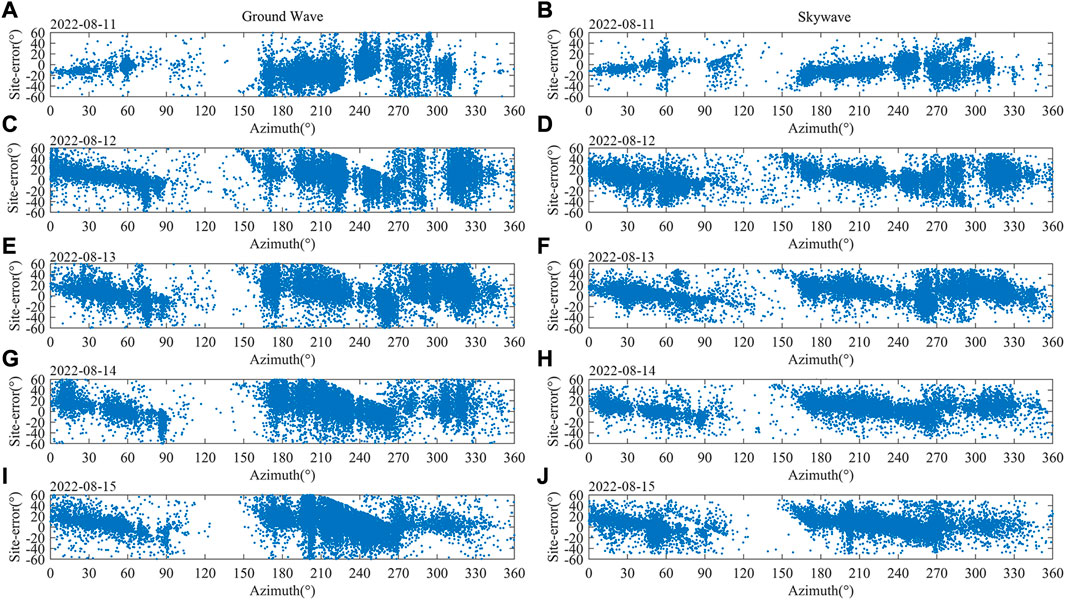
FIGURE 8. Scatter graph of site error distribution. (A) On August 11, based on the ground wave peak; (B) On August 11, based on the skywave peak; (C) On August 12, based on the ground wave peak; (D) On August 12, based on the skywave peak; (E) On August 13, based on the ground wave peak; (F) On August 13, based on the skywave peak; (G) On August 14, based on the ground wave peak; (H) On August 14, based on the skywave peak; (I) On August 15, based on the ground wave peak; (J) On August 15, based on the sky wave peak.
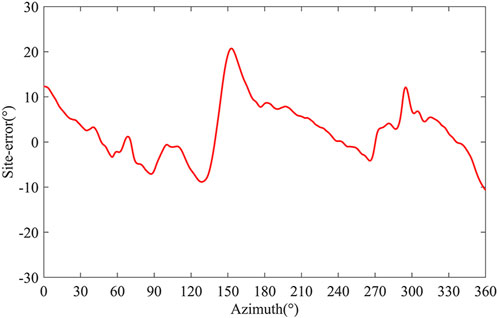
The fitting results of the scatter plot are given in Figure 9, which shows more intuitively that the site-error obtained from the skywave have a smaller fluctuation range and are closer to 0° compared to the results obtained from the ground wave. It can be seen from the figure that the trend of changes in the results obtained from different dates is close. Among them, there was a reverse result appears on August 10 compared with other dates. Which may be due to the fact that there are fewer data in this range, resulting in fewer scattered points affecting the fitting result, which is not statistically significant. It may also be due to changes in the surrounding background noise or interference from other equipment. Due to data limitations, it is impossible to determine whether this interference is periodic. After obtaining more data, it can be well explained whether this situation occurs by accident or is periodic, which also has practical significance for the siting of the station. In this article, in order to minimize its impact on the revised result, the five-day curve is further fitted to obtain the final revised curve shown in Figure 10. And this paper will use the site-error revision curve obtained by skywave to revise the azimuth calculated by the single-site.
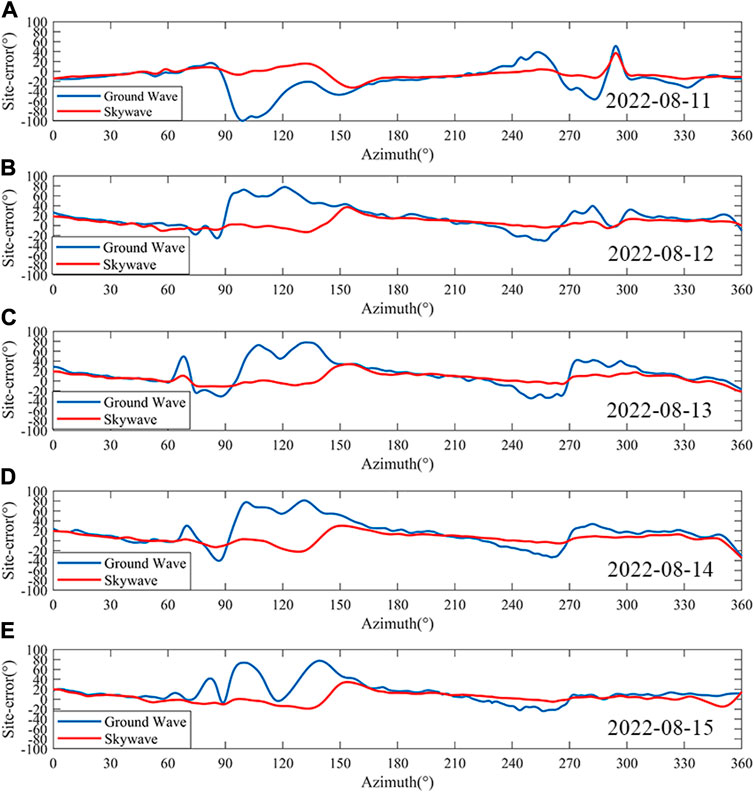
FIGURE 9. Fitting results for site error on different dates. (A) On August 11; (B) On August 12; (C) On August 13; (D) On August 14; (E) On August 15.
As can be seen from Figure 10, the peak of the positive deviation of the site-error appears near the three angles of 0°, 150°, and 300°, and the peak of the reverse deviation is reached near 130° and 270°, respectively. The largest site-error is 20°, which occurs when the azimuth is 152°. The change of site error shows a trend of slow decline and fast rise. The occurrence of larger site errors has a certain periodicity, which may be related to the background noise of the site. In the results given by Lu et al. (Lu et al., 2017), this phenomenon also occurs at some sites.
3.4 Single-site lightning location
In this section, we selected lightning activities at different distances from the single-site which occurred on 7 August 2022 (local time) to evaluate the accuracy of single-site lightning location. The location results of the single-site will be compared to the location results obtained by the multi-station lightning location network we built. The accuracy of multi-station location results has been compared with Arrival Time Difference Thunderstorm Detection system (ADTD) in the previous work. The average positioning error is 4.32 km, and the standard deviation is 2.46 km (Zhang et al., 2022). From Figure 11, we can see that the single-site lightning location results are more dispersed compared to the multi-station results. However, compared with the not revised location results, the revised location results are closer to multi-station results. It can be seen that as the distance increases, the multi-station lightning location results are more concentrated, while the single-station lightning location results are more dispersed, this is more likely due to errors in distance estimation.
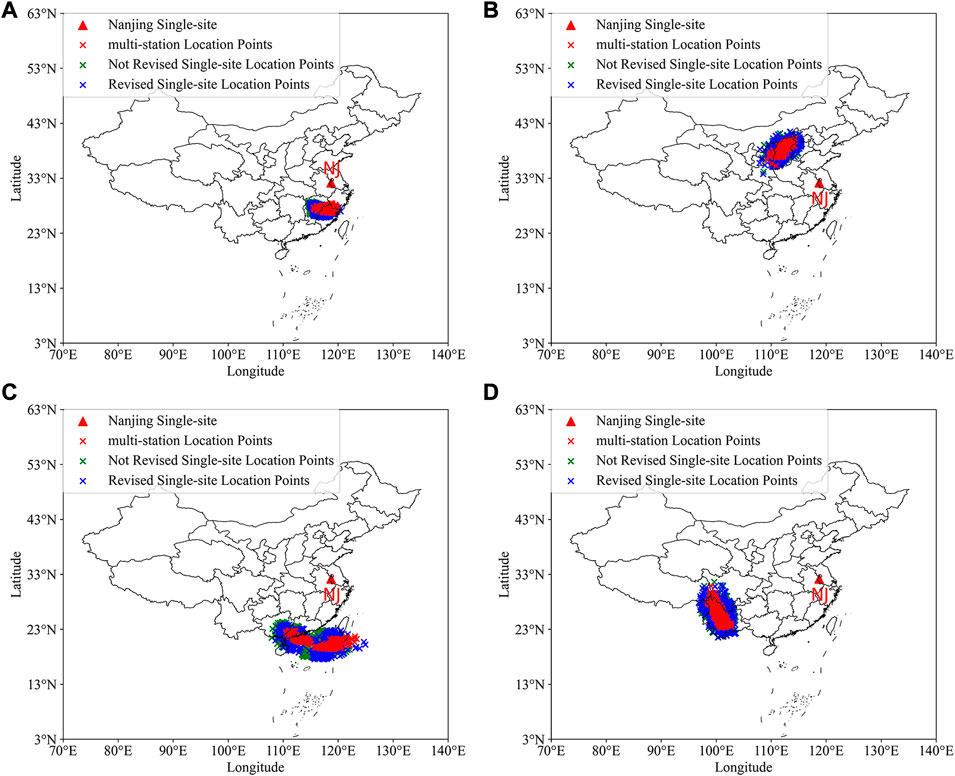
FIGURE 11. Lightning location results of single-site and multi-station. (A) In the range of 400–600 km; (B) In the range of 800–1000 km; (C) In the range of 1200–1400 km; (D) In the range of 1800–2000 km.
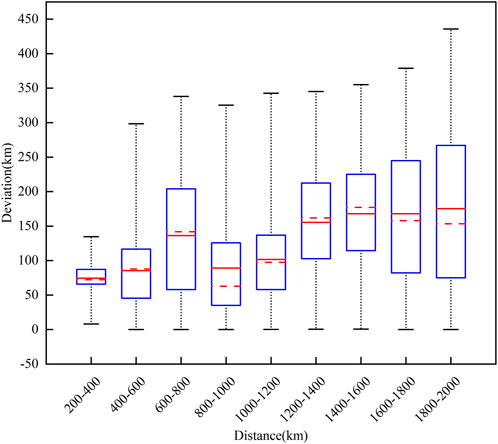
We give the location error of the single-site at different distances (multi-station results as a reference). Figure 12 shows the relationship between the trend of deviation and the distance from lightning to the single-site, where the red dashed line represents the median deviation and the red solid line represents the mean deviation. It can be seen that as the distance increases, the average error and the median deviation both increases. When the distance is in the range of 600–800 km, the deviation has a big change, and in subsequent longer distances, the deviation has decreased again. In the two farthest distance groups, the average deviation decreased, which shows that the single-site lightning location method proposed in this paper has practical application value in long-distance lightning location, and the results are still credible. In the effective detection range (200km–2000 km), the deviation range of this single-site lightning location is 8.4%–18.6%.
4 Discussion
In order to better illustrate the effectiveness of using multi-station lightning location results to revise site-error, Figure 13 shows the azimuth results obtained by the single-site using the not revised method and revised method (multi-station results are for reference). It can be clearly seen that the direction error revised by using the site-error revision curve is smaller and the distribution is more concentrated. Smaller direction error account for most of the total number. The number of smaller direction error after the revision has been greatly improved compared to when it was not revised. After revision, the average direction error has been reduced from 12.3° to 8.6°, and 80% of the direction error is within 11.5°, which has a significant effect on the accuracy of long-distance single-site lightning location.
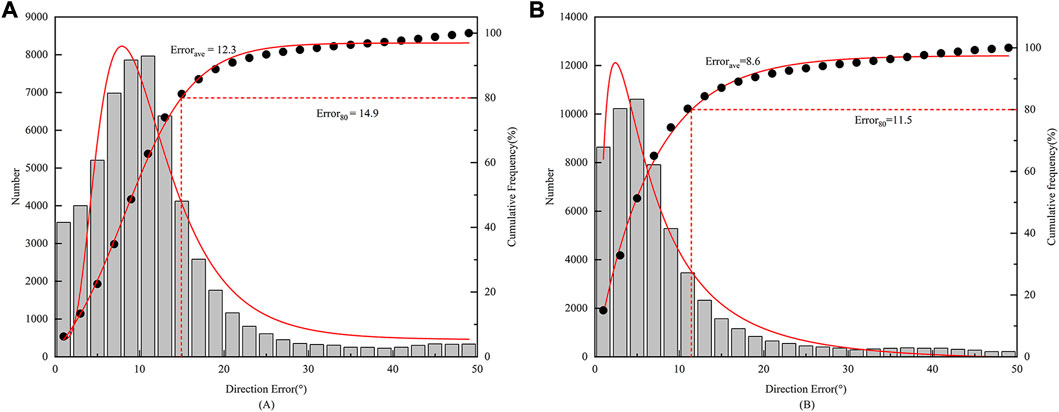
FIGURE 13. Compared with the multi-station results, the distribution of direction error of the single-site. (A) Not revised the site-error; (B) Revised the site-error.
After revising the ground wave arrival time delay and site-error, the error of single-station lightning positioning proposed in this paper is 8.4%–18.6%. The comparison between method in this study and other methods is shown in Table 2. The outstanding advantages of this paper have two parts. Firstly, the universality of the method, because it is easy to obtain the peak points of ground wave and skywave, so the method can be used to estimate lightning occurring at different distances from any station. The statistics of site-error are relatively simple, and a few days of data can be used to revise site-error, but more data revision will be better. Secondly, for lightning occurring far away from the station, the estimation error can still be controlled within a reasonable range.
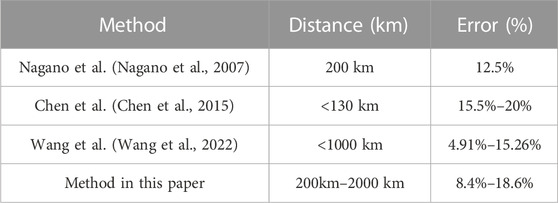
TABLE 2. Comparison between existing methods and methods in this way on single-site lightning location.
By analyzing the waveform data, it is found that the data with large deviation values are mainly due to the fact that the sferics is affected by noise during propagation. And thus, when matching with the waveform bank, the wrong ground wave peak point or skywave peak point will be identified within the specified time window, which will make the time between the ground wave and the skywave becomes smaller or bigger, resulting in the deviation between the estimated distance and the actual distance becomes larger. At the same time, the noise will affect the ratio of the peak points of the skywave in the sferics waveform received by the two orthogonal magnetic antennas, which also leads to the deviation of the direction calculation, making the single-site lightning location results deviate greatly compared to multi-station lightning location results.
5 Conclusion
In this paper, we propose two methods to improve the positioning accuracy of single station and the method can be used in engineering practice. Single-site lightning location does not depend on high precision timing system and internet, and the operating cost is low. The relationship curve between the ground wave arrival time delay and the propagation distance is obtained by numerical calculation method, which is used to revise the ground wave arrival time delay caused by the propagation effect. This is used to improve the accuracy of the distance estimation; the site error of a single station is revised by using multi-station lightning location data to improve the accuracy of direction calculation. The accuracy of the revised single-site lightning location data was evaluated using multi-station data. The main conclusions of this paper are as follows.
(1) Through the statistical analysis of the distance estimation deviation, it is determined that the applicable detection range of the single-site lightning location system mentioned in this paper is 200 km–2000 km. Moreover, when the ground wave arrival time delay has been revised, the accuracy of the distance estimation is much smaller than the not revised results.
(2) It is found that the azimuth deviation calculated using the peak value of the skywave is more concentrated. The revised average azimuth deviation decreased from 12.3° to 8.6° compared to the non-revised results.
(3) The results compared with the multi-station results, the error range of single-station lightning location is 8.4%–18.6%, and it also has a good detection performance for thunderstorms that occur at a long distance from the single-site. At the same time, with the increase of the detection distance, the detection accuracy can be maintained within a reasonable range.
It should be noted that if there are enough data, we can establish a waveform bank composed of actual sferics waveforms, which can effectively improve the accuracy of single-site lightning location. At the same time, these waveforms can also be used to study the relationship between the ground wave arrival time delay and the propagation distance under the real terrain, which can improve the accuracy of short-range lightning location, it can also further expand the range of lightning detection and improve the accuracy of lightning location.
Data availability statement
The original contributions presented in the study are included in the article/Supplementary material, further inquiries can be directed to the corresponding author.
Author contributions
Conceptualization, JiZ (JiZ) and QZ; Data curation, JiZ (JiZ), JuZ (JuZ), BD, and YW; Formal analysis, JiZ (JiZ), JL, and JG; Funding acquisition, QZ; investigation, JiZ (JiZ) and QZ; methodology, JiZ (JiZ) and JuZ (JuZ); software, JiZ (JiZ); JuZ (JuZ) and JL; supervision, QZ; visualization, JiZ (JiZ); writing—original draft, JiZ (JiZ); writing—review and editing, QZ. All authors have read and agreed to the published version of the manuscript.
Funding
This research was funded by the National Key R&D Program of China under Grant 2017YFC1501505, in part by the National Natural Science Foundation of China under Grant 41775006.
Acknowledgments
Thanks to the National Satellite Meteorological Center (NSMC) of the China Meteorological Administration for providing the FY4A-AGRI dataset. The author would like to thank all the people and departments involved in the construction of the network. The authors would also like to thank the reviewers for their helpful feedback, which significantly improved the manuscript.
Conflict of interest
The authors declare that the research was conducted in the absence of any commercial or financial relationships that could be construed as a potential conflict of interest.
Publisher’s note
All claims expressed in this article are solely those of the authors and do not necessarily represent those of their affiliated organizations, or those of the publisher, the editors and the reviewers. Any product that may be evaluated in this article, or claim that may be made by its manufacturer, is not guaranteed or endorsed by the publisher.
References
Ammar, A., and Ghalila, H. (2020). Estimation of nighttime ionospheric D-region parameters using tweek atmospherics observed for the first time in the north african region. Adv. Space Res. 66, 2528–2536. doi:10.1016/j.asr.2020.08.025
Antunes de Sa, A. L., and Marshall, R. A. (2020). Lightning distance estimation using LF lightning Radio signals via analytical and machine-learned models. IEEE Trans. Geosci. Remote Sens. 58, 5892–5907. doi:10.1109/TGRS.2020.2972153
Chen, M., Lu, T., and Du, Y. (2015). An improved wave impedance approach for locating close lightning stroke from single station observation and its validation. J. Atmos. Sol.-Terr. Phys. 122, 1–8. doi:10.1016/j.jastp.2014.11.001
Chen, M., Lu, T., and Du, Y. (2013). Properties of “site error” of lightning direction-finder (DF) and its modeling. Atmos. Res. 129–130, 97–109. doi:10.1016/j.atmosres.2012.09.003
Dai, B., Li, J., Zhou, J., Zeng, Y., Hou, W., Zhang, J., et al. (2022). Application of a modified empirical wavelet Transform method in VLF/LF lightning electric field signals. Remote Sens. 14, 1308. doi:10.3390/rs14061308
Dennis, A. S., and Pierce, E. T. (1964). The return stroke of the lightning flash to earth as a source of VLF atmospherics. J. Res. Natl. Bur. Stand. Sect. Radio Sci. 68D, 777. doi:10.6028/jres.068D.075
DiGangi, E., Lapierre, J., Stock, M., Hoekzema, M., and Cunha, B. (2022). Analyzing lightning characteristics in central and southern south America. Electr. Power Syst. Res. 213, 108704. doi:10.1016/j.epsr.2022.108704
Gu, J., Zhang, Q., Li, J., Zhang, J., Zhou, J., Dai, B., et al. (2022). Effect of number and configuration of participating stations on lightning location outside the network. Remote Sens. 14, 4242. doi:10.3390/rs14174242
Han, F., and Cummer, S. A. (2010). Midlatitude nighttime D region ionosphere variability on hourly to monthly time scales: D region measurement. J. Geophys. Res. Space Phys. 115. doi:10.1029/2010JA015437
Han, F., and Cummer, S. A. (2010). Midlatitude nighttime D region ionosphere variability on hourly to monthly time scales: D region measurement. J. Geophys. Res. Space Phys. 115. doi:10.1029/2010JA015437
Heidler, F., Cvetic, J. M., and Stanic, B. V. (1999). Calculation of lightning current parameters. IEEE Trans. Power Deliv. 14, 399–404. doi:10.1109/61.754080
Herrman, B., Uman, M., Brantley, R., and Krider, E. (1976). Test of the principle of operation of a wideband magnetic direction finder for lightning return strokes. J. Appl. Meteorol. 15, 402–405. doi:10.1175/1520-0450(1976)015
Hill, D. A., and Wait, J. R. (1980). Ground wave attenuation function for a spherical earth with arbitrary surface impedance. Radio Sci. 15, 637–643. doi:10.1029/RS015i003p00637
Honma, N., Suzuki, F., Miyake, Y., Ishii, M., and Hidayat, S. (1998). Propagation effect on field waveforms in relation to time-of-arrival technique in lightning location. J. Geophys. Res. Atmos. 103, 14141–14145. doi:10.1029/97JD02625
Hou, W., Zhang, Q., Zhang, J., Wang, L., and Shen, Y. (2018). A new approximate method for lightning-radiated ELF/VLF ground wave propagation over intermediate ranges. Int. J. Antennas Propag. 2018, 1–10. doi:10.1155/2018/9353294
Hu, W., and Cummer, S. A. (2006). An FDTD model for low and high altitude lightning-generated EM fields. IEEE Trans. Antennas Propag. 54, 1513–1522. doi:10.1109/TAP.2006.874336
Koshak, W. J., Solakiewicz, R. J., Blakeslee, R. J., Goodman, S. J., Christian, H. J., Hall, J. M., et al. (2004). North Alabama lightning mapping array (LMA): VHF source retrieval algorithm and error analyses. J. Atmos. Ocean. Technol. 21, 543–558. doi:10.1175/15200426
Li, J., Dai, B., Zhou, J., Zhang, J., Zhang, Q., Yang, J., et al. (2022). Preliminary application of long-range lightning location network with equivalent propagation velocity in China. Remote Sens. 14, 560. doi:10.3390/rs14030560
Liu, B., Shi, L., Qiu, S., Liu, H., Dong, W., Li, Y., et al. (2020). Fine three-dimensional VHF lightning mapping using waveform cross-correlation TOA method. Earth Space Sci. 7. doi:10.1029/2019EA000832
Lu, T., Chen, M., Du, Y., and Qiu, Z. (2017). A statistical approach for site error correction in lightning location networks with DF/TOA technique and its application results. Atmos. Res. 184, 103–111. doi:10.1016/j.atmosres.2016.10.009
Mach, D. M., MacGorman, D. R., David Rust, W., and Arnold, R. T. (1986). Site errors and detection efficiency in a magnetic direction-finder network for locating lightning strikes to ground. J. Atmos. Ocean. Technol. 3, 67–74. doi:10.1175/1520-0426(1986)003
Mostajabi, A., Karami, H., Azadifar, M., Ghasemi, A., Rubinstein, M., and Rachidi, F. (2019). Single-sensor source localization using electromagnetic time reversal and deep transfer learning: Application to lightning. Sci. Rep. 9, 17372. doi:10.1038/s41598-019-53934-4
Nag, A., Murphy, M. J., Schulz, W., and Cummins, K. L. (2014). “Lightning locating systems: Characteristics and validation techniques,” in Proceedings of the 2014 International Conference on Lightning Protection (ICLP), Shanghai, China, October 2014, 1070–1082.
Nagano, I., Yagitani, S., Ozaki, M., Nakamura, Y., and Miyamura, K. (2007). Estimation of lightning location from single station observations of sferics. Electron. Commun. Jpn. Part Commun. 90, 25–34. doi:10.1002/ecja.20329
Nucci, C. A. (1988). “On lightning return stroke models for LEMP calculations,” in Proceedings of the 19th International Conference on Lightning Protection, Graz, Austria, April 1988.
Pohjola, H., and Mäkelä, A. (2013). The comparison of GLD360 and EUCLID lightning location systems in europe. Atmos. Res. 123, 117–128. doi:10.1016/j.atmosres.2012.10.019
Rachidi, F., Janischewskyj, W., Hussein, A. M., Nucci, C. A., Guerrieri, S., Kordi, B., et al. (2001). Current and electromagnetic field associated with lightning-return strokes to tall towers. IEEE Trans. Electromagn. Compat. 43, 356–367. doi:10.1109/15.942607
Rakov, V. A. (2013). Electromagnetic methods of lightning detection. Surv. Geophys. 34, 731–753. doi:10.1007/s10712-013-9251-1
Ramachandran, V., Prakash, J. N., Deo, A., and Kumar, S. (2007). Lightning stroke distance estimation from single station observation and validation with WWLLN data. Ann. Geophys. 25, 1509–1517. doi:10.5194/angeo-25-1509-2007
Shao, X.-M., and Jacobson, A. R. (2009). Model simulation of very low-frequency and low-frequency lightning signal propagation over intermediate ranges. IEEE Trans. Electromagn. Compat. 51, 519–525. doi:10.1109/TEMC.2009.2022171
Shi, D., Zheng, D., Zhang, Y., Zhang, Y., Huang, Z., Lu, W., et al. (2017). Low-frequency E-field detection array (LFEDA)—construction and preliminary results. Sci. China Earth Sci. 60, 1896–1908. doi:10.1007/s11430-016-9093-9
Somu, V. B., Rakov, V. A., Haddad, M. A., and Cummer, S. A. (2015). A study of changes in apparent ionospheric reflection height within individual lightning flashes. J. Atmos. Sol.-Terr. Phys. 136, 66–79. doi:10.1016/j.jastp.2015.09.007
Wait, J. R. (1974). Recent analytical investigations of electromagnetic ground wave propagation over inhomogeneous earth models. Proc. IEEE 62, 1061–1072. doi:10.1109/PROC.1974.9570
Wang, J., Ma, Q., Zhou, X., Xiao, F., Yuan, S., Chang, S., et al. (2020). Asia-pacific lightning location network (APLLN) and preliminary performance assessment. Remote Sens. 12, 1537. doi:10.3390/rs12101537
Wang, J., Xiao, F., Yuan, S., Song, J., Ma, Q., and Zhou, X. (2022). A novel method for ground-based VLF/LF single-site lightning location. Measurement 196, 111208. doi:10.1016/j.measurement.2022.111208
Wang, Y., Min, Y., Liu, Y., and Zhao, G. (2021). A new approach of 3D lightning location based on pearson correlation combined with empirical mode decomposition. Remote Sens. 13, 3883. doi:10.3390/rs13193883
Wu, T., Wang, D., and Takagi, N. (2018). Lightning mapping with an array of fast antennas. Geophys. Res. Lett. 45, 3698–3705. doi:10.1002/2018GL077628
Zhang, G., Wang, Y., Qie, X., Zhang, T., Zhao, Y., Li, Y., et al. (2010). Using lightning locating system based on time-of-arrival technique to study three-dimensional lightning discharge processes. Sci. China Earth Sci. 53, 591–602. doi:10.1007/s11430-009-0116-x
Zhang, H., Lu, G., Qie, X., Jiang, R., Fan, Y., Tian, Y., et al. (2016). Locating narrow bipolar events with single-station measurement of low-frequency magnetic fields. J. Atmos. Sol.-Terr. Phys. 143–144, 88–101. doi:10.1016/j.jastp.2016.03.009
Zhang, J., Zhou, J., Li, J., Gu, J., Zhang, Q., Dai, B., et al. (2022). Location accuracy improvement of long-range lightning detection network in China by compensating ground wave propagation delay. Remote Sens. 14, 3397. doi:10.3390/rs14143397
Keywords: single-site sensor, lightning location, ground wave arrival time delay, site-error, location accuracy
Citation: Zhou J, Zhang Q, Zhang J, Dai B, Li J, Wang Y and Gu J (2023) Evaluation and revision of long-range single-site lightning location accuracy considering the time delay of ground wave. Front. Environ. Sci. 11:1131897. doi: 10.3389/fenvs.2023.1131897
Received: 26 December 2022; Accepted: 03 April 2023;
Published: 12 April 2023.
Edited by:
Huadan Zheng, Jinan University, ChinaReviewed by:
Kun Liu, Chengdu University of Information Technology, ChinaGaopeng Lu, University of Science and Technology of China, China
Copyright © 2023 Zhou, Zhang, Zhang, Dai, Li, Wang and Gu. This is an open-access article distributed under the terms of the Creative Commons Attribution License (CC BY). The use, distribution or reproduction in other forums is permitted, provided the original author(s) and the copyright owner(s) are credited and that the original publication in this journal is cited, in accordance with accepted academic practice. No use, distribution or reproduction is permitted which does not comply with these terms.
*Correspondence: Qilin Zhang, cWx6aGFuZ0BudWlzdC5lZHUuY24=
 Jiahao Zhou
 Qilin Zhang*