 Amanda de Liz Arcari
 Juliana Tavora
 Daphne van der Wal
 Mhd. Suhyb Salama
- 1Faculty of Geo-Information Science and Earth Observation, University of Twente, Enschede, Netherlands
- 2Department of Estuarine and Delta Systems, NIOZ Royal Netherlands Institute for Sea Research, Yerseke, Netherlands
One of the major sources of pollution affecting inland and coastal waters is related to poorly treated or untreated wastewater discharge, particularly in urbanized watersheds. The excess of nutrients, organic matter, and pathogens causes an overall deterioration of water quality and impairs valuable ecosystem services. The detection of wastewater pollution is essential for the sustainable management of inland and coastal waters, and remote sensing has the capability of monitoring wastewater contamination at extended spatial scales and repeated frequencies. This study employed satellite-derived water quality indicators and spatiotemporal analysis to assess the risk of wastewater contamination in Conceição Lagoon, a coastal lagoon in Southern Brazil. Using an analytical model, three water quality indicators were derived from Level 2A Sentinel-2 MSI images: the absorption coefficients of chlorophyll-a and detritus combined with coloured dissolved organic matter, and the backscattering coefficient of suspended solids. The temporal standardized anomalies were calculated for each water quality indicator for the period of 2019–2021, and their anomalies during a known outfall event were used to evaluate spatial variation modes. The spatial mode explaining most of the variability was used to estimate weights for the water quality indicators anomalies in a linear transformation that can indicate the risk of wastewater contamination. Results showed that the wastewater spatial mode for this region was characterized by positive anomalies of backscattering coefficient of particulate matter and absorption coefficient of detritus combined with coloured dissolved organic matter, each with a relative importance of 50%. The application of this spatiotemporal analysis was formulated as the Wastewater Contamination Index. With the aid of photographic records, and additional meteorological and water quality data, the results of the index were verified for wastewater outfall events in the study area. The methodology for constructing the proposed Wastewater Contamination Index applies to other locations and can be a valuable tool for operational monitoring of wastewater contamination.
1 Introduction
Aquatic systems provide a wide range of valuable ecosystem services, including drinking water, food provisioning, recreation, water purification, and climate regulation (Grizzetti et al., 2016). As a result, their surroundings are historically associated with human occupation (Di Baldassarre et al., 2010), and environmental degradation is often observed (Meyer, 2009; Yang et al., 2019). One of the major disturbances affecting water bodies in urbanized watersheds is related to poorly treated or untreated wastewater spills, especially in developing countries (Nyenje et al., 2010). This can be caused by irregular connections of sewage to the stormwater network, leaks and overflows from the sewerage system itself, bad performance of the wastewater treatment plant and its outfall pipe, or inadequate installation of septic tanks (Fono and Sedlak, 2005). The excess of organic matter and nutrients in wastewater entering the aquatic systems can cause an increase in the trophic state, algal blooms, and oxygen depletion. This results in an overall deterioration of water quality and ecological imbalance (El Mahrad et al., 2020). Pathogens associated with faecal contamination also pose health risks for humans and other living organisms (Cui et al., 2019). Wastewater spills can therefore negatively affect the chain of services and goods provided by water bodies and result in irreversible damage to the ecosystem. Furthermore, climate change has the potential to exacerbate wastewater contamination issues, as pollutant loads have been shown to be positively correlated with precipitation (Buerge et al., 2003), and extreme rainfall events are projected to increase in frequency and intensity in the coming decades (IPCC, 2018).
The dispersion of wastewater entering a water body is influenced by various environmental factors (e.g., hydrodynamics, stratification, wind, etc.) (Hoerger et al., 2014), and its identification is paramount for supporting management actions. Once a wastewater plume is detected, efforts can be efficiently invested in sealing the source, restoring affected areas, protecting vulnerable species, and preventing human intoxication by direct or indirect contact, i.e., bathing, swimming, ingestion of aquaculture products. Customarily, the monitoring of wastewater spills is conducted with in situ measurements of tracers, such as microbiological indicators (Hughes and Thompson, 2004) or chemical compounds (e.g., caffeine and pharmaceuticals) (Buerge et al., 2003; Benotti and Brownawell, 2007). Nevertheless, this approach lacks the combined spatial coverage, frequency, and agility that are required for effectively minimizing the impacts of contamination (Petrenko et al., 1997).
In this respect, remote sensing emerges as a necessary complement that provides near-real-time monitoring at extended spatial scales, especially in the case of recently developed sensors (Trinh et al., 2017; El Mahrad et al., 2020). Satellite observations are moving towards operational monitoring of key spectral and biophysical features (Groom et al., 2019) that can be associated with wastewater plumes. Reduced surface roughness caused by the presence of oil or surfactants can be detected by active microwave sensors (radar), temperature gradients are captured by thermal sensors, while water colour differences, caused by phytoplankton, organic matter, and suspended material, can be tracked with optical sensors (Trinh et al., 2017). Petrenko et al. (1997), who pioneered the optical characterization of wastewater plumes, showed with in situ measurements that scattering and attenuation coefficients were distinctively higher in wastewater plumes in comparison to background waters. Later on, Marmorino et al. (2010) analysed airborne hyperspectral and infrared imagery to detect sewage discharge on the south coast of Florida, United States, where high levels of coloured dissolved organic matter (CDOM) and lower sea surface temperature were found to be associated with the wastewater plume. In Southern California, United States, Gierach et al. (2017) related wastewater plumes to lower temperatures and reduced radar backscattering. For another outfall diversion event at the same location, Trinh et al. (2017) could associate wastewater with lower temperature and increased chlorophyll-a concentration as derived from Landsat 8 imagery. The only consistent indicator seen in these cases is the lower temperature, which is explained by wastewater being discharged via submerged outfall pipes and resurfacing of deep and colder waters. The optical signals associated with wastewater are highly complex and covary according to the scale and form of the discharge, meteorological conditions, interaction with other local phenomena, e.g., seasonal phytoplankton blooms, and the local optical properties of waters (Gancheva et al., 2020). Emphasizing the need of considering multiple features simultaneously to take into account this complexity, Harringmeyer et al. (2021) showed that the level of chlorophyll-a in similar CDOM-rich waters was distinct for wastewater-contaminated and other land-influenced waters at the same location. Therefore, an optimal combination of different features into one single indicator could constitute a promising approach for the operational monitoring of wastewater plumes. To our knowledge, this has not been explored yet.
This study proposes a methodology for constructing such an ensemble indicator to assess the risk of wastewater contamination in aquatic systems from optical remote sensing. The focus is on the use of satellite-derived water quality indicators, temporal standardization, and spatial variation mode analysis to generate the Wastewater Contamination Index (WCI). The index is intended to spot anomalous water quality indicators across time and capture the spatial differences between wastewater plumes and ambient waters. Here we use Sentinel-2 MSI imagery and an analytical model to retrieve the water quality indicators, although these could be derived from any preferred satellite sensor and hydro-optical model. The applicability of the method is investigated in Conceição Lagoon, a coastal water body in Southern Brazil that suffers from frequent wastewater spills.
2 Materials and methods
2.1 Study area
Conceição Lagoon is a subtropical coastal lagoon located on Santa Catarina Island, southern Brazil (Figure 1). The water body is a popular natural attraction in the region, widely used by the local and tourist populations for multiple purposes: fishing, transportation, recreation, and sports (Martini et al., 2006). The lagoon has a surface area of about 20 km2 and a heterogeneous bathymetry, with extensive sandbanks of less than 1 m water depth contrasting with muddy sediment regions of up to 8.7 m water depth (Dias et al., 2014). According to the morphological features and water properties, the lagoon is traditionally divided into three subsystems: North Lagoon, Central Lagoon and South Lagoon (Martini et al., 2006; Lisboa et al., 2008; Lüchmann et al., 2008; Fontes et al., 2010). Its only connection to the Atlantic Ocean (a 2.8 km narrow channel in the Central Lagoon) dissipates approximately 84% of the tide effects, especially the short frequency astronomic component (99% attenuation) (Godoy et al., 2008). The lagoon’s exchange with the ocean is thus limited, with hydrodynamics studies suggesting water residence times from 150 to 270 days (Silva, 2021). As such, water motion is controlled primarily by wind and hydrological conditions in the contributing watershed (i.e., precipitation, evaporation, runoff) (Silva et al., 2017). The urbanized area in the watershed increased from 13% to 23% between 1990 and 2019 (Odreski et al., 2021). The sanitation infrastructure, nonetheless, was not developed at the same rate. It serves only 57% of the population and there are frequent issues with pumping stations’ overflows and irregular sewer connections (Odreski et al., 2021). Both the deficient sewage system and non-sewered areas contribute to the sustained organic matter and nutrient loading into the lagoon (Cabral et al., 2019). This has led to the chronic eutrophication of Conceição Lagoon, with recurrent algal blooms and hypoxia/anoxia conditions (de Barros et al., 2017; Silva et al., 2017; Cabral et al., 2019). The rupture of the disposal pond of a Wastewater Treatment Plant (WWTP) in late January 2021, discharging 79,000 m3 of wastewater into Conceição Lagoon (CASAN, 2021), caused severe consequences to the lagoon’s ecosystem and evidenced the urgency of monitoring wastewater spills in the area. Due to its magnitude and the presence of a visible plume in the following days, this event serves as a suitable training sample to investigate signals that could be used to identify wastewater from space.
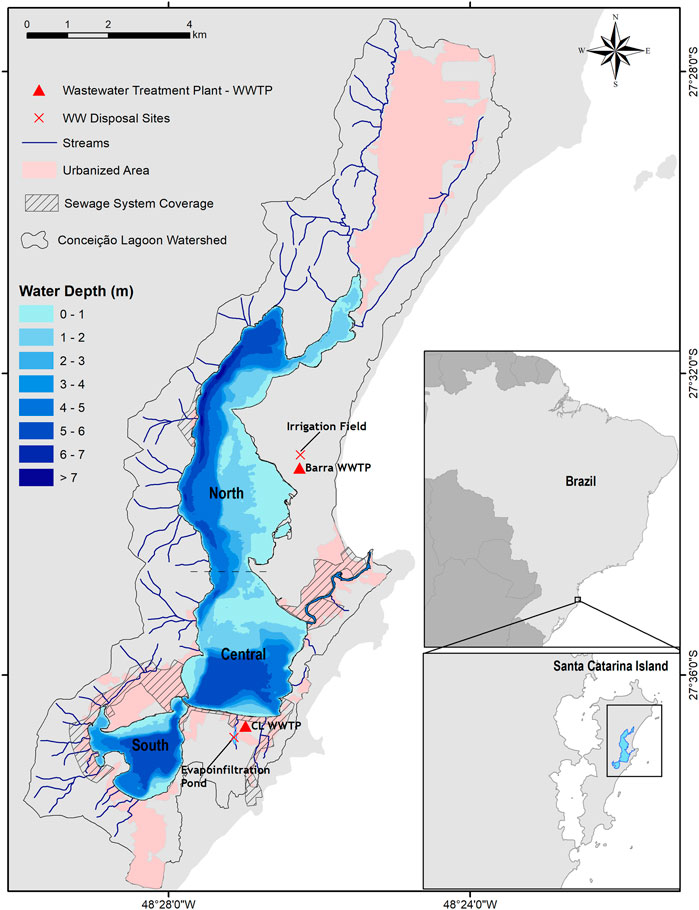
FIGURE 1. Map of Conceição Lagoon, showing its location, the sub-systems, bathymetry and the contributing watershed. The urbanized area in the watershed is highlighted and the sewage infrastructure is identified.
2.2 Datasets
2.2.1 Sentinel-2 MSI images
Sentinel-2 MultiSpectral Instrument (MSI) imagery from the European Space Agency (ESA) was used due to its high spatial and temporal resolution and radiometric quality, yielding recognized suitability for aquatic studies (Caballero et al., 2020). The combination of two polar-orbiting satellites carrying the MSI (Sentinel-2 A and Sentinel 2-B) provides multi-spectral images in the study area every 2–3 days with a spatial resolution of 10 m in the visible and near-infrared bands. Level-2A Products, atmospherically corrected with sen2cor processor, were downloaded from the Copernicus Open Access Hub1. This product is only available for images from December 2018, therefore the period of analysis was defined as January 2019 to December 2021. In total, 138 images acquired for the tile that covers the study area (tile index: T22JGQ) were selected to compose the Sentinel-2 time series, taking into consideration cloud cover in the lagoon. Every year the total number of images was consistent in the order of 42 to 49. Each month was represented by at least one image, except for October 2021, when no cloud-free image was acquired (see Supplementary Figure 1). The scene classification map, part of the Level-2A product, was used to mask clouds and cloud shadows.
2.2.2 Auxiliary data
Meteorological data were used to support analysis and investigate their influence on wastewater spills and plume dispersion. Data was acquired from a weather station from the Brazilian Institute of Meteorology (INMET)2, located approximately 15 km from Conceição Lagoon (Station Code: A806). Hourly measurements of precipitation, wind direction and wind speed were downloaded for the period between January 2019 and December 2021.
To assess the contamination risk, we used in situ measurements of Escherichia coli (E. coli), a faecal indicator bacteria. These are systematically collected and made available by the Environmental Institute of Santa Catarina (IMA/SC) as part of their bathing water monitoring programme3. They have 9 monitoring points in Conceição Lagoon (Figure 2), which are sampled weekly in the high season (November-March) and monthly in the low season (April-October). For the 2019–2021 period there were 80 measurements available per point.
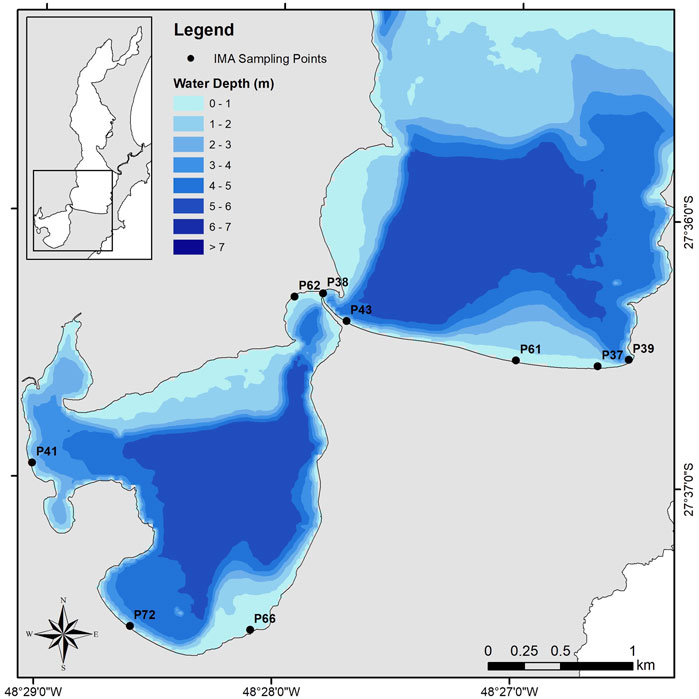
FIGURE 2. Location of the sampling points for E. coli measurements conducted by the Environmental Institute of Santa Catarina (IMA/SC) as part of their bathing water monitoring programme.
Other water quality measurements and technical reports from researchers at the Federal University of Santa Catarina (UFSC) were considered to characterize wastewater outfall incidents and the status of the lagoon. In addition, photographic records of anomalous conditions observed in Conceição Lagoon were used to further evaluate the results. These were gathered online from news media and are referred to when used.
2.3 Retrieval of water quality indicators
The 2SeaColor4 (Salama and Verhoef, 2015) is an analytical model that retrieves Inherent Optical Properties (IOPs) from remote sensing reflectance (
In this study, we adapted 2SeaColor to be applicable to the Sentinel-2 MSI images for deriving three WQIs: i).
The 2SeaColor has been shown to perform well in both freshwater (Salama and Verhoef, 2015) and coastal turbid waters (Arabi et al., 2016; Yu et al., 2016; Arabi et al., 2018). Since the proposed method for formulating the WCI relies on the WQIs anomalies and their spatial and temporal variability (see section 2.4), validation of IOP retrievals specifically for the study area was not considered a requisite. Areas with water depths shallower than 1.5 m, based on the bathymetric map provided by Horn et al. (2022), were masked to avoid the bottom reflectance effect on the retrievals. The resulting time series of WQIs’ images was arranged as a raster cube, with the third dimension representing time.
2.4 Formulation of the wastewater contamination index—WCI
The steps taken for the formulation of the WCI from the WQIs raster cube are summarized in Figure 3 and the processes are detailed in the sub-sections below.
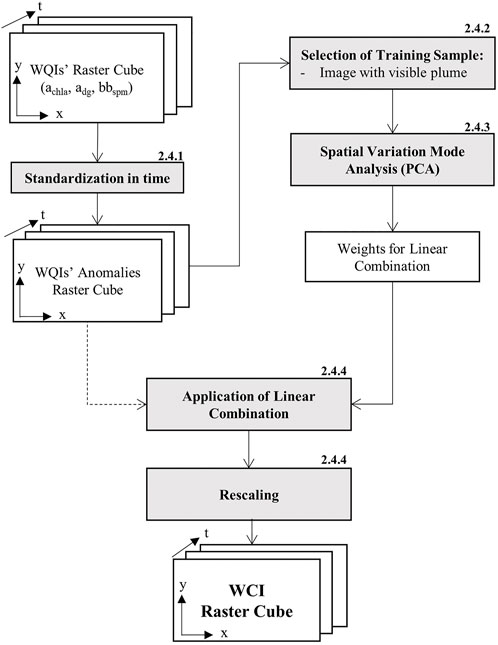
FIGURE 3. Flowchart of the formulation of the Wastewater Contamination Index (WCI). x, y, and t are the three-dimensional components of the raster cube, where x and y represent the coordinates of pixels and t the time step of the image. Numbers denote the section in which the process is described.
2.4.1 Standardization of WQIs in time
Standardization with respect to time removes the effects of site-specific characteristics and enables the comparison between different locations based on the distance of values to the average conditions (Dabernig et al., 2017). Large values of standardized anomalies (positive or negative) indicate unusual conditions for each specific location.
Therefore, the first step in the formulation of the Wastewater Contamination Index (WCI) was to standardize each WQI image in time and obtain their anomalies according to the following equation (pixel-by-pixel):
Where
This process generates a time series of the standardized anomalies images for each WQI, arranged as a raster cube. The images in the raster cube show, in a comparable range, the spatial distribution of how the individual WQIs at a specific time-step are deviating from the time series average. The presence of seasonality in the generated WQIs anomalies raster cube was also evaluated by investigating the mean monthly WQI anomaly per subsystem of the lagoon and the local climatology.
2.4.2 Selection of training sample
The image acquired on 08-02-2021 was selected as a training sample to investigate signals of the WQIs anomalies associated with wastewater contamination in Conceição Lagoon. Wastewater is defined here as untreated or partially treated domestic sewage originating from incidental ruptures or leaks. This specific image captured the spatial dynamics of a wastewater plume (hereby named reference plume) coming from the area where the Conceição Lagoon WWTP disposal pond ruptured on 25-01-2021. Assumably due to the large proportion of the outfall (79,000 m3) and favourable hydrodynamic conditions (southerly winds), a plume was still identifiable from the natural-colour image acquired 14 days after the rupture (Figure 4). Note that no rainfall was recorded on the three preceding days, so it was not a runoff-related plume. An assumption is made that the signals associated with the plume of this specific event would be representative of other wastewater plumes in the area.
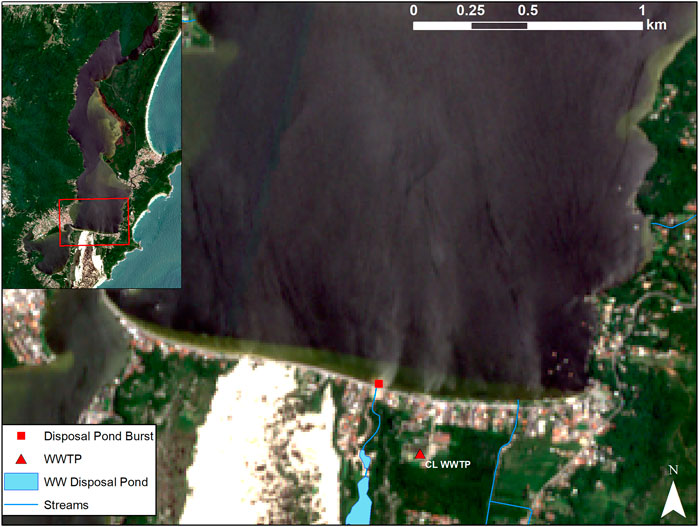
FIGURE 4. Natural colour composite of the image used as a training sample (08-02-2021), in which the reference wastewater plume coming from the area of the disposal pond burst is visible.
2.4.3 Spatial variation mode analysis
The WQIs anomalies of the training sample were extracted and used as input for a Principal Component Analysis (PCA). This technique allows for reducing the dimensionality of the data and finding a linear combination of WQIs anomalies that best captures the differences between the wastewater plume and the background waters.
PCA is widely used for data compression, and its applicability in remote sensing to derive indices that synthesize the effects of multiple indicators has been demonstrated (Ingebritsen and Lyon, 1985; Hu and Xu, 2019; Guo et al., 2020; Yu et al., 2021). According to Hu and Xu (2019), the formulation of indices based on the first principal component is an unbiased method that can objectively provide weights to variables in such a way that a linear combination best explains the data variation. Furthermore, Ayad et al. (2020) have shown that PCA of reflectance spectra enabled the distinction of stormwater, wastewater, and clean water on the Southern California coast.
The classic approach of PCA is based on the mathematical technique of Eigen-decomposition of the covariance matrix. Eigenanalysis suggests that any symmetric matrix, such as the covariance of a centred matrix (
Where
Each column of
For this case, we have the training sample with the three WQIs anomalies as variables, which can be represented by the following array:
Where
PCA is applied to
Where
To evaluate if the training sample had distinct spatial dynamics when compared to images of other days, we applied the same process to the other 137 images and compared their first eigenvectors. The comparison was done based on the Spectral Angle Mapper (SAM) technique (Kruse et al., 1993), which calculates the angle difference between a test and a reference vector of n-dimensions. The larger the angle between the reference and other image’s eigenvectors, the less similar they are.
2.4.4 Application of the weights and rescaling
The weights found in the previous step are applied to all the images of WQIs anomalies, generating a new raster cube of LC images. From the empirical distribution function of the raster cube, we defined the minimum (
The result is a raster cube in which the pixel values of images vary mostly between zero and one.
2.4.5 Risk classes definition
To classify the WCI values according to the risk of wastewater contamination, we used the E. coli measurements in Conceição Lagoon and compared their Cumulative Distribution Function (CDF). The data used to construct the E. coli empirical CDF comprises 720 measurements taken between 2019 and 2021, 80 for each of the nine sampling points (sites) in the lagoon. The WCI empirical CDF was generated by extracting the mean WCI value in a buffer of 100 m from the E. coli sampling points for the whole time-series. There were between 123 and 132 values per point (varying due to cloud cover), totalizing 908. Points P61 and P66 did not have values extracted because the buffer area coincided with the shallow-water mask.
Since WCI and E. coli are assumed to represent wastewater contamination, their CDFs were compared. The E. coli is taken as a reference independent variable that directly indicates wastewater contamination. The bacteria are abundant in human and animal faeces, having only been found in natural waters that have received recent faecal contamination. According to Brazilian legislation5, waters are considered of excellent quality if they have E. coli levels up to 200 MPN6/100 mL in 80% of samples collected at the same place over 5 weeks, indicating low risk of contamination. When E. coli is higher than 800 MPN/100 mL in more than 20% of samples collected over 5 weeks, water is considered unsuitable for primary contact due to the high risk of contamination. Based on this, we defined the following E. coli thresholds to characterize the risk of wastewater contamination:
• Low: <200 MPN/100 mL
• Medium: 200 to 800 MPN/100 mL
• High: >800 MPN/100 mL
The CDF percentile matching these E. coli thresholds can then be extracted and transferred to the WCI CDF. This allows finding the WCI values that corresponds to the low, medium and high risk of contamination classes.
2.5 Detection of wastewater spills in Conceição Lagoon
To evaluate the WCI capabilities in detecting wastewater plumes in Conceição Lagoon, the signals produced on images associated with known outfalls that occurred in the area between 2019 and 2021 were investigated. Although at least six incidents have been reported in that period, most of them did not coincide with satellite overpass or there was cloud cover preventing analysis. For this study, two reported wastewater outfall events were analysed by inspection of the WCI maps at the locations of the expected plume. Environmental conditions (i.e., wind, precipitation, water quality measurements) and photographic records were also considered in the analysis.
2.5.1 WWTP disposal pond rupture—25-01-2021
The disposal pond of the Conceição Lagoon Wastewater Treatment Plant (CL WWTP) burst on 25-01-2021 after intense rainfall, releasing approximately 79,000 m3 of the effluent-sediment mixture directly into Conceição Lagoon7. The pond is where the sewage is disposed of after treatment, but monitoring showed that on several occasions the efficiency of the WWTP was below what is required by law, presenting high biological oxygen demand (BOD), nitrogen and phosphorus levels (ARESC, 2021). It is estimated that the event released to the lagoon 1.44 tons of BOD, 2.04 tons of ammoniacal nitrogen, 0.43 tons of nitrate and 0.36 tons of total phosphorus (Odreski et al., 2021). Following the date of the event, three (partially) cloud-free images were available, for which the WCI maps were investigated: 03-02-2021, 05-02-2021, and 08-02-2021.
2.5.2 Leak from sewage pipe—19-05-2020
On 19-05-2020, a leak from a sewage pipe was identified in Centrinho da Lagoa, the neighbourhood’s urban centre, next to the South Lagoon. Inspection by the city’s Environmental Agency (FLORAM) verified that, due to a broken sewage pipe, raw waste was being discharged into the stormwater system and directly into the lagoon8. It was expected to be leaking for a few weeks already, as laboratory analysis from 27-04-2020 showed high nutrient levels, low dissolved oxygen and the presence of faecal indicators (UFSC, 2020). In addition, reported large patches of scum (decaying biofilm of bacteria, diatoms, cyanobacteria and dinoflagellates) and fish die-offs between the 14th and 20th of May (UFSC, 2020) evidenced the effect of the contamination that was taking place. To evaluate the capability of the WCI to capture this event we used the maps of 11-05-2020 and 16-05-2020.
3 Results
3.1 Formulation of the wastewater contamination index—WCI
In Figure 5 we have the mean monthly WQI anomalies for the three subsystems of the lagoon (North, Central, and South), in addition to the local temperature and precipitation climatology. It is not possible to observe a clear seasonality pattern, although there are indications that high positive anomalies of all WQIs coincide with an increase in precipitation at the beginning of (austral) Spring in September. Still, since in this study we are analysing events with scenes from February and May, potential effects of seasonality would not cause interference on the interpretation.
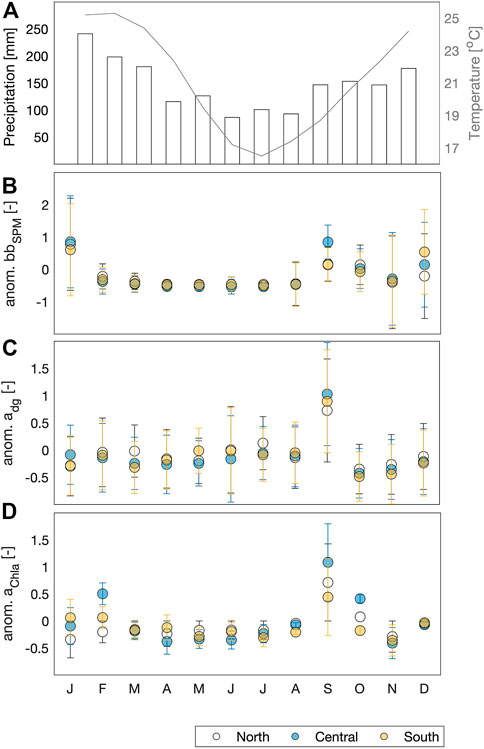
FIGURE 5. Monthly means of (A) climatological temperature and precipitation in the study area, (B) anomalies of suspended particulate matter backscattering coefficient in the studied period, (C) anomalies of combined detritus and coloured dissolved organic matter absorption coefficient in the studied period, and (D) anomalies of chlorophyll-a absorption coefficient in the studied period. Error bars represent the standard deviation. Temperature and precipitation climatologies were obtained from the Brazilian Institute of Meteorology (INMET) and refer to the period of 1992–2020.
Figure 6 shows the WQIs anomalies of the training sample, which was used as input to the spatial variation mode analysis. It is possible to observe that

FIGURE 6. Maps of WQIs temporal anomalies for the training sample (08-02-2021).
The comparison between the first eigenvectors of the reference (training sample) and the other 137 images showed angle differences ranging from 17˚ to 178˚, with a mean of 54˚. This indicates that the reference eigenvector provides a distinct rotation when compared to the other eigenvectors, and confirms the atypical conditions seen in the training sample.
The reference
Figure 7 shows the empirical cumulative distribution function (ECDF) of the LC raster cube, from which the minimum (1% probability) and maximum (99% probability) values for rescaling were defined as −1.35 and 2.28 respectively.
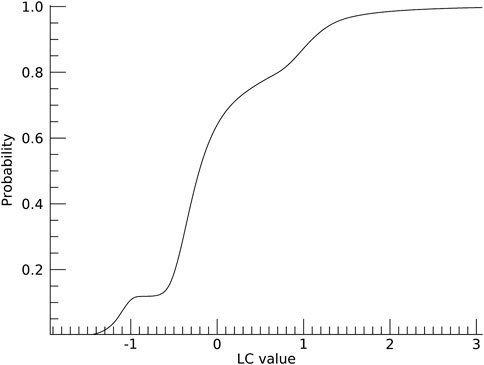
FIGURE 7. Empirical Cumulative Distribution Function (ECDF) of the Linear Combination (LC) raster cube, from which the minimum (prob = 1%) and maximum (prob = 99%) values were extracted for rescaling LC into WCI.
In Figure 8 we have the comparison between the empirical CDFs of the E. coli measurements and the WCI values. The E. coli CDF shows that 58% of the measurements fall within the threshold of low risk of contamination (<200 MPN/100 mL) and 80% within the medium risk upper threshold. Transferring these percentiles to the WCI CDF, the thresholds for the risk of contamination are defined as follows:
• Low: WCI < 0.41
• Medium: 0.41 < WCI < 0.56
• High: WCI > 0.56
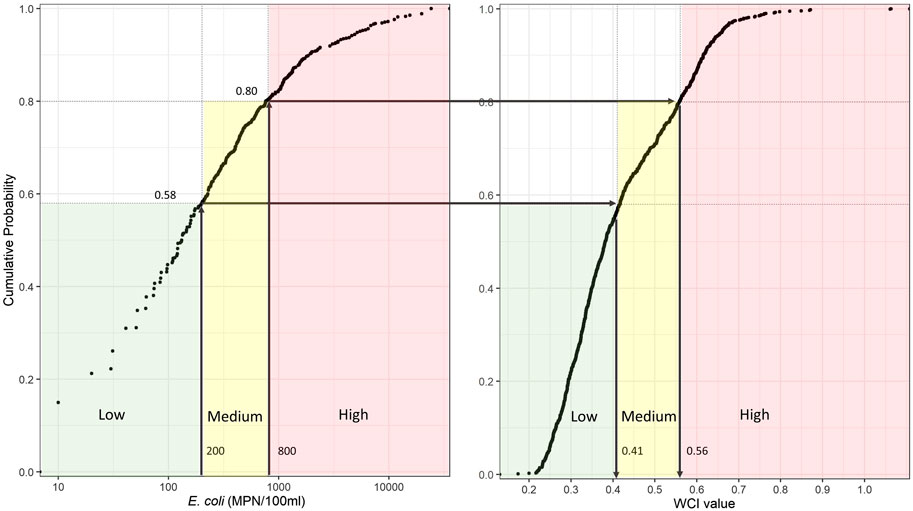
FIGURE 8. Comparison between the Empirical Cumulative Distribution Functions (ECDFs) of the E. coli measurements and the WCI values for the corresponding sampling points. The arrows represent the procedure of transferring the percentiles from the E. coli thresholds to define the risk of contamination classes based on the WCI values.
As an indirect verification, we checked the distribution of the risk classes based on the WCI and E. coli measurements for each of the sampling sites during the studied period (Figure 9). For most of the sites, the WCI was able to capture very similar distribution features as the indicated by E. coli measurements. Exceptions are seen for points 38 and 62, where especially the high-risk class frequency was underestimated by the WCI. For point 43 the WCI overestimates the medium and high risk classes, and underestimates the low risk. It should be noted that these three points are located at the transition between the South and Central subsystems of the lagoon (see Figure 2), which per se has complex dynamics. In addition, the morphology of this region makes it highly susceptible to adjacency effects.
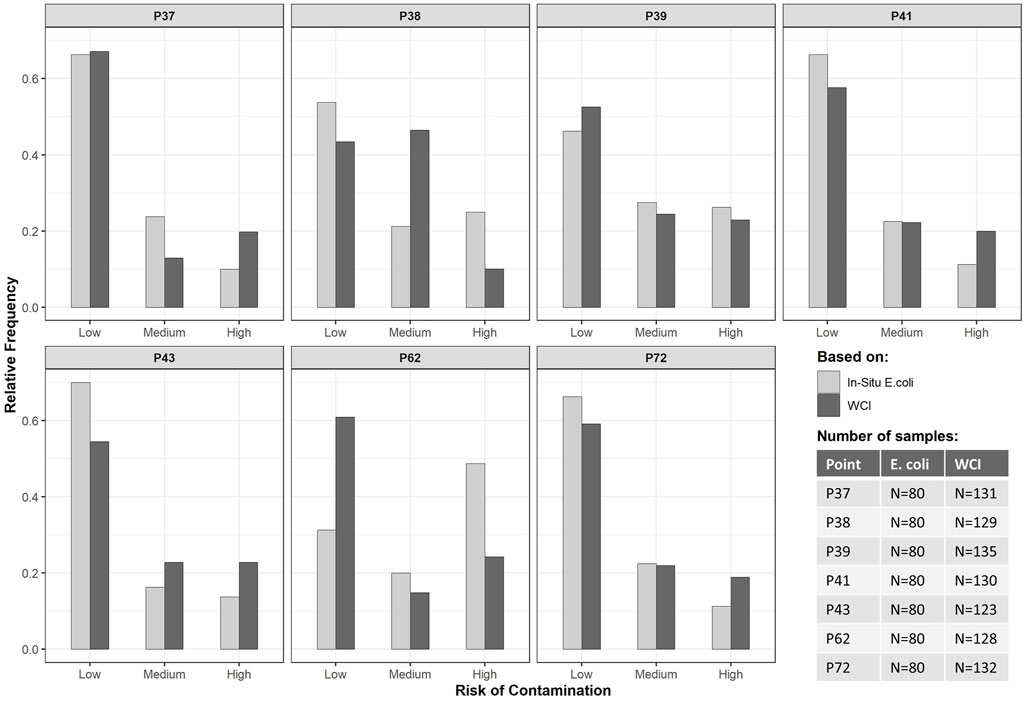
FIGURE 9. Distribution of the risk of contamination classes (Low, Medium, and High) for each of the in situ sampling points based on the E. coli measurements and extracted from the WCI maps.
3.2 Analysis of wastewater spill events
3.2.1 WWTP disposal pond rupture—25-01-2021
In the WCI map of 03-02-2021 (Figure 10A) (8 days after the rupture) we observe a very high risk of contamination towards the East of the area where the contents of the disposal pond waste entered the lagoon. This suggests the transport of the wastewater plume into that area, which shows high positive anomalies for
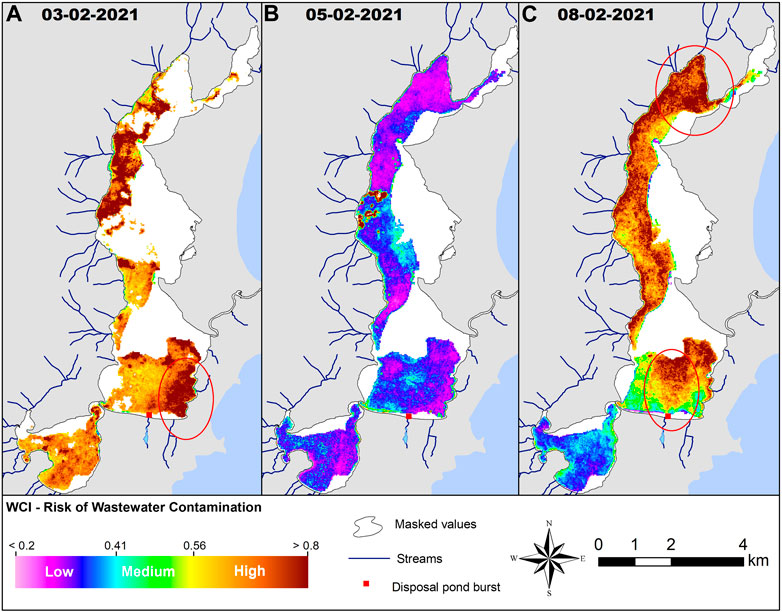
FIGURE 10. WCI maps following the event of the WWTP Disposal Pond Rupture, representing the risk of wastewater contamination (A) 8 days,(B) 10 days, and (C) 13 days after the incident.
The WCI map of 05-02-2021 (Figure 10B) shows a medium-low risk (0.25–0.45) of wastewater contamination throughout the lagoon. The very high-risk spots seen in the North Lagoon result from clouds that had not been entirely masked in Sentinel-2’s scene classification map. Because there are no relevant spatial patterns, this indicates that, at this point, the lagoon’s water has been well-mixed. Between the dates of the last WCI map and this one, the predominant wind was North (N) and North-East (NE), with a relatively high frequency (5%) of stronger winds (3.5–5.5 ms−1) from the NE, which could have caused good mixing and dilution conditions.
In the WCI map of 08-02-2021, we see a plume coming directly from the area where the disposal pond burst, with a high risk of wastewater contamination (Figure 10C). This suggests that the burst area was a source of contamination up to 2 weeks after the outfall event. This could be explained by the large amount of contaminated sediment carried during the accident and accumulated around the margins of the lagoon, forming a delta9, and by the favourable dispersion conditions. From the date of the previous WCI map until this one, the predominant wind direction was South-East (SE) (>50% frequency), most of the time with speeds higher than 3.5 ms−1. This wind direction facilitates the resuspension and transport of the accumulated sediment towards the North of the lagoon, as was captured by the WCI map. A very high risk of contamination is seen in the extreme North of the lagoon, which is in agreement with reported events of massive fish die-offs, oxygen depletion and toxic algae bloom in the region in the following weeks (starting on 22-02-2021) (UFSC, 2021). It was speculated whether this was an effect of the disposal pond burst, another pollution spill in the North sector itself caused by the opening of drainage ditches around the irrigation field of Barra WWTP (see location on Figure 1) on 16-02-2021, or a combination of factors that produced synergistic effects. No conclusion was reached, but considering that there were signs of contamination already on 08-02-2021, and between then and the 22-02-2021 the predominant wind was still from the SE, our results support the hypothesis that the events were probably related.
3.2.2 Leak from sewage pipe—19-05-2020
In both the WCI maps of 11-05-2020 and 16-05-2020 (Figure 11), which correspond to 8 and 3 days before the discovery of the leak, we see a low risk of wastewater contamination in most of the lagoon. The presence of shallow waters in the margins prevents evaluation of the conditions closer to the leak area, but we observe a path with a medium risk of contamination (>0.41) originating from the leak and spreading to the East margin of the South Lagoon on 11-05-2020. On 16-05-2020 the higher risk area spread towards the rest of the South Lagoon, reaching the West branch. Even though the risk is higher and can be distinguished from the background, the values still represent a medium risk of contamination. This is due to the conditions seen in the WQIs anomalies of the corresponding dates (Supplementary Material), in which the plume is characterized by positive anomalies for
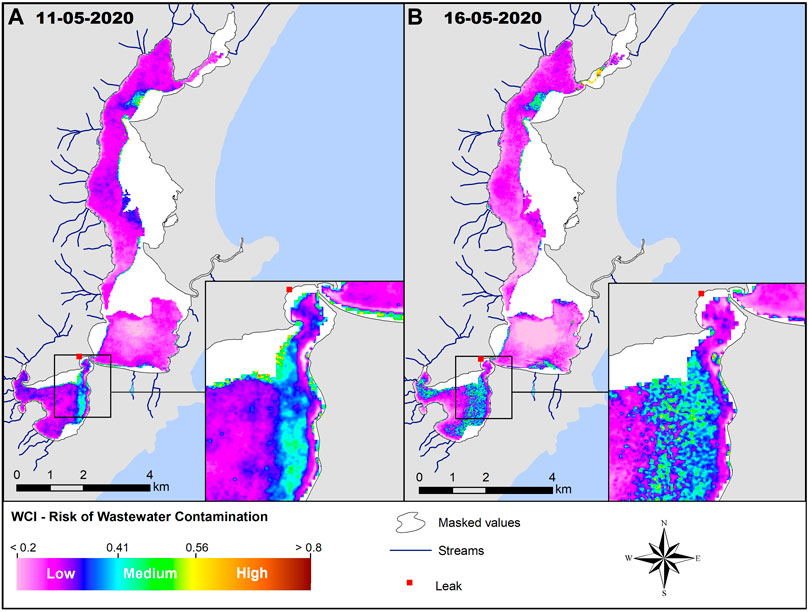
FIGURE 11. WCI maps representing the risk of contamination during the leak from a sewage pipe on (A) 11-05-2020 and (B) 16-05-2021, with details of the area of the leak for each date.
4 Discussion
4.1 Contribution of WQIs anomalies in distinguishing the reference wastewater plume
The spatial variation mode analysis of the training sample provided a linear combination that best captured the reference wastewater plume with equally high weights for
The high weight obtained for
The negligible effect of
4.2 Limitations of the WCI
A major assumption in this study is that the signals associated with the reference wastewater plume (derived from one specific outfall event) would be representative of other wastewater plumes in the area. This was a large-scale event, with an extensive visible plume even after weeks of the rupture. Therefore, it constituted a useful training sample to investigate the satellite-derived features associated with wastewater. Nevertheless, the weights given to the WQIs anomalies in the linear combination to formulate the WCI carry embedded characteristics of this one event, such as the large influence of suspended sediments due to the flash-flood nature, in combination with organic material. We would therefore expect that plumes that resemble the reference would be more easily detected and classified with a higher risk of contamination. In contrast, when only
Examples of potential underestimation of contamination risk were seen in the WCI maps of 05-02-2021 (Figure 10B), 11-05-2020 and 16-05-2020 (Figure 11). All of these maps were associated with wastewater spill events, but the coefficient of backscattering by SPM was low in comparison with average values. Therefore, even with markedly positive anomalies of
In addition, overestimations in SPM backscattering could also result in misinterpretation of the contamination risk. Overestimations of
Ideally, a larger number of images portraying known wastewater plumes in varied conditions should be used to have more representativeness and statistical strength in the weights of the linear combination and formulation of the WCI. It would also be preferred to have more water quality in situ measurements coinciding with satellite overpass on days of known contamination. Still, challenges arise from the fact that information about wastewater spills is not commonly disclosed by sanitation companies, especially in developing countries, as this might have negative implications for them. In addition, overflows from sewage pumping stations are typically associated with heavy rainfall and cloud cover. This constitutes a constraint of the method since optical remote sensing relies on clear skies. Yet, depending on the scale, duration and circulation conditions during the outfall, plumes might still be detectable after a few days, as was seen in the cases analysed in this study.
Ayad et al. (2020) highlight the importance of considering circulation patterns in wastewater studies, as there is a knowledge gap regarding residence time and dilution of the plumes. According to the study of Silva (2013), Conceição Lagoon’s circulation patterns are governed primarily by wind, flow in the contributing streams and the meteorological tide. The wind was the only parameter available for the study period and considered in the analysis, which highlighted its influence on the transport of wastewater plumes and the overall dynamicity of Conceição Lagoon system. Nevertheless, the inclusion of flow and meteorological tide data could enhance the robustness of the analysis by allowing the isolation of the processes that contribute to the detection of contamination.
4.3 Applicability of the WCI to other locations
The methodology applied here for the construction of the WCI is easily transferable to other locations and it is desired for further verification. For that, it is only necessary to have a time series of WQIs, with at least two dates capturing a wastewater plume (one for training and another for testing). It should be noted that the span of the time series influences the calculation of the WQIs anomalies (and consequently the WCI), as the mean and standard deviation will depend on that. It is also important to investigate the seasonality of the WQIs in the area of study and, if present, the anomalies should be calculated based on seasonal values. This is because if the WQIs have distinct seasonality, calculating the mean and standard deviation over the whole period will not remove it, and seasonal characteristics will still be present in the standardized anomalies, biasing the interpretation.
The choice of the training sample(s) is also important. It should consist of scenes that capture the spatial dynamics of wastewater plumes that are considered representative of the study area. A higher number of training samples should enhance the representativeness and is therefore preferred. The coverage of the training sample should comprise the whole area of interest in which the WCI will be applied, as to consider the site-specific characteristics in the differentiation of the background waters and the plume. The optical complexity of the area and the characteristics of the wastewater spill will influence the weights given to the WQIs anomalies in the spatial variation mode analysis, and provide an optimal linear combination to indicate the risk of contamination that is unique to the location. Although the weights are expected to vary from location to location, the overall methodology is transferable and could constitute a useful management tool for water management.
5 Conclusion
This study investigated how satellite-derived water quality indicators could be used to detect wastewater contamination in aquatic systems. We proposed a novel methodology that uses temporal anomalies of water quality indicators and their spatial patterns during a known outfall event to derive the Wastewater Contamination Index (WCI). The WCI indicates the risk of wastewater contamination, and was verified qualitatively for two outfall events in Conceição Lagoon, Southern Brazil with the aid of meteorological data, photographic records, and technical reports. One of the main findings was that a typical wastewater plume in Conceição Lagoon could be differentiated from background uncontaminated waters by simultaneously high positive anomalies of SPM backscattering coefficient and combined absorption coefficient of detritus and CDOM. This characteristic is explained by the elevated concentration of solids in outfalls associated with stormwater and the high organic matter content in waste. The method can be applied to other inland and coastal waters, and can therefore constitute a valuable management tool for monitoring wastewater contamination.
Data availability statement
Publicly available datasets were analyzed in this study. This data can be found here: https://scihub.copernicus.eu/ (Sentinel-2 MSI Level 2A images); https://portal.inmet.gov.br/dadoshistoricos (Meteorological data) https://balneabilidade.ima.sc.gov.br/ (Water quality measurements).
Author contributions
AD, JT, DW, and MS contributed to the conception, methodology, investigation, and analysis of the study. AD and MS were responsible for coding and processing the data. AD did the writing of the original draft and visualizations. MS, DW and JT reviewed and edited the manuscript. All authors contributed to the manuscript revision, read, and approved the submitted version.
Acknowledgments
This study was partly based on the MSc Thesis of the first author (de Liz Arcari, 2022), developed under the supervision of the other authors at the Faculty of Geo-Information Science and Earth Observation (ITC), University of Twente. The methodology presented in the thesis was modified and further developed for this research paper, awarding its originality. The authors are thankful to the European Space Agency for providing free access to the Sentinel-2 MSI imagery archive, the Brazilian Institute of Meteorology (INMET) for the precipitation and wind data, the Federal University of Santa Catarina for providing technical reports of wastewater contamination event in the study area, the Environmental Institute of Santa Catarina (IMA/SC) for the E. coli measurements, and Horn et al. (2022) for the bathymetric data.
Conflict of interest
The authors declare that the research was conducted in the absence of any commercial or financial relationships that could be construed as a potential conflict of interest.
Publisher’s note
All claims expressed in this article are solely those of the authors and do not necessarily represent those of their affiliated organizations, or those of the publisher, the editors and the reviewers. Any product that may be evaluated in this article, or claim that may be made by its manufacturer, is not guaranteed or endorsed by the publisher.
Supplementary material
The Supplementary Material for this article can be found online at: https://www.frontiersin.org/articles/10.3389/fenvs.2023.1130655/full#supplementary-material
Footnotes
1https://scihub.copernicus.eu/
2https://portal.inmet.gov.br/dadoshistoricos
3https://balneabilidade.ima.sc.gov.br/
4Code for processing point radiometric measurements available at https://github.com/suhybsalama/2SeaColor
5http://pnqa.ana.gov.br/Publicacao/Resolução_Conama_274_Balneabilidade.pdf
6Most Probable Number (MPN) is a statistical procedure commonly used in microbiology for estimating the number of organisms in a sample.
7https://g1.globo.com/sc/santa-catarina/noticia/2021/01/25/alagamento-atinge-casas-e-arrasta-carros-na-lagoa-da-conceicao-em-florianopolis-assustador-diz-coordenador-da-defesa-civil.ghtml
8https://ndmais.com.br/meio-ambiente/teste-constata-esgoto-na-lagoa-e-casan-pode-ser-multada-em-r1-milhao/
9See last picture in https://www.brasildefato.com.br/2021/05/25/antes-vitimas-hoje-somos-refens-diz-atingido-por-esgoto-da-casan-em-florianopolis
10See first picture in https://www.nsctotal.com.br/colunistas/renato-igor/poluicao-na-lagoa-da-conceicao-em-florianopolis-nao-pode-ser-politizada
References
Arabi, B., Salama, M. S., Wernand, M. R., and Verhoef, W. (2016). MOD2SEA: A coupled atmosphere-hydro-optical model for the retrieval of chlorophyll-a from remote sensing observations in complex turbid waters. Remote Sens. (Basel) 8, 722. doi:10.3390/rs8090722
Arabi, B., Salama, M. S., Wernand, M. R., and Verhoef, W. (2018). Remote sensing of water constituent concentrations using time series of in-situ hyperspectral measurements in the Wadden Sea. Remote Sens. Environ. 216, 154–170. doi:10.1016/J.RSE.2018.06.040
ARESC (2021). Monitoramento da Qualidade Hídrica da Lagoa da Conceição, município de Florianópolis. Available at: https://www.aresc.sc.gov.br/index.php/documentos/relatorios-de-fiscalizacao-de-municipios-conveniados/municipios-agua/florianopolis/2019-rf-008-2021-monitoramento-lagoa-da-conceicao-florianopolis/file (Accessed December 21, 2022).
Ayad, M., Li, J., Holt, B., and Lee, C. (2020). Analysis and classification of stormwater and wastewater runoff from the tijuana river using remote sensing imagery. Front. Environ. Sci. 8, 599030. doi:10.3389/fenvs.2020.599030
Benotti, M. J., and Brownawell, B. J. (2007). Distributions of pharmaceuticals in an urban estuary during both dry- and wet-weather conditions. Environ. Sci. Technol. 41, 5795–5802. doi:10.1021/es0629965
Buerge, I. J., Poiger, T., Müller, M. D., and Buser, H. R. (2003). Caffeine, an anthropogenic marker for wastewater contamination of surface waters. Environ. Sci. Technol. 37, 691–700. doi:10.1021/es020125z
Caballero, I., Fernández, R., Escalante, O. M., Mamán, L., and Navarro, G. (2020). New capabilities of Sentinel-2A/B satellites combined with in situ data for monitoring small harmful algal blooms in complex coastal waters. Sci. Rep. 10 (1), 8743. doi:10.1038/s41598-020-65600-1
Cabral, A., Bercovich, M. V., and Fonseca, A. (2019). Implications of poor-regulated wastewater treatment systems in the water quality and nutrient fluxes of a subtropical coastal lagoon. Reg. Stud. Mar. Sci. 29, 100672. doi:10.1016/j.rsma.2019.100672
CASAN (2021). Projeto de Recuperação de Áreas Degradadas - PRAD Lagoa da Conceição-Florianópolis/SC. Available at: https://www.casan.com.br/ckfinder/userfiles/files/Documentos_Download/PRAD%20v1.pdf (Accessed December 21, 2022).
Cui, Q., Huang, Y., Wang, H., and Fang, T. (2019). Diversity and abundance of bacterial pathogens in urban rivers impacted by domestic sewage. Environ. Pollut. 249, 24–35. doi:10.1016/J.ENVPOL.2019.02.094
Dabernig, M., Mayr, G. J., Messner, J. W., and Zeileis, A. (2017). Spatial ensemble post-processing with standardized anomalies. Q. J. R. Meteorological Soc. Q J. R. Meteorol. Soc 143, 909–916. doi:10.1002/qj.2975
de Barros, G., Larissa, A. D., Fonseca, O., Cabral dos Santos, A., Luiza Schmitz Fontes, M., Rodolfo Donnangelo Varela, A., et al. (2017). Nutrient distribution in a shallow subtropical lagoon, south Brazil, subjected to seasonal hypoxic and anoxic events. Braz J. Oceanogr. 65, 116–127. doi:10.1590/S1679-87592017101206502
de Liz Arcari, A. (2022). Remote sensing of wastewater contamination in coastal areas: A case study of Conceição lagoon, Brazil. Available at: http://essay.utwente.nl/92236/(Accessed December 22, 2022).
Di Baldassarre, G., Montanari, A., Lins, H., Koutsoyiannis, D., Brandimarte, L., and Blschl, G. (2010). Flood fatalities in Africa: From diagnosis to mitigation. Geophys Res. Lett. 37, 22402. doi:10.1029/2010GL045467
Dias, B. B., Parizotto, B. A. D. M., and Bonetti, C. (2014). Agentes naturais e antrópicos modificadores da qualidade da água e dos sedimentos nas áreas marginais da Lagoa da Conceição, SC. Braz. J. Aquatic Sci. Technol. 18, 33–43. doi:10.14210/BJAST.V18N1.P33-43
El Mahrad, B., Newton, A., Icely, J., Kacimi, I., Abalansa, S., and Snoussi, M. (2020). Contribution of remote sensing technologies to a holistic coastal and marine environmental management framework: A review. Remote Sens. (Basel) 12, 2313. doi:10.3390/rs12142313
Fono, L. J., and Sedlak, D. L. (2005). Use of the chiral pharmaceutical propranolol to identify sewage discharges into surface waters. Environ. Sci. Technol. 39, 9244–9252. doi:10.1021/ES047965T
Fontes, M. L. S., Suzuki, M. T., Cottrell, M. T., and Abreu, P. C. (2010). Primary production in a subtropical stratified coastal lagoon—contribution of anoxygenic phototrophic bacteria. Microb. Ecol. 1 (1), 223–237. doi:10.1007/S00248-010-9739-X
Gancheva, I., Campbell, G., and Peneva, E. (2020). “Satellite remote sensing techniques for detection of riverine and other sources flows in the coastal part of the Black Sea,” in EGU general assembly. (Online). doi:10.5194/egusphere-egu2020-8336
Gierach, M. M., Holt, B., Trinh, R., Jack Pan, B., and Rains, C. (2017). Satellite detection of wastewater diversion plumes in Southern California. Estuar. Coast Shelf Sci. 186, 171–182. doi:10.1016/j.ecss.2016.10.012
Godoy, F. B., Mário, H. F. S., and Franco, D. O. (2008). “Canal da Barra da Lagoa, Florianópolis - SC - um filtro de maré natural,” in Anais III-Seminário e workshop em Engenharia Oceânica (RS, Brazil: Rio Grande), 12.
Grizzetti, B., Lanzanova, D., Liquete, C., Reynaud, A., and Cardoso, A. C. (2016). Assessing water ecosystem services for water resource management. Environ. Sci. Policy 61, 194–203. doi:10.1016/J.ENVSCI.2016.04.008
Groom, S., Sathyendranath, S., Ban, Y., Bernard, S., Brewin, R., Brotas, V., et al. (2019). Satellite Ocean colour: Current status and future perspective. Front. Mar. Sci. 0, 485. doi:10.3389/FMARS.2019.00485
Guo, B., Fang, Y., Jin, X., and Zhou, Y. (2020). Monitoring the effects of land consolidation on the ecological environmental quality based on remote sensing: A case study of chaohu lake basin, China. Land use policy 95, 104569. doi:10.1016/J.LANDUSEPOL.2020.104569
Harringmeyer, J. P., Kaiser, K., Thompson, D. R., Gierach, M. M., Cash, C. L., and Fichot, C. G. (2021). Detection and sourcing of CDOM in urban coastal waters with UV-visible imaging spectroscopy. Front. Environ. Sci. 9, 1–21. doi:10.3389/fenvs.2021.647966
Hoerger, C. C., Akhtman, Y., Martelletti, L., Rutler, R., Bonvin, F., Grange, A., et al. (2014). Spatial extent and ecotoxicological risk assessment of a micropollutant-contaminated wastewater plume in Lake Geneva. Aquat. Sci. 76, 7–19. doi:10.1007/S00027-013-0315-6
Horn, L. R., Uda, P. K., Franco, D., and Kern, P. (2022). Statistical analysis for determination of homogeneous reflectance regions in a coastal lagoon using satellite imagery and bathymetry survey. J. Appl. Remote Sens. 16, 034508. doi:10.1117/1.JRS.16.034508
Hu, X., and Xu, H. (2019). A new remote sensing index based on the pressure-state-response framework to assess regional ecological change. Environ. Sci. Pollut. Res. 26, 5381–5393. doi:10.1007/S11356-018-3948-0
Hudson, N., Baker, A., and Reynolds, D. (2007). Fluorescence analysis of dissolved organic matter in natural, waste and polluted waters - a review. River Res. Appl. 23, 631–649. doi:10.1002/RRA.1005
Hughes, K. A., and Thompson, A. (2004). Distribution of sewage pollution around a maritime Antarctic research station indicated by faecal coliforms, Clostridium perfringens and faecal sterol markers. Environ. Pollut. 127, 315–321. doi:10.1016/J.ENVPOL.2003.09.004
Ingebritsen, S. E., and Lyon, R. J. (1985). Principal components analysis of multitemporal image pairs. Int. J. Remote Sens. 6, 687–696. doi:10.1080/01431168508948491
IOCCG (2006). “Remote sensing of inherent optical properties: Fundamentals, tests of algorithms, and applications,” in Reports of the international ocean-colour coordinating group, No. 5. Editor Z. P. Lee (Dartmouth, Canada: IOCCG), 126.
IPCC (2018). “Global warming of 1.5°C,” in An IPCC Special Report on the impacts of global warming of 1.5°C above pre-industrial levels and related global greenhouse gas emission pathways, in the context of strengthening the global response to the threat of climate change. V. Masson-Delmotte, P. Zhai, H. O. Pörtner, D. Roberts, J. Skea, P. R. Shuklaet al. Editors (Geneva, Switzerland: IPCC).
Kruse, F. A., Lefkoff, A. B., Boardman, J. W., Heidebrecht, K. B., Shapiro, A. T., Barloon, P. J., et al. (1993). The spectral image processing system (SIPS)—Interactive visualization and analysis of imaging spectrometer data. Remote Sens. Environ. 44, 145–163. doi:10.1016/0034-4257(93)90013-N
Lee, Z., Carder, K. L., Mobley, C. D., Steward, R. G., and Patch, J. S. (1999). Hyperspectral remote sensing for shallow waters: 2. Deriving bottom depths and water properties by optimization. Appl. Opt. 38, 3831–3843. doi:10.1364/ao.38.003831
Lisboa, L. K., Teive, L. F., and Petrucio, M. M. (2008). Lagoa da Conceição: uma revisão da disponibilidade de dados ecológicos visando o direcionamento de novas pesquisas no ecossistema. Rev. Biotemas 21, 139–146. doi:10.5007/2175-7925.2008v21n1p139
Lüchmann, K. H., Freire, A. S., Ferreira, N. C., Daura-Jorge, F. G., and Marques, M. R. F. (2008). Spatial and temporal variations in abundance and biomass of penaeid shrimps in the subtropical Conceição Lagoon, southern Brazil. J. Mar. Biol. Assoc. U. K. 88, 293–299. doi:10.1017/S0025315408000556
Marmorino, G. O., Smith, G. B., Miller, W. D., and Bowles, J. H. (2010). Detection of a buoyant coastal wastewater discharge using airborne hyperspectral and infrared imagery. J. Appl. Remote Sens. 4, 043502. doi:10.1117/1.3302630
Martini, L. C. P., Mattos, D. S., Barbosa, D. F. P., and Rech, A. I. B. (2006). Uso de sensoriamento remoto orbital para avaliação da distribuição espacial de clorofila-a na Lagoa da Conceição-Florianópolis, SC.
Meyer, J. L. (2009). “Urban aquatic ecosystems,” in Encyclopedia of inland waters, 367–377. doi:10.1016/B978-012370626-3.00236-2
Nezlin, N. P., DiGiacomo, P. M., Diehl, D. W., Jones, B. H., Johnson, S. C., Mengel, M. J., et al. (2008). Stormwater plume detection by MODIS imagery in the southern California coastal ocean. Estuar. Coast Shelf Sci. 80, 141–152. doi:10.1016/j.ecss.2008.07.012
Ngoc, D. D., Loisel, H., Jamet, C., Vantrepotte, V., Duforêt-Gaurier, L., Minh, C. D., et al. (2019). Coastal and inland water pixels extraction algorithm (WiPE) from spectral shape analysis and HSV transformation applied to Landsat 8 OLI and Sentinel-2 MSI. Remote Sens. Environ. 223, 208–228. doi:10.1016/J.RSE.2019.01.024
Nyenje, P. M., Foppen, J. W., Uhlenbrook, S., Kulabako, R., and Muwanga, A. (2010). Eutrophication and nutrient release in urban areas of sub-saharan Africa — a review. Sci. Total Environ. 408, 447–455. doi:10.1016/J.SCITOTENV.2009.10.020
Odreski, F., Curtarelli, M. P., and Berns, G. A. G. (2021). Estudo técnico de suporte para recuperação ambiental da Lagoa da Conceição. Florianópolis/SC.
Petrenko, A. A., Jones, B. H., Dickey, T. D., LeHaitre, M., and Moore, C. (1997). Effects of a sewage plume on the biology, optical characteristics, and particle size distributions of coastal waters. J. Geophys Res. Oceans 102, 25061–25071. doi:10.1029/97JC02082
Salama, M. S., and Verhoef, W. (2015). Two-stream remote sensing model for water quality mapping: 2SeaColor. Remote Sens. Environ. 157, 111–122. doi:10.1016/j.rse.2014.07.022
Seegers, B. N., Teel, E. N., Kudela, R. M., Caron, D. A., and Jones, B. H. (2017). Glider and remote sensing observations of the upper ocean response to an extended shallow coastal diversion of wastewater effluent. Estuar. Coast Shelf Sci. 186, 198–208. doi:10.1016/J.ECSS.2016.06.019
Silva, J. C. (2013). Análise Numérica da Influência Dos Aportes Fluviais e Antrópicos Sobre a Hidrodinâmica Residual e a Qualidade da Água da Lagoa da Conceição – Florianópolis - SC.
Silva, V. E. C. (2021). Análise hidrodinâmica e biogeoquímica de uma laguna costeira subtropical em bacia hidrográfica urbanizada: Lagoa da Conceição, Florianópolis, Santa Catarina.
Silva, V. E. C., Franco, D., Larissa Fonseca, A., Luiza Fontes, M., and Rodolfo Donnangelo, A. (2017). Space time evolution of the trophic state of a subtropical lagoon: Lagoa da Conceição, Florianópolis Island of Santa Catarina, Brazil. Braz. J. Water Resour. 22. doi:10.1590/2318-0331.011716027
Trinh, R. C., Fichot, C. G., Gierach, M. M., Holt, B., Malakar, N. K., Hulley, G., et al. (2017). Application of Landsat 8 for monitoring impacts of wastewater discharge on coastal water quality. Front. Mar. Sci. 4, 329. doi:10.3389/fmars.2017.00329
UFSC (2021). Nota Técnica No03/PES/2021 - Mortandade de organismos e cheiro de água podre na Lagoa da Conceição. Florianopolis/SC.
Yang, Q., Liu, G., Casazza, M., Hao, Y., and Giannetti, B. F. (2019). Emergy-based accounting method for aquatic ecosystem services valuation: A case of China. J. Clean. Prod. 230, 55–68. doi:10.1016/J.JCLEPRO.2019.05.080
Yu, T., Jiapaer, G., Bao, A., Zheng, G., Jiang, L., Yuan, Y., et al. (2021). Using synthetic remote sensing indicators to monitor the land degradation in a salinized area. Remote Sens. (Basel) 13, 2851. doi:10.3390/rs13152851
Keywords: wastewater, contamination risk, optical remote sensing, water quality indicators, temporal anomalies
Citation: de Liz Arcari A, Tavora J, van der Wal D and Salama MS (2023) The Wastewater Contamination Index: A methodology to assess the risk of wastewater contamination from satellite-derived water quality indicators. Front. Environ. Sci. 11:1130655. doi: 10.3389/fenvs.2023.1130655
Received: 23 December 2022; Accepted: 20 February 2023;
Published: 02 March 2023.
Edited by:
Sijia Li, Northeast Institute of Geography and Agroecology (CAS), ChinaReviewed by:
Andrew M. Fischer, University of Tasmania, AustraliaYuan Li, Zhejiang Gongshang University, China
Copyright © 2023 de Liz Arcari, Tavora, van der Wal and Salama. This is an open-access article distributed under the terms of the Creative Commons Attribution License (CC BY). The use, distribution or reproduction in other forums is permitted, provided the original author(s) and the copyright owner(s) are credited and that the original publication in this journal is cited, in accordance with accepted academic practice. No use, distribution or reproduction is permitted which does not comply with these terms.
*Correspondence: Amanda de Liz Arcari, YS5kZWxpemFyY2FyaUB1dHdlbnRlLm5s