 Yumei Liu1
 Yafei Wang
 Jiuyi Li
 Liqiao Liang
- 1School of Geography Science and Geomatics Engineering, Suzhou University of Science and Technology, Suzhou, China
- 2Chinese Research Academy of Environmental Sciences, Beijing, China
- 3Institute of Geographic Sciences and Natural Resources Research, Chinese Academy of Sciences, Beijing, China
- 4Institute of Tibetan Plateau Research, Chinese Academy of Sciences, Beijing, China
Water resources are essential for agriculture. In the spatial layout of agricultural production, quantitatively identifying the spatial differences in water resource conditions, including precipitation and irrigation water supply factors, is necessary. Here, a water resource suitability index for agricultural production (WRSIA) was constructed for agricultural development using irrigation water supply convenience (IWSC) and precipitation conditions. Considering Lhasa as the study area, water resource suitability index for agricultural production was calculated on a 100 m grid scale, and the spatial distribution relationship between water resource suitability index for agricultural production and cultivated land was analyzed using geographically weighted regression (GWR). The results showed that irrigation water supply convenience severely restricted agricultural production in Lhasa, and the high water resource suitability index for agricultural production values were mainly distributed in the valleys of the Lhasa River and its tributaries. Moreover, 47.7% of the cultivated land was distributed in 5% of the area having the highest water resource suitability. According to geographically weighted regression, the cultivated land area and water resource availability were strongly correlated (R2 = 0.904). The distribution of the cultivated land was well explained by water resource suitability index for agricultural production, which could describe the differences in water resource suitability for agricultural production. Furthermore, the suitability of agricultural production was better evaluated when water resource suitability index for agricultural production was coupled with the land resource suitability index. Overall, water resource suitability index for agricultural production showed high applicability in Lhasa and other regions, thereby providing a scientific basis and technical support for the spatial layout of agricultural production.
1 Introduction
Water is an essential resource for agricultural production and plays an important role in agricultural development (Wienhold et al., 2000; Cao et al., 2018). Both non-irrigated and irrigated agricultural lands require water. Particularly, non-irrigated farmlands require sufficient precipitation to ensure crop growth, whereas irrigated lands require needs suitable water supply conditions. The contradiction of agricultural water use has become increasingly prominent and become a constraint for agricultural production in some areas (Li, 2019; Shi et al., 2016). Developing methods to measure the association between the sustability of water resource conditions and agricultural production and to optimize the spatial layout of agricultural production according to the suitability conditions of water resources has become an increasing concern of having scientific and practical significance (Joerin et al., 2001; Chen et al., 2010; Ozkan et al., 2020).
Water resource suitability for agricultural production was initially studied by assessing agricultural production conditions in agricultural zones. In the 1930s, Soviet scholars first proposed agroclimatic zoning and conducted agroclimatic zoning by identifying and analyzing the most important climatic indicators for crop growth and development (Tian et al., 2008). In the 1960s, Japan conducted agricultural zoning based on the geographical zoning of statistical agricultural and forestry land, areal agricultural types, administrative regions, natural conditions, and production characteristics (Guo, 1989; Zhang et al., 2007). In China, integrated agricultural regionalization was studied from the 1950s to the 1960s using indicators, such as precipitation and dryness, to classify dry and wet partitions as the basis for agricultural regionalization (Huang, 1958; Chen, 1979; Shen et al., 1982; Shen and Li, 1983). Extensive climate resource surveys and agricultural climate zoning studies were conducted from the 1970s to the 1980s. Additionally, the Third National Agroclimatic Zoning was conducted from 1998 to 1999 by the China Meteorological Administration (Li, 1988; Zhang et al., 2009; Tao and Chen, 2014). In terms of indicator evaluation methods, crop production water requirements and precipitation processes were coupled and analyzed. Yang et al. (2005) constructed a water balance table simulation to assess the crop water requirement considering monthly precipitation, soil water, and deficit processes. Caldana et al. (2019) conducted agroclimatic risk zoning of avocados in the Paraná River Basin, Paraná State, Brazil, based on precipitation, water balance, and other conditions. Moreover, Zhang et al. (2022) proposed a stochastic simulation model by integrating the Monte Carlo, Copula and Markov process (MCMP-Copula) for agricultural water scarcity risk assessment based on indicators, such as crop water requirement and adequate precipitation. Masupha et al. (2016) measured the effect of drought on rainfed maize production in the Luvuvhu River Basin using the water demand satisfaction index. Furthermore, the influence of precipitation and temperature on agricultural development has also been widely studied previously (Henseler et al., 2009; Falloon and Betts, 2010; Silva et al., 2013; Elliott et al., 2014). Several complex factors affect agricultural production; therefore, many scholars have developed the framework of the indicator system based on the AHP model (Analytic Hierarchy Process Model) to assess the suitability of water resources for agricultural production (Ceballos Silva et al., 2003; Akinci et al., 2013; Bozdag et al., 2016; Yalew, 2016; Akpoti et al., 2019; Everest et al., 2021; Al-Hanbali et al., 2022; Shaloo et al., 2022). Although the analysis method based on indicator weights has a sizeable subjective factor, some scholars use machine learning models, such as random forest, to estimate the relative weights of the selected evaluation indicators (Taghizadeh-Mehrjardi et al., 2020; Singh R. et al., 2022).
Water resources suitability studies are an essential basis for agricultural production layout and have been widely used in national and basin-wide agricultural development planning (Zolekar and Bhagat, 2015; Aldababseh et al., 2018; Hagos et al., 2022; Roy et al., 2022). Within watersheds, water resource suitability is also an important factor influencing the layout of agricultural development. In China’s ongoing Territorial Spatial Planning, a high-precision water resource suitability assessment is required to reallocate agricultural, urban and ecological spaces on a grid scale. (Feng et al., 2018; Zhang et al., 2020; Li et al., 2021). However, most of the commonly used water resources indicators are statistical data, which cannot describe the differences in water resources conditions within a region and cannot meet the high precision requirements of Terrestrial Spatial Planning (Li et al., 2021; Liu and Zhou, 2021; Battisti et al., 2022). In some studies, water source distance is usually used to characterize the accessibility of irrigation water and to assess the water resource suitability for agricultural production (Lane, 2010; Wang, 2018; Shen et al., 2020; Hsu et al., 2021; Zhu et al., 2022). However, the distance to the water source does not equal to irrigation water accessibility. As shown in Figure 1, the optimal water supply path from water source A to P1 may be the curve s2 instead of the straight line s1, because s2 has fewer hills. Furthermore, the water supply path s3 from B may be better than s2 from A. Moreover, the irrigation water accessibility of Point P2 is better than that of Point P1, even though P2 is linear and far from the river source.
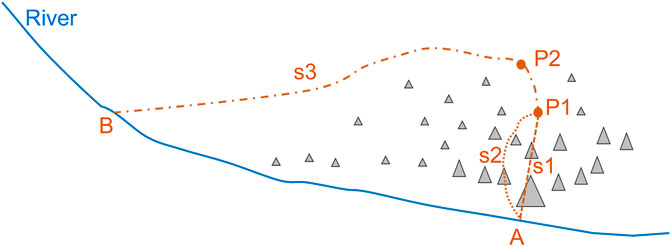
FIGURE 1. Difference between water source distance and irrigation water accessibility.
Thus, Lhasa City, which has a complex terrain and mainly been dominated by irrigated agricultural production, was selected as the study area. In this study, a framework for evaluating the suitability of water resources, including the convenience of water supply, was constructed to assess the water accessibility and suitability for agricultural production. Both distance to the water source and topographical influences in the water supply path were considered. Subsequently, the supporting capacity of irrigation water supply conditions and precipitation for agricultural production was comprehensively measured. The results provide a scientific basis for agricultural production in the territorial spatial planning of Lhasa and a reference for the layout of agricultural production in other areas with complex terrain.
2 Materials and methods
2.1 Study area
Lhasa City in Tibet, China, covers an area of approximately 30,000 km2. The administrative divisions of Lhasa include three districts (Chengguan, Duilong Deqing, and Dazi Districts) and five counties (Linzhou, Damxiong, Nimu, Qushui, and Mozhugongka Counties). The average elevation of Lhasa is 4,852 m, with relatively higher elevation in the north than in the south. Lhasa mainly has a mountainous terrain, except for some river valleys and the northern Dangxiong Basin (Figure 2). The annual average precipitation is approximately 420 mm, which is mainly concentrated during June–September. The region is mostly located in the Yarlung Zangbo River Basin, and only a small part in the north belongs to the Namtso Lake Internal flow region. The main rivers include the Lhasa River and its tributaries (Sangqu, Wululongqu, Xuerong Zangbo, Mozhumaqu, Pengboqu, and Duilongqu Rivers) and Nimumaqu River, a tributary of the Yarlung Zangbo River. The Lhasa River, which is the primary water source in Lhasa, is an important tributary of the Yarlung Zangbo River, with a total length of 495 km, drainage area of 32,500 km2, and an average annual flow of 287 m3/s.
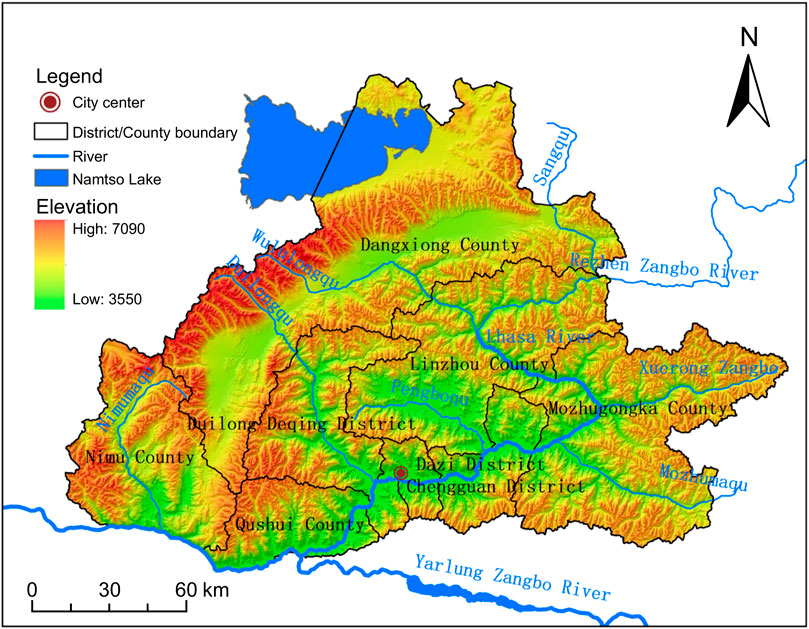
FIGURE 2. Topography and river system map of Lhasa.
The land use types in Lhasa are mainly grassland and forest, and artificial ecosystems, such as cultivated land and construction land, comprise a relatively small proportion (Figure 3). Grasslands, which account for approximately 70% of the city’s total area, are mainly distributed in the plateau valleys and mountains of medium elevated and highest. Grasslands are followed by forests dominated by natural shrubland and mainly distributed in Linzhou and Mozhugongka Counties. The cultivated land area covers 61,824 ha, accounting for 2.1% of the total area. Owing to insufficient precipitation, the cultivated land in Lhasa includes mainly includes irrigated farmland, with a total area of 54,396 ha, whereas the remaining 7,428 ha includes non-irrigated farmlands. The irrigated farmlands are mainly distributed in the valleys of the Lhasa, Nimumaqu, Duilongqu, Mozhumaqu rivers, and other rivers, whereas the non-irrigated cultivated lands are dispersed around the irrigated cultivated land. Furthermore, rivers, which are the main water source for agricultural irrigation, are abundant in Lhasa. The average annual water resources comprise approximately 7.2 billion m3, with 8,600 m3 per capita and 116,000 m3/ha of cultivated land, which meet the agricultural requirements. However, engineering conditions limit Lhasa’s agricultural irrigation supply, indicating that the restrictions on water resources are mainly spatial rather than quantitative.

FIGURE 3. Land use map of Lhasa City.
Lhasa City is one of the most suitable regions for human activities in Tibet; particularly, agricultural production in this region plays an important role in ensuring regional food security. Given the large population, the scale and spatial layout of agricultural production have been gaining attention. Irrigation convenience is a limiting factor for agricultural development. However, conventional indicators, such as distance of the water supply source, cannot represent the spatial differences because several factors other than the distance affect convenience in mountainous areas. Therefore, identifying new indicators that characterize the spatial differences in water resource suitability for agricultural production in Lhasa is necessary to provide a scientific basis for developing regional agricultural production layouts.
2.2 Data sources
A land use map with a 1:10,000 scale was obtained from the Second National Land Survey conducted in 2018. Precipitation and evapotranspiration data in a 1,000 m grid and digital elevation model (DEM) data in a 30 m grid were downloaded from the Resource and Environment Science and Date Center, Chinese Academy of Science (https://www.resdc.cn). The details of the data used in this study are listed in Table 1. The data were resampled to a 100 m grid in ArcGIS using a bilinear interpolation algorithm.
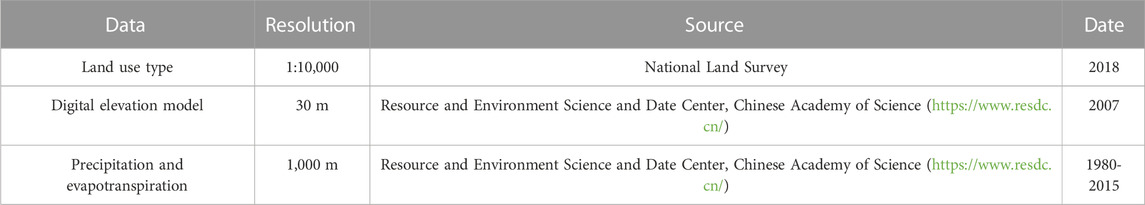
TABLE 1. Principal data sources in this study.
2.3 Methods
The Water Resource Suitability Index for Agricultural Production (WRSIA) model was constructed. It consists of two components: precipitation supporting capacity and Irrigation Water Supply Convenience (IWSC). Precipitation supporting capacity refers to the ability of precipitation conditions to support rain-fed agriculture and is assessed by the magnitude of precipitation. IWSC characterizes the suitability of water resources for the development of irrigated agriculture and is assessed using distance from potential water supply sources and lift elevation, as measured using the model, as shown in Figure 4.
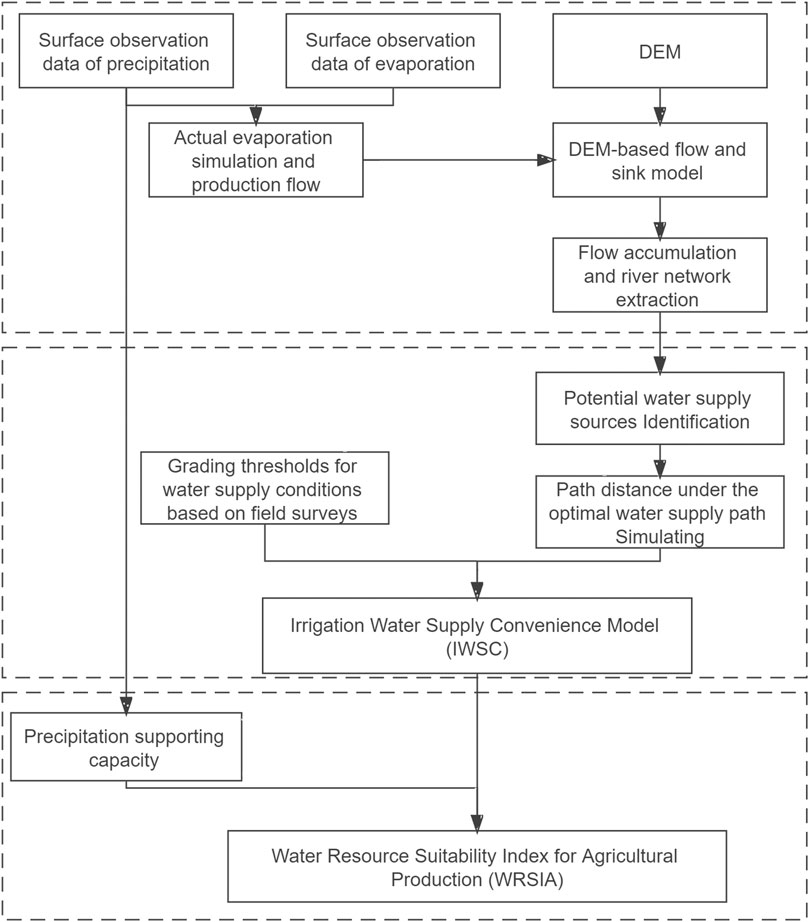
FIGURE 4. Workflow chart.
2.3.1 Runoff model construction and river network extraction
In order to identify potential water supply sources, a hydrological model needs to be constructed for flow simulation. The runoff of each grid was calculated by subtracting the actual evaporation data from precipitation data. The actual evaporation was estimated using the formula (Zhang et al., 2001; Zhang et al., 2004) that is commonly used in areas where hydrological information is lacking, as shown below:
Where, E is the actual evapotranspiration, p is precipitation, E0 is potential evapotranspiration, and ω is the plant available water coefficient.
A 100 m grid scale runoff model was constructed for Lhasa. Potential water sources for Lhasa’s agricultural water supply were extracted from the DEM depression filling process, slope aspect analysis, flow accumulation, and river network extraction. The results of runoff per unit area calculated by Zhang’s formula show the characteristics of high runoff in the east and low runoff in the west (Figure 5A), which is consistent with the actual situation of Lhasa city (Sun et al., 2019; Cai et al., 2021). The multi-year average yield flow in Lhasa City obtained from the model result statistics is 6.9 billion m3, which has an error of 4.2% with the observed value, and this error is acceptable for the extracted river network. Moreover, a field survey of Lhasa’s agricultural water supply sources was conducted to determine the selection standard for primary and secondary agricultural water supply sources. The corresponding extraction results are shown in Figure 5B. The primary water source referred to the water source with the highest degree of water supply security that met the irrigation requirements of large scale irrigation areas, and the selection standard was rivers having an average annual runoff of more than 300 million m3,. The secondary water sources referred to water sources with relatively low water supply security that met the requirements of small scale irrigated agriculture, and the selection standard was rivers with an average annual runoff ranging between 10 million and 300 million m3. According to the distribution of cultivated land, the water supply source selection standard was reasonable.
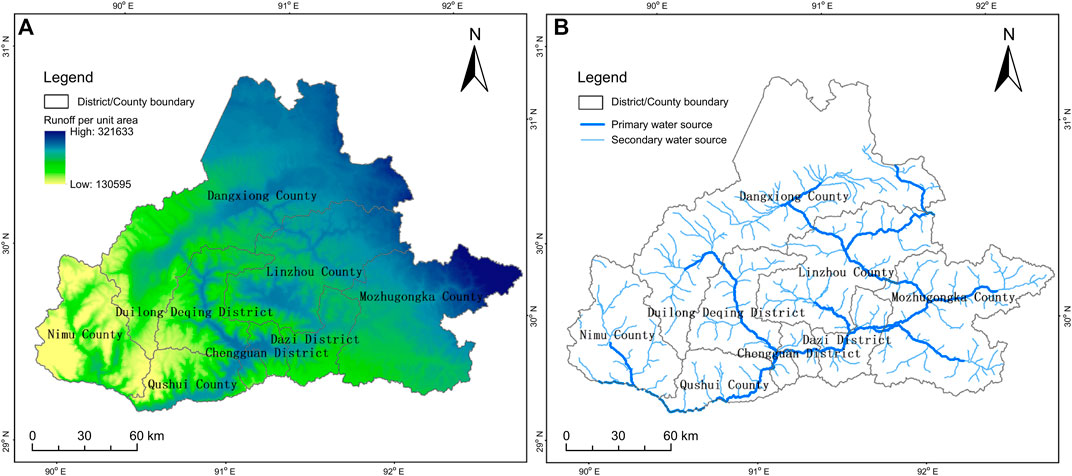
FIGURE 5. (A) Annual runoff yield per unit area, m3/km2; (B) potential water supply sources extracted by the runoff model.
2.3.2 Irrigation water supply convenience (IWSC)
IWSC represents the convenience of irrigation conditions for agricultural development in irrigation areas, including irrigation water supply accessibility, and water source reliability. Water supply accessibility describes the magnitude of the cost of water supply and its affordability. This is determined by two factors, namely, the distance to the water supply source and the height of the required lift. The richer the water resources of the river water sources, the higher the degree of water supply security, and the more suitable the area is for the development of irrigated agriculture (Li, 2022). In this study, the level of reliability of the irrigation water sources was mainly distinguished based on the magnitude of river flow.
The convenience index of the irrigation water supply was calculated as follows:
Where, i and j refer to the points on the optimal water supply path, starting from the primary and secondary water supply sources, and simulated by the path distance module in ArcGIS.
2.3.3 Water resource suitability index for agricultural production (WRSIA)
WRSIA represents the suitability of water resources for agricultural production. Considering the characteristics and agricultural water use of water resources in Lhasa, WRSIA was obtained by comprehensively evaluating precipitation and IWSC using the following equations:
where
2.3.4 Geographically weighted regression (GWR)
Brunsdon et al. (1996) built a GWR model that introduced the spatial location of the data into regression coefficients. The local estimator of the function was provided at each geographical location, and the spatial non-stationarity of the regression relationship was analyzed. Compared with the ordinary least squares method, GWR is more effective for analyzing data with spatial attributes (Lv and Zhen, 2010; Tang et al., 2012; Pang et al., 2014; Liu et al., 2022; Xu et al., 2022). Therefore, GWR was selected to analyze the correlation between cultivated land and WRSI. The GWR model formula was as follows:
where
3 Results
3.1 WRSIA
According to the formula of irrigation water supply accessibility, the path distance and accessibility indicators of each grid from the primary and secondary water sources were measured using ArcGIS, and the corresponding results are shown in Figures 6A, B, respectively. High mountains and valleys dominated Lhasa, and areas with better accessibility were concentrated in the river valleys. The IWSC results are shown in Figure 6C. Irrigated agricultural land (19.0% of the total area) was mainly concentrated in the middle and lower reaches of the Lhasa River and tributary valleys, and the Dangxiong Basin in the north. Some of the Lhasa River tributary valleys had steep slopes on both sides; therefore, only narrow valleys exhibited irrigation water supply conditions. Agricultural production depending mainly on natural precipitation covered the remaining 81% of the total area. Moreover, the supporting capacity index of precipitation conditions for agricultural production was calculated based on the mean annual precipitation data (Figure 6D).
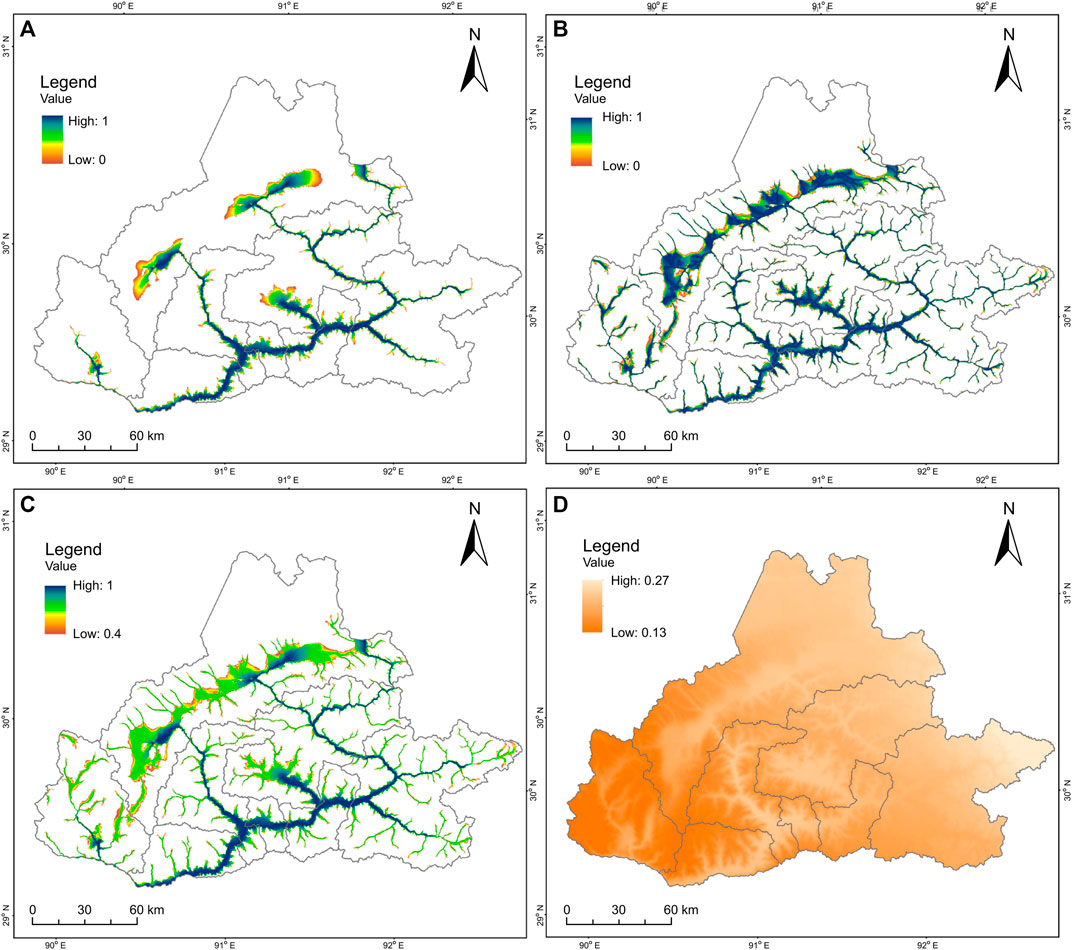
FIGURE 6. (A) Irrigation water supply accessibility of primary water sources; (B) irrigation water supply accessibility of secondary water sources; (C) IWSC; (D) supporting capacity of precipitation for agricultural production.
The WRSIA results are shown in Figure 7. The average value of WRSIA in Lhasa was low (0.312). Owing to inadequate precipitation in Lhasa, WRSIA was mainly determined by IWSC. The better-suited areas were distributed in the valleys of the Lhasa River and its tributaries, such as the Mozhumaqu, Pengboqu, and Duilongqu Rivers, and the Dangxiong Basin having a relatively flat terrain.
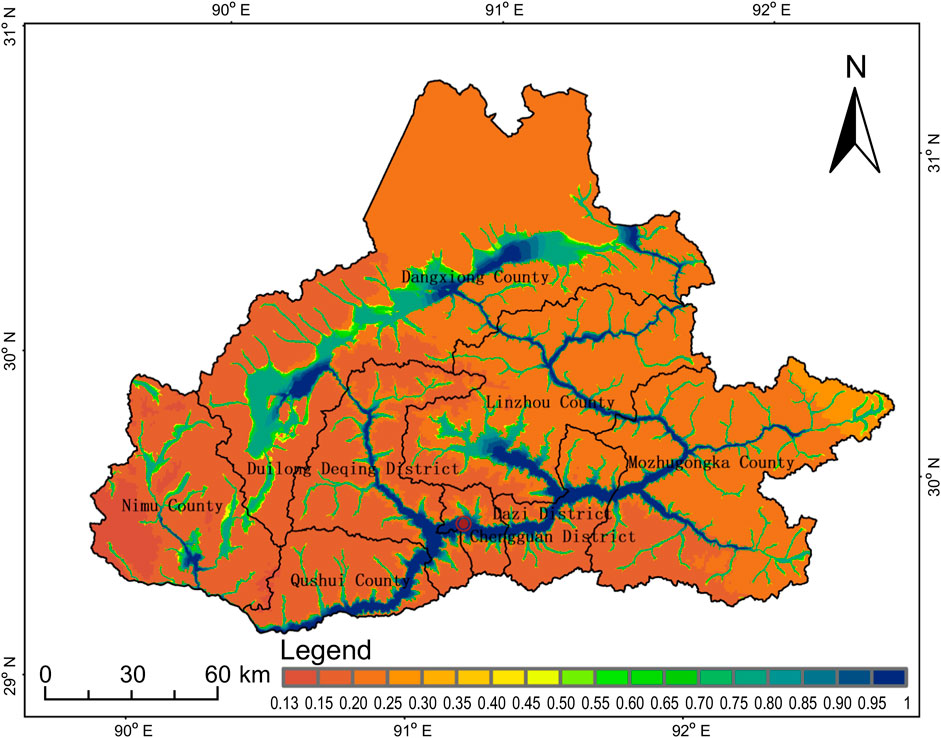
FIGURE 7. Wrsia in Lhasa city.
3.2 Relationship between WRSIA and cultivated land
3.2.1 Spatial adaptability of WRSIA and cultivated land
Figure 8 shows the double cumulative curve relationship between WRSIA and cultivated land. Cultivated land was more concentrated in areas with high WRSIA values, with 96.6% and 82.5% of the irrigated and non-irrigated cultivated land, respectively, distributed in the top 20% of the WRSIA areas. Moreover, up to 81.1% and 49.1% of the irrigated and non-irrigated cultivated land, respectively, were concentrated in the top 10% of the WRSIA areas, accounting for 77.3% of the total cultivated land. Furthermore, 50.8% and 25.0% of the irrigated and non-irrigated cultivated lands, respectively, were distributed in the top 5% of the WRSIA areas, accounting for 47.7% of the total cultivated land. In summary, WRSIA showed good spatial adaptability to cultivated land. Therefore, WRSIA is a critical factor in determining Lhasa’s agricultural production layout.
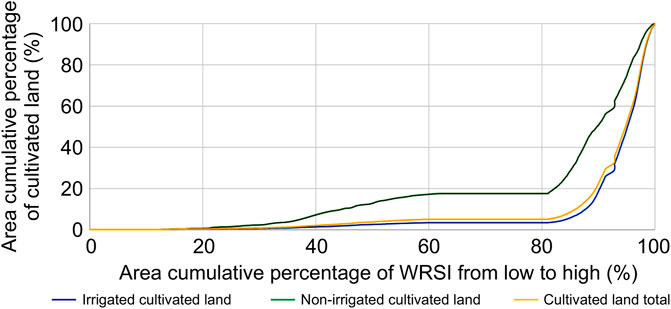
FIGURE 8. Double accumulation curve of WRSIA and cultivated land.
Table 2 shows the results of the cultivated land distribution in different WRSIA ranges. In areas with <0.4 WRSIA, the proportion of the cultivated land to the total land area was only 0.1%, which was lower than that of the entire city (2.1%). With increasing WRSIA, the cultivated land proportion increased. Among areas with WRSIA values within [0.95, 0.99], the proportion of cultivated land reached 25.6%. Moreover, in the highest WRSIA interval [0.99, 1], the cultivated land proportion decreased to 14.5% because of several construction lands and wetlands. By excluding 39.9 km2 of construction land and 235.66 km2 of wetland, the cultivated land proportion in the [0.99, 1] interval was up to 28.0%.
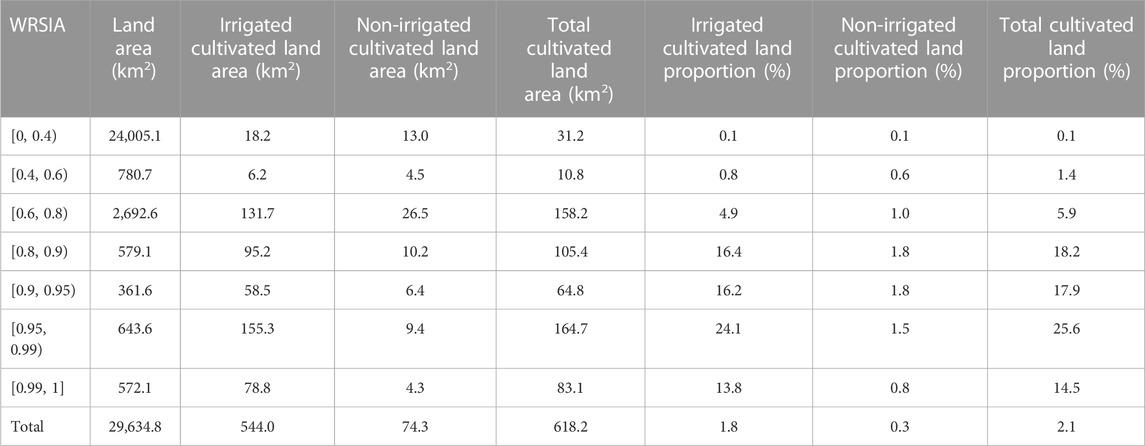
TABLE 2. Cultivated land distribution in different WRSIA ranges.
3.2.2 Correlation analysis of WRSIA and cultivated land by GWR
The study area was divided into 5,000 × 5,000 m fishing net units, and the proportion of cultivated land and WRSIA in each unit was measured. Figure 9 shows the correlation results between WRSIA and cultivated land. Specifically, Figures 9A, B show the spatial distribution of the regression coefficient and correlation coefficient (r), respectively. The overall correlation was strong (0.904). In the southern Lhasa River and its tributary valleys, the regression coefficients were positive, and the correlation coefficients were >0.6, thus, indicating a significant positive correlation. Thus, WRSIA could strongly interpret the spatial distribution of cultivated land. In the northern mountains and Dangxiong Basin, the correlation was weak because cultivated land is sparse, and the temperature could not meet the requirements of agricultural production.
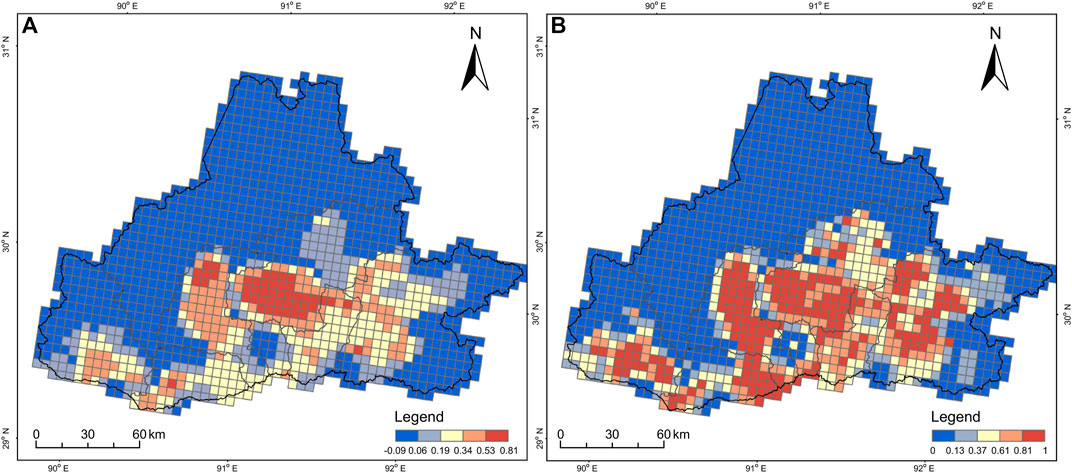
FIGURE 9. Correlation analysis of cultivated land and WRSIA by GWR. (A) Regression coefficient; (B) correlation coefficient.
3.3 Coupling analysis with land resource suitability
Agricultural production in Lhasa is restricted by topography, such as high altitude and steep slopes, which are unsuitable for agricultural production. We classified the suitability of slope and elevation, conducted spatial superposition with WRSIA, and analyzed the cultivated land density under different suitability levels of water and soil resources; the corresponding results are shown in Tables 3, 4. The slope suitability level was divided into five grades: highly suitable (0–2), moderately suitable (2–6), relatively suitable (6–15), slightly suitable (15–25), and unsuitable (>25), and the corresponding cultivated land proportions were 18.05%, 23.91%, 10.09%, 0.40%, and 0.00%, respectively, showing a decreasing trend with increasing slope. Among them, the proportion of the cultivated land in the highly suitable area was lower than that in the moderately suitable area, and mainly wetlands and construction lands were abundant. The proportion of the cultivated land increased with WRSIA in each slope suitability level. For example, in the relatively suitable slope area, the cultivated land proportion was 10.09% on an average, whereas the proportions in the five WRSIA grades were 24.63%, 17.55%, 6.16%, 2.25%, and 1.54%, respectively. Similarly, in each WRSIA grade, the cultivated land proportion decreased with increasing slopes. For example, in the relatively suitable WRSIA area, the average cultivated land proportion was 1.38%, whereas the proportions in the four slope grades were 10.99%, 6.16%, 0.93%, and 0.00%, respectively, without a highly suitable slope area. Overall, the coupling application of WRSIA and slope suitability appropriately explained the spatial distribution of cultivated land.
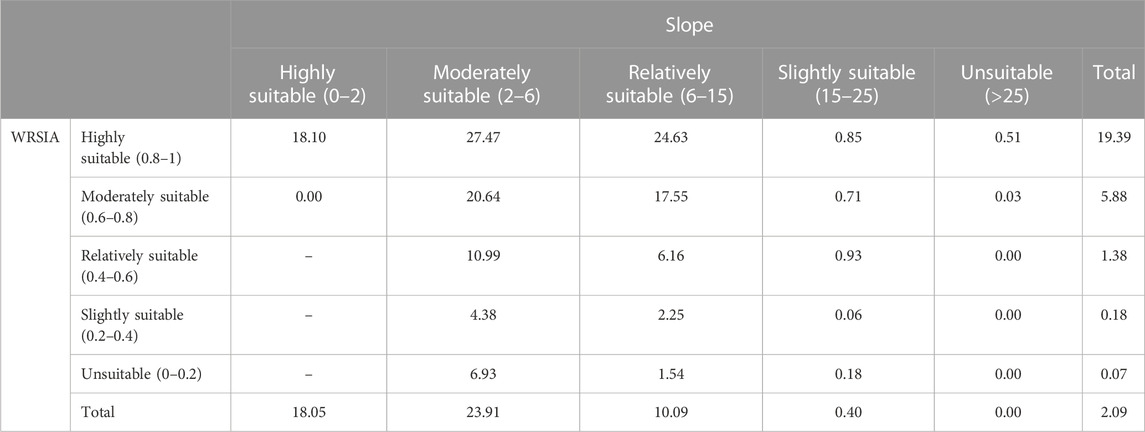
TABLE 3. Cultivated land proportions under different slope grades and WRSIA grades (%).
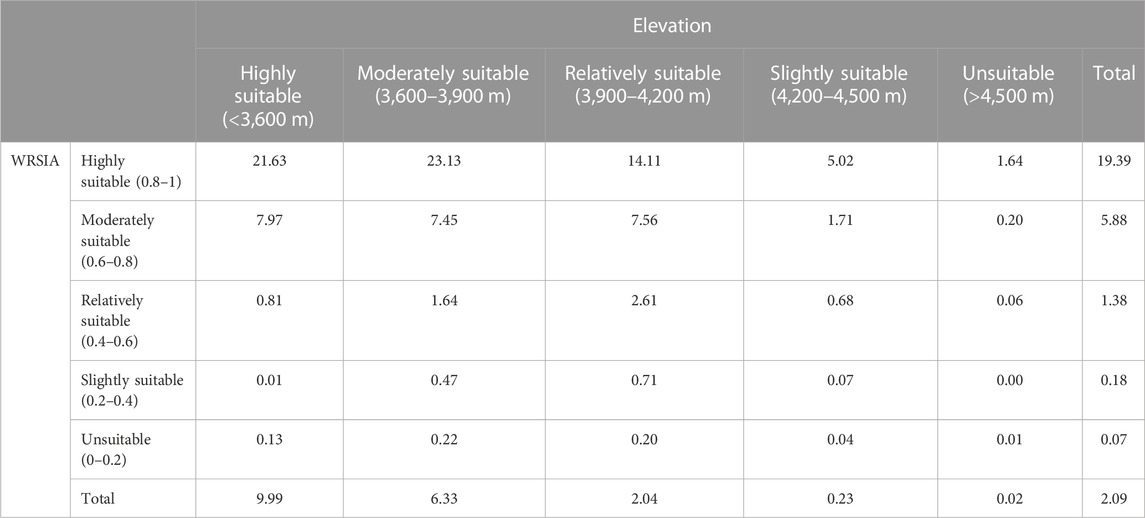
TABLE 4. Cultivated land proportions under different elevation grades and WRSIA grades (%).
Elevation is also an important factor affecting agricultural production in the Qinghai-Tibet Plateau because lower temperatures in high altitude areas limit crop growth (Xu et al., 2022). According to the climatic conditions required for crops growing in Lhasa, the elevation suitability for agricultural production was divided into five grades: highly suitable (<3,600 m), moderately suitable (3,600–3,900 m), relatively suitable (3,900–4,200 m), slightly suitable (4,200–4,500 m), and unsuitable (>4,500 m) and the respective cultivated land proportions were 9.99%, 6.33%, 2.04%, 0.23%, and 0.02%, respectively, indicating a decreasing trend with increasing elevation. In each suitability elevation level, the cultivated land proportion increased with WRSIA. For example, the average cultivated land proportion in a relatively suitable elevation area was 2.04%, whereas the ratios in five WRSIA grades were 14.11%, 7.56%, 2.61%, 0.71%, and 0.20%, respectively. Similarly, in each WRSIA grade, the cultivated land proportion decreased with increasing elevation. For example, the average cultivated land proportion in a moderately suitable WRSIA area was 5.88%, while the proportion in highly suitable, moderately suitable, relatively suitable, slightly suitable, and unsuitable elevation areas were 7.97%, 7.45%, 7.56%, 1.71%, and 0.20%, respectively. Thus, the coupling application of WRSIA and elevation effectively explained the spatial distribution of cultivated land.
4 Discussion
The ecosystem of the Qinghai Tibet Plateau is highly sensitive to anthropogenic activities and thus, it resources, environment, and spatial suitability require increased attention. The suitability of agricultural production and other anthropogenic activities is usually assessed by land resources, water resources, vegetation, and temperature. Previous studies have not considered water supply conditions; therefore, the identification results of suitable areas are extensive, thereby, limiting their application in agricultural development decision-making (You et al., 2020; Chen, 2022; Xu et al., 2022). Furthermore, although some studies have used water source distance to measure water supply convenience, the spatial difference in water supply convenience has not been effectively and accurately described (Xu et al., 2020). Figure 10 presents an enlarged map of WRSIA and cultivated land distribution. High level WRSIA values were largely distributed in Lhasa and Pengboqu River Valleys and sparsely distributed in other river valleys having poor topographic conditions. The distribution of cultivated land was consistent with the WRSIA distribution characteristics (Figure 10). The results showed that WRSIA could explain agricultural production conditions and was evidently applicable in this region. Based on IWSC, WRSIA indicated whether the water supply cost was within the acceptable range. In this study, the water lifting height and water diversion distance, which determine the water supply cost, were adopted for valleys with a steep slope. Therefore, the WRSIA results could suitably describe the convenience of water resources for agricultural production than conventional factors, such as water supply distance.

FIGURE 10. Partially enlarged view of (A) WRSIA and (B) cultivated land.
The constraints of water resources on agricultural production are mainly reflected in three aspects: whether the quantity of water resources is sufficiently abundant, whether the quality of water resources can be used for agriculture, and whether the engineering conditions for the development of irrigation are available. WRSIA focuses on the issue of engineering conditions. The spatial layout of agricultural production is an important research element in Territorial Spatial Planning carried out in China in recent years. In the mountainous regions of southern China, water resources are abundant, but they cannot be used to irrigate the arable land located halfway up the mountain. In the arid regions of Northwest China, where land resources are abundant, and water resources are insufficient, it is necessary to study areas that have low agricultural irrigation costs to develop a reasonable agricultural layout plan. In these areas, WRSIA can substantially improve the precision of evaluation and the accuracy of results, and in fact, the model has been practically applied in different areas with relatively good results. It is worth noting that indicators such as topography, soil, and temperature are equally crucial in the layout of agricultural production and need to be used along with WRSIA.
Regarding the availability of data, factors such as water conservation sensitivity, meteorological disasters, and climate change risks were excluded from the selection of indicators. Agricultural production in some regions is strongly influenced by the above factors and requires model correction. For example, some arid areas need to consider the factor of groundwater, and some areas need to incorporate the effect of the intra-annual distribution of precipitation on agricultural production, etc.
5 Conclusion
Based on the convenience of irrigation water supply and natural precipitation conditions, WRSIA was constructed in this study. Owing to topographical conditions, only 19.0% of the land area in Lhasa exhibited good irrigation and water supply conditions. Moreover, the over-all suitability of water resources for agricultural production was low because of insufficient natural precipitation, with the average value of the entire city being only 0.312. The statistical and spatial correlation analysis between the cultivated land and WRSIA in Lhasa showed that their spatial matching degree was relatively high. In the top 5% of the areas having the highest WRSIA, 50.8% and 25.0% of the total irrigated and non-irrigated cultivated lands, respectively were concentrated, accounting for 47.7% of the city’s total land. Additionally, the correlation analysis based on GWR showed that the cultivated land and WRSIA were strongly positively correlated (R2 = 0.904) in valley areas having concentrated cultivated land. On superimposing land resource elements (including slope and elevation), we found that the coupled application of water resources and land resource suitability explained the spatial distribution of cultivated land better. Therefore, WRSIA constructed in this study could appropriately represent the suitability of water resource conditions for agricultural production in Lhasa and can provide scientific support for future agricultural production planning in other Qinghai-Tibet Plateau regions.
Data availability statement
The data analyzed in this study is subject to the following licenses/restrictions: because it is the achievements of the Second National Land Survey in China. Requests to access these datasets should be directed to JL, bGlqaXV5aUBpZ3NucnIuYWMuY24=.
Author contributions
All authors contributed to the study conception and design. Material preparation, data collection, and analysis were performed by YL, JY, ZW, and YW. The manuscript was written mainly by YL, CW, JL, and LL. All authors commented on previous versions of the manuscript. All authors read and approved the final manuscript.
Funding
This research was funded by the National Key R&D Program of China (No. 2018YFD1100101) and the Second Tibetan Plateau Scientific Expedition and Research Program (No. 2019QZKK0401 and No. 2019QZKK0406).
Acknowledgments
We would like to thank Editage (www.editage.cn) for English language editing.
Conflict of interest
The authors declare that the research was conducted in the absence of any commercial or financial relationships that could be construed as a potential conflict of interest.
Publisher’s note
All claims expressed in this article are solely those of the authors and do not necessarily represent those of their affiliated organizations, or those of the publisher, the editors and the reviewers. Any product that may be evaluated in this article, or claim that may be made by its manufacturer, is not guaranteed or endorsed by the publisher.
References
Akıncı, H., Özalp, A. Y., and Turgut, B. (2013). Agricultural land use suitability analysis using GIS and AHP technique. Comput. Electron. Agric. 97, 71–82. doi:10.1016/j.compag.2013.07.006
Akpoti, K., Kabo-bah, A. T., and Zwart, S. J. (2019). Agricultural land suitability analysis: State-of-the-art and outlooks for integration of climate change analysis. Agric. Syst. 173, 172–208. doi:10.1016/j.agsy.2019.02.013
Al-Hanbali, A., Shibuta, K., Alsaaideh, B., and Tawara, Y. (2022). Analysis of the land suitability for paddy fields in Tanzania using a GIS-based analytical hierarchy process. Geo-Spat Inf. Sci. 25, 212–228. doi:10.1080/10095020.2021.2004079
Aldababseh, A., Temimi, M., Maghelal, P., Branch, O., and Wulfmeyer, V. (2018). Multi-criteria evaluation of irrigated agriculture suitability to achieve food security in an arid environment. Sustainability 10, 803. doi:10.3390/su10030803
Battisti, F., Campo, O., and Manganelli, B. (2022). Land Management in territorial planning: Analysis, appraisal, strategies for sustainability–A review of studies and research. Land 11, 1007. doi:10.3390/land11071007
Bozdağ, A., Yavuz, F., and Günay, A. S. (2016). AHP and GIS based land suitability analysis for Cihanbeyli (Turkey) County. Environ. Earth Sci. 75, 813. doi:10.1007/s12665-016-5558-9
Brunsdon, C., Fotheringham, A. S., and Charlton, M. E. (1996). Geographically weighted regression: A method for exploring spatial nonstationarity. Geogr. Anal. 28 (4), 281–298. doi:10.1111/j.1538-4632.1996.tb00936.x
Cai, L. C., Li, Z. W., You, Y. C., and Cao, H. (2021). Analysis of runoff changes in Lhasa River from 1956 to 2016 and the influencing factors. J. Water Resour. Water Eng. 32, 90–96. doi:10.11705/j.issn.1672-643X.2021
Caldana, N. FdS., Nitsche, P. R., Martelócio, A. C., Rudke, A. P., Zaro, G. C., Batista Ferreira, L. G., et al. (2019). Agroclimatic risk zoning of avocado (Persea americana) in the hydrographic basin of Paraná River III, Brazil. Agriculture 9, 263. doi:10.3390/agriculture9120263
Cao, X., Wu, M., Zheng, Y., Guo, X., Chen, D., and Wang, W. (2018). Can China achieve food security through the development of irrigation? Reg. Environ. Change. 18, 465–475. doi:10.1007/s10113-017-1214-5
Ceballos-Silva, A., and López-Blanco, J. (2003). Delineation of suitable areas for crops using a multi-criteria evaluation approach and land use/cover mapping: A case study in central Mexico. Agric. Syst. 77, 117–136. doi:10.1016/S0308-521X(02)00103-8
Chen, T. D. (2022). Distribution and agricultural suitability of alluvial fans in the Lhasa River Basin, Tibet. Shaanxi, China: Northwest A&F University.
Chen, Y., Yu, J., and Khan, S. (2010). Spatial sensitivity analysis of multi-criteria weights in GIS-based land suitability evaluation. Environ. Modell. Softw. 25, 1582–1591. doi:10.1016/j.envsoft.2010.06.001
Elliott, J., Deryng, D., Müller, C., Frieler, K., Konzmann, M., Gerten, D., et al. (2014). Constraints and potentials of future irrigation water availability on agricultural production under climate change. Proc. Natl. Acad. Sci. U.S.A. 111, 3239–3244. doi:10.1073/pnas.1222474110
Everest, T., Sungur, A., and Özcan, H. (2021). Determination of agricultural land suitability with a multiple-criteria decision-making method in Northwestern Turkey. Int. J. Environ. Sci. Technol.(Tehran) 18, 1073–1088. doi:10.1007/s13762-020-02869-9
Falloon, P., and Betts, R. (2010). Climate impacts on European agriculture and water management in the context of adaptation and mitigation—the importance of an integrated approach. Sci. Total Environ. 408, 5667–5687. doi:10.1016/j.scitotenv.2009.05.002
Feng, Z. M., Sun, T., Yang, Y. Z., and Yan, H. M. (2018). The progress of resources and environment carrying capacity: From single-factor carrying capacity research to comprehensive research. J. Resour. Ecol. 9, 125–134. doi:10.5814/j.issn.1674-764x.2018.02.002
Guo, H. (1989). The present situation, characteristics and development trend of agricultural regionalization abroad (serial). Agric. Reg. 10, 53–57.
Hagos, Y. G., Mengie, M. A., Andualem, T. G., Yibeltal, M., Linh, N. T. T., Tenagashaw, D. Y., et al. (2022). Land suitability assessment for surface irrigation development at Ethiopian highlands using geospatial technology. Appl. Water Sci. 12, 98. doi:10.1007/s13201-022-01618-2
Henseler, M., Wirsig, A., Herrmann, S., Krimly, T., and Dabbert, S. (2009). Modeling the impact of global change on regional agricultural land use through an activity-based non-linear programming approach. Agric. Syst. 100, 31–42. doi:10.1016/j.agsy.2008.12.002
Hsu, W. L., Shen, X., Xu, H., Zhang, C., Liu, H. L., and Shiau, Y. C. (2021). Integrated evaluations of resource and environment carrying capacity of the Huaihe River ecological and economic belt in China. Land 10, 1168. doi:10.3390/land10111168
Huang, B. W. (1958). Preliminary Draft of the Integrated Natural Zoning of China. Acta. Geogr. Sin 24, 348–365.
Joerin, F., Thériault, M., and Musy, A. (2001). Using GIS and outranking multicriteria analysis for land-use suitability assessment. Int. J. Geogr. Inf. Sci. 15, 153–174. doi:10.1080/13658810051030487
Lane, M. (2010). The carrying capacity imperative: Assessing regional carrying capacity methodologies for sustainable land-use planning. Land Use Pol. 27, 1038–1045. doi:10.1016/j.landusepol.2010.01.006
Li, G., Zhou, D., and Shi, M. (2019). How do farmers respond to water resources management policy in the Heihe River Basin of China? Sustainability 11, 2096. doi:10.3390/su11072096
Li, J. (2022). Evaluation methods for water resource suitability in territorial spatial planning: A case study of baiyin city in a semi-arid region. Int. J. Environ. Res. Public Health 19, 12973. doi:10.3390/ijerph191912973
Li, L., Zhu, G., Wu, D., Xu, H., Ma, P., Liu, J., et al. (2021). Land suitability assessment for supporting transport planning based on carrying capacity and construction demand. PLOS ONE 16, e0246374. doi:10.1371/journal.pone.0246374
Li, S. (1988). Agroclimatic resources and agroclimatic regions in China row. Beijing, China: Science Press.
Li, S., Zhao, X., Pu, J., Miao, P., Wang, Q., and Tan, K. (2021). Optimize and control territorial spatial functional areas to improve the ecological stability and total environment in karst areas of Southwest China. Land Use Pol. 100, 104940. doi:10.1016/j.landusepol.2020.104940
Liu, X. Z., Zhang, G. Q., Yang, W. T., Wu, Y. R., Li, C. K., and Ren, Y. (2022). Analysis of temporal and spatial distribution characteristics and influencing factors of PM2.5 and O3 concentrations in Chang-Zhu-Tan urban agglomeration. Environ. Sci. 43, 5354–5366. doi:10.13227/j.hjkx.202201247
Liu, Y., and Zhou, Y. (2021). Territory spatial planning and national governance system in China. Land Use Pol. 102, 105288. doi:10.1016/j.landusepol.2021.105288
Lv, P., and Zhen, H. (2010). Research on influencing factors and spatial laws of residential land prices in Beijing based on GWR model. Econ. Geogr. 30, 472–478. doi:10.15957/j.cnki.jjdl.2010.03.018
Masupha, T. E., Moeletsi, M. E., and Mpandeli, S. (2016). Drought analysis on maize in the Luvuvhu River ccatchment. South Africa2nd World Irrigation Forum. (WIF2).
Özkan, B., Dengiz, O., and Turan, İ. D. (2020). Site suitability analysis for potential agricultural land with spatial fuzzy multi-criteria decision analysis in regional scale under semi-arid terrestrial ecosystem. Sci. Rep. 10, 22074. doi:10.1038/s41598-020-79105-4
Pang, R. Q., Teng, F., and Wei, Y. (2014). Analysis of the dynamic mechanism of population urbanization in Jilin Province based on geographically weighted regression. Geogr. Sci. 34, 1210–1217. doi:10.13249/j.cnki.sgs.2014.10.012
Roy, S., Singha, N., Bose, A., Basak, D., and Chowdhury, I. R. (2022). Multi-influencing factor (MIF) and RS–GIS-based determination of agriculture site suitability for achieving sustainable development of Sub-Himalayan region, India. Environ. Dev. Sustain. doi:10.1007/s10668-022-02360-0
Shaloo , , Singh, R. P., Bisht, H., Jain, R., Suna, T., Bana, R. S., et al. (2022). Crop-suitability analysis using the analytic hierarchy process and geospatial techniques for cereal production in North India. Sustainability 14, 5246. doi:10.3390/su14095246
Shen, L., Shu, T., Liao, X., Yang, N., Ren, Y., Zhu, M., et al. (2020). A new method to evaluate urban resources environment carrying capacity from the load-and-carrier perspective. Resour. Conserv. Recycl. 154, 104616. doi:10.1016/j.resconrec.2019.104616
Shen, Y., and Li, C. (1983). Preliminary study on land type structure and agricultural comprehensive natural regionalization – a case study of Beijing. Geogr. Res. 11–22.
Shen, Y., Xie, X., and Yang, L. (1982). Land types and agricultural regionalization in changping county, beijing. geogr. Sci, 221–231+292.
Shi, W., Hu, Y., Shi, X., Wang, Z., Yan, H., Xu, Z., et al. (2016). Strategic transformation of regionalization for the agricultural comprehensive development: The example of Ningxia Hui Autonomous Region in China. J. Geogr. Sci. 26, 1675–1688. doi:10.1007/s11442-016-1352-6
Silva, V. d. P. Rd, Oliveira, S. Dd, Santos, C. A. Cd., and Silva, M. T. (2013). Risco climático da cana-de-açúcar cultiva-da na região nordeste do Brasil. Rev. Bras. Eng. Agríc. Ambient. 17, 180–189. doi:10.1590/S1415-43662013000200009
Singh, R., Behera, M. D., Das, P., Rizvi, J., Dhyani, S. K., and Biradar, Ç. M. (2022). Agroforestry suitability for planning site-specific interventions using machine learning approaches. Sustainability 14, 5189. doi:10.3390/su14095189
Sun, S. A., Ren, Y. F., and Zhang, Q. (2019). A multi-scale perspective on water scarcity assessment in Tibetan Plateau. Geogr. Inf. Sci. 21, 1308–1317. doi:10.12082/dqxxkx.2019.180510
Taghizadeh-Mehrjardi, R., Nabiollahi, K., Rasoli, L., Kerry, R., and Scholten, T. (2020). Land suitability assessment and agricultural production sustainability using machine learning models. Agronomy 10, 573. doi:10.3390/agronomy10040573
Tang, Q. Y., Xu, W., and Ai, F. L. (2012). Research on the spatial differentiation of housing prices in Shanghai based on geographic weighted regression and its influencing factors. Econ. Geogr. 32, 52–58. doi:10.15957/j.cnki.jjdl.2012.02.009
Tao, H., and Chen, T. (2014). Literature review on agricultural regionalization theory and practice research. Chin. J. Agr. Resour.Reg. Plan. 35, 59–66.
Tian, Z., Zheng, D., and Wang, Y. (2008). Discussion on the evaluation, development and utilization of climate resources in beijing mountainous area. Beijing, China: Meteorological Publishing House.
Wang, Z. (2018). Land spatial development based on carrying capacity, land development potential, and efficiency of urban agglomerations in China. Sustainability 10, 4701. doi:10.3390/su10124701
Wienhold, B. J., Power, J. F., and Doran, J. W. (2000). Agricultural accomplishments and impending concerns. Soil Sci. 165, 13–30. doi:10.1097/00010694-200001000-00004
Xu, C. J., Jin, S. M., and Wang, Y. (2020). Natural suitability evaluation of human settlements in Qinghai-Tibet Plateau based on GIS. Ecol. Sci. 39, 93–103.
Xu, Y., Wang, L. J., and Yang, H. (2022). Evaluation method and empirical application of suitability of land resources for human activities on the Qinghai-Tibet Plateau. Acta. Geogr. Sin. 77, 1615–1633.
Yalew, S. G., van Griensven, A., and van der Zaag, P. (2016). AgriSuit: A web-based GIS-MCDA framework for agricultural land suitability assessment. Comput. Electron. Agric. 128, 1–8. doi:10.1016/j.compag.2016.08.008
Yang, Y., Feng, Z., and Liu, B. (2005). Study on the balance of agricultural water resources in the counties of Northwest China. J. Nat. Resour. 20, 347–353.
You, Z., Feng, Z. M., Yang, Y. Z., Shi, H., and Li, P. (2020). Evaluation of human settlement environmental suitability in Tibet based on gridded data. Resour. Sci. 42, 394–406. doi:10.18402/resci.2020.02.17
Zhang, G., Luo, S., Jing, Z., Wei, S., and Ma, Y. (2020). Evaluation and forewarning management of regional resources and environment carrying capacity: A case study of hefei city, anhui province, China. Sustainability 12, 1637. doi:10.3390/su12041637
Zhang, L., Dawes, W. R., and Walker, G. R. (2001). Response of mean annual evapotranspiration to vegetation changes at catchment scale. Water Resour. Res. 37, 701–708. doi:10.1029/2000WR900325
Zhang, L., Hickel, K., Dawes, W. R., Chiew, F. H. S., Western, A. W., and Briggs, P. R. (2004). A rational function approach for estimating mean annual evapotranspiration. Water Resour. Res. 40. doi:10.1029/2003WR002710
Zhang, Q., Liu, L., and Zhou, X. (2007). Overview of foreign agricultural industrial belt and its enlightenment to China. Chin. Agron. Bull. 23, 437–441.
Zhang, X., Li, X., and Du, J. (2009). A review of the research on agricultural climatic resources regionalization. J. Jiangxi Agric. 21, 120–122. doi:10.19386/j.cnki.jxnyxb.2009.07.039
Zhang, Y., Liang, C., Zhao, L., Guan, Y., Jiang, S., Zhan, C., et al. (2022). Risk analysis of natural water resources scarcity based on a stochastic simulation model in the hilly area of southwest China. Stoch. Environ. Res. Risk Assess. 36, 33–49. doi:10.1007/s00477-021-02037-6
Zhu, G., Wang, M., Li, Q., Liu, J., Zhao, Y., Gao, J., et al. (2022). Land development suitability analysis for transport planning evaluation and optimization in mountainous ecological region. J. Mt. Sci. 19, 862–873. doi:10.1007/s11629-021-6965-2
Keywords: water resource suitability index for agricultural production (WRSIA), irrigation water supply convenience (IWSC), cultivated land, geographically weighted regression (GWR), Lhasa
Citation: Liu Y, Wang Z, Wang C, Wang Y, Li J and Liang L (2023) Construction of a water resource suitability index for agricultural production and matching analysis of cultivated land in Lhasa, Tibet. Front. Environ. Sci. 11:1130269. doi: 10.3389/fenvs.2023.1130269
Received: 23 December 2022; Accepted: 01 March 2023;
Published: 10 March 2023.
Edited by:
Buddhi Wijesiri, Queensland University of Technology, AustraliaReviewed by:
Sarita Gajbhiye Meshram, WRAM Research Lab Pvt. Ltd., IndiaXiang Zhang, China University of Geosciences Wuhan, China
Copyright © 2023 Liu, Wang, Wang, Wang, Li and Liang. This is an open-access article distributed under the terms of the Creative Commons Attribution License (CC BY). The use, distribution or reproduction in other forums is permitted, provided the original author(s) and the copyright owner(s) are credited and that the original publication in this journal is cited, in accordance with accepted academic practice. No use, distribution or reproduction is permitted which does not comply with these terms.
*Correspondence: Jiuyi Li, bGlqaXV5aUBpZ3NucnIuYWMuY24=