 Jiawei Li
 Zhisheng Zhang4*
 Jun Tao
 Yuepeng Pan
 Li Luo
- 1Key Laboratory of Regional Climate-Environment for Temperate East Asia (RCE-TEA), Institute of Atmospheric Physics, Chinese Academy of Sciences, Beijing, China
- 2University of Chinese Academy of Sciences, Beijing, China
- 3State Key Laboratory of Marine Resource Utilization in South China Sea, Hainan University, Haikou, China
- 4South China Institute of Environmental Sciences, Ministry of Ecology and Environment, Guangzhou, China
- 5Institute for Environmental and Climate Research, Jinan University, Guangzhou, China
- 6State Key Laboratory of Atmospheric Boundary Layer Physics and Atmospheric Chemistry (LAPC), Institute of Atmospheric Physics, Chinese Academy of Sciences, Beijing, China
The impact of biomass burning (BB) emissions on concentrations and depositions of major aerosol components in the northern South China Sea (NSCS) region (105∼115°E and 15∼21°N) from December 2020 to April 2021 has been investigated using the WRF-chem model (weather research and forecasting model coupled with chemistry) in combination with aerosol composition measurement at a mountain site in the Hainan Island of China. Model comparisons with observations in Hainan demonstrated the effectiveness of WRF-chem in simulating aerosol components (PM2.5, black carbon (BC), organic matter (OM), sulfate, nitrate, and ammonium) in the NSCS region. The influences of BB emissions were significant on near-surface PM2.5, BC, and OM but nearly negligible on secondary inorganic components (i.e., sulfate, nitrate, and ammonium). The NSCS regional and period mean PM2.5, BC, and OM concentrations were 17.2 μg/m3, 0.65 μg/m3, and 6.7 μg/m3, in which 20%, 13%, and 35%, respectively, were from BB emissions. The mean PM2.5, BC, and OM deposition fluxes were 73.8 mg/m2/month, 2.9 mg/m2/month, and 29.3 mg/m2/month, respectively, and 22%, 15%, and 38% of these depositions were from BB emissions. Dry deposition dominated the removal of aerosols. For both aerosol concentrations and depositions, the influences of BB emissions exhibited evidently larger contributions in spring (March and April) than those in winter (December to February). Most of the BB emissions were from mainland Southeast Asia (MSEA), in terms of period mean, 79%, 72%, and 81% of the BB PM2.5, BB BC, and BB OM concentrations and 82%, 77%, and 83% of their depositions in the NSCS region were attributed to the MSEA region. The results of this study suggested that BB emissions have strong implications for air quality and biogeochemical cycle of the NSCS region.
1 Introduction
Atmospheric aerosols have crucial effects on air quality, climate, and human health (Lee et al., 2017; Butt et al., 2020; IPCC, 2021). Open biomass burning (BB) resulting from either natural or human activity is a major source of aerosols and trace gases that can alter the atmospheric composition (Souri et al., 2017; van der Werf et al., 2017). For aerosols such as black carbon (BC) and organic carbon (OC), biomass burning is the dominant source (Andreae, 2019); according to the estimate by Bond et al. (2013), biomass burning accounted for 59% of BC emissions and 85% of primary organic aerosol (POA) emissions on a global scale. The large BB emissions degraded air quality over source areas (Vongruang and Pimonsree, 2020; Marvin et al., 2021). Large amounts of BB aerosols injected into the atmosphere disturbed radiation balance and further affected weather and climate over source and downwind areas (Koren et al., 2004; Andreae and Rosenfeld, 2008; Rosenfeld et al., 2014).
Studies concerning emissions, physio-chemical properties, and environmental and climatic impacts of BB aerosols have been conducted in the past decades (Crutzen and Andreae, 1990; van der Werf et al., 2017; Andreae, 2019; Tao et al., 2020). Biomass burning frequently occurred in tropical and subtropical regions. Southeast Asia is one of the major sources of open biomass burning, and the wildfires are most active in the dry season from February to April (Wiedinmyer et al., 2011; Thepnuan et al., 2019). BB aerosols degraded air quality in Southeast Asia by contributing 31%–73% of springtime PM10 (Vongruang and Pimonsree, 2020) and were responsible for nearly all the low-visibility events in Southeast Asia (Lee et al., 2017). The chemical analysis of fine particles (PM2.5) collected in the dry season of 2016 in northern Thailand showed that OC from biomass burning was the largest component of PM2.5 (Thepnuan et al., 2019). The mass absorption efficiency of carbonaceous aerosols during BB events in Southeast Asia were analyzed and found to be evidently larger than those in other cities worldwide (Tao et al., 2020). The thermal effect and the dynamic forcing resulting from mountain lee-side effect uplifted the BB aerosols to above 3 km and transported them downwind to south China and even the whole of East Asia by westerly winds (Lin et al., 2009). Thus, aerosols and pollutants from biomass burning events exhibited significant impacts on vast downwind areas such as affecting atmospheric chemical processes and ozone production (Tang et al., 2003; Deng et al., 2008), degrading regional air quality (Fu et al., 2012; Huang et al., 2013), reducing aerosol optical depth (AOD) and radiation transfer (Lin et al., 2014; Liang et al., 2019), and affecting aerosol-cloud interactions (Ding et al., 2021).
The aforementioned studies have improved understandings of BB aerosols from Southeast Asia on aspects of emission and impacts. However, previous studies mainly focused on impacts of BB aerosols on air quality, radiation budget, or climatic effects; only a few of them were concerned about the influences of BB emissions on atmospheric depositions to oceans (Guieu et al., 2005; Sen and Bernhard 2012; Wagner et al., 2021; Wang et al., 2021). BB aerosols mainly consist of carbonaceous components. It is known that carbonaceous components have profound impacts on marine ecosystems (Lønborg, et al., 2020) such as affecting the enrichment of dissolved organic carbon and dissolved inorganic carbon in sea water (LaRowe et al., 2020) and disturbing phytoplankton (Wang et al., 2021). The degradation of organic carbon influences the recycling of inorganic carbon and nutrients and the production of methane (LaRowe et al., 2020). Changes in dissolved organic carbon can result in alterations in air–sea exchange of carbon dioxide and have potential impacts on global carbon cycle and feedbacks to global change (Lønborg, et al., 2020). Recent studies showed that the atmospheric depositions of carbonaceous aerosols as an input of carbon into oceans were able to provide additional nutrients to phytoplankton, changing chemical compositions of dissolved carbon, and exhibiting evident or even significant effects on biogeochemical cycle in marine environment (Mari et al., 2019; Lønborg, et al., 2020; Yamashita et al., 2022). Wagner et al. (2021) suggested that wildfire exhibited immediate impacts on coastal biogeochemistry due to atmospheric deposition because they found that the dissolved BC concentrations in surface sea water increased notably beneath the smoke plume of a wildfire in California, United States. Ardyna et al. (2022) suggested that wildfire aerosol deposition likely amplified summertime Arctic phytoplankton bloom. The aforementioned studies suggested the importance and need for conducting studies concerning the impacts of depositions from biomass burning emissions on ocean environment.
For previous studies concerning BB events in Southeast Asia, most of them placed their focuses on source and surrounding regions such as northern Southeast Asia and southwest China (Pani et al., 2019; Zhou et al., 2020) or downwind East Asia far away from the sources (such as northwestern Pacific) (Huang et al., 2013; Lin et al., 2014; Wang et al., 2021); few studies concern the midway oceanic region of the long-range transport of BB aerosols over the northern South China Sea (NSCS) region. For the NSCS region which is located next to the major BB source region of Southeast Asia, the understandings of the impacts of BB emissions on air quality and atmospheric depositions in this region are still insufficient due to lack of previous continuous observations. Considering the importance of BB emissions on air quality and atmospheric depositions and the limited knowledge about the BB effects on NSCS region, conducting a study to explore these issues is meaningful.
Hainan Island lies in the NSCS region and to the east of mainland Southeast Asia (MSEA) (Figure 1). It is midway of the long-range transport of BB aerosols from the MSEA to downwind East Asia when westerlies prevailed in winter and spring. In this work, the weather–chemistry-coupled model WRF-chem (version 4.1.5) in combination with in situ measurements have been applied to investigate the impacts of BB emissions on concentrations and atmospheric depositions of aerosols over the NSCS region (105∼115°E and 15∼21°N, dashed area in Figure 1). The study period is December 2020 to April 2021 when aerosol component concentrations were sampled at a background mountain site in Hainan (Wuzhi Mountain, Figure 1). These continuous measurements provide valuable datasets for model evaluation and analysis. During this period, BB events in the MSEA region were active which resulted in strong BB emissions; in the meantime, moderate BB emissions were also found in south China (Figure 1). Results of this study will provide insights into the influence of BB aerosols on the NSCS region.
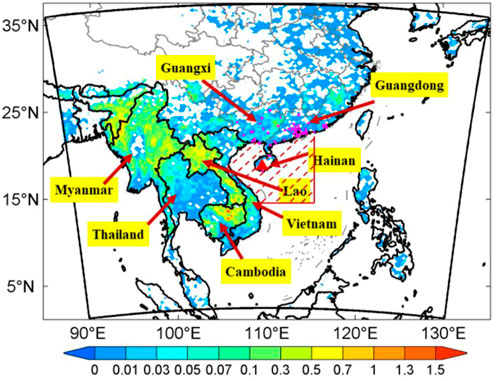
FIGURE 1. Model domain, period mean (December 2020 to April 2021) biomass burning organic carbon emission flux (μg/m2/s) (shaded contour) from the FINN dataset, and observation sites (red triangle: the Wuzhi Mountain site, pink dots: routine observation sites of China National Environmental Monitoring Centre in Hainan, Guangdong, and Guangxi provinces). The dashed area indicates the northern South China Sea (NSCS) region.
2 Model and data
2.1 Model description
The WRF-chem model was used to investigate the impact of BB emissions on the NSCS region for a 5-month period from December 2020 (winter) to April 2021 (spring). The simulation began on 26 November 2020 and ended on 30 April 2021, with the first 5 days as model spin-up. The model domain was configured at a resolution of 25 km with 191 west-to-east grid points and 161 south-to-north grid points. The domain centered at Hainan Island and covered most areas of the mainland Southeast Asia (Myanmar, Thailand, Laos, Vietnam, Cambodia, and western Malaysia), south China, and most areas of the South China Sea (Figure 1). Totally, 30 vertical layers stretched unevenly from surface to 100 hPa with the lowest model layer being about 33 m above ground.
The 2005 Carbon Bond (CB05) mechanism (Yarwood et al., 2005) coupled with the Modal Aerosol Dynamics Model for Europe (MADE) (Ackermann et al., 1998) was adopted to represent the gas and aerosol chemical processes in the atmosphere. A volatility basis set (VBS) sub-module was embedded in the MADE module for secondary organic aerosol (SOA) modeling (Wang et al., 2015). The aerosol size distribution of submicrometer aerosol was represented by Aitken mode, accumulation mode, and coarse mode assuming a log-normal distribution within each mode. Aerosol processes such as nucleation, condensation, coagulation, deposition, and chemical transformation were considered. Major primary and secondary aerosol types such as sulfate, nitrate, ammonium, chloride, sodium, EC, POC, SOC, and other inorganic matter were treated.
Physical options used in this study included the Morrison 2 moments scheme (Morrison et al., 2005) for cloud microphysics, the Grell ensemble cumulus scheme (Grell and Dévényi, 2002) for cumulus parameterization, the rapid radiation transfer model for general circulation models (RRTMG) (Clough et al., 2005) for shortwave and longwave radiation transfer calculation, the Yonsei University (YSU) scheme (Hong et al., 2006) for planetary boundary layer (PBL) parameterization, and the community land model version 4 (CLM4) (Oleson et al., 2010) for land-surface processes.
NCEP GDAS/FNL 0.25-degree global tropospheric analyses and forecast grid data were used to provide initial and boundary conditions for meteorological variables during the simulation (NCEP, 2015). Simulation results from the whole atmosphere community climate model (WACCM) (Gettelman et al., 2019) were used as chemical initial and boundary conditions for trace gases and aerosols. Both meteorological and chemical boundary conditions have a temporal resolution at 6-hour intervals.
2.2 Emission inventories
Anthropogenic emissions within the study domain were derived from two sources: Monthly emission inventories with the base year of 2020 from the MEIC (multi-resolution emission inventory for china) model (Zheng et al., 2021) were applied to China, and monthly emission inventories from the EDGARv5.0 (emissions database for global atmospheric research version 5.0) dataset (Crippa et al., 2019) were applied to areas outside China. All the anthropogenic emission inventories have a horizontal resolution of 0.25°. Emission species include sulfur dioxide (SO2), nitrogen oxides (NOx), non-methane volatile organic compounds (VOC), carbon monoxide (CO), ammonia (NH3), BC, OC, and primary PM2.5 and PM10.
Biogenic emissions from vegetation were calculated online by the MEGAN (model of emissions of gases and aerosols from nature) (Guenther et al., 2006) embedded in WRF-chem.
Emissions of aerosols and trace gases from open BB which includes wildfires, agricultural residual burning, and prescribed burning were derived from the fire inventory from NCAR (FINN) (Wiedinmyer et al., 2011). FINN has a spatial resolution of 1 km and a temporal resolution of 1 hour. It is developed based on satellite-retrieved fire data, so the spatial distributions and monthly variations of BB emissions from FINN are consistent with satellite-retrieved fire counts (Supplementary Figure S1). It is widely used for regional and global simulation studies of biomass burning (Reddington et al., 2019; Vongruang and Pimonsree, 2020). Notably, compared with other biomass burning emission inventories (such as the Global Fire Emissions Database, GFED), BB emissions from the FINN inventory are higher in the MSEA region (Liu et al., 2020; Ferrada et al., 2022). Several modeling studies using different model systems have shown that simulation results with the FINN inventory were better than those with other inventories compared to observations in the MSEA region in terms of magnitudes, annual trends, and seasonal variations (Takami et al., 2020; Reddington et al., 2021; Xing et al., 2021). This suggests that the use of FINN is suitable in this study.
2.3 Simulation experiments
The simulation period is 26 November 2020 to 30 April 2021 with the first 5 days as model spin-up. To evaluate the impact of BB emissions within the domain on atmospheric environment over the NSCS region, two simulation scenarios were designed, namely, BASE and NOBB. The BASE case was run with all anthropogenic, biogenic, and BB emissions being activated, while the NOBB case was run without BB emissions. To assess the influence of BB emissions from different source regions, such as mainland Southeast Asia (MSEA) and China itself, an additional sensitivity test called NOBB_CN was conducted in which BB emissions within China were shut off. Contributions of BB emissions from different sources can be calculated as follows:
where Cntr_BB represents the contributions of BB emissions from all sources, Cntr_BBCN represents the contributions of BB emissions from sources in China, and Cntr_BBSEA means the contributions of BB emissions from sources other than China (mostly from MSEA).
2.4 Observations
Several observations of aerosol component concentrations were used for model evaluation and BB emissions contribution analyses in this study.
PM2.5 samples were continuously collected by two sequential ambient particle samplers (PMS-200, Focused Photonics Inc., China) from 9 December 2020 to 14 April 2021 at the national atmosphere background monitoring station (109.49°E, 18.84°N, 958 m above sea level) at the Wuzhi Mountain in central Hainan Island (Figure 1). The samplers were operated at a flow rate of 16.7 L/min, which were calibrated before sampling. Samples were collected on two types of filters which were 47-mm quartz filter and Teflon filters. Sampling duration was set for 48 h as low particle loading at the background site. Four field blanks were collected in this study. The collected samples and blanks were stored at −18°C before weighing and chemical analysis. PM2.5 mass concentrations were determined by weighing filters using a Sartorius MC5 electronic microbalance (±1 μg, Sartorius, Germany). Filters were equilibrated for 24 h before weighing under constant conditions (temperature, 23°C ± 1°C; relative humidity, 40% ± 5%) and weighed at least three times before and after sampling.
A portion of each quartz filter (0.526 cm2) was punched and used to determine the carbonaceous species (i.e., total carbon, TC; organic carbon, OC; and elemental carbon, EC) (EC is considered equivalent to BC in this study) using a DRI aerosol carbon analyzer (model 2001, Atmoslytic Inc., CA, United States) following the IMPROVE thermal/optical reflectance protocol (Cao et al., 2004; Tao et al., 2017). Water extract solutions forming quartz filter samples were also used to determined water-soluble inorganic ions and anhydrosugars. A small round portion (1.33 cm2) from each quartz filter was extracted using 2.0 mL deionized water in a pre-baked glass bottle under ultrasonic agitation for 60 min. The filter extracts were filtered through Teflon syringe filters to remove insoluble materials. The cations (Na+, NH4+, K+, Ca2+, and Mg2+) were quantified using ion chromatography (Dionex ICS-1600) via a Dionex Ionpac CS12 analytical column with a CG12 guard column. The anions (Cl−, NO3−, and SO42-) were determined using ion chromatography as well (Dionex ICS-2100) with a Dionex Ionpac AS19 analytical column with an AG19 Guard column. For more detailed information, our previous study can be referred (Zhang et al., 2017).
Observations of hourly PM2.5, PM10, CO, SO2, NO2, and O3 concentrations in three south China provinces (Hainan, Guangdong, and Guangxi) surrounding the South China Sea were derived from the China National Environmental Monitoring Centre (CNEMC) (http://www.cnemc.cn/). Observations were collected from 158 sites, of which six sites were in two cities in Hainan province, 102 sites were in 21 cities in Guangdong province, and 50 sites were in 14 cities in Guangxi province. Locations of all 37 cities are marked in Figure 1.
3 Results and discussion
3.1 PM2.5 observation at background atmosphere
The average PM2.5 mass concentration at Wuzhi Mountain site was 10.8 μg/m3 during the study period, which was lower than the class I level of national ambient air quality standard in China (i.e., 15 μg/m3). The PM2.5 concentration substantially fluctuated, ranging from 2.85 to 37.3 μg/m3. However, it can be easily seen that its concentration was significantly higher from December to January than from February to April when several peaks occurred. Organic matter (OM), sulfate, ammonium, nitrate, and BC were the dominant components of PM2.5, which accounted for 34.3%, 32.6%, 6.9%, 6.1%, and 4.8% of PM2.5 mass on average, respectively.
In terms of inorganic ions, the variations of sulfate and ammonium were very similar to the PM2.5 (Figure 2). In winter, sulfate at Hainan was significantly affected by emissions from mainland China under the influence of the East Asian winter monsoon, which was supported by a previous study (Ying et al., 2014). It resulted in higher sulfate concentration in December and January. Ammonium is usually associated with sulfate in fine particles through ammonia reacting with sulfuric acid in the atmosphere. Thus, ammonium concentration was highly correlated with sulfate in this study. In addition to sulfate, particulate ammonium was also presented in the form of ammonium nitrate. However, ammonium nitrate is an unstable compound, which is easily dissociated into gaseous ammonia and nitric acid. It tends to present in the particle form under low temperature and high relative humidity condition. As a result, nitrate in fine particle was detected in higher levels in winter, while in a substantial low concentration after February.
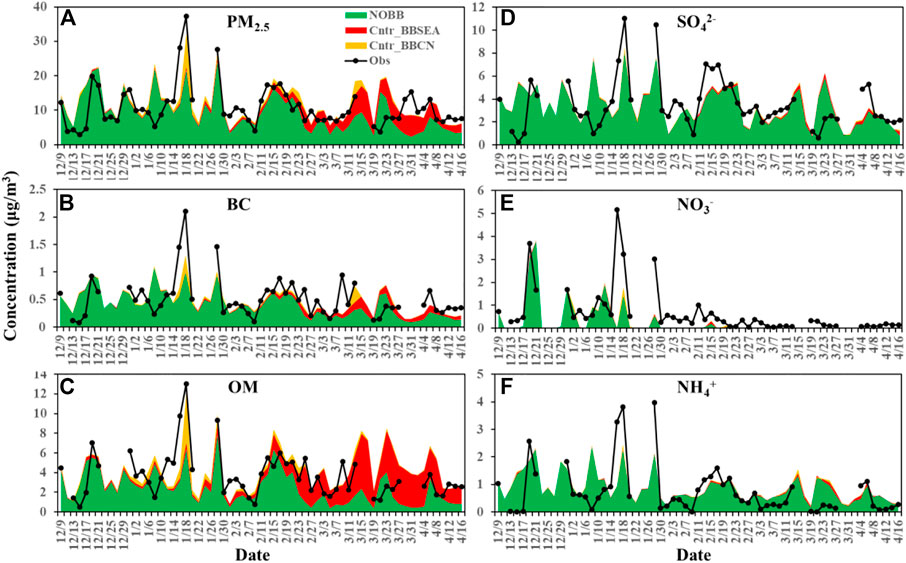
FIGURE 2. Model comparisons with measurements of daily concentrations of (A) PM2.5, (B) BC, (C) OM, (D) sulfate (SO42-), (E) nitrate (NO3−), and (F) ammonium (NH4+) at the Wuzhi Mountain site. Black dotted lines are observations, colored shadings are corresponding simulations attributed to anthropogenic sources (NOBB, green), biomass burning emissions from mainland Southeast Asia (Cntr_BBSEA, red), and biomass burning emissions from China (Cntr_BBCN, orange). Blanks are missing observations.
As for carbonaceous species, the average OC and BC concentrations were 1.77 and 0.52 μg/m3. The OM could be estimated by multiplying the OC by a factor of 1.8 for non-urban aerosols (Turpin and Lim, 2001), which were 3.71 μg/m3 on average. The temporal variation patterns of carbonaceous species were consistent with the PM2.5 (Figure 2). The correlation between OM and BC were strong (R2 = 0.92), indicating they might have common sources.
3.2 Model evaluation
Model-simulated aerosol component concentrations including PM2.5, BC (also referred to EC), OM, sulfate, nitrate, and ammonium were compared with observations at the Wuzhi Mountain, and the comparison results are shown in Figure 2. In general, the model simulated PM2.5 concentration at the Wuzhi Mountain site well in terms of magnitude and variation, capturing the observed peak on January 18 and the second peak on January 28 (Figure 2A). The model performances for BC (Figure 2B) and OM (Figure 2C) were also reasonably good; however, the model underpredicted the BC peaks on January 18 and 28 and overpredicted the OM concentrations from late March to early April. For the modeled OM bias from March to April, uncertainties in the used biomass burning emission inventory (FINN) could be a reason. As mentioned previously, BB emissions from the FINN inventory are higher than those from other inventories in the MSEA region (Liu et al., 2020). The OC and VOC (the precursors of secondary organic aerosols) emissions from FINN may be overestimated and thus lead to the overestimated OM in March and April. In addition, it is noticed that all aerosol components except nitrate on March 22–25 were overestimated at the observation site, which could be caused by the mispredicted winds by the model. Although the modeled OM had a high bias, the model performances for BC and PM2.5 were not degraded in March and April because their simulated concentrations were reasonable compared to observations (Figures 2A, B). For secondary inorganic aerosol components, the model reasonably simulated the magnitude and temporal variation of sulfate (Figure 2D) but tended to underpredict nitrate concentrations after mid-January (Figure 2E). Compared with sulfate, nitrate was more chemically active due to its semi-volatile nature which complicated its chemical processes. Current regional atmospheric chemical model still has difficulty in correctly representing the complex chemical processes related to nitrate formation. This was reported by a recent model intercomparison study which showed large uncertainties in nitrate simulation in East Asia by current weather–chemistry-coupled models (Gao et al., 2018). The modeled ammonium concentration resembled that of sulfate in terms of temporal variation (Figure 2F) because ammonium mainly existed as ammonium sulfate at the mountain areas of Hainan (Zhu et al., 2016).
Table 1 summarizes the model-observation comparison statistics at the Wuzhi Mountain site. Results from the BASE simulation were used. On average, the observed PM2.5 concentration was 10.83 μg/m3, and the corresponding simulation (BASE) was 11.99 μg/m3, with correlation coefficient (R) of 0.61 and normalized mean bias (NMB) of 11%. The mean observation, mean simulation, R, and NMB for BC were 0.52 μg/m3, 0.50 μg/m3, 0.60, and −4%, respectively, and the statistics for OM were 3.71 μg/m3, 4.27 μg/m3, 0.59, and 15%, respectively. For sulfate, the modeled mean concentration (3.53 μg/m3) was almost identical to the observation (3.53 μg/m3) with an R of 0.48. The modeled nitrate concentration was 0.35 μg/m3 which was 47% lower than the observation of 0.66 μg/m3. Mean ammonium concentration was 0.75 μg/m3 from observation and 0.93 μg/m3 from simulation with an R of 0.57 and NMB of 24%. Also listed in Table 1 are statistics from the NOBB simulation. It is found that in the NOBB experiment, the model comparison statistics for PM2.5, BC, and OM were evidently affected, while those for sulfate, nitrate, and ammonium were slighted influenced. The NMBs of PM2.5, BC, and OM from the NOBB experiment were −13%, −18%, and −32%, respectively, which indicated somewhat larger model-observation biases than that by the FULL experiment. The generally better statistics from the FULL simulation suggested the necessity of including BB emissions in simulating aerosol components in Hainan.
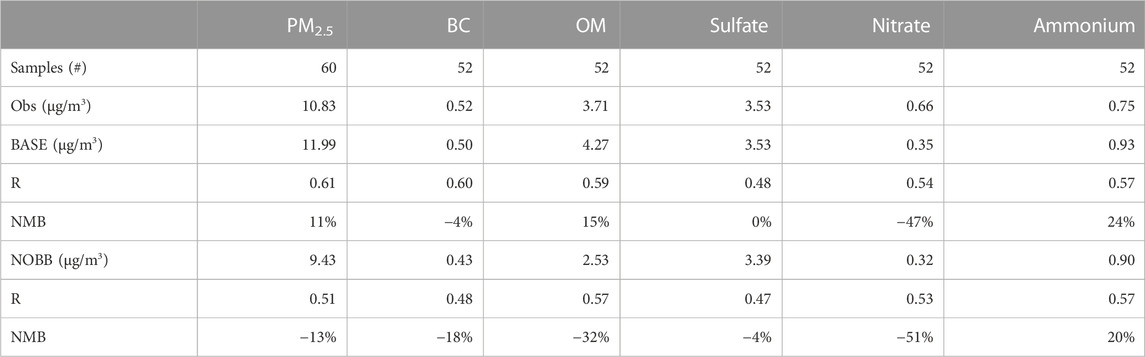
TABLE 1. Comparison statistics for modeled daily PM2.5 and its component concentrations at the Wuzhi Mountain site. Mean observation (Obs), mean simulation results of BASE and NOBB, and corresponding correlation coefficients (R), and normalized mean bias (NMB) are listed.
Hourly observations of pollutants from the 158 sites in 37 south China cities were also used for model validation. Observations and corresponding model simulation results were averaged within a certain province. Comparison statistics are listed in Table 2. In Hainan, hourly PM2.5 concentration was reasonably simulated although some model biases existed, with NMB and R of 13% and 0.48. O3 was also well simulated in Hainan, with NMB and R of 1%, and 0.70. On the other hand, SO2, NO2, and CO was underpredicted to some extent. The large model biases for these gas species could be attributed to the underestimations of their emissions around city areas of Hainan because their observations were conducted in 2 cities in Hainan. It is noted that although SO2 showed low bias, sulfate was reasonably simulated at the Wuzhi Mountain site. This is because as a background site, the Wuzhi Mountain site represents a more general condition which was reflected by the regional model. In Guangxi, PM2.5 was also reasonably simulated with NMB and R of 6% and 0.68, but gas precursors (SO2, NO2, and CO) were underestimated (Table 2). In Guangdong province, PM2.5 was fairly simulated with an overall NMB of 20% and R of 0.62. The model performances for gaseous species (O3, SO2, NO2, and CO) in Guangdong were generally better than those in Hainan and Guangxi (Table 2). All these comparisons also demonstrated a generally good model performance for aerosols in south China and the NSCS region during the study period from winter of 2020 to spring of 2021.
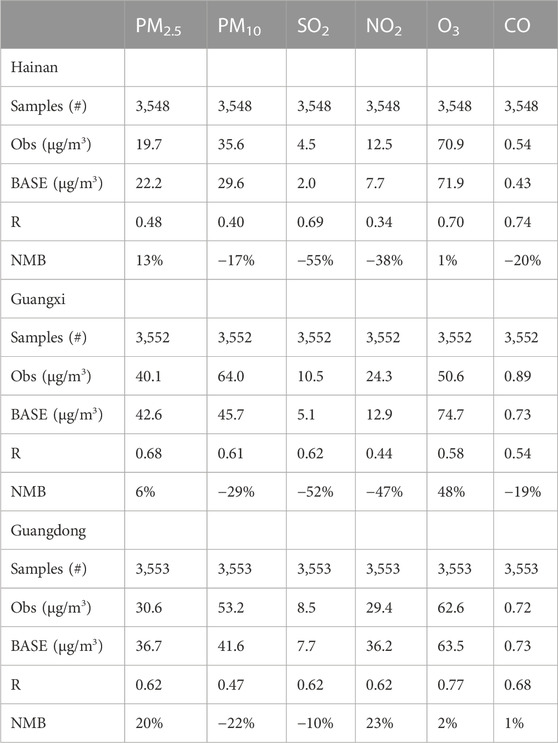
TABLE 2. Comparison statistics for modeled hourly pollutant concentrations at CNEMC sites in Hainan, Guangxi, and Guangdong provinces. Mean observation (Obs), mean simulation result of BASE, correlation coefficients (R), and normalized mean bias (NMB) are listed.
3.3 Influence of BB emissions on aerosol concentrations in the NSCS region
The influence of BB emissions on near-surface aerosol concentrations over the NSCS region was investigated by analyzing results of the three simulations. According to the simulation results at the Wuzhi Mountain site (Figure 2), the influence of BB emissions on PM2.5, BC, and OM was significant (Figures 2A–C), but the influence on sulfate, nitrate, and ammonium were almost negligible (Figures 2D–F). On average, the fractional contributions of BB emissions were 24%, 17%, and 42% to PM2.5, BC, and OM, respectively, but only 4%, 4%, and 4% to sulfate, nitrate, and ammonium at the Wuzhi Mountain site. So, further discussion mainly focused on PM2.5, BC, and OM.
Period mean near-surface concentrations of PM2.5, BC, and OM due to all sources (BASE), emissions other than BB (NOBB), and BB emissions (Cntr_BB) are presented in Figure 3. It is natural that aerosol concentrations were higher over land than over ocean. Anthropogenic-derived aerosols were mostly concentrated over source regions such as central China and northeast India (Figures 3D–F). BB aerosols mainly occurred in MSEA and south China (Figures 3G–I) where BB emissions were active (Figure 1). Total PM2.5, BC, and OM concentrations over MSEA and south China were evidently affected by BB aerosols. For the NSCS region, mean PM2.5 concentration could be 10–30 μg/m3 (Figure 3A) in which 2–10 μg/m3 was from BB emissions (Figure 3G). Mean BC and OM concentrations were 0.5–2 μg/m3 and 2–10 μg/m3 (Figures 3B, C), respectively, in which approximately 0.2 μg/m3 and 2–5 μg/m3 were contributed by BB emissions (Figures 3H, I).
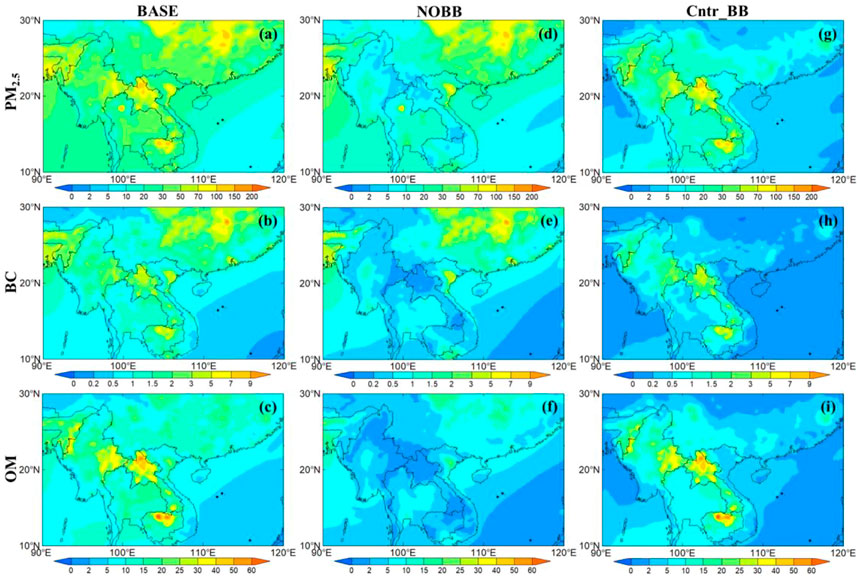
FIGURE 3. Modeled period mean near-surface concentrations (units: μg/m3) of (A, D, G) PM2.5, (B, E, H) BC, and (C, F, I) OM from (A–C) all emissions (BASE), (D–F) emissions other than biomass burning (NOBB), and (G–I) biomass burning emissions.
Figure 4 shows the monthly and NSCS regional mean PM2.5, BC, and OM concentrations and their source attributions. PM2.5 exhibited higher mean concentrations in December and January and decreased gradually until April (Figure 4A). Contributions of BB emissions (Cntr_BB) to PM2.5 were apparently higher in spring (March to April) with mean fractional contributions of 35%–36% but lower in winter (December to February) with mean values of merely 5%–17%. Most of the BB contributions were from the MSEA region (Cntr_BBSEA), with fractional contributions of 34%–35% to total PM2.5 mass in March and April due to the burning season of the MSEA (Lin et al., 2014). BB contribution from China (Cntr_BBCN) was perceptible and occasionally large in winter (such as January 18, see Figure 2) but was negligible in spring. Mean BC concentration exhibited a feature similar to that of PM2.5 (Figure 4B), but the Cntr_BB values were relatively smaller than those for PM2.5. The temporal variation of monthly mean OM concentration was relatively flat compared to those of PM2.5 and BC (Figure 4C). It is noticed that the Cntr_BB values of OM were larger than those of PM2.5 and BC. In March and April, more than half of OM mass was attributed to BB emissions (54%–56%) with almost all of them from the MSEA region (Figure 4C). In all, for the NSCS region, the impact of BB emissions on concentrations of PM2.5 and its carbonaceous component were much more significant in spring than in winter. This was mainly caused by the seasonal variation of BB emissions that were larger in spring months (Supplementary Figure S1). Such a seasonal feature of aerosols affected by BB emissions was also observed in an island in South China Sea (Yongxing Island) (Xiao et al., 2017). Previous modeling studies showed that BB emissions could contribute 31%–73% of aerosol mass (Vongruang and Pimonsree, 2020) and 26%–62% of aerosol optical depth (Huang et al., 2013) in springtime in downwind regions of Southeast Asia. Based on aerosol observations during a cruise campaign over the western South China Sea from August to September 2014, Song et al. (2018) calculated an average contribution of 54.1% from BB emissions to total aerosol mass using the ratio of non-sea salt potassium over total potassium (nss-K+/K+) as a proxy to evaluate the relative contribution of biomass burning. Combing observations during two cruises in the northern South China Sea (NSCS, from June to July 2016) and the western South China Sea (WSCS, from August to September 2016) and back trajectory analysis, Yao et al. (2023) reported that when aerosol samples were, from continental air masses, influenced by biomass burning, the OC/EC ratios were from 6.95 to 12.5 in the NSCS cruise and from 6.52 to 6.71 in the WSCS cruise. The average OC/EC ratio in the NSCS region from this study was 5.9, close to their observed lower ends. A possible reason of the difference between our result and that of Yao et al. (2023) could be the differences in study periods and locations. In all, the estimated contributions of BB emissions to aerosols from this study were generally consistent with previous modeling and observational results.
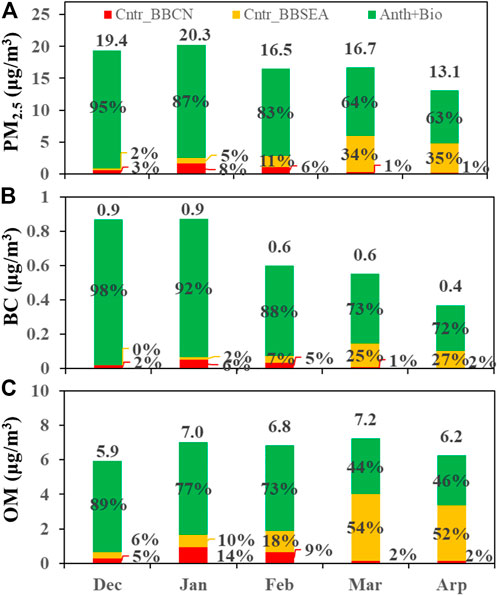
FIGURE 4. Modeled monthly and NSCS regional mean concentrations of (A) PM2.5, (B) BC, and (C) OM. Numbers on top of each bar are the mean concentrations. Contributions from anthropogenic and biogenic sources (NOBB, green), biomass burning emissions from mainland Southeast Asia (Cntr_BBSEA, red), and biomass burning emissions from China (Cntr_BBCN, orange) are shown in percentages. The NSCS region is indicated in Figure 1.
On an average, over the study period, BB emissions accounted for 20%, 13%, and 35% of near-surface PM2.5, BC, and OM concentrations in the NSCS region, respectively, with the maximum monthly percentage contributions up to 36%, 28%, and 56% in spring (April). The MSEA region was the major source of BB aerosols in NSCS. Among BB emissions, 79% of BB PM2.5, 72% of BB BC, and 81% of BB OM were from the MSEA region, respectively, in terms of period mean, and in spring months, the percentage contributions of BB emissions from MSEA were even up to 96%, 95%, and 96% for BB PM2.5, BB BC, and BB OM, respectively.
3.4 Influence of BB emissions on aerosol depositions in the NSCS region
Shown in Figure 5 are spatial distributions of period mean aerosol deposition fluxes (including dry and wet depositions) of PM2.5, BC, and OM due to all sources (BASE, Figures 5A–C), emissions other than BB (NOBB, Figures 5D–F), and BB emissions (Cntr_BB, Figures 5G–I). It is noted that December to April was the dry season of this region, so the wet scavenging of aerosols was small, and dry deposition dominated the aerosol removals. In general, the spatial distributions of aerosol depositions (Figures 5A–C) resemble those of near-surface concentrations (Figures 3A–C). Depositions of PM2.5, BC, and OM mainly occurred over source areas (Figures 5A–C) and BB aerosols comprised a large fraction of depositions in MSEA, southwest China, and parts of south China (Figures 5G–I). For the NSCS region, PM2.5 deposition was estimated to be 0.03–0.8 × 10³ mg/m2/month in most of the region (Figure 5A). Similar distribution patterns for BC (Figure 5B) and OM (Figure 5C) were obtained, with mean BC and OM deposition fluxes being 0–0.04 × 10³ mg/m2/month and 0–0.4 × 10³ mg/m2/month, respectively, in most of the NSCS region. Most of the depositions of BB aerosols that occurred around source regions and depositions in oceanic areas were relatively small; as a result, mean deposition fluxes of BB PM2.5, BC, and OM were less than 0.1 × 10³ mg/m2/month, 0.006 × 10³ mg/m2/month, and 0.1 × 10³ mg/m2/month, respectively, in the NSCS region (Figure 5G–I).
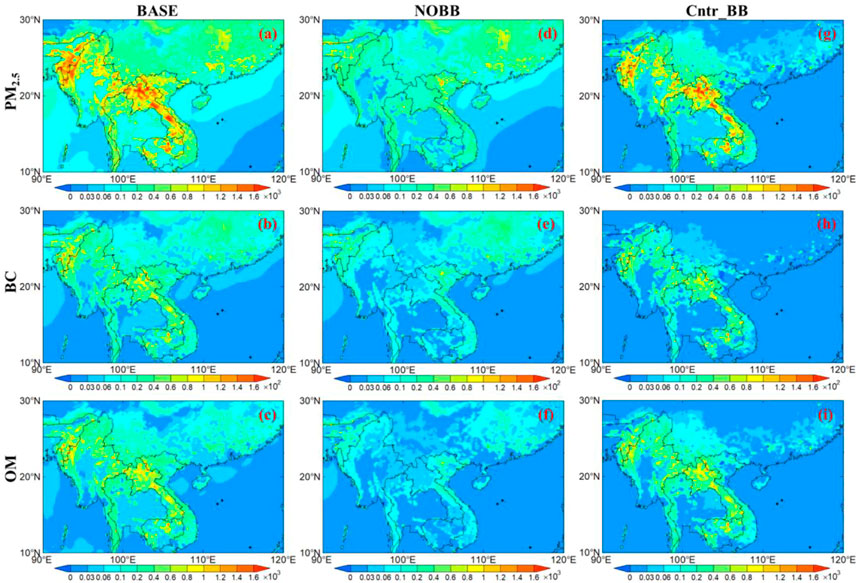
FIGURE 5. Modeled period mean aerosol deposition fluxes (units: mg/m2/month) of (A, D, G) PM2.5, (B, E, H) BC, and (C,F,I) OM due to (A–C) all emissions (BASE), (D–F) emissions other than biomass burning (NOBB), and (G–I) biomass burning emissions.
The monthly and NSCS regional mean accumulated aerosol depositions are shown in Figure 6. The temporal variations of monthly deposition fluxes generally resembled those of concentrations. For PM2.5, BC, and OM, their depositions were large in December and January, dropped down sharply in February, bounced back to a relatively high level in March, and then decreased again in April (Figure 6). The monthly depositions of PM2.5, BC, and OM were 51.5–98.1 mg/m2/month, 1.4–4.6 mg/m2/month, and 22.3–33.9 mg/m2/month, respectively, with period mean deposition fluxes of 73.8 mg/m2/month, 2.9 mg/m2/month, and 29.3 mg/m2/month in the NSCS region. Jurado et al. (2008) have estimated global wet and dry depositions of BC and OC in the oceans based on measurement datasets. Their estimated latitudinal yearly averaged BC and OC deposition fluxes along 0∼30°N were 0.08 mg/m2/day and 0.78 mg/m2/day, respectively, for 2002–2004. In this work, the estimated NSCS regional and period mean depositions were approximately 0.097 mg/m2/day for BC and 0.70 mg/m2/day for OC, which were generally consistent with previous results. Although a large number of studies are involved in atmospheric deposition, few of them are concerned about deposition fluxes of carbonaceous aerosols into oceans. To further evaluate the reliability of the simulated deposition fluxes in the NSCS region, depositions of particulate nitrogen were compared with reported measurements, although the major concern of this study was depositions of PM2.5 and carbonaceous aerosols. Based on aerosol measurements at an island site in the South China Sea (Yongxing Island), Shen et al. (2020) reported annual mean inorganic nitrogen (NO3− and NH4+) dry deposition flux of 13.6 mmol m−2 yr−1, while our estimation was 10.2 mmol m−2 yr−1 averaged over the NSCS region and the 5-month period. Considering the differences in sampling times and locations, our result was consistent with that of Shen et al. (2020).
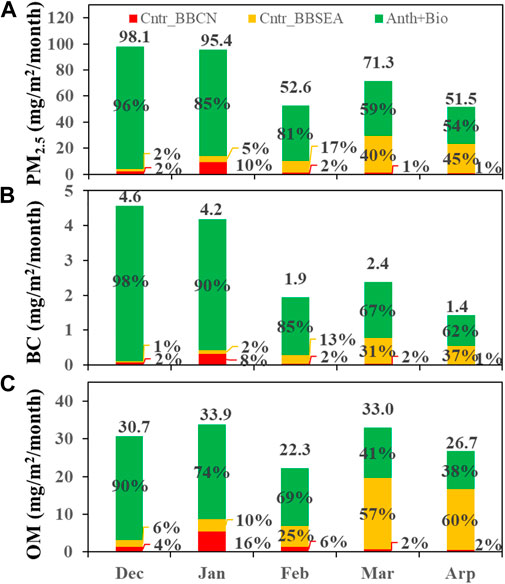
FIGURE 6. Modeled monthly and NSCS regional mean aerosol depositions of (A) PM2.5, (B) BC, and (C) OM. Numbers on the top of each bar are the mean depositions. Contributions from anthropogenic and biogenic sources (NOBB, green), biomass burning emissions from mainland Southeast Asia (Cntr_BBSEA, red), and biomass burning emissions from China (Cntr_BBCN, orange) are shown in percentages. The NSCS region is indicated in Figure 1.
During the study period, dry deposition dominated the removal of aerosols over the NSCS region. According to our simulation, approximately 97% of the removal of PM2.5, BC, and OM was attributed to dry deposition, while merely 3% was attributed to wet deposition. This is consistent with previous studies. For example, Itahashi et al. (2021) have investigated the seasonal variation of wet deposition over Southeast Asia based on observations and model simulations. They showed that wet depositions of aerosol components were much smaller in winter and spring than those in summer and autumn in MSEA areas such as Thailand, Vietnam, and Cambodia. Small precipitations during the dry season of the MSEA region (November to next April) could be the main cause of the small wet deposition. The WRF-chem-simulated monthly mean precipitations were compared with satellite precipitation product from the global precipitation measurement (GPM) mission (Huffman et al., 2019). The comparison showed a generally good result in terms of spatiotemporal variations and magnitudes (Supplementary Figure S2), which also implied that the estimated small wet deposition of aerosols in the dry season was reasonable.
Like the condition of concentrations, deposition fluxes of aerosols from biomass burning sources were much higher in spring (March and April) than those in winter (December to February) in the NSCS region. For the study period, BB emissions accounted for 22%, 15%, and 38% of total PM2.5, BC, and OM depositions in this region. In spring, BB emissions (Cntr_BB) accounted for 41–46% of PM2.5 deposition, 33–38% of BC deposition, and 59–62% of OM depositions in NSCS, respectively. That is, for aerosol depositions in spring in NSCS, approximately 23.4–29.2 mg/m2/month of PM2.5, 0.53–0.79 mg/m2/month of BC, and 16.6–19.5 mg/m2/month of OM were from BB sources. BB emissions from MSEA also dominated the depositions of BB aerosols in NSCS. On an average, over the study period, 82%, 77%, and 83% of BB PM2.5, BB BC, and BB OM depositions, respectively, were from the MSEA region, with maximum monthly fractional contributions up to 97% in spring. This also suggests the strong impacts of biomass burning emissions from mainland Southeast Asia on aerosol depositions in NSCS, especially during the burning season (spring) of MSEA.
The aforementioned results showed that the concentrations and depositions of aerosols from BB sources exhibited generally similar seasonal features in the NSCS. The variation of aerosol emissions is the dominating factor for the seasonal variations of aerosol concentrations and depositions, while meteorology fields also affect the variations to some extent (Nakata et al., 2018). The interannual changes in meteorology fields (such as strong or weak monsoon) can influence the monthly aerosol concentrations and depositions year by year; however, the seasonal trend is almost unchanged (Lin et al., 2013; Nakata et al., 2018).
4 Conclusion
In this work, the impact of biomass burning emissions on aerosol concentrations and depositions in the northern South China Sea region (NSCS, 105∼115°E and 15∼21°N) from the winter of 2020 to the spring of 2021 (December to April) was investigated by combining the WRF-chem simulation with continued observations in the background of the Wuzhi Mountain site in Hainan Island. BB emissions from different regions including mainland Southeast Asia and China were distinguished by sensitivity simulations. Model evaluation against various pollutant observations demonstrated a good skill of WRF-chem in simulating aerosol component concentrations in the NSCS region. Sensitivity simulations revealed that the inclusion of BB emissions evidently improved model performance by reducing the absolute model-observation biases and improving correlation coefficients in the NSCS region for the study period.
For the NSCS region, BB emissions accounted for 20%, 13%, and 35% of regional and period mean near-surface PM2.5, BC, and OM concentrations. Monthly fractional contributions of BB emissions to PM2.5, BC, and OM in the NSCS region were larger in spring (March and April) than in winter (December to February). The maximum monthly mean contributions of BB emissions to aerosol concentrations in the NSCS region were up to 36% for PM2.5, 28% for BC, and 56% for OM, respectively, in April. Most of the BB contributions can be attributed to the mainland Southeast Asia region, while BB contributions from China were perceptible in winter. The MSEA region contributed 79% of BB PM2.5, 72% of BB BC, and 81% of BB OM concentrations, respectively, during the study period, with maximum monthly mean BB contributions up to 96%, 95%, and 96% in spring.
Aerosol depositions in the NSCS region exhibited spatial and temporal features similar to those of near-surface concentrations. The deposition fluxes of PM2.5, BC, and OM were also larger in December and January than in other months. Anthropogenic emissions dominated the aerosol depositions in winter (December to February), while BB emissions significantly affected aerosol depositions in March and April. In terms of period and regional mean, 22% of PM2.5, 15% of BC, and 38% of OM depositions were attributed to BB emissions, respectively, with maximum monthly BB contributions up to 46% for PM2.5, 38% for BC, and 62% for OM. BB emissions from the MSEA region dominated the depositions of BB aerosols in NSCS, accounting for 82% of BB PM2.5, 77% of BB BC, and 83% of BB OM depositions, respectively, with maximum monthly contributions of up to 97% in spring. Dry depositions dominated the removal of aerosols in NSCS during the study period.
The study results of this work suggested that BB emissions in the MSEA region have strong impacts on air quality of downwind in the NSCS region including the Hainan Island. As a tourist island, Hainan has a strong demand for low PM2.5 levels. More than 30% BB contribution to PM2.5 mass in spring (Figure 4) implies that additional efforts are required by Hainan to maintain a good air quality in this season. This study also estimated the BB contributions on carbonaceous aerosol depositions in the oceanic areas of northern South China Sea. Atmospheric inputs of dissolved BC and OC have been considered to have important effects on global carbon cycle (Yamashita et al., 2022) and marine biogeochemistry (Mari et al., 2019; Wagner et al., 2021) but yet poorly constrained. Biomass burning was considered a major source of such atmospheric inputs of carbonaceous aerosols (Wagner et al., 2021). In addition the deposition of PM2.5 particles which include nutrient elements and metals (e.g., nitrogen, prosperous, and lead.) are also important for the biogeochemistry of this region, but the knowledge of these aspects was still insufficient and required further studies. In all, the results of this work provide valuable information for understanding atmospheric contributions of biomass burning carbonaceous aerosols to the NSCS region.
Data availability statement
The original contributions presented in the study are included in the article/Supplementary Material; further inquiries can be directed to the corresponding authors.
Author contributions
JL and ZZ contributed to conception and design of the study, performed the simulation experiments and statistical analysis, and wrote the first draft of the manuscript; JT organized the observation; YP, LL, and ZH reviewed the manuscript. All authors contributed to the manuscript revision and approved the submitted version.
Funding
This study was supported by the National Natural Science Foundation of China (42275118), the MRU Open Science Fund (MRUKF2021016), and Central Research Institute’s Basic Scientific Special Funds (PM-zx703-202004-148).
Acknowledgments
The authors are grateful to the China National Environmental Monitoring Centre for maintaining and distributing pollutant measurement data.
Conflict of interest
The authors declare that the research was conducted in the absence of any commercial or financial relationships that could be construed as a potential conflict of interest.
Publisher’s note
All claims expressed in this article are solely those of the authors and do not necessarily represent those of their affiliated organizations, or those of the publisher, the editors, and the reviewers. Any product that may be evaluated in this article, or claim that may be made by its manufacturer, is not guaranteed or endorsed by the publisher.
Supplementary material
The Supplementary Material for this article can be found online at: https://www.frontiersin.org/articles/10.3389/fenvs.2023.1124579/full#supplementary-material
References
Ackermann, I. J., Hass, H., Memmesheimer, M., Ebel, A., Binkowski, F. S., and Shankar, U. (1998). Modal aerosol dynamics model for Europe: Development and first applications, Atmos. Environ 32, 2981–2999. doi:10.1016/s1352-2310(98)00006-5
Andreae, M. O. (2019). Emission of trace gases and aerosols from biomass burning – An updated assessment. Chem. Phys. 19, 8523–8546. doi:10.5194/acp-19-8523-2019
Andreae, M. O., and Rosenfeld, D. (2008). Aerosol-cloud-precipitation interactions. Part 1. The nature and sources of cloud-active aerosols. Earth-Sci. Rev. 89, 13–41. doi:10.1016/j.earscirev.2008.03.001
Ardyna, M., Hamilton, D. S., Harmel, T., Lacour, L., Bernstern, D. N., Laliberté, J., et al. (2022). Wildfire aerosol deposition likely amplified a summertime Arctic phytoplankton bloom. Commun. Earth Environ. 3, 201. doi:10.1038/s43247-022-00511-9
Bond, T. C., Doherty, S. J., Fahey, D. W., Forster, P. M., Berntsen, T., DeAngelo, B. J., et al. (2013). Bounding the role of black carbon in the climate system: A scientific assessment. J. Geophys. Res. 118, 5380–5552. doi:10.1002/jgrd.50171
Butt, E. W., Conibear, L., Reddington, C. L., Darbyshire, E., Morgan, W. T., Coe, H., et al. (2020). Large air quality and human health impacts due to Amazon forest and vegetation fires. Environ. Res. Commun. 2, 095001. doi:10.1088/2515-7620/abb0db
Cao, J. J., Lee, S. C., Ho, K. F., Zou, S. C., Fung, K., Li, Y., et al. (2004). Spatial and seasonal variations of atmospheric organic carbon and elemental carbon in Pearl River Delta Region, China. Environ 38, 4447–4456. doi:10.1016/j.atmosenv.2004.05.016
Clough, S. A., Shephard, M. W., Mlawer, E. J., Delamere, J. S., Iacono, M. J., Cady-Pereira, K., et al. (2005). Atmospheric radiative transfer modeling: A summary of the AER codes. J. Quant. Spectrosc. Ra. 91, 233–244. doi:10.1016/j.jqsrt.2004.05.058
Crippa, M., Solazzo, E., Huang, G., Guizzardi, D., Koffi, E., Muntean, M., et al. (2019). High resolution temporal profiles in the emissions Database for global atmospheric research. Nat. Sci. Data 7, 121. doi:10.1038/s41597-020-0462-2
Crutzen, P. J., and Andreae, M. O. (1990). Biomass burning in the tropics: Impact on atmospheric chemistry and biogeochemical cycles. Science 250, 1669–1678. doi:10.1126/science.250.4988.1669
Deng, X. J., Tie, X. X., Zhou, X. J., Wo, D., Zhong, L. J., Tan, H. B., et al. (2008). Effects of Southeast Asia biomass burning on aerosols and ozone concentrations over the Pearl River Delta (PRD) region. Atmos. Environ. 42, 8493–8501. doi:10.1016/j.atmosenv.2008.08.013
Ding, K., Huang, X., Ding, A., Wang, M. H., Su, H., Kerminen, V.-M., et al. (2021). Aerosol-boundary-layer-monsoon interactions amplify semi-direct effect of biomass smoke on low cloud formation in Southeast Asia. Nat. Commun. 12, 6416. doi:10.1038/s41467-021-26728-4
Ferrada, G. A., Zhou, M., Wang, J., Lyapustin, A., Wang, Y., Freitas, S. R., et al. (2022). Introducing the VIIRS-based fire emission inventory version 0 (VFEIv0). Model Dev. 15, 8085–8109. doi:10.5194/gmd-15-8085-2022
Fu, J. S., Hsu, N. C., Gao, Y., Huang, K., Li, C., Lin, N.-H., et al. (2012). Evaluating the influences of biomass burning during 2006 BASE-ASIA: A regional chemical transport modeling. Atmos. Chem. Phys. 12, 3837–3855. doi:10.5194/acp-12-3837-2012
Gao, M., Han, Z., Liu, Z., Li, M., Xin, J., Tao, Z., et al. (2018). Air Quality and Climate Change, Topic 3 of the Model Inter-Comparison Study for Asia Phase III (MICS-Asia III), Part I: overview and model evaluation. Atmos. Chem. Phys. 18, 4859–4884. doi:10.5194/acp-18-4859-2018
Gettelman, A., Mills, M. J., Kinnison, D. E., Garcia, R. R., Smith, A. K., Marsh, D. R., et al. (2019). The whole atmosphere community climate model version 6 (WACCM6). J. Geophys. Res.-Atmospheres 124, 12380–12403. doi:10.1029/2019JD030943
Grell, G. A., and Dévényi, D. (2002). A generalized approach to parameterizing convection combining ensemble and data assimilation techniques. Geophys. Res. Lett. 29, 1–4. doi:10.1029/2002GL015311
Guenther, A., Karl, T., Harley, P., Wiedinmyer, C., Palmer, P. I., and Geron, C. (2006). Estimates of global terrestrial isoprene emissions using MEGAN (model of emissions of gases and aerosols from nature). Atmos. Chem. Phys. 6, 3181–3210. doi:10.5194/acp-6-3181-2006
Guieu, C., Bonnet, S., Wagener, T., and Loye-Pilot, M. D. (2005). Biomass burning as a source of dissolved iron to the open ocean? Geophys. Res. Lett. 321, 205–213. doi:10.1029/2005gl022962
Hong, S.-Y., Noh, Y., and Dudhia, J. (2006). A new vertical diffusion package with an explicit treatment of entrainment processes. Mon. Weather Rev. 134, 2318–2341. doi:10.1175/MWR3199.1
Huang, K., Fu, J. S., Christina Hsu, N., Gao, Y., Dong, X., Tsay, S.-C., et al. (2013). Impact assessment of biomass burning on air quality in Southeast and East Asia during BASE-ASIA. Atmos. Environ. 78, 291–302. doi:10.1016/j.atmosenv.2012.03.048
Huffman, G. J., Stocker, E. F., Bolvin, D. T., Nelkin, E. J., and Tan, J., (2019). GPM IMERG final precipitation L3 1 month 0.1 degree x 0.1 degree V06, Greenbelt, MD, Goddard Earth Sciences Data and Information Services Center (GES DISC), Accessed: 9 January 2023, 10.5067/GPM/IMERGDF/DAY/06.
IPCC (2021). in Climate change 2021: The physical science basis. Contribution of working group I to the sixth assessment report of the intergovernmental panel on climate change [Masson-Delmotte. Editors Caud, N., Zhai, P., Pirani, A., Connors, S. L., Péan, C., Berger, S., et al. (Cambridge, United Kingdom and New York, NY, USA: Cambridge University Press). In press. doi:10.1017/9781009157896
Itahashi, S., Ge, B., Sato, K., Wang, Z., Kurokawa, J., Tan, J., et al. (2021). Insights into seasonal variation of wet deposition over southeast Asia via precipitation adjustment from the findings of MICS-Asia III. Atmos. Chem. Phys. 21, 8709–8734. doi:10.5194/acp-21-8709-2021
Jurado, E., Dachs, J., Duarte, C. M., and Simó, R. (2008). Atmospheric deposition of organic and black carbon to the global oceans. Atmos. Environ. 42, 7931–7939. doi:10.1016/j.atmosenv.2008.07.029
Koren, I., Kaufman, Y. J., Remer, L. A., and Martins, J. V. (2004). Measurement of the effect of amazon smoke on inhibition of cloud formation. Science 303, 1342–1345. doi:10.1126/science.1089424
LaRowe, D. E., Arndt, S., Bradley, J. A., Estes, E. R., Hoarfrost, A., Lang, S. Q., et al. (2020). The fate of organic carbon in marine sediments - new insights from recent data and analysis. Earth-Science Rev. 204, 103146. doi:10.1016/j.earscirev.2020.103146
Lee, H.-H., Bar-Or, R. Z., and Wang, C. (2017). Biomass burning aerosols and the low-visibility events in Southeast Asia. Atmos. Chem. Phys. 17, 965–980. doi:10.5194/acp-17-965-2017
Liang, Y., Che, H., Gui, K., Zheng, Y., Yang, X. Y., Li, X. P., et al. (2019). Impact of biomass burning in south and southeast Asia on background aerosol in southwest China. Aerosol Air Qual. Res. 19, 1188–1204. doi:10.4209/aaqr.2018.08.0324
Lin, C.-Y., Hsu, H.-m., Lee, Y. H., Kuo, C. H., Sheng, Y.-F., and Chu, D. A. (2009). A new transport mechanism of biomass burning from Indochina as identified by modeling studies. Atmos. Chem. Phys. 9, 7901–7911. doi:10.5194/acp-9-7901-2009
Lin, C.-Y., Zhao, C., Liu, X. H., Lin, N.-H., and Chen, W.-N. (2014). Modelling of long-range transport of Southeast Asia biomass-burning aerosols to Taiwan and their radiative forcings over East Asia. Tellus B Chem. Phys. Meteorology 66 (1), 23733. doi:10.3402/tellusb.v66.23733
Lin, N.-H., Tsay, S.-C., Maring, H. B., Yen, M.-C., Sheu, G.-R., Wang, S.-H., et al. (2013). An overview of regional experiments on biomass burning aerosols and related pollutants in Southeast Asia: From BASE-ASIA and the Dongsha Experiment to 7-SEAS. Atmos. Environ. 78, 1–19. doi:10.1016/j.atmosenv.2013.04.066
Liu, T., Mickley, L. J., Marlier, M. E., DeFries, R. S., Khan, M. F., Latif, M. T., et al. (2020). Diagnosing spatial biases and uncertainties in global fire emissions inventories: Indonesia as regional case study. Remote Sens. Environ. 237, 111557. doi:10.1016/j.rse.2019.111557
Lønborg, C., Carreira, C., Jickells, T., and Álvarez-Salgado, X. A. (2020). Impacts of global change on ocean dissolved organic carbon (DOC) cycling. Front. Mar. Sci. 7, 466. doi:10.3389/fmars.2020.00466
Mari, X., Guinot, B., Thuoc, C. V., Brune, J., Lefebvre, J.-P., Angia Sriram, P. R., et al. (2019). Biogeochemical impacts of a black carbon wet deposition event in halong bay, Vietnam. Front. Mar. Sci. 6, 185. doi:10.3389/fmars.2019.00185
Marvin, M. R., Palmer, P. I., Latter, B. G., Siddans, R., Kerridge, B. J., Latif, M. T., et al. (2021). Photochemical environment over Southeast Asia primed for hazardous ozone levels with influx of nitrogen oxides from seasonal biomass burning. Atmos. Chem. Phys. 21, 1917–1935. doi:10.5194/acp-21-1917-2021
Morrison, H., Curry, J. A., Shupe, M. D., and Zuidema, P. (2005). A new double-moment microphysics parameterization for application in cloud and climate models. Part II: Single-column modeling of arctic clouds. J. Atmos. Sci. 62, 1678–1693. doi:10.1175/jas3447.1
Nakata, M., Mukai, S., and Yasumoto, M. (2018). Seasonal and regional characteristics of aerosol pollution in East and southeast Asia. Front. Environ. Sci. 6, 29. doi:10.3389/fenvs.2018.00029
NCEP (2015). National centers for environmental prediction/national weather service/NOAA/U.S. Department of commerce, updated daily. NCEP GDAS/FNL 0.25 degree global tropospheric analyses and forecast grids. Research Data Archive at the National Center for Atmospheric Research, Computational and Information Systems Laboratory, (last accessed Dec 13, 2021). doi:10.5065/D65Q4T4Z
Oleson, K. W., Lawrence, D. M., Gordon, B., Flanner, M. G., Kluzek, E., Peter, J., et al. (2010). Technical description of version 4.0 of the community land model (CLM). NCAR Tech. Note NCAR/TN-478+STR, 257 pp.
Pani, S. K., Chantara, S., Khamkaew, C., Lee, C., and Lin, N. (2019). Biomass burning in the northern peninsular Southeast Asia: Aerosol chemical profile and potential exposure. Atmos. Res. 224, 180–195. doi:10.1016/j.atmosres.2019.03.031
Reddington, C. L., Conibear, L., Robinson, S., Knote, C., Arnold, S. R., and Spracklen, D. V. (2021). Air pollution from forest and vegetation fires in Southeast Asia disproportionately impacts the poor. GeoHealth 5, e2021GH000418. doi:10.1029/2021GH000418
Reddington, C. L., Morgan, W. T., Darbyshire, E., Brito, J., Coe, H., Artaxo, P., et al. (2019). Biomass burning aerosol over the amazon: Analysis of aircraft, surface and satellite observations using a global aerosol model. Atmos. Chem. Phys. 19, 9125–9152. doi:10.5194/acp-19-9125-2019
Rosenfeld, D., Andreae, M. O., Asmi, A., Chin, M., de Leeuw, G., Donovan, D. P., et al. (2014). Global observations of aerosol-cloud-precipitation-climate interactions. Rev. Geophys. 52, 750–808. doi:10.1002/2013rg000441
Sen, I. S., and Bernhard, P. E. (2012). Anthropogenic disturbance of element cycles at the earth’s surface. Environ. Sci. Technol. 46, 8601–8609. doi:10.1021/es301261x
Shen, C., Zhao, H., Chen, F., and Xiao, H. (2020). The distribution of aerosols and their impacts on chlorophyll-a distribution in the South China Sea. J. Geophys. Res. Biogeosciences 125, e2019JG005490. doi:10.1029/2019JG005490
Song, J. W., Zhao, Y., Zhang, Y. Y., Fu, P. Q., Zheng, L. S., Yuan, Q., et al. (2018). Influence of biomass burning on atmospheric aerosols over the Western South China Sea: Insights from ions, carbonaceous fractions and stable carbon isotope ratios. Environ. Pollut. 242, 1800–1809. doi:10.1016/j.envpol.2018.07.088
Souri, A. H., Choi, Y., Jeon, W., Kochanski, A. K., Diao, L., Mandel, J., et al. (2017). Quantifying the impact of biomass burning emissions on major inorganic aerosols and their precursors in the U.S. J. Geophys. Res.-Atmospheres 122 (21), 020–041. doi:10.1002/2017JD026788
Takami, K., Shimadera, H., Uranishi, K., and Kondo, A. (2020). Impacts of biomass burning emission inventories and atmospheric reanalyses on simulated PM10 over indochina. Atmosphere 11, 160. doi:10.3390/atmos11020160
Tang, Y. H., Carmichael, G. R., Woo, J. H., Thongboonchoo, N., Kurata, G., Uno, I., et al. (2003). Influences of biomass burning during the Transport and Chemical Evolution over the Pacific (TRACE-P) experiment identified by the regional chemical transport model. J. Geophys. Res. 108, 8824. doi:10.1029/2002JD003110
Tao, J., Surapipith, V., Han, Z. W., Prapamontal, T., Kawichai, S., Zhang, L. M., et al. (2020). High mass absorption efficiency of carbonaceous aerosols during the biomass burning season in Chiang Mai of northern Thailand. Atmos. Environ. 240, 117821. doi:10.1016/j.atmosenv.2020.117821
Tao, J., Zhang, L., Cao, J., Zhong, L., Chen, D., Yang, Y., et al. (2017). Source apportionment of PM2.5 at urban and suburban areas of the Pearl River Delta region, south China - with emphasis on ship emissions. Sci. Total Environ. 574, 1559–1570. doi:10.1016/j.scitotenv.2016.08.175
Thepnuan, D., Chantara, S., Lee, C.-T., Lin, N.-H., and Tsai, Y. I. (2019). Molecular markers for biomass burning associated with the characterization of PM2.5 and component sources during dry season haze episodes in Upper South East Asia. Sci. Total Environ. 658, 708–722. doi:10.1016/j.scitotenv.2018.12.201
Turpin, B. J., and Lim, H.-J. (2001). Species contributions to PM2.5 mass concentrations: Revisiting common assumptions for estimating organic mass. Aerosol Sci. Technol. 35, 602–610. doi:10.1080/02786820119445
van der Werf, G. R., Randerson, J. T., Giglio, L., van Leeuwen, T. T., Chen, Y., Rogers, B. M., et al. (2017). Global fire emissions estimates during 1997–2016. Earth Syst. Sci. Data 9, 697–720. doi:10.5194/essd-9-697-2017
Vongruang, P., and Pimonsree, S. (2020). Biomass burning sources and their contributions to PM10 concentrations over countries in mainland Southeast Asia during a smog episode. Atmos. Environ. 228, 117414. doi:10.1016/j.atmosenv.2020.117414
Wagner, S., Harvey, E., Baetge, N., McNair, H., Arrington, E., and Stubbins, A. (2021). Investigating atmospheric inputs of dissolved black carbon to the santa barbara channel during the thomas fire (California, USA). J. Geophys. Res. Biogeosciences 126, e2021JG006442. doi:10.1029/2021JG006442
Wang, K., Zhang, Y., Yahya, K., Wu, S.-Y., and Grell, G. (2015). Implementation and initial application of new chemistry-aerosol options in WRF/Chem for simulating secondary organic aerosols and aerosol indirect effects for regional air quality. Atmos. Environ. 115, 716–732. doi:10.1016/j.atmosenv.2014.12.007
Wang, W. C., Luo, C. H., Sheng, L. F., Zhao, C. F., Zhou, Y., and Chen, Y. H. (2021). Effects of biomass burning on chlorophyll-a concentration and particulate organic carbon in the subarctic north pacific ocean based on satellite observations and WRF-chem model simulations: A case study. Atmos. Res. 254, 105526. doi:10.1016/j.atmosres.2021.105526
Wiedinmyer, C., Akagi, S. K., Yokelson, R. J., Emmons, L. K., Al-Saadi, J. A., Orlando, J. J., et al. (2011). The fire INventory from NCAR (FINN): A high resolution global model to estimate the emissions from open burning. Geosci. Model Dev. 4, 625–641. doi:10.5194/gmd-4-625-2011
Xiao, H.-W., Xiao, H.-Y., Luo, L., Shen, C.-Y., Long, A.-M., Chen, L., et al. (2017). Atmospheric aerosol compositions over the South China sea: Temporal variability and source apportionment. Atmos. Chem. Phys. 17, 3199–3214. doi:10.5194/acp-17-3199-2017
Xing, L., Bei, N., Guo, J., Wang, Q., Liu, S., Han, Y., et al. (2021). Impacts of biomass burning in peninsular Southeast Asia on PM2.5 concentration and ozone formation in southern China during springtime—a case study. J. Geophys. Res.-Atmospheres 126, e2021JD034908. doi:10.1029/2021JD034908
Yamashita, Y., Nakane, M., Mori, Y., Nishioka, J., and Ogawa, H. (2022). Fate of dissolved black carbon in the deep Pacific Ocean. Natrue Commun. 13, 307. doi:10.1038/s41467-022-27954-0
Yao, Y. Y., Zhang, Y. Y., Song, J. W., Yuan, Q., Wang, S., Li, X. Y., et al. (2023). Chemical characterization of marine aerosols from two cruises over the South China Sea: Importance of biomass burning and secondary formation. Sci. Total Environ. 867, 161551. doi:10.1016/j.scitotenv.2023.161551
Yarwood, G., Rao, S., Yocke, M., and Whitten, G. (2005). Updates to the carbon bond chemical mechanism: CB05. Final report to the US EPA. RT-0400675, Available at: www.camx.com (last access April 24, 2022).
Ying, Q., Wu, L., and Zhang, H. (2014). Local and inter-regional contributions to PM2.5 nitrate and sulfate in China. Atmos. Environ. 94, 582–592. doi:10.1016/j.atmosenv.2014.05.078
Zhang, Z., Gao, J., Zhang, L., Wang, H., Tao, J., Qiu, X., et al. (2017). Observations of biomass burning tracers in PM2.5 at two megacities in North China during 2014 APEC summit. Environ 169, 54–64. doi:10.1016/j.atmosenv.2017.09.011
Zheng, B., Zhang, Q., Geng, G. N., Chen, C. H., Shi, Q. R., Cui, M. S., et al. (2021). Changes in China’s anthropogenic emissions and air quality during the COVID-19 pandemic in 2020. Earth Syst. Sci. Data 13, 2895–2907. doi:10.5194/essd-13-2895-2021
Zhou, Y. H., Xiao, H. Y., Guan, H., Zheng, N. J., Zhang, Z. Y., Tian, J., et al. (2020). Chemical composition and seasonal variations of PM2.5 in an urban environment in Kunming, SW China: Importance of prevailing westerlies in cold season. Environ 237, 117704. doi:10.1016/j.atmosenv.2020.117704
Keywords: biomass burning, aerosol, mainland Southeast Asia, northern South China sea, WRF-chem
Citation: Li J, Zhang Z, Tao J, Pan Y, Luo L and Han Z (2023) The impact of biomass burning emissions on aerosol concentrations and depositions in the northern South China Sea region. Front. Environ. Sci. 11:1124579. doi: 10.3389/fenvs.2023.1124579
Received: 15 December 2022; Accepted: 30 January 2023;
Published: 10 February 2023.
Edited by:
Lei Liu, Lanzhou University, ChinaReviewed by:
Xiaohuan Liu, Ocean University of China, ChinaJiani Tan, Max Planck Institute for Chemistry, Germany
Copyright © 2023 Li, Zhang, Tao, Pan, Luo and Han. This is an open-access article distributed under the terms of the Creative Commons Attribution License (CC BY). The use, distribution or reproduction in other forums is permitted, provided the original author(s) and the copyright owner(s) are credited and that the original publication in this journal is cited, in accordance with accepted academic practice. No use, distribution or reproduction is permitted which does not comply with these terms.
*Correspondence: Jiawei Li, bGlqd0B0ZWEuYWMuY24=; Zhisheng Zhang, emhhbmd6aGlzaGVuZ0BzY2llcy5vcmc=