 Wennong Kuang
 Yufeng Wu
 Xiaopeng Gao
 Mingyuan Yin5
 Dongwei Gui
 Fanjiang Zeng
- 1Research Center of Forest Management Engineering of State Forestry and Grassland Administration, Beijing Forestry University, Beijing, China
- 2Xinjiang Key Laboratory of Desert Plant Roots Ecology and Vegetation Restoration, Cele National Station of Observation and Research for Desert-Grassland Ecosystems, Xinjiang Institute of Ecology and Geography, Chinese Academy of Sciences, Urumqi, China
- 3University of Chinese Academy of Sciences, Beijing, China
- 4Department of Soil Science, University of Manitoba, Winnipeg, MB, Canada
- 5Liaoning Key Laboratory of Urban Integrated Pest Management and Ecological Security, College of Life Science and Engineering, Shenyang University, Shenyang, China
It remains uncertain how different N inputs as synthetic fertilizer or manure and irrigation types affect nitrous oxide (N2O) production and effluxes in the subsurface. A field trial was carried out in 2016 to evaluate the impacts of conventional urea, animal manure, and a 50/50 mix of urea and manure on N2O production/effluxes from a cotton (Gossypium hirsutum L.) field under flood or drip irrigation in northwestern China. Soil N2O concentrations were monitored at 5, 15, 30, and 60 cm depths to assess the production and diffusion rates of N2O in the soil profile. The results showed that N2O concentrations in 0–60 cm ranged between 221 and 532 nL L−1 and averaged 344 nL L−1, which was generally lower compared to other studies in the same region. Manure and flood irrigation significantly increased N2O production at 0–5 cm and 5–15 cm, respectively. That is, the effects of nitrogen management and irrigation types on the N2O production of the profile were reflected in the surface layers and subsurface layers, respectively. All N2O production occurred in the 0–15 cm layer, with the 0–5 cm depth contributing 87%–100% of the surface emissions. The response discrepancy of N2O production/diffusion to irrigation and nitrogen management in different soil depths should be fully considered in developing agricultural N2O emission reduction measures.
1 Introduction
Nitrous oxide (N2O) is a powerful greenhouse gas that contributes to both global warming and stratospheric ozone destruction (Ravishankara et al., 2009). Soil N2O emissions have rapidly increased from 6.3 Tg N2O-N yr−1 in pre-industrial times to 10.0 Tg N2O-N yr−1 in recent years, with 82% of the total increase coming from cropland (Tian et al., 2019). Application of manure and synthetic fertilizer is the main factor inducing N2O emissions from agricultural soils (Tian et al., 2020). In addition, irrigation practice is also a crucial factor in determining N2O emissions from agricultural ecosystems (Kuang et al., 2021). Thus, it is essential to explore the effects of fertilization and irrigation methods on the production and emission of N2O.
Irrigation management practices affect N2O emissions through their impacts on the spatial and temporal distribution of soil moisture content, as well as microbial and nutrient availability (Sánchez-Martín et al., 2008; Kuang et al., 2018). Drip irrigation is an effective practice to enhance N and water use efficiency, and it is widely used in arid regions for crop production (Vázquez et al., 2006). Some studies reported that drip irrigation effectively reduced N2O emissions from cropland, compared with traditional irrigation (Sánchez-Martín et al., 2008; Bronson et al., 2018; Li et al., 2014), whereas in others the opposite was observed (Fentabil et al., 2016; Kuang et al., 2018). A global meta-analysis showed that drip irrigation significantly reduced N2O emissions from cropland by 32% and 46% compared to traditional flood and sprinkler irrigation, respectively (Kuang et al., 2021). Using a soil column incubation study, Kuang et al. (2019) revealed that deep-placed N fertilizers were most susceptible to denitrification under high water-filled pore space (WFPS) content but did not result in a significant surface burst of N2O emission, suggesting soil moisture plays an essential role in determining production and consumption of N2O across soil profiles. Understanding the effects of different management measures on soil N2O production processes can provide a basis for optimizing agricultural management practices.
N fertilizer and manure additions are the main cause of N2O emissions from agricultural land (Tian et al., 2020). Soil properties, including the form of N and available C can affect the biological processes of nitrification and denitrification (Velthof et al., 2003). The effects of N sources on N2O production and consumption have highly complex regulatory mechanisms (Zhou et al., 2017). Several studies have found that manure addition increased N2O production compared to synthetic N fertilizers by providing C substrate to denitrifiers for denitrification (Hayakawa et al., 2009; Ju et al., 2011; Forte et al., 2017; Yin et al., 2019). Other studies, on the other hand, have found that manure application reduces N2O emissions when compared to synthetic fertilizers, by stimulating complete denitrification to N2 (Ball et al., 2004; Meijide et al., 2007; Tao et al., 2018). Several studies also found no differences in the use of manure and synthetic N fertilizer in terms of N2O emissions (Meng et al., 2005; Vallejo et al., 2006). These inconsistent results reflect the need for further analysis of the effects of different N sources on N2O production, transport, and consumption in the profile. As a result, there remains a scarcity of knowledge on the relationship between N2O efflux underground and emissions on the surface, which are influenced by N fertilizer and manure with the drip- and flood-irrigated crops.
Surface N2O emissions are the net result of a series of processes involving profile N2O production, diffusion and consumption (Gao et al., 2014; Wang et al., 2018; Li et al., 2021). The rate and direction of N2O diffusion are determined by the distribution of N2O concentration in the profile. Depending on the concentration gradient of N2O in the subsoil, its association with soil surface emission rates can be used to quantify the contribution of N2O from different soil layers to surface N2O emissions (Nan et al., 2016; Wang et al., 2018). Nan et al. (2016) reported that 99% of the total cumulative N2O fluxes in the soil profile occurred in the 0–15 cm soil layer. According to Wang et al. (2018), soil N2O consumption at depths of 0–5 and 5–15 cm attributed to 80.4% and 6.6% of the surface N2O emission, respectively. However, few studies have been conducted to compare the contribution of different soil layers to surface N2O emissions under different irrigation and N management practices.
The objectives of this study were to 1) characterize the spatial distributions of N2O concentrations in the soil profile with urea or manure application under drip and flood irrigation, 2) quantify the depth-dependent contributions of profile N2O effluxes to the surface emissions, and 3) assess the impact of environmental factors on N2O fluxes in the profile.
2 Materials and methods
2.1 Site description and soil properties
A field experiment was carried out at the Cele National Station (37°01′06″N, 80°43′48″E) in Xinjiang Uygur Autonomous Region, during the 2016 growing season. The station is situated on the southern edge of the Taklimakan Desert. The mean annual precipitation and annual potential evaporation are 42.5 mm and 2,956 mm, respectively. The average annual air temperature is 12.7°C. The soil is classified as Aridisols in the USDA ST system (USDA, 1999), and the surface soil (0–20 cm) has sand, silt, and clay content of 900, 40, and 60 g kg−1, respectively. For details about the soil properties as shown in Table 1.
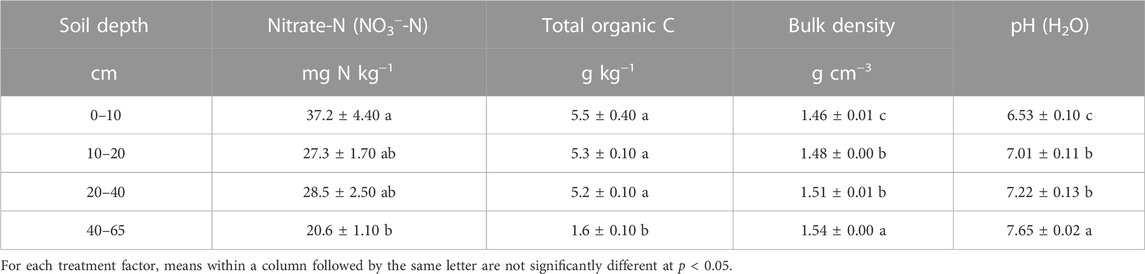
TABLE 1. Soil properties at different layers (0–60 cm) of profiles before sowing in 2016. Values are means ±1 standard error, n = 4.
2.2 Experimental design and crop management
This experiment was a two-factor experiment in a randomized complete block design with two types of irrigation (drip and flood) and four N source treatments: 1) no fertilization (Control), 2) granular urea (Urea), 3) animal manure (Manure), and 4) 50% granular urea with 50% animal manure (U + M). Detailed information about the experimental design has been described in our previous study (Kuang et al., 2018). Briefly, the application rate of all fertilizer treatments was 240 kg N ha−1. Granular urea (N 46%) was applied as 522 and 261 kg ha−1 for Urea and U + M, animal manure was applied as 76.9 and 38.5 Mg ha−1 for Manure and U + M, respectively. Under drip irrigation, 20% urea was applied at planting, with the remaining 80% applied as a topdressing six times during the growing season. Under flood irrigation, 30% of the urea was applied during planting, and the remaining 70% was top-dressed to the soil four times before irrigation. Under both irrigation systems, manure was evenly broadcast over the surface soil before sowing and immediately incorporated with the soil. For all plots, calcium phosphate (120 kg P2O5 ha−1) and K2SO4 (60 kg K2O ha−1) were broadcast on the surface and mixed into soils (0–20 cm) with a rota-cultivator before planting. Each treatment had four replicated plots. In total, 32 plots were set up in our study, each plot with an area of 32 m2 (10 m × 6.4 m).
Planting and crop management were described in our previous studies (Kuang et al., 2018; Li et al., 2020). Briefly, plastic film was used to cover four cotton rows with row spacing of 30-50-30 cm. For each plastic film in drip-irrigated treatments, drip tapes were installed between two cotton rows (30 cm apart) and the distance between every two emitters was 10 cm. The water flow rate in emitter was 2–3 L h−1. In each plot, water and fertilizer-integrated tanks were placed to record the amount of irrigation and urea application. Over the experimental period, cotton in the drip irrigation system had received 9 times of irrigation, with each irrigation providing approximately 45 mm water. In contrast, cotton in the flood irrigation system had received 7 times irrigation of approximately 140 mm water for each irrigation.
2.3 Soil N2O gas sampling and analysis
2.3.1 Surface N2O emissions
The static chamber method was used to monitor soil surface N2O flux (Kuang et al., 2018). The sampling frequency was once or twice per week to make sure a sampling was done within 1–2 days after irrigation and fertilization events. The sampling time was 10:00-14:00 (GMT+8) during the day, and N2O concentration in gas samples during this time period was used to represent the daily average.
2.3.2 Profile N2O collection
Soil profile N2O concentration was measured simultaneously with the surface N2O emissions. Soil profile N2O gas at depths of 5, 15, 30, and 60 cm were collected using an in-situ soil profile gas sampler (for more details, see Kuang et al. (2019)). Briefly, the gas sampler was composed of four individual silicone tubes (5.0 cm long, 36.8 mm i. d., 40.0 mm o. d.) that air but not water can go through and sealed at both ends. The silicone tube was covered by a polyethylene (PE) pipe (5.0 cm long, 40.8 mm i. d., 50.0 mm o. d.) to determine the soil N2O gas sampling depth by the holes in the wall of the PE pipe. A hollow stainless-steel tube (0.6 mm i. d.) with a sampling port was used to collect soil N2O gas at each depth.
In each plot, one soil profile sampler was installed between cotton rows. 35 ml gas samples from each soil depth were collected through the corresponding sampling port using the disposable airtight syringe. The gas sample was then injected into pre-evacuated 35-ml gas-tight aluminum bags (Hede Technologies, Dalian, China). In total, gas samplings were performed 13 times between 14 May and 9 November (DOY 135–314) during 2016. The N2O concentrations were analyzed using a gas chromatography (Agilent 7890A, Agilent Technologies, Santa Clara, CA) equipped with an electron capture detector.
The effluxes of N2O within soil profiles were calculated based on Fick’s law using the following equation (Marshall, 1959).
where q is the soil N2O efflux (g m−2 s−1); Dp is the soil gas diffusion coefficient in each soil depth (m−3 m−1 s−1); dc is the difference of N2O concentration in the air between two soil depths, dz is the distance between two soil depths (m). When dc is the difference between the soil at 5 cm depth and air N2O concentrations in the atmosphere, it is used to assume the N2O emission rate of the soil surface. The efflux gradient between two soil depths was used to characterize N2O production rates at different soil layers using the following equation (Yoh et al., 1997; Kusa et al., 2010; Nan et al., 2016).
where Pi and qi are the N2O production rate (g m−2 s−1) and efflux (g m−2 s−1) of each soil layer, respectively.
Soil gas diffusion coefficient Dp was estimated using the SWLR (structure-dependent water-induced linear reduction) model (Moldrup et al., 2013).
where D0 is the gas diffusion coefficient (m−2 s−1); ε is the soil air-filled porosity (m3 m3); Φ is the soil porosity (m3 m3); Cm is the media complexity factor in the SWLR model, and Moldrup et al. (2013) recommended a value of 2.1 for Cm in intact soils after comparing several prediction models.
where ρs is the average particle soil density (2.65 g m−3); and θ is the soil bulk density (g m−3) and soil volumetric water content of each soil layer. The diffusion coefficient D0 was calculated based on temperature and pressure using the following equation (Campbell, 1985):
where T and P are the temperature (°C) and air pressure (Pa), respectively; Ds is 1.43 × 10⁻⁵ m2 s−1, that is the diffusion coefficient of N2O in free air at the reference temperature (273.15 K) and reference air pressure P0 (1 atm) (Pritchard and Currie, 1982). P values for each sampling day were derived from a weather station in the field.
The growing-season cumulative N2O emissions (ƩN2O, g N2O-N ha−1) were calculated by summing up the daily average emissions calculated from the concentration gradient method. Linear interpolation was used to estimate the missing values where a sampling was not conducted. Similar method was used to calculate the cumulative N2O production (ƩN2OP, g N2O-N ha−1) from different soil layers.
2.4 Soil sampling and analysis
In each plot, three soil samples of 0–20 cm were collected on the day of gas collection and mixed as one soil sample to measure the concentrations of NH4+-N and NO3−-N over the experiment. Soil temperature and volumetric water content (VWC) were measured using a sensor and data were collected using a data logger. For details about the sensor and logger see Kuang et al. (2018). The installation positions of sensors were at 5, 15, 30, and 60 cm under the drip tape in the drip irrigation treatment and the corresponding location in the flood irrigation treatment. Soil WFPS was calculated as follows:
Where, in each layer, BD is bulk density (Mg m−3) and PD is particle density (assumed 2.65 Mg m−3).
2.5 Statistical analysis
A two-way analysis of variance was used to test the main and interactive effects of fertilizer treatment and irrigation method on ƩN2O and ƩN2OP (PROC MIXED). The N resource and irrigation were considered as fixed factors, while plot replicates were considered as random factors. Means of treatments were compared using the least significant differences when the main or interactive effects were significant. The relationship between N2O concentration and temperature, WFPS, air content at 5, 15, 30, and 60 cm depths, as well as NO3−-N and NH4+-N of 0–20 cm top soil were examined by regression analysis. Similar regression analysis was used to examine the relationship of N2O flux rates between the concentration-gradient method (GM) and the closed-chamber method (CM). The surface N2O flux rates based on the closed-chamber method were previously reported by Kuang et al. (2018) and used in this study for comparison between the two methods. The normality and homogeneity of variance were checked before analysis. Differences were considered as significant at p < 0.05. All analysis were performed using the Statistical Analysis Software package (SAS Institute, 2011).
3 Results
3.1 Environmental and soil conditions
Irrespective of irrigation type, soil temperature at 5 cm soil depth followed a similar trend as for air temperature, gradual increased from April to July and then decreased (Figure 1). The annual total precipitation was 50 mm in 2016. In comparison, the total water addition was 593 mm and 982 mm for drip and flood irrigation plots, respectively, which accounted for 92%–95% of the total water inputs. Soil WFPS in both drip and flood irrigation soils showed large fluctuations in response to irrigation and rainfall events, which ranged from 7.4%–43.1% and 6.4%–46.7% for drip and flood irrigation, respectively. For drip irrigation plots, soil WFPS increased with irrigation events at 5, 15, 30, and 60 cm depths, but the peaks at 5 and 15 cm depths tended to be larger than those at 30 and 60 cm. For flood irrigation plots, soil WFPS at 5, 15, 30, and 60 cm layers increased with irrigation events, with similar peaks in different depths, but the rate of water decline in deeper soils was generally slower than that in shallow soils.
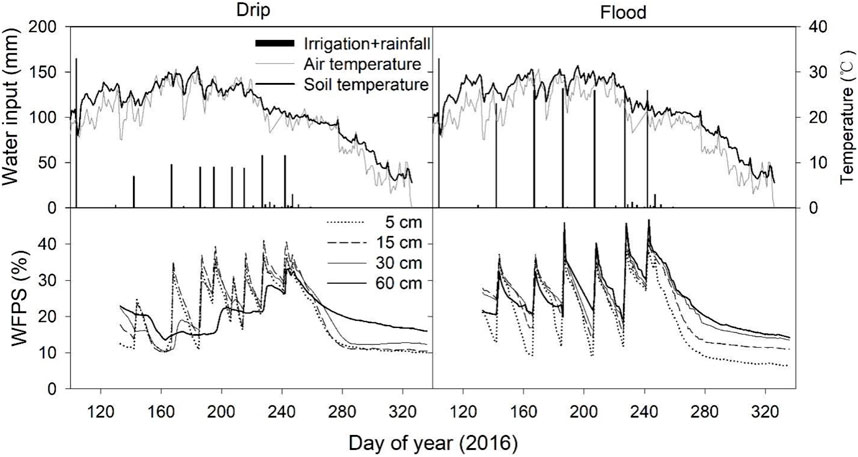
FIGURE 1. Daily water input (irrigation + rainfall), air temperature and soil temperatures at 5 cm depth, and water-filled pore space (WFPS) at 5, 15, 30, and 60 cm depths under drip and flood irrigation.
3.2 Soil N2O concentrations
Soil N2O concentrations at different depths showed similar temporal patterns over the experimental period with two clear peaks occurred on Day 235 and 265 (Figure 2). Soil N2O concentrations in Control, Urea, U + M, and Manure treatments under drip irrigation ranged from 290-480, 283-504, 298-479, and 298-505 nL L−1, respectively. In contrast, soil N2O concentration in Control, Urea, U + M, and Manure under flood irrigation ranged from 260-473, 293-532, 286-477, and 304-487 nL L−1, respectively. The average soil N2O concentration in the drip-irrigated plots slightly decreased with depth, being 359, 346, 340, and 333 nL L−1 at 5, 15, 30, and 60 cm, respectively.
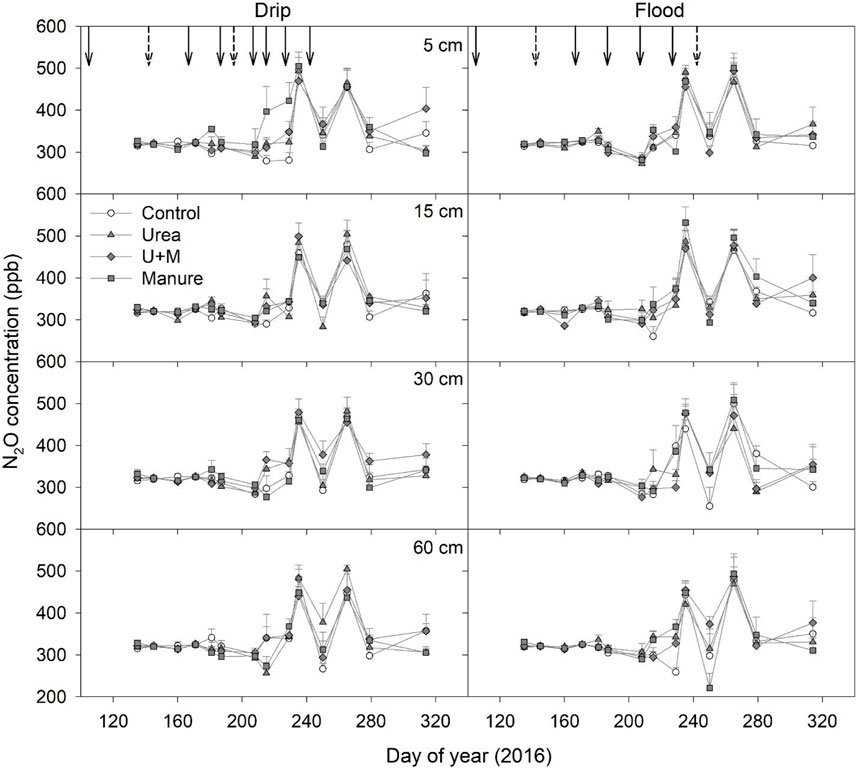
FIGURE 2. N2O concentration at each depth as affected by fertilizer treatments under drip and flood irrigation. Dashed arrows indicate dates of irrigation only, and solid arrow indicates date of irrigation and urea application. Means +1 standard error (n = 4) are presented.
3.3 N2O efflux rate
The soil N2O efflux rate at each depth varied with fertilization and irrigation treatments. The peak N2O efflux rate was higher under flood irrigation (42.91 μg N m−2 h−1) than under drip irrigation (20.63 μg N m−2 h−1) treatment, and all fertilization treatments had higher N2O efflux peaks than the control (drip: 18.73 μg N m−2 h−1, flood: 36.13 μg N m−2 h−1) under both drip and flood irrigation conditions. Across all treatments, the 0–5 cm soil depth had the highest N2O efflux rate, ranging from −4.60–42.91 μg N m−2 h−1 (Figure 3).
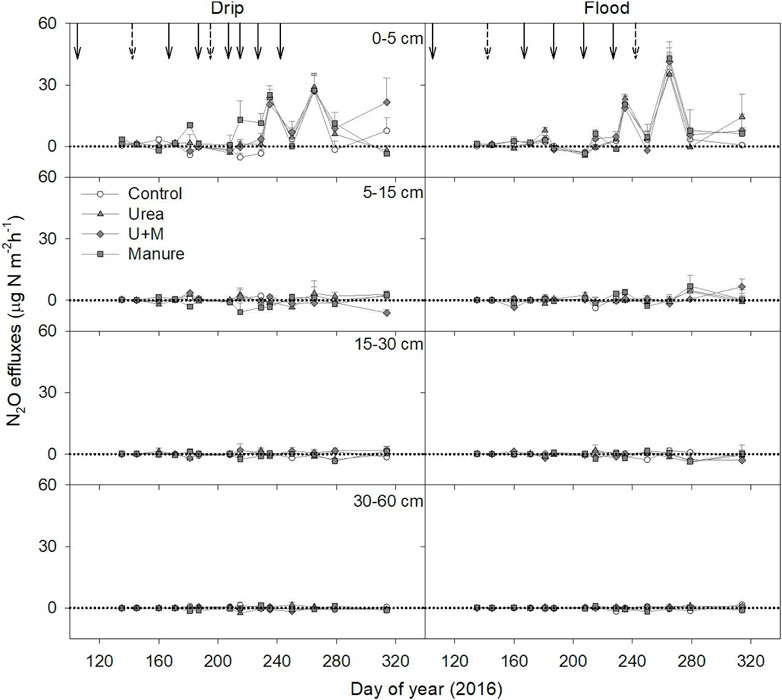
FIGURE 3. The N2O effluxes at each soil layer as affected by fertilizer treatments under drip and flood irrigation. Dashed arrows indicate dates of irrigation only, and solid arrow indicates date of irrigation and fertigation of urea applications. Means +1 standard error (n = 4) are presented.
3.4 N2O production rate
The N2O production rates of different soil depths were calculated from the N2O efflux rates of two adjacent layers. Overall, the N2O production rate in the profile decreased with increasing soil depth irrespective of fertilizer and irrigation treatments, with the 0–5 cm layer having the highest N2O production rate (Figure 4). The N2O production rates in the 0–5 cm soil layer were 3.3, 4.2, 6.5, and 8.0 μg N m−2 h−1 for Control, Urea, U + M, and Manure treatments under drip irrigation, respectively.
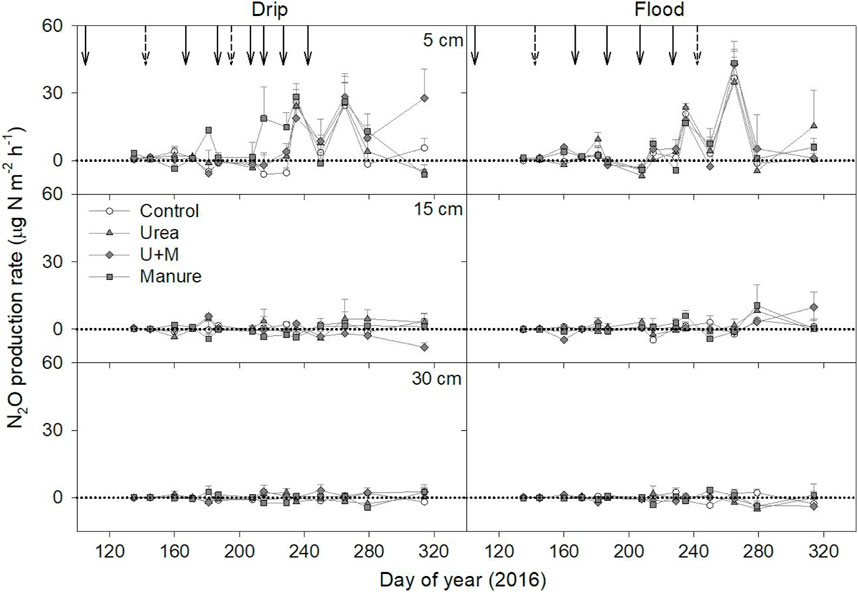
FIGURE 4. N2O production rate at each depth as affected by fertilizer treatments under drip and flood irrigation. Dashed arrows indicate dates of irrigation only, and solid arrow indicates date of irrigation and fertigation of urea applications. Means +1 standard error (n = 4) are presented.
Cumulative N2O production was higher in the 0–5 cm soil layer than other depths under all treatments, and average cumulative N2O production at 5, 15, 30, and 60 cm layers were 248, 27, −10, and −3 g N ha-1, respectively (Table 2). Calculation of the contribution of cumulative N2O production in each soil depth to surface N2O emissions based on the concentration-gradient method showed that the 0–5 cm and 5–15 cm depths contributed to all surface N2O emissions, with the 0–5 cm soil depth contributing 87%–100% of the surface emissions. The contribution of cumulative N2O production from the 0–5 cm soil layer to surface N2O emissions was significantly affected (p < 0.05) by irrigation treatment, being 99% and 87% for drip and flood irrigation conditions, respectively.
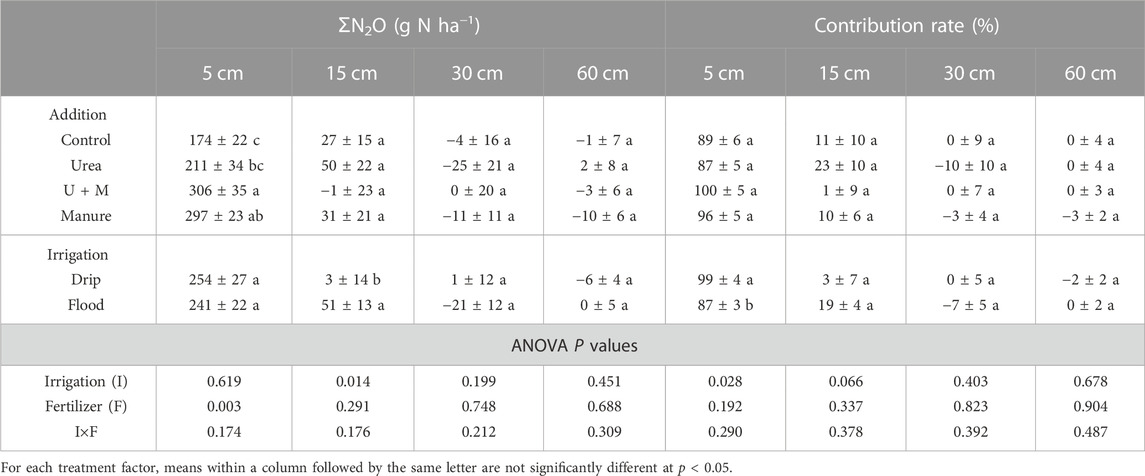
TABLE 2. Cumulative N2O production (ƩN2O) and contribution rate of each soil layer over growing season, as affected by N addition and irrigation treatments. Values are means ±1 standard error, n = 4.
3.5 Comparison of surface N2O emission and flux between GM and CM
Using the data of surface N2O flux measured by the closed-chamber method reported by Kuang et al. (2018), we compared the surface N2O emission and flux between CM and GM (Table 3). Results showed a non-significant (p = 0.128) relationship of N2O flux between CM and GM. Fertilizer treatments significantly affected cumulative surface N2O emissions based on these two methods (p < 0.05), with a numerical trend of Control < Urea < U + M < Manure (Table 3). There was no significant difference in the effect of the irrigation method on cumulative N2O emissions based on the concentration-gradient method, but the closed-chamber method showed cumulative N2O emissions significantly higher under drip irrigation than flood irrigation (p < 0.05).
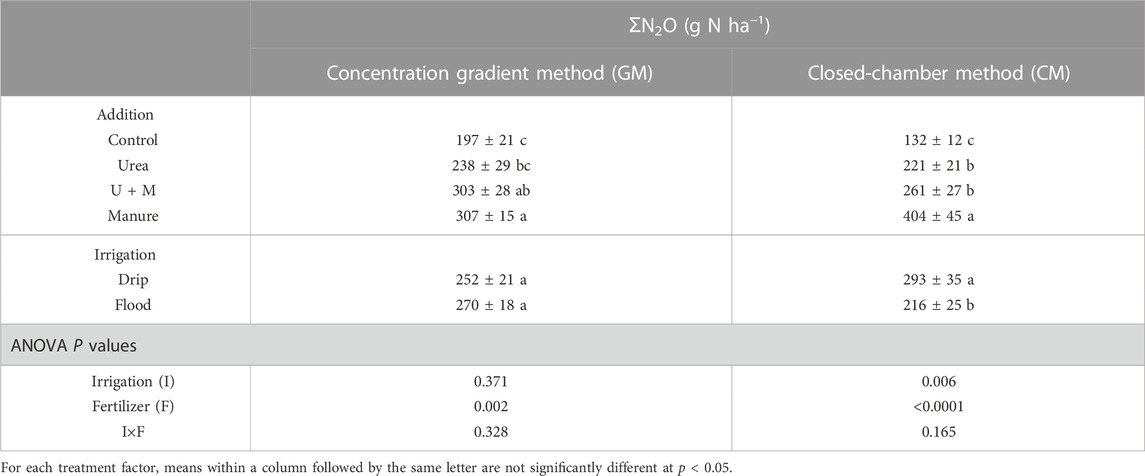
TABLE 3. Cumulative N2O emissions (ƩN2O) as affected by N addition and irrigation treatments based on concentration gradient and closed-chamber methods. Values are means ±1 standard error, n = 4.
3.6 Relationship between soil profile N2O concentration and environmental factors
Pearson correlation analysis was used to investigate the relationships of soil profile N2O concentration with soil temperature, WFPS, soil pore air content and inorganic N content of 0–20 cm depth. Results showed a significantly (p < 0.05) negative relationship between soil profile N2O concentration and soil temperature (Table 4). A significantly (p < 0.05) negative relationship was also shown between soil N2O concentration at 15, 30, and 60 cm soil depth and NO3−-N content at 0–20 cm soil depth, however, N2O concentration at 5 cm depth was significantly and positively correlated with NH4+-N content at 0–20 cm depth (p < 0.05). In addition, there was a significantly (p < 0.05) positive correlation between N2O concentrations in different soil layers.
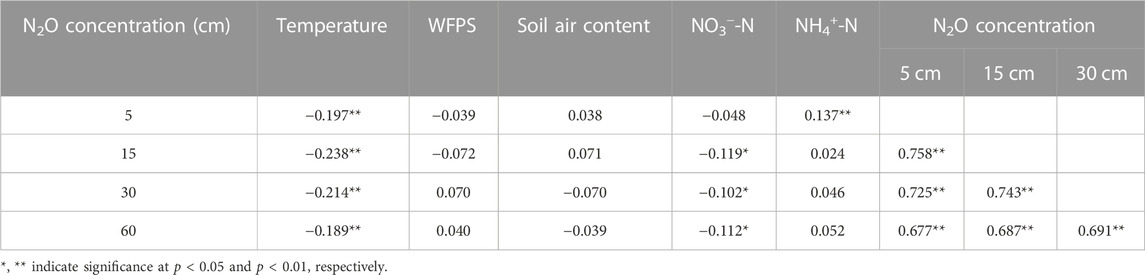
TABLE 4. Pearson correlation coefficients (n = 448) between N2O concentration and temperature, WFPS, air content at 5, 15, 30, and 60 cm depths, as well as NO3−-N and NH4+-N of 0–20 cm top soil.
4 Discussion
4.1 Low N2O emissions from cotton fields in the arid region are due to the generally low N2O production and the transmission of N2O from the near-surface soil to the subsoil
In this study, soil N2O concentrations were generally low in all soil layers under both drip and flood irrigation conditions, with average N2O concentrations ranging from 333-359 nL L−1 in the profile, much lower than values reported in previous studies for other terrestrial ecosystems (Wang et al., 2013; Nan et al., 2016; Zhou et al., 2016; Wang et al., 2018; Yao et al., 2018). During the observation period, the cumulative N2O production from different soil layers ranged from −25–306 g N ha−1, which were also lower than previous reported results by Yao et al. (2018). These results indicate low N2O concentrations and production in sandy soils, which were likely associated with the low soil moisture and C content (Kuang et al., 2018; Yin et al., 2019).
Soil surface N2O emissions are a net gas exchange between soil and atmosphere and N2O concentrations at different depths reflect the combined effects of N2O processes in the soil. Several previous studies have found that N2O concentrations increased with increasing soil depth, with high N2O concentrations in the subsoil but a low contribution to surface N2O emissions (Wang et al., 2013; Wang et al., 2018; Yao et al., 2018), mainly because N2O produced in the subsoil may undergo complete denitrification to N2 during upward transport (Gao et al., 2014; Kuang et al., 2019). In contrast, the N2O concentrations through the soil profiles in this study were all low, and the overall distribution pattern was uniform or higher in the surface soil layer than in the bottom layer. These results implies that the deep-depth soil may be a sink for these processes in cotton fields in the arid zone, and this inference can be validated by the fact that the cumulative N2O production in the 30 and 60 cm layers was mostly negative (Table 1). Furthermore, some previous studies have also found higher N2O concentrations in the near-surface soil than in the subsoil with a high soil moisture (Sotomayor and Rice, 1999). The low soil N2O concentrations also indicate that sandy soils were conducive to nitrification process under the aerobic condition, and denitrification process under the anerobic conditions. These biological processes need involvements of soil microbe and organic C, which are generally low in sandy soils as in the current study. Low water holding capacity and high hydraulic conductivity in sandy soils could have decreased WFPS to a level less conducive to denitrification. In addition, the high permeability of sandy soil could facilitate the vertical transfer of N2O between depths, and thus a less differentiated concentration gradient.
4.2 Topsoil is the main source of N2O emissions from this cotton field in the arid region
The topsoil (0–15 cm) contributed to all the surface N2O emissions in the present study, which is consistent to previous studies (Nan et al., 2016; Yao et al., 2018; Li et al., 2021). There might be two reasons for the high N2O production rate of topsoil. The first reason is that the surface soil contains a high concentration of organic carbon and nitrogen due to the suitable temperature and humidity, which stimulate litter and root decomposition as well as the mineralization of organic fertilizer and urea. Second, the higher temperature and humidity in the topsoil promote the occurrence of microbial processes that produce N2O (Kuang et al., 2019). According to Li et al. (2021), surface N2O emissions were mostly associated with the topsoil of 0–15 cm under a drip irrigation cotton field. Nan et al. (2016) also reported that surface N2O emissions originated entirely from 0-30 cm layer. These may be due to the high microbial activity of soils in the 0–30 cm layer, which was dominated by N fertilizer-induced N2O production (Wang et al., 2013). In contrast, the study’s findings that subsoil may contribute negatively to surface N2O emissions are primarily attributable to the higher gas diffusion coefficient caused by the lower water retention capacity of the sandy soil in the region. This assumption is supported by the fact that N2O concentrations in different soil layers correlated positively with one another (Table 4). These results indicated that topsoil was the main source of surface N2O emissions, and the subsoil played a completely different role in N2O production and consumption in different studies. Thus, the role of the subsoil should be considered when studying the processes of N2O emissions from the more permeable sandy soils.
Over the study period, the cumulative N2O emissions in the topsoil of 0–5 cm contributed 87%–100% of the surface N2O emissions. It showed a significant positive correlation (p < 0.05) with soil NH4+-N content but a non-significant negative correlation (p > 0.05) with soil NO3−-N content at 0–20 cm depth (Table 4). These results imply that the nitrification process may be the main source of N2O production in 0–5 cm soils, due to the low WFPS (10%–40%) of 0–5 cm soil layer and its decreased sharply after irrigation or rainfall events (Figure 1), which create a suitable condition for nitrification. Similarly, Bateman and Baggs (2005) also found that nitrification was the main pathway of N2O production in sandy loam soils with 35%–60% WFPS using the 15N labeling method.
4.3 The key soil layers effected by nitrogen management and irrigation which on N2O production are different
Both GM and CM results showed that the addition of manure significantly increased the N2O flux, which was consistent with the result reported by Zhou et al. (2017). Manure addition can increase soil C availability and also the activities of associated N-cycling microbes, and consequently stimulate the nitrification and denitrification processes (Lessard et al., 1996). In addition, some studies have shown that simultaneous inputs of C and NH4+ into the soil, can promote the emission of N2O more than the addition of NH4+ alone (Bergstrom et al., 1994). In the current study, through the N2O production and consumption in the profile, it can be found that the addition of manure significantly increased N2O production in the 0–5 cm layer. That is, the influence of the N source on the N2O production of the profile is mainly manifested in the surface layer (0–5 cm). This may be related to the mixing of manure with surface soil (0–20 cm) in this study. The topsoil has higher microbial activity than the subsoil (Uchida et al., 2011). Abundant organic C compounds and available nitrogen in manure provide sufficient energy and substrates for the nitrifying and denitrifying reactions of surface soil microbial biomass which was promoted N2O emission (Lentz et al., 2014). Furthermore, the correlation between N2O (0–5 cm) production and NH4+-N, shows that the increase in N2O flux caused by manure addition is the result of nitrification.
Using both individual experiment and meta-analysis, previously reported that flood and furrow irrigation resulted in significantly higher N2O emission than drip irrigation (Sánchez-Martín et al., 2008; Kuang et al., 2021). In this study, GM was used to find that flood irrigation significantly increased the cumulative production of N2O in the 5–15 cm compared with drip irrigation, further confirming that the effect in the irrigation method on N2O production was mainly expressed in the sub-surface layer. This may be associated with the disparities of soil profile water status caused by different irrigation methods. Compared with drip irrigation, the water content in the whole profile under flood irrigation was higher and decreased more slowly, which provided a optimal moisture condition for the production of N2O in the profile (Kuang et al., 2019). In addition, the higher risk of N leaching under flood irrigation may have increased the nitrogen content at 5–15 cm depth, enhancing nitrification/denitrification processes and thus increasing N2O production. In this study, no significant interaction between irrigation and N source treatments on N2O production in each soil layer was found. Although a discrepancy exists in the N2O emission estimated by the CM and GM, the trend of cumulative N2O emissions under different treatments is consistent. Therefore, GM’s ability to provide abundant information on profile N2O production, reduction, and diffusion is commendable.
5 Conclusion
In the current study, soil N2O concentrations were generally low in all soil layers under both drip and flood irrigation conditions, with average N2O concentrations ranging from 333-359 nL L−1 through the soil profile. Such low N2O concentration and efflux in sandy soils were mainly attributed to the generally low N2O production due to low soil moisture and C availability. Soil N2O concentrations decreased with increasing soil depth, and had similar seasonal patterns in different soil layers, indicating that the subsoil was a N2O sink, which also explained the low N2O emissions in the current study. Additionally, the topsoil (0–15 cm) contributed all the surface N2O emissions, with a contribution of 87%–100% at a topsoil of 0–5 cm. The increase of soil moisture and C, N availability under N source and irrigation treatments were the main factors influencing the N2O production in the 5 and 15 cm soil layers. N inputs through synthetic fertilizer or manure significantly increased N2O concentration and production at 0–15 cm. Flood irrigation resulted in higher N2O concentration and production compared to drip irrigation. The results confirm that soil water and nitrogen management are important drivers of N2O production and diffusion in soil profiles of croplands in arid region. Use of nitrification inhibitor to slow N transformation process in soils can be an effective strategy to reduce N2O production and emissions in arid regions. Future research is also needed to incorporate fertilizer into drip irrigation strategy, i.e., fertigation, to develop effective strategies for enhancing crop productivity while mitigating GHG emissions.
Data availability statement
The raw data supporting the conclusions of this article will be made available by the authors, without undue reservation.
Author contributions
XG: Conceptualization. WK and YW: Data curation. WK and XG: Funding acquisition. WK, MY, and YW: Investigation. XG: Methodology. FZ: Software, Supervision. DG: Visualization WK and YW: Writing–original draft. WK, XG, and YW: Writing–review and editing.
Funding
This research was funded by the Open Fund of Cele National Station of Observation and Research for Desert-Grassland Ecosystem (No. CLSF202101), Fundamental Research Funds for the Central Universities (BLX201904), National Natural Science Foundation of China (No. 31870499).
Conflict of interest
The authors declare that the research was conducted in the absence of any commercial or financial relationships that could be construed as a potential conflict of interest.
Publisher’s note
All claims expressed in this article are solely those of the authors and do not necessarily represent those of their affiliated organizations, or those of the publisher, the editors and the reviewers. Any product that may be evaluated in this article, or claim that may be made by its manufacturer, is not guaranteed or endorsed by the publisher.
References
Ball, B. C., McTaggart, I. P., and Scott, A. (2004). Mitigation of greenhouse gas emissions from soil under silage production by use of organic manures or slow-release fertilizer. Soil Use Manage 20 (3), 287–295. doi:10.1079/sum2004257
Bateman, E. J., and Baggs, E. M. (2005). Contributions of nitrification and denitrification to N2O emissions from soils at different water-filled pore space. Biol. Fert. Soils 41 (6), 379–388. doi:10.1007/s00374-005-0858-3
Bergstrom, D. W., Tenuta, M., and Beauchamp, E. G. (1994). Increase in nitrous oxide production in soil induced by ammonium and organic carbon. Biol. Fert. Soils 18 (1), 1–6. doi:10.1007/bf00336436
Bronson, K. F., Hunsaker, D. J., Williams, C. F., Thorp, K. R., Rockholt, S. M., Del Grosso, S. J., et al. (2018). Nitrogen management affects nitrous oxide emissions under varying cotton irrigation systems in the desert southwest, USA. J. Environ. Qual. 47 (1), 70–78. doi:10.2134/jeq2017.10.0389
Campbell, G. S. (1985). Soil physics with BASIC. Soil science society of America book series: 5 methods of soil analysis Part I-physical and mineralogical methods. Amsterdam: Elsevier Science Publishers BV.
Fentabil, M. M., Nichol, C. F., Neilsen, G. H., Hannam, K. D., Neilsen, D., Forge, T. A., et al. (2016). Effect of micro-irrigation type, N-source and mulching on nitrous oxide emissions in a semi-arid climate: An assessment across two years in a Merlot grape vineyard. Agric. Water Manage. 171, 49–62. doi:10.1016/j.agwat.2016.02.021
Forte, A., Fagnano, M., and Fierro, A. (2017). Potential role of compost and green manure amendment to mitigate soil GHGs emissions in Mediterranean drip irrigated maize production systems. J. Environ. Manage. 192, 68–78. doi:10.1016/j.jenvman.2017.01.037
Gao, X., Rajendran, N., Tenuta, M., Dunmola, A., and Burton, D. L. (2014). Greenhouse gas accumulation in the soil profile is not always related to surface emissions in a prairie pothole agricultural landscape. Soil Sci. Soc. Am. J. 78 (3), 805–817. doi:10.2136/sssaj2013.05.0157
Hayakawa, A., Akiyama, H., Sudo, S., and Yagi, K. (2009). N2O and NO emissions from an Andisol field as influenced by pelleted poultry manure. Soil Biol. biochem. 41 (3), 521–529. doi:10.1016/j.soilbio.2008.12.011
Ju, X., Lu, X., Gao, Z., Chen, X., Su, F., Kogge, M., et al. (2011). Processes and factors controlling N2O production in an intensively managed low carbon calcareous soil under sub-humid monsoon conditions. Environ. Pollut. 159 (4), 1007–1016. doi:10.1016/j.envpol.2010.10.040
Kuang, W., Gao, X., Gui, D., Tenuta, M., Flaten, D. N., Yin, M., et al. (2018). Effects of fertilizer and irrigation management on nitrous oxide emission from cotton fields in an extremely arid region of northwestern China. Field Crops Res. 229, 17–26. doi:10.1016/j.fcr.2018.09.010
Kuang, W., Gao, X., Tenuta, M., Gui, D., and Zeng, F. (2019). Relationship between soil profile accumulation and surface emission of N2O: Effects of soil moisture and fertilizer nitrogen. Biol. Fert. Soils 55 (2), 97–107. doi:10.1007/s00374-018-01337-4
Kuang, W., Gao, X., Tenuta, M., and Zeng, F. (2021). A global meta-analysis of nitrous oxide emission from drip-irrigated cropping system. Glob. Change Biol. 27 (14), 3244–3256. doi:10.1111/gcb.15636
Kusa, K., Sawamoto, T., Hu, R., and Hatano, R. (2010). Comparison of N2O and CO2 concentrations and fluxes in the soil profile between a gray lowland soil and an andosol. Soil Sci. Plant Nutr. 56, 186–199. doi:10.1111/j.1747-0765.2009.00439.x
Lentz, R. D., Ippolito, J. A., and Spokas, K. A. (2014). Biochar and manure effects on net nitrogen mineralization and greenhouse gas emissions from calcareous soil under corn. Soil Sci. Soc. Am. J. 78 (5), 1641–1655. doi:10.2136/sssaj2014.05.0198
Lessard, R., Rochette, P., Gregorich, E. G., Pattey, E., and Desjardins, R. L. (1996). Nitrous oxide fluxes from manure-amended soil under maize. Soil Sci. Soc. Am. J. 25, 1371–1377. doi:10.2134/jeq1996.00472425002500060029x
Li, Z., Zhang, R., Wang, X., Chen, F., Lai, D., and Tian, C. (2014). Effects of plastic film mulching with drip irrigation on N2O and CH4 emissions from cotton fields in arid land. J. Agric. Sci. 152 (4), 534–542. doi:10.1017/s0021859613000701
Li, Y., Gao, X., Tenuta, M., Gui, D., Li, X., Xue, W., et al. (2020). Enhanced efficiency nitrogen fertilizers were not effective in reducing N2O emissions from a drip-irrigated cotton field in arid region of Northwestern China. Sci. Total Environ. 748, 141543. doi:10.1016/j.scitotenv.2020.141543
Li, Y., Gao, X., Tenuta, M., Gui, D., Li, X., and Zeng, F. (2021). Linking soil profile N2O concentration with surface flux in a cotton field under drip fertigation. Environ. Pollut. 285, 117458. doi:10.1016/j.envpol.2021.117458
Marshall, T. J. (1959). The diffusion of gas through porous media. Eur. J. Soil Sci. 10 (1), 79–82. doi:10.1111/j.1365-2389.1959.tb00667.x
Meijide, A., Diez, J. A., Sanchez-Martin, L., Lopez-Fernandez, S., and Vallejo, A. (2007). Nitrogen oxide emissions from an irrigated maize crop amended with treated pig slurries and composts in a Mediterranean climate. Agric. Ecosyst. Environ. 121 (4), 383–394. doi:10.1016/j.agee.2006.11.020
Meng, L., Ding, W., and Cai, Z. (2005). Long-term application of organic manure and nitrogen fertilizer on N2O emissions, soil quality and crop production in a sandy loam soil. Soil Biol. biochem. 37 (11), 2037–2045. doi:10.1016/j.soilbio.2005.03.007
Moldrup, P., Chamindu Deepagoda, T. K. K., Hamamoto, S., Komatsu, T., Kawamoto, K., Rolston, D. E., et al. (2013). Structure-dependent water-induced linear reduction model for predicting gas diffusivity and tortuosity in repacked and intact soil. Vadose Zone J. 12 (3), 1–11. doi:10.2136/vzj2013.01.0026
Nan, W., Yue, S., Li, S., Huang, H., and Shen, Y. (2016). Characteristics of N2O production and transport within soil profiles subjected to different nitrogen application rates in China. Sci. Total Environ. 542, 864–875. doi:10.1016/j.scitotenv.2015.10.147
Pritchard, D. T., and Currie, J. A. (1982). Diffusion of coefficients of carbon dioxide, nitrous oxide, ethylene and ethane in air and their measurement. J. Soil Sci. 33 (2), 175–184. doi:10.1111/j.1365-2389.1982.tb01757.x
Ravishankara, A. R., Daniel, J. S., and Portmann, R. W. J. S. (2009). Nitrous oxide (N2O): The dominant ozone-depleting substance emitted in the 21st century. Science 326 (5949), 123–125. doi:10.1126/science.1176985
Sánchez-Martín, L., Arce, A., Benito, A., Garcia-Torres, L., and Vallejo, A. (2008). Influence of drip and furrow irrigation systems on nitrogen oxide emissions from a horticultural crop. Soil Biol. biochem. 40 (7), 1698–1706. doi:10.1016/j.soilbio.2008.02.005
Sotomayor, D., and Rice, C. W. (1999). Soil air carbon dioxide and nitrous oxide concentrations in profiles under tallgrass prairie and cultivation. J. Environ. Qual. 28 (28), 784–793. doi:10.2134/jeq1999.00472425002800030008x
Tao, R., Wakelin, S. A., Liang, Y., Hu, B., and Chu, G. (2018). Nitrous oxide emission and denitrifier communities in drip-irrigated calcareous soil as affected by chemical and organic fertilizers. Sci. Total Environ. 612, 739–749. doi:10.1016/j.scitotenv.2017.08.258
Tian, H. Q., Yang, J., Xu, R. T., Lu, C. Q., Canadell, J. G., Davidson, E. A., et al. (2019). Global soil nitrous oxide emissions since the preindustrial era estimated by an ensemble of terrestrial biosphere models: Magnitude, attribution, and uncertainty. Glob. Change Biol. 25 (2), 640–659. doi:10.1111/gcb.14514
Tian, H., Xu, R., Canadell, J. G., Thompson, R. L., Winiwarter, W., Suntharalingam, P., et al. (2020). A comprehensive quantification of global nitrous oxide sources and sinks. Nature 586 (7828), 248–256. doi:10.1038/s41586-020-2780-0
Uchida, Y., Clough, T. J., Kelliher, F. M., Hunt, J. E., and Sherlock, R. R. (2011). Effects of bovine urine, plants and temperature on N2O and CO2 emissions from a sub-tropical soil. Plant Soil 345 (1-2), 171–186. doi:10.1007/s11104-011-0769-z
United States Department of Agriculture (USDA) (1999). A basic system of soil classification for making and interpreting soil surveys, 2nd Edition. in USDA NRCS Agriculture Handbook, No. 436. Washington, DC: U.S. Gov. Print. Office.
Vallejo, A., Skiba, U., Garciatorres, L., Arce, A., Lopezfernandez, S., and Sanchezmartin, L. (2006). Nitrogen oxides emission from soils bearing a potato crop as influenced by fertilization with treated pig slurries and composts. Soil Biol. biochem. 38 (9), 2782–2793. doi:10.1016/j.soilbio.2006.04.040
Vázquez, N., Pardo, A., Suso, M. L., and Quemada, M. (2006). Drainage and nitrate leaching under processing tomato growth with drip irrigation and plastic mulching. Agric. Ecosyst. Environ. 112 (4), 313–323. doi:10.1016/j.agee.2005.07.009
Velthof, G. L., Kuikman, P. J., and Oenema, O. (2003). Nitrous oxide emission from animal manures applied to soil under controlled conditions. Biol. Fert. Soils 37 (4), 221–230. doi:10.1007/s00374-003-0589-2
Wang, Y., Hu, C., Ming, H., Zhang, Y., Li, X., Dong, W., et al. (2013). Concentration profiles of CH4, CO2 and N2O in soils of a wheat-maize rotation ecosystem in North China Plain, measured weekly over a whole year. Agr. Ecosyst. Environ. 164, 260–272. doi:10.1016/j.agee.2012.10.004
Wang, Y., Li, X., Dong, W., Wu, D., Hu, C., Zhang, Y., et al. (2018). Depth-dependent greenhouse gas production and consumption in an upland cropping system in northern China. Geoderma 319, 100–112. doi:10.1016/j.geoderma.2018.01.001
Yao, P., Li, X., Liu, J., Shen, Y., Yue, S., and Li, S. (2018). The role of maize plants in regulating soil profile dynamics and surface emissions of nitrous oxide in a semiarid environment. Biol. Fert. Soils 54 (1), 119–135. doi:10.1007/s00374-017-1243-8
Yin, M., Gao, X., Tenuta, M., Kuang, W., and Zeng, F. (2019). Manure application increased denitrifying gene abundance in a drip-irrigated cotton field. PeerJ 7 (5), e7894. doi:10.7717/peerj.7894
Yoh, M., Toda, H., Kanda, K., and Tsuruta, H. (1997). Diffusion analysis of N2O cycling in a fertilized soil. Nutr. Cycl. Agroecosys. 49 (1-3), 29–33. doi:10.1023/A:1009757829417
Zhou, Z., Xin, X., Bi, Z., Lu, L., and Xiong, Z. (2016). Soil concentration profiles and diffusion and emission of nitrous oxide influenced by the application of biochar in a rice-wheat annual rotation system. Environ. Sci. Pollut. R. 23, 7949–7961. doi:10.1007/s11356-015-5929-x
Keywords: profile N2O concentration, concentration-gradient method, nitrous oxide, drip irrigation, manure
Citation: Kuang W, Wu Y, Gao X, Yin M, Gui D and Zeng F (2023) Soil profile N2O efflux from a cotton field in arid Northwestern China in response to irrigation and nitrogen management. Front. Environ. Sci. 11:1123423. doi: 10.3389/fenvs.2023.1123423
Received: 21 December 2022; Accepted: 20 February 2023;
Published: 01 March 2023.
Edited by:
Lu-Jun Li, Northeast Institute of Geography and Agroecology (CAS), ChinaReviewed by:
Wenxu Dong, Institute of Genetics and Developmental Biology (CAS), ChinaJianlin Shen, Institute of Subtropical Agriculture (CAS), China
Copyright © 2023 Kuang, Wu, Gao, Yin, Gui and Zeng. This is an open-access article distributed under the terms of the Creative Commons Attribution License (CC BY). The use, distribution or reproduction in other forums is permitted, provided the original author(s) and the copyright owner(s) are credited and that the original publication in this journal is cited, in accordance with accepted academic practice. No use, distribution or reproduction is permitted which does not comply with these terms.
*Correspondence: Wennong Kuang, a3Vhbmd3bkBiamZ1LmVkdS5jbg==; Xiaopeng Gao, WGlhb3BlbmcuR2FvQHVtYW5pdG9iYS5jYQ==
†These authors have contributed equally to this work and share first authorship