 Xiaozhi Xu
 Yu Zhang
 Liou Wu
94% of researchers rate our articles as excellent or good
Learn more about the work of our research integrity team to safeguard the quality of each article we publish.
Find out more
BRIEF RESEARCH REPORT article
Front. Environ. Sci., 02 February 2023
Sec. Water and Wastewater Management
Volume 11 - 2023 | https://doi.org/10.3389/fenvs.2023.1121598
This article is part of the Research TopicSustainable Development on Water Resources Management, Policy and Governance in a Changing WorldView all 10 articles
Water pollution is closely related to the development of water pollution-intensive industries, but there is a lack of relevant research, and few studies to verify the existence of “pollution heaven.” This paper aims to study the layout and the spatio-temporal evolution of water-polluting enterprises. Taking Zhejiang Province, China as an example, this study visualized the spatial distribution of water pollution enterprises under the “Five Water Treatment” regulations during 2018–2022. At the same time, based on the Mann-Whitney U test, this paper verifies the hypothesis of pollution paradise in Zhejiang Province. The results show that the distribution of water pollution enterprises in Zhejiang is clustered, and water pollution control has been realized to a certain extent. However, water pollution enterprises still tend to be located in areas with lower environmental standards and weak environmental regulations. In view of this, the government should optimize the industry structure, strengthen the supervision of suburban water pollution enterprises.
Water is regarded as the source of human life. Together with land and energy, water provides the basic conditions for the development of human society and plays a vital role in the development of human society. Water resources is an important foundation for national economic and social development, and an important guarantee for improving ecological environment. Xia et al. (2011) pointed out that the three challenges facing the world are resources, population and environment. Water resource is a national strategic resource and a key factor affecting ecological civilization. As a complex systematic engineering, water resources management plays a strategic role in promoting sustainable economic development (Fu, 2022). Therefore, serious attention is needed to the water pollution problem (Liu et al., 2021; Sawyer et al., 2021). In recent years, China has witnessed rapid growth in its economy and population. Meanwhile, the large demand for water resources and serious water pollution problems have hindered the rapid economic development in China. The problem of water pollution is closely related to the development of water pollution-intensive industries. In particular, an important reason for the serious water pollution problem in China is the unreasonable planning and layout of water pollution-intensive industries (Chang, 2017). The so-called pollution-intensive industries refer to industries characterized by high-intensity pollution emissions. The spatial transfer of pollution-intensive industries is considered to be an important reason for the diffusion and transfer of pollution. Relatedly, the regional spatial distribution and evolution of pollution-intensive industries is an important issue for sustainable economic development. Hence, as a response to environmental problems brought by economic activities, it is necessary to investigate the spatial layout and driving factors of polluting industries, and it can also provide important implications for policymaking, such as enacting effective strategies to transfer polluting industries in the regional transition period, to promote the sustainable regional development (He, 2017).
Previous researchers have conducted theoretical and empirical studies on the influence of different patterns of industrial spatial agglomeration on the ecological environment (He et al., 2022). For example, Fang et al. (2021) looked at the mining industry at different development stages of urban agglomerations and did a dynamic evaluation of the impacts of the mining industry on the atmosphere, soil, rivers, and other ecological environment elements at different stages. Bonnet et al. (2021) included industrial agglomeration as an indicator to assess sustainable development and combined it with indicators such as externality and social welfare, to build a more comprehensive model for evaluating urban sustainable development. In recent years, China has strengthened the intensity of industrial adjustment, and as a result, related research has incorporated industrial economic elements to a certain extent. For instance, Song et al. (2022) analyzed the spatial change of urban agglomeration land and its ecological environment effects. Liu et al. (2020) evaluated the impact of industrial structure on the environment by estimating the ecological environment impact coefficient of different industry types and the overall ecological environment impact index of regional industrial structure. These studies have confirmed that industrial spatial agglomeration has a certain impact on the ecological environment.
With the development of geospatial technology, scholars have conducted extensive research on spatial-temporal pattern mining, in which spatial analysis played an important role (Yu et al., 2017; Yin et al., 2022). Previous research has shown that for spatial analysis, data collection is relatively easy and can be applied widely (Chen et al., 2022; Zhu et al., 2022). This method can not only allow access to accurate statistics but also can present the results in an intuitive way and visualize the results. Furthermore, spatial analysis can improve the spatial accuracy of urban research, so as to implement spatial governance at a more refined level. At present, many researchers have carried out research on spatial distribution characteristics of geographical objects and the factors that might influence the distribution. For example, Gao et al. (2014) used spatial analysis methods such as cluster analysis to analyze the distributional characteristics of air pollution areas in various provinces and cities and divided 73 cities into 6 clusters. Zhang et al. (2016) used Spatial Clustering and other methods to examine the clustering of production service industries in Hangzhou. They have found that when the production service industry clusters were located in areas and adjacent areas with higher levels of urban function, the scope and scale of the cluster area would increase. Wang et al. al. (2019) used the spatial autocorrelation analysis method to study the spatial relationship of the ecological pressure of water resources, and provided decision-making suggestions for the government on how to use water resources sustainably; Yuan (2019) use regression analysis to study the relationship between the income and expenditure of urban residents in Gansu province, based on which policy-making suggestions were provided for the government to increase the discretionary income of residents. Li et al. (2018) employed special analysis and concluded that the spatial distribution of industries in Lanzhou has shown the characteristics of being dense in urban areas and sparse in county areas. Hence, this paper argues that the application of geospatial technology and big data to the study of the spatial distribution of water-polluting enterprises will help to enhance the understanding of the economic value of the spatial layout and temporal and spatial evolution of water-polluting enterprises in Zhejiang Province.
The theoretical basis of this paper is based on the “pollution haven” hypothesis, also known as the “pollution refuge” hypothesis, which was proposed by Walter and Ugelow (1979). The basic idea behind the “pollution haven” hypothesis is that firms that aim to maximize profits will reconsider their production decisions if strict environmental regulations increase their production costs. By now, one idea is that the “pollution haven” hypothesis is only partially true. That’s because environmental regulations affect FDI location choices, but they’re not the key factor. They believe FDI still focuses on the traditional factors (Musah et al., 2022). Another idea says there’s insufficient evidence for the “pollution heaven” hypothesis. Therefore, this paper will take Zhejiang Province as an example, based on the background of “five water treatment” scientifically reveal the distribution law of water pollution-intensive industries in Zhejiang Province, explore its influence mechanism, and confirm whether the “pollution haven” hypothesis exists in cities. Our findings may have important theoretical and practical significance for finding the balance in the relationship between development and environmental protection and for realizing green and high-quality development.
In 21 century, Norman E. Borlaug again, advocated the so-called “Blue Revolution” to fight for water resources (Shevah, 2019). Hence, Blue Revolution also represents a water revolution. In China, the Blue Revolution has also been clearly enacted in coastal provinces. Zhejiang Province is located on the southeast China and its economy has grown steadily and rapidly in the past decades. Rapid economic growth means increased demand for resources, which has raised concerns about water environment. In particular, major rivers and lakes in the province were seriously polluted. For example, the water pollution event of the Qiantang River has aroused public concerns (Li et al., 2019). To improve the water environment, on 29 November 2013, at the Fourth Plenary session of the 13th CPC Central Committee of Zhejiang Province, it was clearly proposed to take the “five water treatment” as a major strategic guideline to construct a blue future. The “five water treatment” consists of five aspects: sewage treatment, flood drainage, flood control, water supply protection and water conservation. The aim is to solve the problem of sustainable development caused by water problems. This has also led to the discussions on the influence of “five water treatment” and industrial effects in Zhejiang. In this context, the objective of this paper is therefore to explore the development of water pollution enterprises under the background of “five water treatment.”
Zhejiang Province includes 11 prefecture-level cities, covering the area between 118°01′-123°10′east longitude and 27°02′-31°11′north latitude (Figure 1). There are eight major water systems including the Qiantang River, Oujiang River, and Aojiang River. According to the Statistical Yearbook of Zhejiang Province, the GDP of Zhejiang Province in 2021 reached 7.35 trillion yuan, with an increase of 8.5% over the previous year. In terms of industries, the added value of the primary, secondary, and tertiary industries was 220.9 billion yuan, 3,118.9 billion yuan, and 4,011.8 billion yuan, respectively, with an increase of 2.2%, 10.2%, and 7.6% over the previous year. The industry in Zhejiang is relatively developed. According to the list of key polluters in 2022 by the General Office of the Ministry of Ecology and Environment, Zhejiang province identified 6,117 key polluters in 2022, and water pollution is dominated by the manufacturing industry.
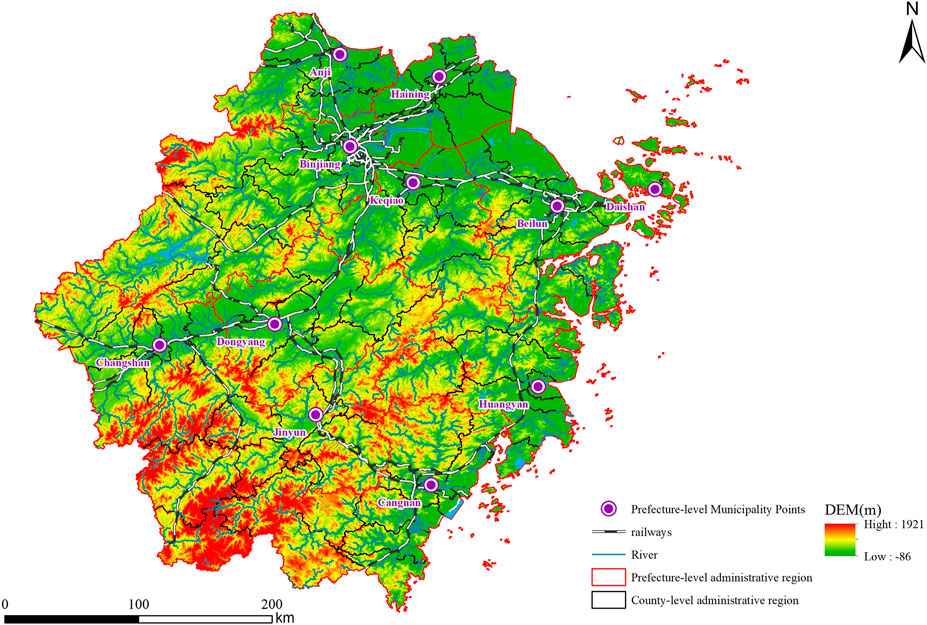
FIGURE 1. The map and overview of Zhejiang province.
According to previous literature, in order to test the “pollution heaven” hypothesis (Xu et al., 2022), it is necessary to have a corresponding understanding of the spatial distribution of pollution points in the study area. The intuitive visual observation method is the kernel density, and the convenient way to judge the concentration of polluting enterprises in urban and rural areas is the nearest neighbor index method. On this basis, Ma et al. (2022) also proposed Mann-Whitney U test as a non-parametric test method, which can detect whether there is a significant difference in the distribution of two or more observed variables, which plays a complementary role in the presentation of differences in this paper.
The nearest neighbor index method uses the distribution of random patterns as a standard to measure the spatial distribution of point elements (Bai et al., 2021). The nearest neighbor distance is a geographic index that indicates how close the points are to each other in geographic space. This method measures the distance between each point and its nearest neighbors
In the formula, R is the nearest neighbor index.
Kernel density analysis is a method that uses each point or line element to model a smooth conical surface based on the kernel function. The kernel density at the center is the sum of the densities in the entire window (Chen et al., 2013). This method is widely used in the simulation of pollution spatial distributional characteristics (Liu and Du, 2016). The present study uses kernel density analysis to examine the clustering characteristics of points in space (Zhu et al., 2018), and Eq. 2 is as follows:
In the formula:
The Mann-Whitney U test is a non-parametric test that can be used to test whether two independent samples come from a population with the same mean, or whether the relative frequency distribution of two populations is the same. In the present study, the 30 county-level administrative units in Zhejiang Province were divided into urban areas and suburban areas. We hypothesized that water-polluting enterprises tend to locate in areas with relatively low environmental standards and weak environmental regulations. The calculation Eqs 3, 4 are as follows:
We first calculated
In the next step, we selected the smaller value of
At the level of α = 0.05, when the number of border counties or the number of inner counties ≤10, and U is greater than its corresponding critical value
We used the average nearest neighbor tool in ArcGIS 10.2 to get the nearest neighbor index of water-polluting enterprises in Zhejiang Province from 2018 to 2022 (see Table 1). The results showed that the average nearest neighbor index of water-polluting enterprises in Zhejiang Province from 2018 to 2022 was around 0.32, and the overall distribution showed a clustered characteristic. In the past 5 years, the nearest neighbor index of water-polluting enterprises in Zhejiang Province was less than 1, and the p-value flagged a significant test result at the 0.01 level. Among them, the nearest neighbor index of water-polluting enterprises in Zhejiang Province in 2022 decreased compared with the nearest neighbor index of water-polluting enterprises in 2018, indicating that the spatial distribution of water-polluting enterprises in Zhejiang Province gradually became increasingly agglomerated during this period, whereas the difference in distribution pattern was not significant.
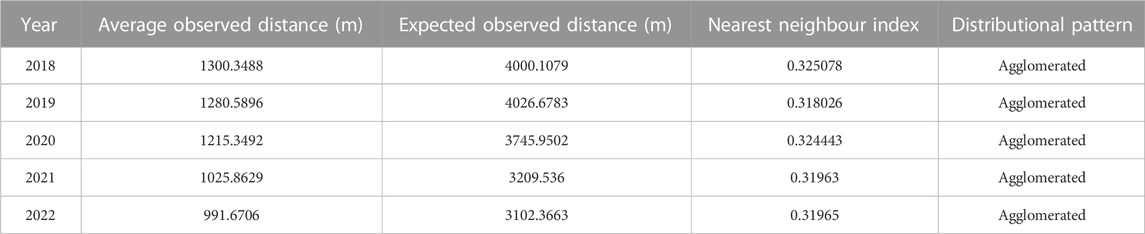
TABLE 1. Nearest neighbor index of water pollution enterprises in Zhejiang Province from 2018 to 2022.
The kernel density estimation method is used with ArcGIS 10.2 to further identify the spatial agglomeration area of water-polluting enterprises in Zhejiang Province. After several times of exploration, the optimal search radius was decided to be 100 km. The results showed that from 2018 to 2020, water-polluting enterprises in Zhejiang Province in general tended to be agglomerated in an area in the north (Figure 2 and Figure 3). Among them, the first-level agglomeration area was mainly located in the area with a relatively high level of network development in Zhejiang Province, that is, on the northern line of “Hangzhou-Haining-Shaoxing.” This area is an important part of the urban agglomeration along the Qiantang River in Zhejiang Province. There were four secondary agglomeration areas as the cores of four central cities or sub-central cities, namely, Fuyang District of Hangzhou City, Liandu District of Lishui City, Beilun District of Ningbo City, and Jiaojiang District of Taizhou City. From 2021 to 2022, (Figure 2) water-polluting enterprises in Zhejiang Province were still mainly concentrated in the northern region. Among them, the first-level agglomeration area was located on the “Hangzhou-Haining-Shaoxing” line. The surrounding cities gathered significantly, and the agglomeration phenomenon was especially obvious in three subcentral cities: Xiaoshan District of Hangzhou City, Shangyu District of Shaoxing City, and Xiuzhou District of Jiaxing City.
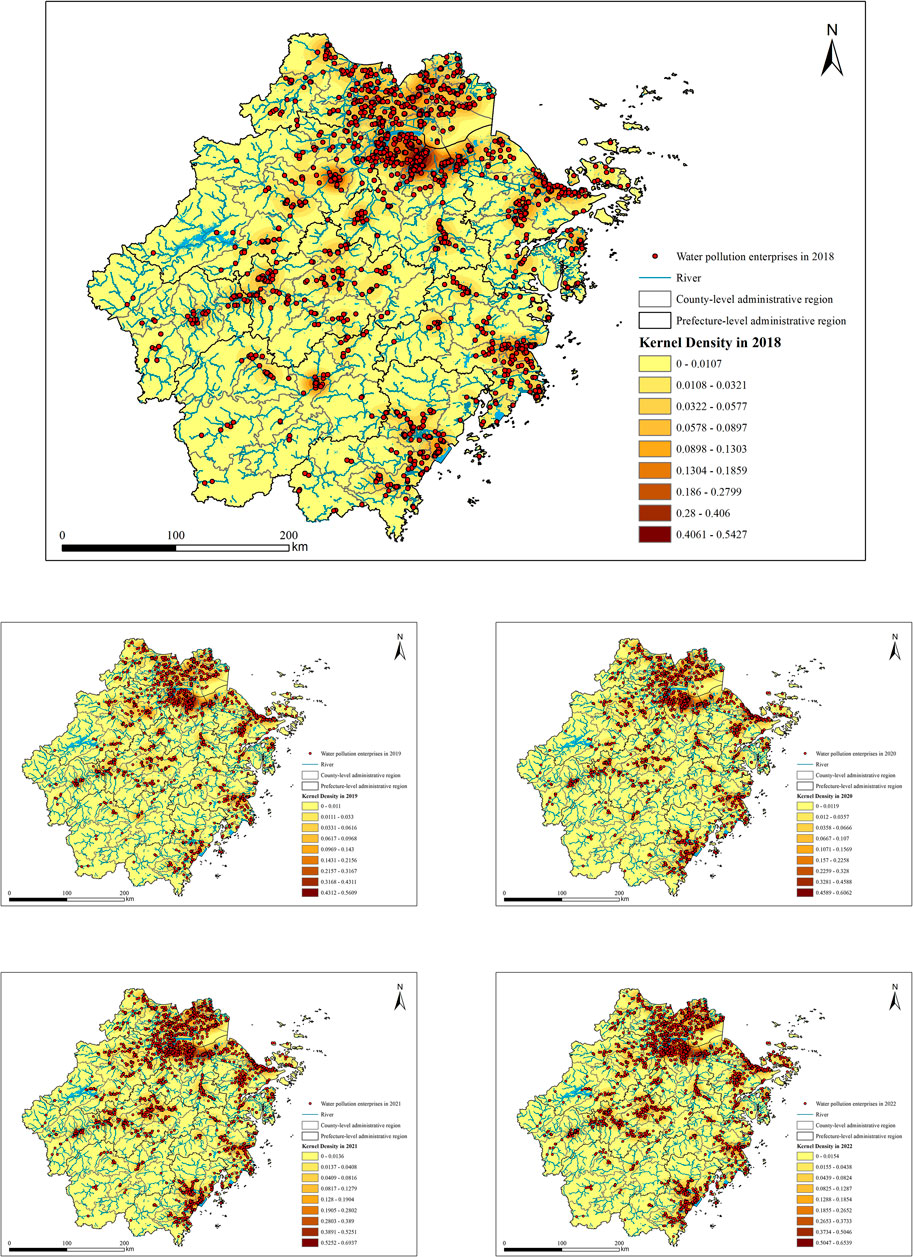
FIGURE 2. Estimation of the kernel density of water-polluting enterprises in Zhejiang province from 2018 to 2022.
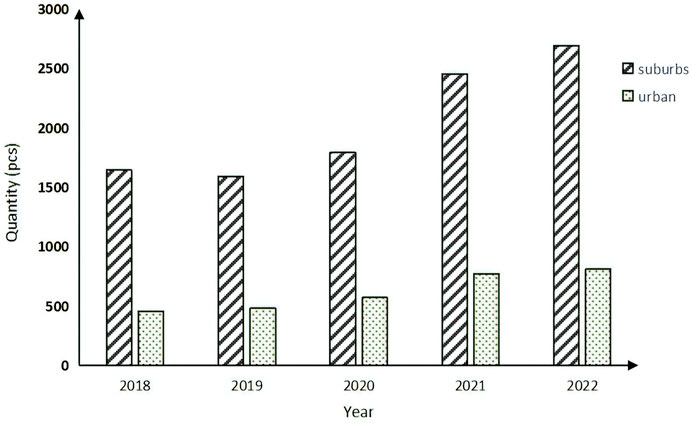
FIGURE 3. Difference in the number of water-polluting enterprises in Zhejiang Province between urban and suburban areas from 2018 to 2022.
In 2018, the number of water-polluting enterprises located in the suburban area of Zhejiang Province was 1,643, which was 3.61 times that of urban areas (see Figure 4). In 2019, the number of major water-polluting enterprises clustered in suburban areas was 3.28 times that of urban areas; in 2020, the number of major water-polluting enterprises clustered in suburban areas was 3.14 times that of urban areas; in 2021, the number of major water-polluting enterprises clustered in suburban areas was 3.18 times that of urban areas, and in 2022, the number of major water polluting enterprises clustered in suburban areas was 3.32 times that of urban areas. It can be seen that in the past 5 years, in terms of the layout of water-polluting enterprises in Zhejiang Province, most enterprises have shown a preference for suburban areas. Unexpectedly, the tendency of “urban centralism” that is commonly seen in the field of environmental protection has not yet been observed for water-polluting enterprises in Zhejiang province.
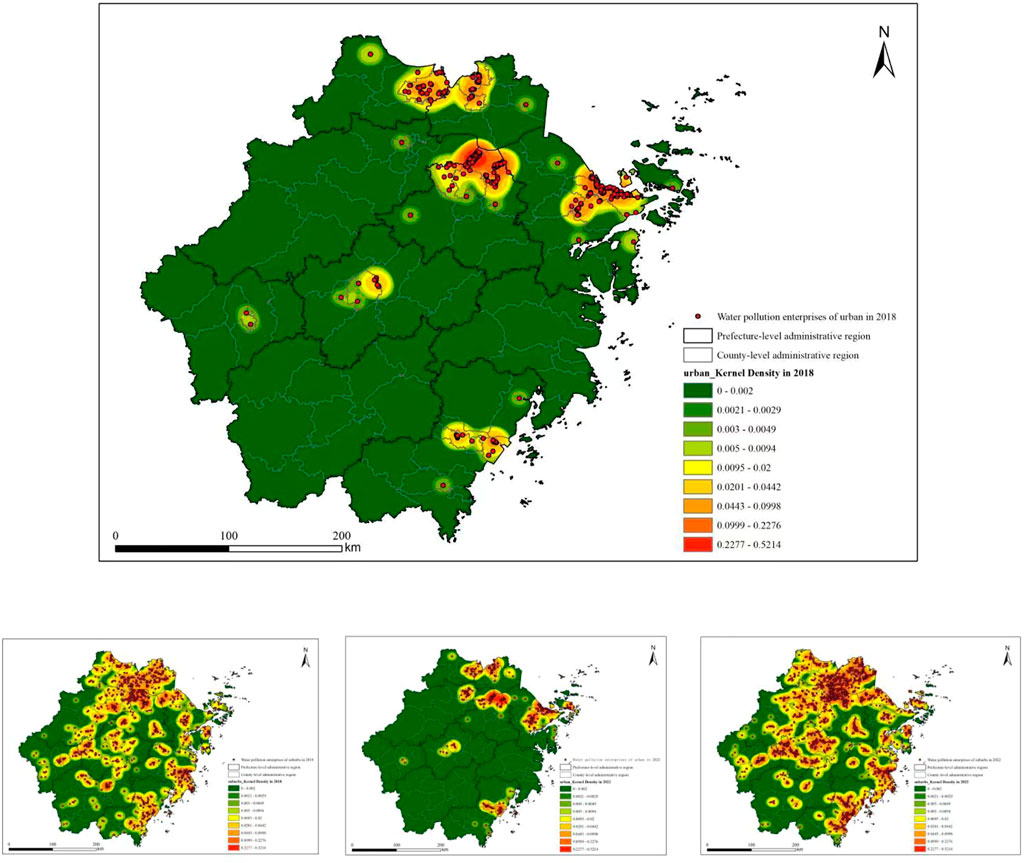
FIGURE 4. Estimation of Kernel density of water-polluting enterprises in urban and suburban areas in Zhejiang Province in 2018 and 2022.
Results of the analysis of the nearest neighbor index showed that from 2018 to 2022, the water-polluting enterprises in Zhejiang Province were clustered both in urban and suburban areas. For urban areas, land use is often intensive and thus the level of agglomeration of water-polluting enterprises in these areas was significantly higher than that in suburban areas. In terms of the characteristics of agglomeration, the agglomeration of polluting enterprises in urban and suburban areas showed differentiated spatial performance and location patterns (Figure 4). In 2018, the first-level agglomeration cores of urban water-polluting enterprises were located in the central area of Xiaoshan District, Hangzhou, and showed a clear pattern of distributing along rivers and lakes. There were three secondary agglomerations, with the Wuxing District of Huzhou City, Xiuzhou District of Jiaxing City, and Beilun District of Ningbo City as the core respectively. The distribution of water-polluting enterprises in the suburban area was relatively scattered. So far, five first-level agglomeration areas have been formed: Liandu District of Lishui City, Jiaojiang District of Taizhou City, Xiangshan County of Ningbo City, Dongtou District of Wenzhou City and Fuyang-Xiaoshan-Yuyao. Furthermore, secondary agglomeration areas formed large-scale contiguous areas in the areas of “Jiande-Lanxi-Longyou” “Zhuji-Pujiang-Yiwu” “Wenling-Yuhuan” and “Fenghua-Haining” In 2022, the agglomeration cores of water-polluting enterprises in urban areas were still mainly distributed in Xiaoshan District, Hangzhou City, and there was a tendency to spread eastward. However, compared with the number of cities in 2018, the secondary agglomeration areas have increased, mainly concentrated in the Gongshu District of Hangzhou City and Yinzhou District of Ningbo City. The tendency of large-scale spreading to surrounding cities has not been observed yet. Compared with 2018, the distribution of water-polluting enterprises in suburban areas tended to be more dispersed in 2022. By comparing the distribution across years, it can be found that the layout of urban regional polluting enterprises was not only closely related to the attributes of individual cities (e.g., city size and industrial structure) but was also linked with the connection level of regional element circulation networks. The distribution of water-polluting enterprises in suburban areas showed a strong dependence on local resources, and the agglomeration areas were all areas rich in rivers and lakes.
According to the “pollution haven hypothesis” polluting enterprises tend to locate in areas with relatively low environmental standards and weak environmental regulations (Tian et al., 2018). Within the regional system, areas far from the administrative center or at the border are often weak in environmental regulation (Wang et al., 2019). In order to test whether the “cross-border location preference” in the “pollution haven hypothesis” can be supported in Zhejiang Province, we looked at descriptive statistics and used the Mann-Whitney U test (Mann-Whitney U test) to analyze the distribution and quantity of water-polluting enterprises in urban and suburban areas. Descriptive statistics showed that the average number of water-polluting enterprises in the suburbs of Zhejiang Province was 3.29 times that of the urban areas, and the indicators such as the range and coefficient of variance in the urban areas are much larger than those in the suburbs, indicating that there were significant differences within the urban areas (Table 2).
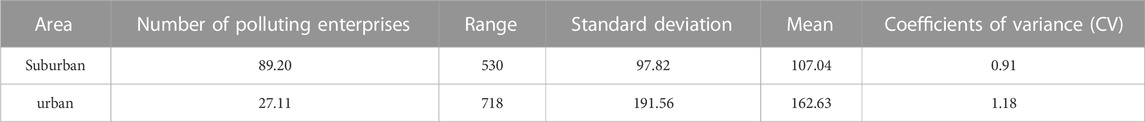
TABLE 2. Descriptive statistics of the number of water-polluting enterprises in urban and suburban areas.
For the Mann-Whitney U test, we adopted an alpha level for significance test α = 0.05, and employed a two-sided quantile test, The results showed that there were no significant differences, and thus H0 cannot be rejected (Table 3). However, there were still differences in the number of enterprises in urban and suburban areas from 2018 to 2022. In 2018, the average number of water-polluting enterprises in the suburbs of Zhejiang Province was 3.61 times that of the urban area, which was the year with the largest difference. The year with the second largest difference was 2020, the average number of water-polluting enterprises in the suburbs was 3.14 times that of the urban area. However, the difference was not significant at an alpha of 0.05 level. Hence, there was no significant difference between the number of water-polluting enterprises in the urban and suburban areas this year.
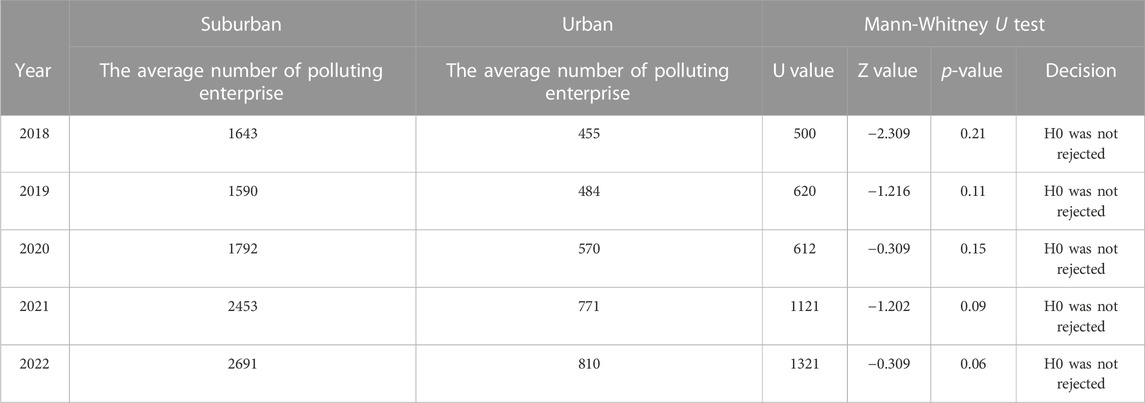
TABLE 3. The number of water-polluting enterprises in urban and suburban areas and the results of the Mann-Whitney U test.
It can be seen from the findings that the period from 2020 to 2022 is the rapid agglomeration stage of water pollution enterprises in Zhejiang Province. This phenomenon is particularly evident in the southern cities of Zhejiang, among which the prominent cities such as Wenzhou. In 2019, Wenzhou and other cities released the policy effectiveness of the “five water treatment” for 2015–2019 respectively, and made it clear that the current water pollution enterprises have made phased progress in treatment. In Wenzhou, for example, a survey found that 87.5% of water quality was at Ⅰ-Ⅲ class, reaching the annual provincial target of 75%. The proportion of Ⅰ-Ⅲ class water quality in the provincial control section reached 83.3%, reaching the annual provincial target of 75%. The water quality of drinking water source reaches 100%. After consulting the policy documents, it is found that most areas in Zhejiang have strictly implemented the “one river one policy” regulation measures for key river courses since 2020, which has greatly promoted the effectiveness of the “five water treatment,” accelerated the rapidagglomeration of water pollution enterprises and improved the water treatment effect. However, according to Mann-Whitney U test, the current distribution of water pollution enterprises in Zhejiang Province has initially shown the location preference of settling in suburban areas. This largely corroborates what previous scholars have found. Lei et al. (2017) once found that there was a pollution heaven in their study on the relationship between import and export trade and carbon emissions, which they thought was caused by the rapid development of import and export trade in the Yangtze River Economic Belt. The findings of this paper on water pollution enterprises are largely the same as those of them. Zhejiang, though a province, is a different, smaller area than the one they studied. But the phenomenon also exists. That’s because Zhejiang province is rich in ports and waterways. Trade liberalization moved polluting industries to areas with lower environmental regulations, which damaged the environment in suburban areas and increased sewage discharge. In view of this, Zhejiang Province should optimize the industrial structure and implement relevant policies to suburban water pollution enterprises to prevent more serious water pollution in the suburbs.
This paper employed the nearest neighbor index, kernel density estimation, and Mann-Whitney U test to analyze the temporal and spatial evolution characteristics of water pollution-intensive industries in Zhejiang Province. The main findings from the present study include:
1. At present, the distribution of water-polluting enterprises in Zhejiang Province showed an agglomerated characteristic. The first-level agglomeration areas were all located in areas with a relatively high level of urban network development. The second-level agglomeration areas were all centered on central cities or sub-central cities. In general water-polluting enterprises were mainly concentrated near rivers, lakes, and seas. In terms of the developmental trend, 2020–2022 is the stage when a rapid concentration of water pollution enterprises occurred in Zhejiang Province.
2. The suburban location represents the overall difference in the existence and succession of water-polluting enterprises in suburban areas. At present, the layout of water-polluting enterprises in Zhejiang Province has initially shown the location preference of settling in suburban areas. The first-level agglomeration cores of polluting enterprises were concentrated in areas where the urban network is relatively developed and has good water connections such as easy reach to rivers, lakes, and seas. These findings showed that enterprises paid special attention to the circulation network of elements. However, the distribution of water-polluting enterprises in suburban areas was relatively scattered, whereas the number of enterprises was increasing year by year, showing dependence on local water resources.
3. The suburban location also represents the regional differences in the layout of polluting enterprises in the institutional space based on the blue development system. At present, water-polluting enterprises in Zhejiang Province do not show an obvious cross-border agglomeration for seeking the overflow of environmental externalities, whereas the comparison of the number of water-polluting enterprises in the suburban and urban areas shows that water-polluting enterprises were more inclined to be located in areas with relatively low environmental standards and environmental conditions.
The unreasonable layout of water-polluting enterprises in Zhejiang Province will lead to prominent contradictions in the use of water resources, aggravate water environment pollution, and increase the risks of water ecological damage. A scientific and reasonable industrial layout is the basis and prerequisite for the effectiveness of water resources protection in Zhejiang Province, especially for water pollution-intensive industries. Therefore, in the context of the Blue Development strategy, the spatial evolution of water-polluting enterprises in Zhejiang Province is actually cutting-edge and relevant.
The present study also has some limitations that need to be accounted for. At present, polluting enterprises are spreading all over the country, given the differences in economic levels and environmental systems across regions, different industrial developmental patterns may exist in different regions. Due to the lack of relevant data, the present study did not compare the distributional patterns in different areas of China. Future studies may further carry out research on different types of polluting enterprises in Zhejiang Province, and find out the economic value of the spatial layout and temporal and spatial evolution of polluting enterprises in Zhejiang Province. In addition, this paper only studies the water pollution enterprises. Other polluters such as air pollution and soil pollution have not yet been discussed, which will also be the focus of our future work. Liu et al., 2015, Sun, 2022.
The original contributions presented in the study are included in the article/supplementary material, further inquiries can be directed to the corresponding author.
All authors contributed to the study conception and design. Material preparation, data collection, and analysis were performed by XX and LW. The first draft of the manuscript was written by XX, LW, and YZ commented on previous versions of the manuscript. All authors read and approved the final manuscript.
This research thanks for the comments from reviewers. The authors would like to take this opportunity to thank the data collection assistants and the anonymous respondents who responded to the questionnaire.
The authors declare that the research was conducted in the absence of any commercial or financial relationships that could be construed as a potential conflict of interest.
All claims expressed in this article are solely those of the authors and do not necessarily represent those of their affiliated organizations, or those of the publisher, the editors and the reviewers. Any product that may be evaluated in this article, or claim that may be made by its manufacturer, is not guaranteed or endorsed by the publisher.
Bai, Y., Chou, L., and Zhang, W. (2021). Industrial innovation characteristics and spatial differentiation of smart grid technology in China based on patent mining. Journal of Energy Storage 43, 103289.
Bonnet, J., Coll-Martínez, E., and Renou-Maissant, P. (2021). Evaluating sustainable development by composite index: Evidence from French departments. Sustainability 13 (2), 761. doi:10.3390/su13020761
Chang, Y. (2017). M,Types identification for regional water pollution intensive manufacturing industry and development path: Case of water pollution-intensive manufacturing industry in Jiangsu. Yangtze River 48 (24), 37–40.
Chen, C., Cheng, L., and Xiu, C. L. (2013). Distribution of centrality of traffic network and its relationship with economic density of tertiary industry in Shenyang. Prog. Geogr. 32 (11), 1612–1621.
Chen, Z., Liu, Z., Yin, L., and Zheng, W. (2022). Statistical analysis of regional air temperature characteristics before and after dam construction. Urban Clim. 41, 101085. doi:10.1016/j.uclim.2022.101085
Fang, C., Liu, H., and Wang, S. (2021). The coupling curve between urbanization and the eco-environment: China's urban agglomeration as a case study. Ecol. Indic. 130, 108107. doi:10.1016/j.ecolind.2021.108107
Fu, Y. B. (2022). The importance of scientific management of water resources to promote sustainable economic development. Water Supply Drainage, 32–33. 10.
Gao, H., Chen, J., and Chen, J. (2014). Regional distribution of air pollution index in Chinese cities. J. Ocean Univ. China Nat. Sci. Ed. 10, 25–34.
Geng, H., Li, Y. Q., and Fan, Z. Y. (2019). Regional spatial disparity and influencing factors of the development of angertainment: A comparative study of Zhejiang, hubei and sichuan provinces. Econ. Geogr. 39 (11), 183–193.
He, Z. X., Cao, C. S., and Wang, J. M. (2022). Spatial impact of industrial agglomeration and environmental regulation on environmental pollution—evidence from pollution-intensive industries in China. Appl. Spatial Analysis Policy, 6, 1–31.
Lei, L., Liu, J., and Yang, K. (2017). The relationship between import and export trade and carbon emissions in the Yangtze River Economic Belt under the perspective of the "pollution paradise" hypothesis. Sci. Technol. Manag. 19 (6), 25–32.
Li, C., Chen, X., Jia, Z., Xue, C., He, S., and Hu, M. (2018). Spatial distribution characteristics of industrial enterprises above designated size in Lanzhou. J. Lanzhou Univ. Nat. Sci. 54 (2), 149–154.
Li, L., Jiang, P., Xu, H., Lin, G., Guo, D., and Wu, H. (2019). Water quality prediction based on recurrent neural network and improved evidence theory: A case study of Qiantang River, China. Environ. Sci. Pollut. Res. 26 (19), 19879–19896. doi:10.1007/s11356-019-05116-y
Liu, H., and Du, G. (2016). Spatial pattern and distributional dynamics of urban air pollution in China—an empirical study based on aqi and six sub-pollutants of 161 cities. Econ. Geogr. 36, 33–38.
Liu, H., Shan, B., Zhang, W., Shen, Y., and Shi, Z. (2015). Analysis of Successful water control Strategy in a Province with serious water pollution -- the effect of "Five water co-control" in Zhejiang Province and suggestions for future promotion. Environ. Prot. Sci. 3, 47–52.
Liu, Q., Wang, S., Li, B., and Zhang, W. (2020). Dynamics, differences, influencing factors of eco-efficiency in China: A spatiotemporal perspective analysis. J. Environ. Manag. 264, 110442. doi:10.1016/j.jenvman.2020.110442
Liu, Y., Hu, Y., Hu, Y., Gao, Y., and Liu, Z. (2021). Water quality characteristics and assessment of Yongding New River by improved comprehensive water quality identification index based on game theory. J. Environ. Sci. 104, 40–52. doi:10.1016/j.jes.2020.10.021
Ma, B., Xing, D., Yuan, S., Xue, D., and Song, Y. (2022). Location selection and spatial justice of polluting enterprises in underdeveloped areas. Acta Geogr. Sin. 77 (4), 1009–1027.
Musah, M., Mensah, I. A., Alfred, M., Mahmood, H., Murshed, M., Omari-Sasu, A. Y., et al. (2022). Reinvestigating the pollution haven hypothesis: The nexus between foreign direct investments and environmental quality in G-20 countries. Environ. Sci. Pollut. Res. 29 (21), 31330–31347. doi:10.1007/s11356-021-17508-0
Sawyer, G., Oligschläger, C., and Khabarov, N. (2021). Lake water quality management in Germany. https://earsc.org/sebs/wp-content/uploads/2021/06/Water-Quality-Management-in-Germany-final-1.pdf.
Shevah, Y. (2019).Impact of persistent droughts on the quality of the Middle East water resources, Sep. Sci. Technol., 11. 51–84. doi:10.1016/b978-0-12-815730-5.00003-x
Song, Y., Xia, S., Xue, D., Luo, S., Zhang, L., and Wang, D. (2022). Land space change process and its eco-environmental effects in the guanzhong plain urban agglomeration of China. Land 11 (9), 1547. doi:10.3390/land11091547
Sun, X. H. (2022). The practical significance of "five water treatment" and its application in urban water environment governance. Govern Huai River 02, 60–61.
Tian, G., Miao, C., Hu, Z., and Miao, J. (2018). Environmental regulation, local protection and the spatial distribution of pollution-intensive industries in China. Acta Geogr. Sin. 73 (10), 1954–1969.
Walter, I., and Ugelow, J. L. (1979). Environmental policies in developing countries. Ambio, 102–109.
Wang, Y., Cao, X., Yu, C., and Ren, J. (2019). The temporal and spatial evolution and the mechanism of the pollution-intensive industry in Shandong province. Econ. Geogr. 39 (1), 130–139.
Wang, Y., Wang, Y., Su, X., Qi, L., and Liu, M. (2019). Evaluation of the comprehensive carrying capacity of interprovincial water resources in China and the spatial effect. J. Hydrology 575, 794–809. doi:10.1016/j.jhydrol.2019.05.076
Xia, J., Liu, C. Z., and Ren, G. Y. (2011). Opportunities and challenges of research on the impact of climate change on Chinese water resources. Adv. Earth Sci. 26 (1), 1–12.
Xu, Y., Cheng, Y., Zheng, R., and Wang, Y. (2022). Spatiotemporal evolution and influencing factors of carbon emission efficiency in the yellow river basin of China: Comparative analysis of resource and non-resource-based cities. Ijerph 19 (18), 11625. doi:10.3390/ijerph191811625
Yin, L., Wang, L., Keim, B. D., Konsoer, K., and Zheng, W. (2022). Wavelet analysis of dam injection and discharge in three gorges dam and reservoir with precipitation and river discharge. Water 14 (4), 567. doi:10.3390/w14040567
Yu, W., Ai, T., He, Y., and Shao, S. (2017). Spatial co-location pattern mining of facility points-of-interest improved by network neighborhood and distance decay effects. Int. J. Geogr. Inf. Sci. 31 (2), 280–296. doi:10.1080/13658816.2016.1194423
Yuan, K. L. (2019). Regression analysis of urban household consumption expenditure and disposable income -- Based on the empirical analysis of Gansu Province. Taxation 11, 186–189.
Zhang, Q., and Peng, Z. (2016). Distribution characteristics of producer services agglomeration in Hangzhou based on spatial cluster analysis. Urban Plan. Trib. 4.
Zhu, H. S., Liu, C. X., and Li, Y. C. (2018). The geographic agglomeration of Chongqing's strategic emerging industries based on GIS and its relationship with GDP. J. Chongqing Normal Univ. Nat. Sci. 35 (5), 63–70.
Keywords: spatial analysis, water polluting enterprises, industrial agglomeration, blue development, regulation, Zhejiang, pollution heaven
Citation: Xu X, Zhang Y and Wu L (2023) The layout and the spatio-temporal evolution of water-polluting enterprises in Zhejiang under regulation. Front. Environ. Sci. 11:1121598. doi: 10.3389/fenvs.2023.1121598
Received: 12 December 2022; Accepted: 16 January 2023;
Published: 02 February 2023.
Edited by:
Zhanhong Wan, Zhejiang University, ChinaReviewed by:
Jiang Song, Xi’an University of Architecture and Technology, ChinaCopyright © 2023 Xu, Zhang and Wu. This is an open-access article distributed under the terms of the Creative Commons Attribution License (CC BY). The use, distribution or reproduction in other forums is permitted, provided the original author(s) and the copyright owner(s) are credited and that the original publication in this journal is cited, in accordance with accepted academic practice. No use, distribution or reproduction is permitted which does not comply with these terms.
*Correspondence: Liou Wu, d3VsaW91d2xAb3V0bG9vay5jb20=
Disclaimer: All claims expressed in this article are solely those of the authors and do not necessarily represent those of their affiliated organizations, or those of the publisher, the editors and the reviewers. Any product that may be evaluated in this article or claim that may be made by its manufacturer is not guaranteed or endorsed by the publisher.
Research integrity at Frontiers
Learn more about the work of our research integrity team to safeguard the quality of each article we publish.