
95% of researchers rate our articles as excellent or good
Learn more about the work of our research integrity team to safeguard the quality of each article we publish.
Find out more
ORIGINAL RESEARCH article
Front. Environ. Sci. , 02 March 2023
Sec. Land Use Dynamics
Volume 11 - 2023 | https://doi.org/10.3389/fenvs.2023.1121248
This article is part of the Research Topic Hydrological Connectivity and Sustainable Watershed Management in a Changing Environment View all 13 articles
 Xingang Xu1,2†
 Hao Tian1,2†
 Guang Yang1,2*
 Xiaolong Li1,2*
 Xinlin He1,2Yi Li1,3
 Yongli Gao4
 Fadong Li1,5,6Pengfei Li1,2Bing Liu1,2Lianqing Xue1,7
The rapidly growing social demand for water and land, along with increasingly constraining economic and social development, have intensified the conflicts between regional production, living, and ecological spaces (PLES). Water and land resources have become major obstacles to long-term growth in arid and semi-arid regions. Therefore, we propose a scenario-based framework for a production, living, and ecological spaces water resource assessment, integrating patch-generating land use simulation (PLUS), Shared Socioeconomic Pathways (SSPs), and multiple regression equations to analye the spatial and temporal variability of these resources on the northern slopes of the Tianshan Mountains (NSTM) and assess the future development of water resources. The results show: 1) from 2000 to 2020, land use types on the northern slopes of the Tianshan Mountains were dominated by ecological land, which decreased to 11,793 km2; production and domestic land use increased. Water for production and ecological use accounted for approximately 93% and a minor proportion of the total water use, respectively. 2) Production land is mainly influenced by population density and Gross Domestic Product (GDP), living land by population density, and ecological land by precipitation and topographic factors. 3) The PLUS model had good applicability, with a kappa coefficient, overall accuracy, and FoM of 0.81, 0.88, and 0.28, respectively. 4) The total water use in the northern slopes of the Tianshan Mountains will increase under all three scenarios between 2030 and 2050, but by varying degrees. Production water use accounts for the most significant proportion (93%), with its use decreasing by 305 million m3 under the SSP3 scenario. Domestic water use shows a slow increase under all three scenarios. Further development of the northern slopes of the Tianshan Mountains should take account of regional ecological vulnerability, and water use for production should be controlled based on existing water resources and ecological capacity to reduce pressure on the environment and provide essential ecological protection and sustainable development.
For many years, sustainable development of arid and semi-arid areas has been a critical research topic (Bryan et al., 2018). Environmental problems, such as human activities, climate change, and land desertification, have increased ecological and environmental pressures, resulting in negative impacts on sustainable development (Pokhrel et al., 2021). As the primary carrier of terrestrial ecosystems, the land is an important site for human activities and plays a vital role in human production and life (Jiang et al., 2022a; Lin & Peng, 2022). Since the 1980s, the rapid growth of society has led to tension in human–land relations and the emergence of competition in production and living ecological spaces (Fu et al., 2021; Wang & Wang, 2022). The rapid expansion of production and living space has led to the narrowing of ecological space. The disorderly development of land restricts sustainable development and may lead to a decline in regional development competitiveness and affect the ecology and living environment (Hou & Braham, 2021; Lu et al., 2021; Wang et al., 2021). In terms of water, resources in arid ones are in short supply, with the proportion of water used for production reaching as high as 79.8%. In comparison, water used for ecological purposes accounts for only 5.3% of the total water consumption (Chen et al., 2019). The allocation of water resources is dominated by the economic development planning department, which pays more attention to production and domestic water and ignores ecological water (Hu et al., 2021; Lu et al., 2021; Xu et al., 2022). The misuse of water resources has worsened the ecological environment in fragile inland areas (Eaton et al., 2021).
In terms of land use simulation, the main models for simulating future land use include the CLUE-S model (Stanley et al., 2023), CA-Markov model (Philip et al., 2023), and FLUS model (Lin et al., 2022; Xiang et al., 2022), which are more suitable for simulation studies in small areas, not accurate enough in larger scale simulations, poor simulation effects, and limited to the analysis of the quantity and spatial structure, ignoring the interactive application between models, and not enough for influencing land use The PLUS (Patch-generating Land Use Simulation Model) model (Liang et al., 2021) is a new land use prediction model developed to solve the accuracy problem of larger-scale land use data simulation, which has a better explanation of the influencing factors of various land use changes and higher accuracy of simulation results (Halima and Hiroaki, 2022; hao et al., 2022). Li et al. (2021) used a coupled GMOP-PLUS model to analye the spatial and temporal evolution of the ecological barrier ESV in Sichuan and Yunnan, China, using LULC and other data from 2000, 2010, and 2018, which can improve the assessment of socioeconomic and environmental factors. Shi et al. (2021) studied to determine the impact of different future land use/cover scenarios on the Ili River, China watershed, and analyed synergistic response characteristics to inform site-specific decisions for implementing ecological projects. hai et al. (2021) investigated in depth the spatial and temporal patterns of land use/cover change under urbaniation in Wuhan, China, based on continuous time in an attempt to understand the development pattern of Wuhan over 20 years, and the results showed rapid urbaniation, which triggered large LUCC with the increased floor area.
A scenario framework was developed by the Intergovernmental Panel on Climate Change (IPCC) in 2010 that described the potential paths of different socioeconomic groups (O'Neill et al., 2017; Wang & Sun, 2022). In 2012, the Chinese government formulated the “Production-Living-Ecological Space (PLES)” strategy in land space planning to achieve sustainable development of the region and ecological environment (Fu et al., 2021). Therefore, many scholars have combined land use with the SSPs. hou et al. (2022) used a spatial-temporal geographically weighted regression (GTWR) model to analye the spatial-temporal evolution characteristics of PLES and its drivers in 73 prefecture-level cities in the middle reach of the Yangte River from 2005 to 2020. Cui et al. (2022) analyed the spatial and temporal characteristics, coupling coordination, spatial autocorrelation, and influencing factors of PLES in China from 2000–2020. The urban expansion of Hohhot-Baotou-Erdos-Yulin from 2017 to 2050 was simulated by Song et al. (2020) using SSP scenarios and land use; Jiang et al. (2022b) simulated henghou’s PLES and ecological effects based on SSPs and multiple methods, and Bao et al. (2022) used linear equations to establish a relationship between land cover type and water use to estimate ecological and agricultural water use in Lake Ebey in 2035.
A glance at the development of land use change and land and water resources research at home and abroad shows that land use change has changed from relying on traditional methods to combining with emerging technologies, which is also an inevitable requirement of the development of the times. After a long period of theoretical research, the configuration of soil and water resources has formed a relatively perfect academic system; with various numerical models as the basic method and the continuous development of innovative soil and water resources information systems, in recent years, the large-scale study of soil and water resources configuration has become more and more accurate and detailed with the support of information technology and 3S system. However, considering the sustainable development of the ecological-social-economic integrated system, the current methods for optimal allocation of soil and water resources still have shortcomings. Most of the existing research methods for land use change are still in the study of the quantification of land use type conversion, and the study of the intrinsic and extrinsic drivers of its conversion is still relatively superficial, and the predictive analysis models used for future land use change aren’t mature enough, without considering The models used for predicting and analying future land use change aren’t mature enough and do not consider the influence of the interaction and change trends of ecosystems and economic and social systems on land use change, so the selection of models should take into account the ecological, economic and social factors and the advantages of model adaptation range and model accuracy. Studies on the optimal allocation of water or land resources alone are predominant, and studies combining the interactions and constraints of the two are limited. The exchange of water and land resources is necessary to consider the interaction of the two, which should be planned, evaluated, protected, and utilied in order to optimie the allocation of resources.
Based on the above problems, this study proposes a research framework for multi-scenario water resource prediction based on the PLUS model and SSPs, which provides a method for water resource assessment. We analyed the spatial and temporal changes in water and land resources on the northern slopes of the Tianshan Mountains (NSTM) from 2000 to 2020 and calculated the contribution rate of driving factors to the dynamic change in land cover. We predicted the water consumption for PLES on the NSTM based on three scenarios of the SSPs. The specific objectives of this study were: 1) to analye the characteristics of water and soil resource changes on the NSTM and explain the reasons for land resource changes, and 2) to analye the temporal and spatial changes of PLES water use on the NSTM under different scenarios from 2020 to 2050. The proposed optimiation method helps to explore regional water and land resource changes. It provides a fundamental basis for the rational planning regional water and land resources and ecological and environmental protection.
The NSTM is located in an arid one of the Asia-Europe continental hinterland on the southern edge of the Junggar Basin, with the geographical coordinates of 79°53′E−96°06′E and 42°49′N-47°15′N. The NSTM is a crucial area of the Belt and Road Initiative. The main landforms in the south are high mountains, the central part belongs to the oasis, and the north is mainly desert, forming a typical mountain-basin system. At the end of 2020, the total population of NSTM was 8,399,700, accounting for 32% of Xinjiang’s population (Fang et al., 2019). We divided the NSTM into three sections based on topographic and climatic features: western, middle, and eastern, as shown in Figure 1.
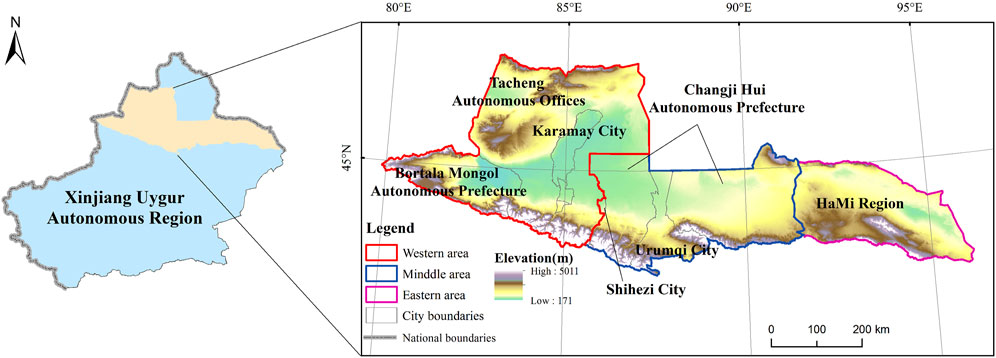
FIGURE 1. Geographical location and segmental boundary on the northern slopes of the Tianshan Mountains.
The SSP data were obtained from the Nanjing University of Information Science and Technology. The data mainly included land use, socioeconomic [population density, Gross Domestic Product (GDP)], road and water system (railways, roads, rivers), climate (rainfall, temperature), and topographic data (Table 1). The geographical coordinate system was unified as D_WGS_1984 with a resolution of 1 km, and the number of data rows and columns was identical. Production, domestic, and ecological water use data were obtained from the Statistical Yearbook and Water Resources Bulletin.
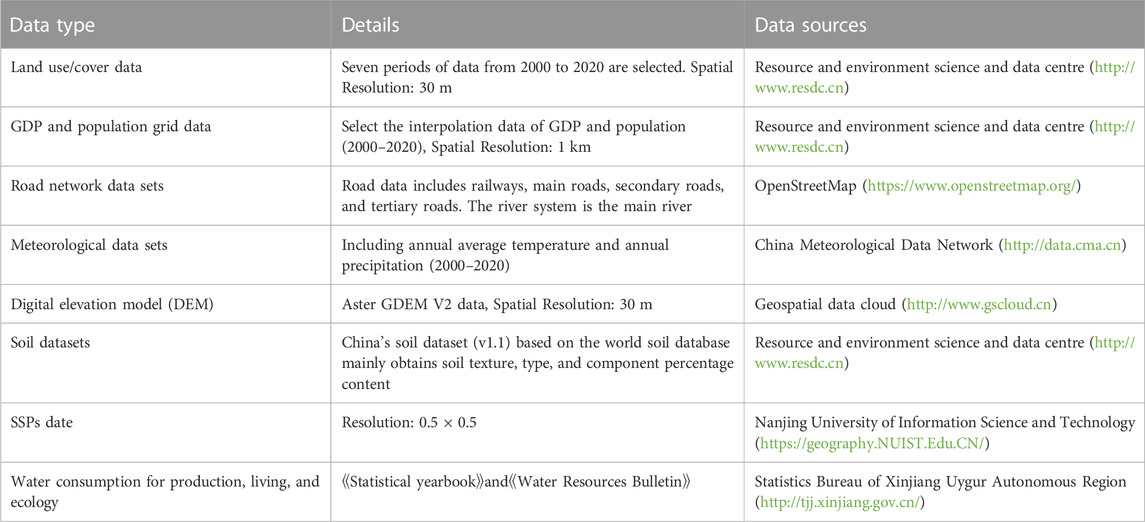
TABLE 1. Data type and sources.
The framework proposed in this study consists of three main parts (Figure 2). Firstly, the spatial and temporal analysis of land and water resources on the NSTM is based on dividing them into three parts: production, living, and ecology; secondly, the PLUS model is used to simulate future changes in the quantity and spatial distribution of land resources on the NSTM, and finally, scenarios are set up to simulate future changes in water resources under different SSP scenarios. In this study, SSPs, PLUS, and multiple regression equations were coupled to predict the water consumption of land use types on the NSTM from the perspective of PLES.
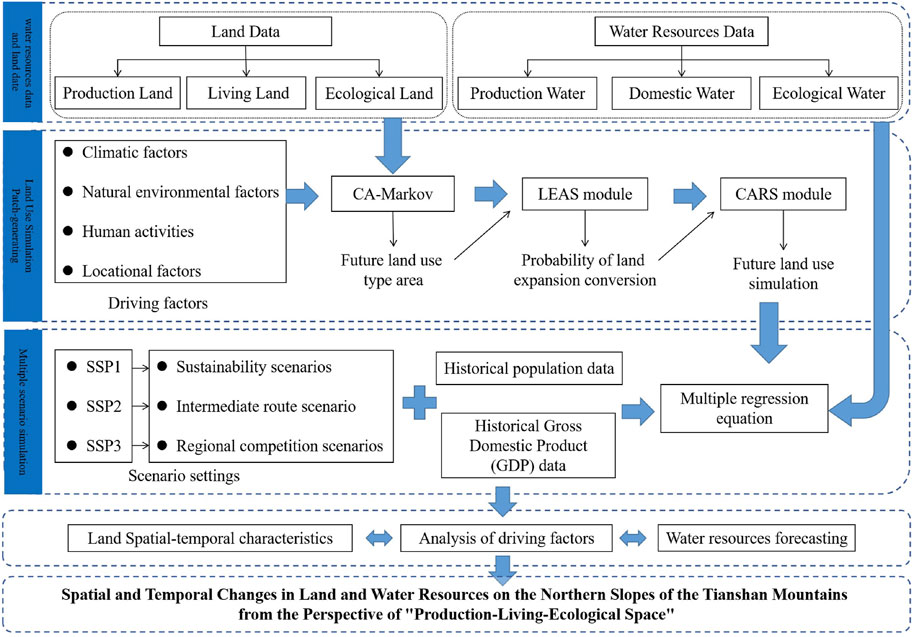
FIGURE 2. Research framework.
The land use data were classified from the perspective of land use cover types, with a total of six primary classifications and 25 secondary classifications (Liu et al., 2017). With research on the ecological environment, many scholars have proposed a classification scheme for ecological land from an environmental perspective (Wang J. et al., 2017), and a land use classification scheme based on the perspective of industrial structure and economic development (Liu et al., 2018). This classification uses the above ideas and classification schemes for reference and adopts dominant function classification. For example, forestland can produce fruits, has ecological functions, and may also have the life function of tourism. However, the dominant function of forestland is to maintain the ecological environment, so it is classified as ecological land (Deng and Yang, 2021; Cui et al., 2022; hou et al., 2022). Based on the perspective of PLES and land use leading functions, the classification scheme of PLES land use leading functions was established by summing up land use types in land use data (Table 2).
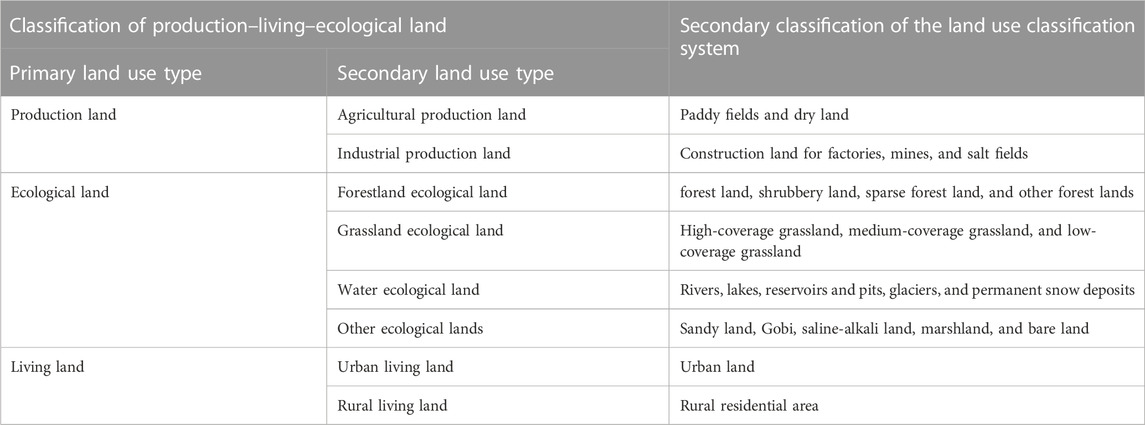
TABLE 2. Land use types based on the dominant function.
The dynamic degree of land use can quantitatively reflect the change speed of land use quantity in the study area (Yuan et al., 2022), and the formula is as follows:
where Rt is the comprehensive land use dynamic degree, Sxi and Syi are the areas of type I land in the early and later stages, km2, n is the number of land use types, and T is the time difference between two adjacent periods, a.
The land use transfer matrix can quantitatively analye the transformation between unearthed land use types and reflect land use change trends (Wang, 2022). The expression is:
where D is the land area, km2, x and y are the land use types before and after the transfer, and n is the number of land use types in the study area.
With the PLUS model, we can examine the driving factors behind land type expansion at patch scales, as opposed to other land use simulation models, and t is possible to obtain greater simulation accuracy by analying potential land use conversion rules (Liang et al., 2021). Consequently, the model was used in this study to analye the spatial pattern of land use in the study area from 2000 to 2020, as well as to simulate and predict future land use patterns.
Following are the steps and parameters.
(1) Land Expansion Analysis Strategy Module (LEAS): A total of twelve factors (Figure 3) inputs were gathered from four aspects: climate factor, social natural factor, and accessibility factor. Samples were selected by random sampling, the sampling rate and the number of decision trees were set to defaults, and four parallel threads were used (Liang et al., 2021).
(2) CA-based on muitiple random patch seeds (CARS) parameter settings: The domain effect was set as the default value of the system. The lower the attenuation coefficient, the more difficult it is to convert land types. Therefore, 0.5 was chosen, the diffusion coefficient was set to 0.1, and the probability of random patch seed was set to the default value (Liang et al., 2021).
(3) Weighting of used land neighborhoods: agricultural production land is 0.3, industrial production land is 0.9, forestland ecological land is 0.5, grassland ecological land is 0.6, water ecological land is 0.8, urban living land is 0.9, rural living land is 0.9, and other ecological lands are 0.2 (Jiang et al., 2022b).
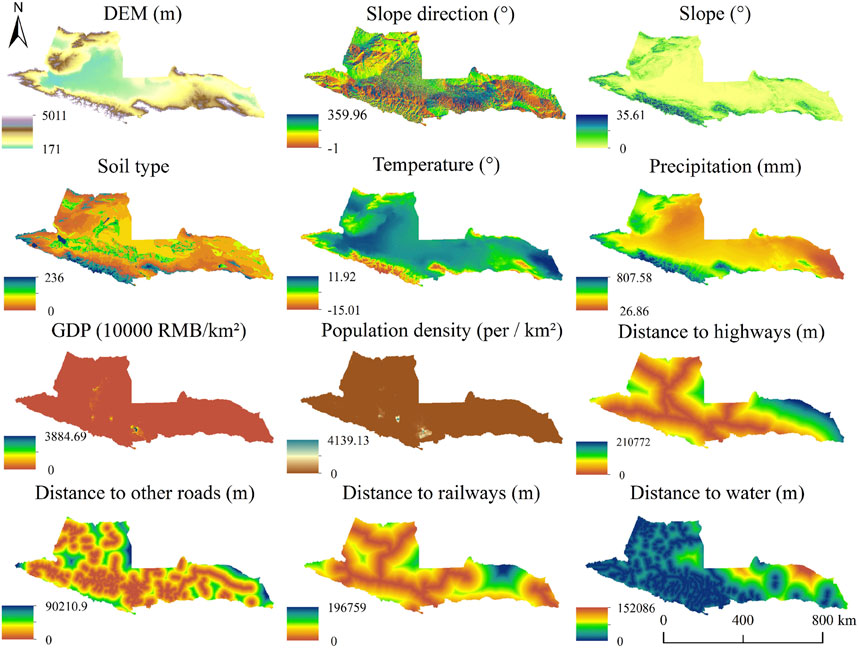
FIGURE 3. Driving factors affecting land use.
In this study, a new index (DISO) is selected to describe the overall performance of different models or simulations. This new index is a collection of other statistical indicators, including correlation coefficient (r), absolute error (AE), and root-mean-square error (RMSE), which has the advantage of quantifying the overall performance of different models compared to other indices (Hu et al., 2019). For the observed time series (A = [a1, a2, …, an]) and the model-simulated time series (B = (b1, b2, …, bn)], the r, AE, and RMSE are calculated as follows:
where
where N indicates normalied values of AE and RMSE. The simulation is close to the observation when DISO is close to 0.
The SSPs consist of five future scenarios: a sustainability scenario (SSP1), a middle route scenario (SSP2), a regional competition scenario (SSP3), an inequality scenario (SSP4), and a conventional fossil fuel and development scenario (SSP5) (O'Neill et al., 2017). Each pathway projects regional economic, demographic, and other factors and covers possible future development patterns in different regions, aiming to explore different levels of climate change adaptation and mitigation challenges (O'Neill et al., 2014). Referring to the relevant literature and taking into account the actual conditions on the northern slopes of the Tien Shan, the inequality scenario (SSP4) and the traditional fossil fuel and development scenario (SSP5) do not correspond to the future development trends on the northern slopes of the Tien Shan. In this study, SSP1, SSP2, and SSP3 were selected as the actual conditions of the NSTM and pathway route scenarios.
To estimate the future water consumption of production, living, and ecological land on the NSTM, we constructed a multiple regression equation using historical data. The relationship between the demand for water for the three different types of life is established using GDP, population, and land use type. An equation was developed using historical data of population, GDP, and land use type area on the NSTM from 2000 to 2020 as dependent variables and water consumption as the independent variables. The expression is as follows:
where WR is the total water consumption, POP is the total population in the year (104 people), GDP is the value of GDP in the year (100 million RMB), and land type is the land use type (km2) in the year. The R2 of the multiple equations WR production, WR domestic, and WR ecology were 0.91, 0.86, and 0.89, respectively. After the t-test, p < 0.05, indicated that the multiple regression coefficients were significant at the 5% level. The land use type area was predicted according to the population and GDP data predicted by different SSPs and the PLUS model. The water consumption of different land types in the future was predicted and calculated using Eqs 7–9, and the coupling of SSPs and the PLUS model was realied.
The productive, living and ecological land areas in the NSTM were counted in the western, middle, and eastern areas (Figure 4). The results show that in each of these regions, the NSTM is dominated by ecological land, distributed in the southern and northern parts of each section, and mainly composed of other ecological lands (49%) and ecological land for graing (48%). During 2000–2020, ecological land decreased from 116,858 km2 to 109,214 km2 at a rate of 382.2 km2/a in the western area, by 3,559 km2 at a rate of 177.95 km2/a in the middle section, and by 29.5 km2/a in the eastern area. The central oasis developed around rivers and lakes, consists mainly of agricultural production land (96%), with the western area increasing by 7,047 km2 at a rate of 352.35 km2/a and multiplying from 2000 to 2010 at a rate of 558.5 km2/a. Living land is mainly located in the central oasis, surrounded by agricultural production and ecological pastureland. It has increased rapidly over the last 20 years, with the western, middle, and eastern sections of the living land increasing by 83.5%, 49.9%, and 147.9%, respectively.
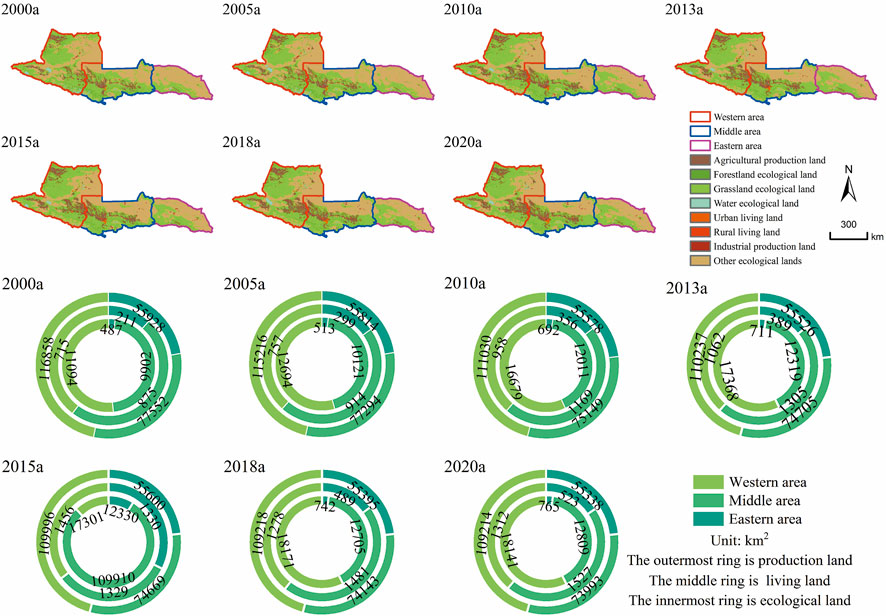
FIGURE 4. Land use distribution and area on the northern slopes of the Tianshan Mountains from 2000 to 2020.
During the past 20 years, the surface water volume on the NSTM has been stable (Figure 5A). The total water use has been growing, with an increase of nearly three billion m3 over 20 years, with the most significant proportion of water used for production, with an average value of approximately 93% (Figure 5B), whereas the water consumption per 10,000 RMB of GDP showed a decreasing trend (Figure 5C). The GDP of the NSTM increased 10.7 times between 2000 and 2020, and its population increased by 2,622,000 people (Figure 5C). With the economic development and population growth of the NSTM, the land-use pattern has also significantly changed. According to the dynamic attitude of each section of the NSTM from 2000 to 2010 and 2010–2020 (Figure 5D), the eastern section had the most significant change in living land use from 2000 to 2010 with a dynamic attitude of 7.06%. As shown in Figures 5E, F, the transfer of grassland ecological land and other ecological land to agricultural production land on the NSTM from 2000 to 2010 was 10,157 km2. From 2010 to 2020, the area of grassland ecological land and forestry ecological land increased by 13,042 km2 and 2,120 km2, respectively, and the area of subsistence land increased by 1,768 km2, mainly agricultural production land (55.09%) and grassland ecological land (18.21%).
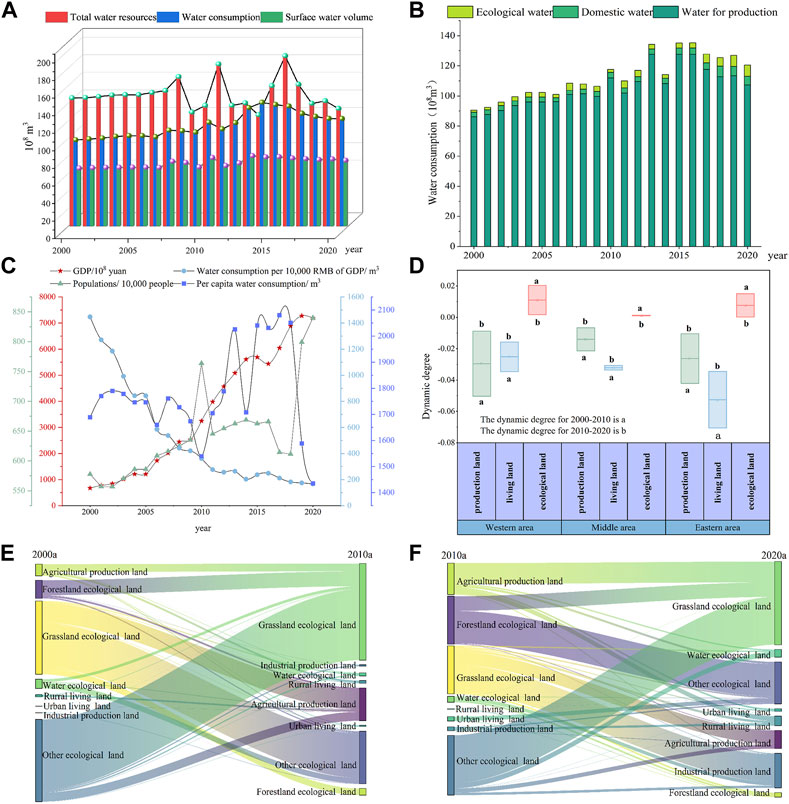
FIGURE 5. (A) The total water resources, surface water, and water consumption (B) Water consumption for production, living, and ecological purposes; (C) GDP, population, water consumption per capita, and water consumption per 10,000 RMB of GDP; (D) Dynamic attitudes for the periods 2000–2010 and 2010–2020; (E) (F) is land use transfer matrix from 2000 to 2010 and from 2010 to 2020.
The evolution of land patterns is the result of a combination of many drivers, and the degree of contribution of the drivers varies (Figure 6). Arable land changes are mainly influenced by topographic factors and population density. Woodland was mainly influenced by temperature (21.89%), rainfall (21.32%), and soil type (14.91%) in 2000–2010, while the degree of each driver was more balanced in 2010–2020, not influenced by a single factor, and the development was more stable and coordinated. Grassland was more influenced by population density (15.24%) and rainfall (11.97%) in 2000–2010, while the population density factor decreased to 7.73% in 2010–2020. The dominant driver for both urban sites and rural settlements was population density, which was 43.77% and 25.45% in 2010–2020, respectively. Industrial and mining land is influenced more by GDP (18.07%), distance to the railroad (11.52%), and annual rainfall (11.05%). The dominant factors influencing the change in unused land were soil type (12.67%) and precipitation (11.85%), which were mainly influenced by annual precipitation (14.45%), topographic factors (12.59%), and population density (11.23%) from 2010 to 2020.
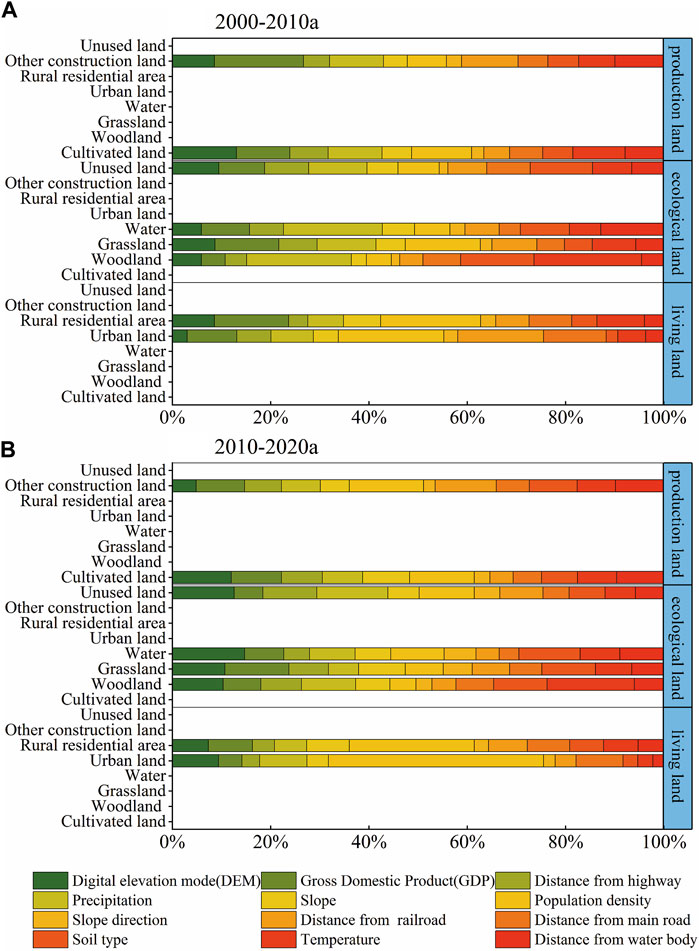
FIGURE 6. (A) The percentage of driving factors of land use changed from 2000 to 2010. (B) Contribution percentage of driving factors of land use types from 2010 to 2020.
The land use distribution in 2020 was simulated using 2010 land use data and compared with the actual land use distribution in 2020 to verify that the PLUS model is applicable to the NSTM (Figure 7). The results showed that the kappa coefficient was 0.81, and the overall accuracy was 0.88. As a further validation of the model’s simulation accuracy, the coefficient of merit (FoM) was introduced with FoM = 0.28. In the simulation comparison, the PLUS model was found to be more applicable to modeling land and spatial changes in the NSTM over the long term.
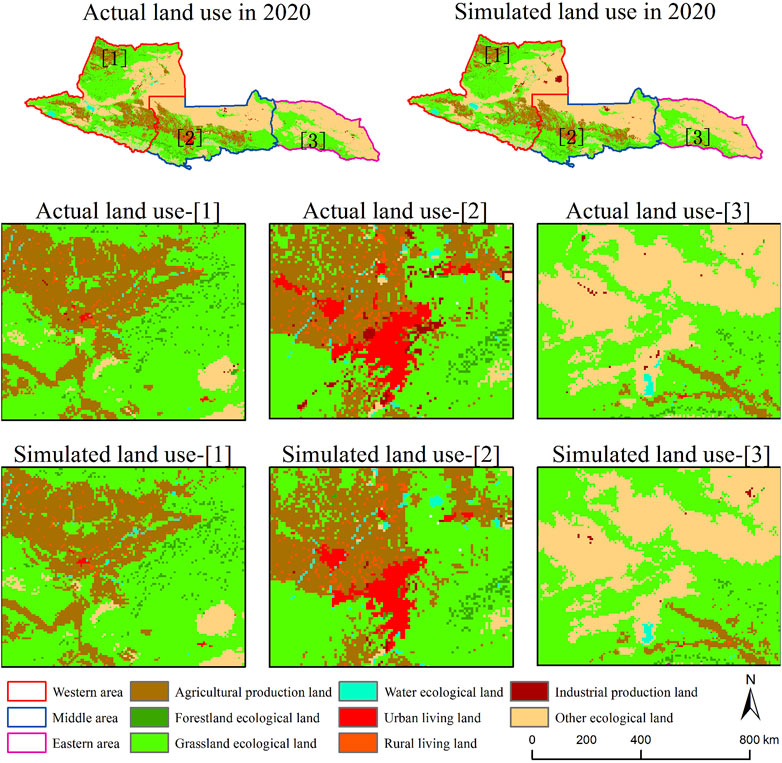
FIGURE 7. Comparison of simulated land use and actual land use in 2020.
Based on the PLUS model simulation, we obtained the land dynamics of the study area from 2030 to 2050 (Figure 8) and counted the areas of production, living, and ecological land by section. Between 2030 and 2050, the production land in the western section increased by 993 km2, the middle section increased by 1948 km2, the eastern section increased by 168 km2, and agricultural production land in the production land increased by approximately 90%. The area of living land in the western section was the largest, increasing by 444 km2, and the area of the eastern section increased by 56 km2. The data indicate that ecological land continues to decrease, with the western section decreasing by approximately 1,168 km2 and the eastern section decreasing by 147 km2, among which the middle section is grave, decreasing by 2,193 km2, accounting for approximately 2.5% of the ecological land area in the middle section.
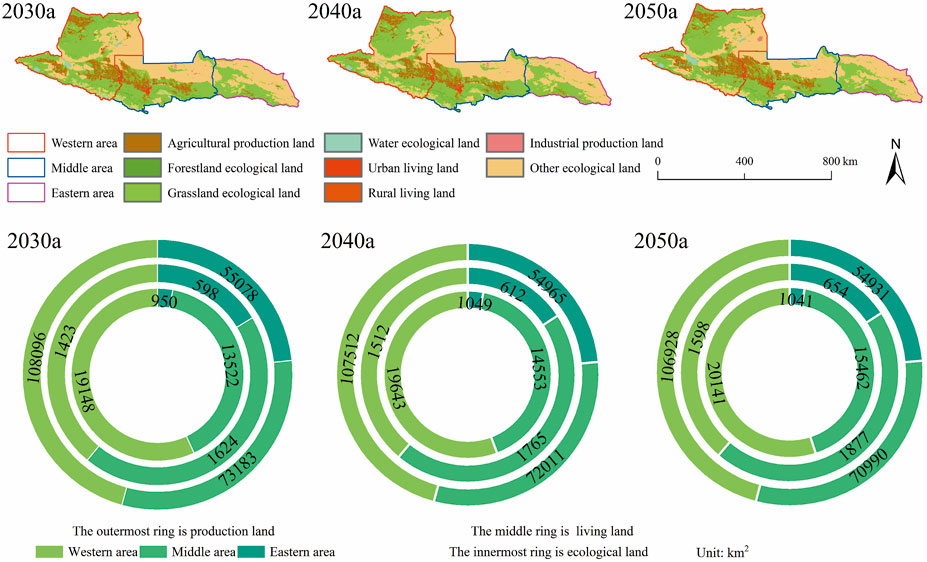
FIGURE 8. Land use distribution and area on the northern slopes of the Tianshan Mountains from 2030 to 2050.
During 2030–2050, water use for production (Figure 9A) will continue to increase under the SSP1 and SSP2 scenarios, with SSP2 increasing by 2,407 million m3, while water use decreases under the SSP3 scenario by 305 million m3. It is noteworthy that water consumption per 10,000 RMB of GDP (Figure 9E) shows a decreasing trend, with SSP3 decreasing the most, by 49.37 m3, indicating that under the regional competition path, the NSTM is generating less water to create economic value. Regarding domestic water use (Figure 9B), the three scenarios showed a slow growth trend, with the most significant increase of 101 million m3 in the SSP2 scenario. The growth of domestic water use is slow owing to the completion of the demographic transition in the SSP2 scenario, where the population grows slowly and gradually plateaus. The per capita domestic water consumption (Figure 9F) does not differ much among the three scenarios, ranging from 159.4 L/d to 177.04 L/d. In terms of ecological water use (Figure 9C), SSP2 increased the most at 362 million m3, indicating that under the middle path, it maintains a similar path to the historical period and continues to develop, striving to achieve sustainable development in terms of the ecological environment and human wellbeing. At the same time, the other scenarios also showed an increasing trend. In terms of the total water consumption (Figure 9D), all three scenarios increased, but the degree of increase varied greatly, with SSP3 increasing by only 132 million m3.
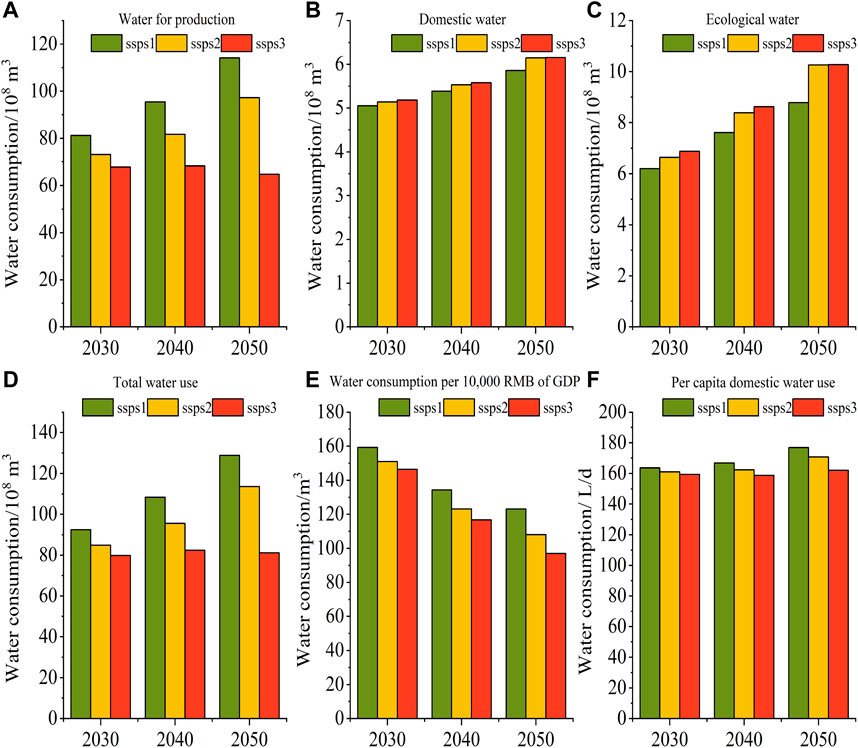
FIGURE 9. (A–D) show the total amount of production, domestic, ecological, and water consumption of the northern slopes of the Tianshan Mountains from 2030 to 2050. (E) Water consumption per 10,000 RMB of GDP. (F) Per capita domestic water use.
Land use drivers are dynamic organic systems in which many factors inside and outside the system interact to influence land use type/cover change (Chen et al., 2006). At the same time, land use change is not entirely passive and independent; the results of land use change eventually also affect drivers through various pathways, thus creating feedback (hao et al., 2014; Ouedraogo et al., 2015). The drivers of land use include natural and human drivers, with natural drivers, including changes in the characteristics and processes of the natural environment, and human drivers, including factors such as population change, economic growth, proximity to roads, and policy-making. In this study, the driving forces were analyed based on land use/cover changes in the NSTM from 2000 to 2020. Factors such as topographic factors and soil type played a dominant role in forming land use patterns (Wang et al., 2019). These factors are relatively stable and have cumulative effects on productive and ecological land. In contrast, anthropogenic factors, such as population density, economic growth, and transportation, are relatively active and play a decisive role in the formation of short-term land use patterns, such as for living land (hang et al., 2017; Lamqadem et al., 2019). Fluctuations in meteorological factors affect the spatial and temporal patterns of various types of land. The NSTM is in an arid one, and it is a typical “mountain–oasis–desert” mountain basin system. It has been shown that the average annual precipitation growth rate on NSTM is 10.67 mm/10a. The average temperature growth rate is 0.32°C/10a (Li et al., 2018), with a general trend of continued slow warming and humidification, which is closely linked to the expansion of snow and ice melt water and lake areas, significantly increasing the reservoir area, and indirectly affecting the expansion of the oasis arable land area (Wang N. et al., 2020).
With the implementation of the national strategy of Western development and the construction of cotton plantation bases, land development has been encouraged from a policy perspective (Wang Y. et al., 2017). Simultaneously, the market economy’s developmental needs and the population’s economic growth have made land reclamation a fast and effective means of increasing income (Chen et al., 2020). However, the NSTM is in an arid inland region with little rainfall and high evaporation; increased land reclamation in this area consequently led to a water shortage problem. In the 1980s, large-scale mulched drip irrigation was introduced to improve the utiliation efficiency of farmland water resources. The measures of area drip irrigation by the Xinjiang Production and Construction Corps exceeded 82.4% (Wang . et al., 2020). Applying water-saving irrigation and facility agriculture technologies has led to changes in land use types; farmland has appeared in desert areas previously considered unsuitable for reclamation, and land use types have changed, with technological drivers becoming the motivation for regional land use changes. Natural drivers are essential for land use distribution and play a dominant role in long-term land change. In contrast, human factors played a decisive role in short-term spatial and temporal land use changes.
In terms of model simulation, this study uses the FOM index to quantify the accuracy of the land change model, which is more advantageous than the kappa index. The FOM index provides a unit-by-unit comparison between the simulation and the actual situation, which can increase the reliability of the simulation. Regarding the accuracy indicators of the simulations, using the DISO metric, we were able to determine the level of model performance and summarie the overall evaluation of individual simulations. The PLUS model simulated the slightest deviation for the living land with a DISO value of 0.25, followed by the ecological land, and the most deviation for the production land with a DISO value of 0.37 (Table 3). In terms of the data used, a total of 12 indicators in two aspects, human activities, and natural factors were selected to drive the model to simulate a more realistic land type change, but some factors, such as policy factors and technology, which are difficult to quantify and fail to study comprehensively may have some errors. In addition, the water use of land types is also a complex system involving many factors, which this study fails to consider comprehensively, and has some bias in the numerical estimation. Typical climate scenarios and development models should be chosen for further studies, and a model framework should be established to improve accuracy. As such, we will continue to refine the impact of future land use change on water resources under various scenario models to accommodate the application requirements for future scenarios.
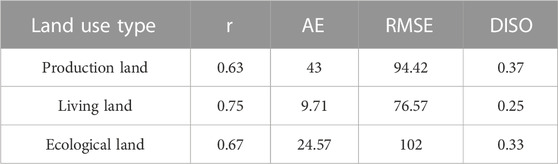
TABLE 3. Simulation accuracy of production land, living land, and ecological land from 2000 to 2020.
This study proposes a research framework for multi-scenario water resource prediction based on the PLUS model and the SSPs, which simulates and analyes the spatial and temporal changes in water and soil resources on the NSTM from 2030 to 2050, predicts the productive, domestic, and ecological land use from 2030 to 2050, quantifies the contribution of each driver to the dynamic changes in land cover, and predicts the water use of the NSTM under the SSPs based on the water consumption for production, living, and ecology. The following conclusions were drawn.
(1) The NSTM is mainly ecological land, which shows a decreasing trend, whereas production and living land show an increasing trend. Land transfer is mainly concentrated between agricultural production land, grassland ecological land, and other ecological lands. The change in production land was mainly influenced by population density (10.05%) and GDP (14.47%), living land was mainly influenced by population density, and ecological land was influenced by annual rainfall (16.33%) and topographic factors (12.07%).
(2) The PLUS model has better applicability in simulating land and spatial changes in the NSTM, with a Kappa coefficient of 0.81, an overall accuracy of 0.88, and an FoM of 0.28. The total future water use in the simulated NSTM increased in all three scenarios, with production water still accounting for the largest share, and production water decreased in the SSP3 scenario with a decrease of 305 million m3. Domestic water uses: The three scenarios show a slow growth trend. In terms of ecological water use, SSP2 increased the most at 362 million m3.
The original contributions presented in the study are included in the article/supplementary material, further inquiries can be directed to the corresponding authors.
The study was conceptualied by GY, XL, and HT. The diagrams were designed and produced by YL and XH. XX, YG, and FL significantly contributed to the analysis and manuscript preparation. XX, PL, BL, and XL performed the analysis. All authors contributed to the article and approved the submitted version.
This research was supported by the National Natural Science Foundation of China (Grant Number 52269006, U1803244); Xinjiang Production and Construction Corps (Grant Numbers 2021AB021, 2022BC001, 2022DB023); The Third Xinjiang Scientific Expedition Program (Grant No. 2021xjkk0804) and Shihei University (Grant Number CXRC201801, RCK 2018C22).
The authors declare that the research was conducted in the absence of any commercial or financial relationships that could be construed as a potential conflict of interest.
The handling editor HL declared shared parent affiliation with author FL at the time of review.
Reviewer ZH declared shared parent affiliation with author FL to the handling editor at the time of review.
All claims expressed in this article are solely those of the authors and do not necessarily represent those of their affiliated organizations, or those of the publisher, the editors and the reviewers. Any product that may be evaluated in this article, or claim that may be made by its manufacturer, is not guaranteed or endorsed by the publisher.
Bao, Q., Ding, J., Han, L., Li, J., and Ge, X. (2022). Predicting land change trends and water consumption in typical arid regions using multi-models and multiple perspectives. Ecol. Indic. 141, 109110. doi:10.1016/j.ecolind.2022.109110
Bryan, B. A., Gao, L., Ye, Y., Sun, X., Connor, J. D., Crossman, N. D., et al. (2018). China's response to a national land-system sustainability emergency. Nature 559 (7713), 193–204. doi:10.1038/s41586-018-0280-2
Chen, X., Chang, C., Bao, A., Wu, S.-x., and Luo, G. (2020). Spatial pattern and characteristics of land cover change in Xinjiang since past40 years of the economic reform and opening up. Arid. Land Geogr. 43 (01), 1–11.
Chen, Y., Li, B., Fan, Y., Sun, C., and Fang, G. (2019). Hydrological and water cycle processes of inland river basins in the arid region of Northwest China. J. Arid Land 11, 161–179. doi:10.1007/s40333-019-0050-5
Chen, Y., Xu, X., and Wang, S. (2006). Land use/cover change and degradation trend of the ortindag sandy area inInner Mongolia plateau. Mt. Res. (01), 60–64.
Cui, X., Ning, X., Wanxu, C., Guanheng, W., Jiale, L., Sipei, P., et al. (2022). Spatio-temporal variation and influencing factors of the coupling coordination degree of production-living-ecological space in China. Int. J. Environ. Res. Public Health 19, 10370. doi:10.3390/ijerph19161037019(16)
Deng, Y., and Yang, R. (2021). Influence mechanism of production-living-ecological space changes in the urbaniation process of guangdong province, China. Land 10 (12), 1357. doi:10.3390/land10121357
Eaton, W. M., Brasier, K. J., Burbach, M. E., Walt, W., Engle, E. W., Barbara, Q., et al. (2021). A conceptual framework for social, behavioral, and environmental change through stakeholder engagement in water resource management. Soc. Nat. Resour. 34 (8). doi:10.1080/08941920.2021.1936717
Fang, C., Gao, Q., hang, X., and Cheng, W. (2019). Spatiotemporal characteristics of the expansion of an urban agglomeration and its effect on the eco-environment: Case study on the northern slope of the Tianshan Mountains. Sci. China Earth Sci. 62 (9), 1461–1472. doi:10.1007/s11430-018-9369-x
Fu, X., Wang, X., hou, J., and Ma, J. (2021). Optimiing the production-living-ecological space for reducing the ecosystem services deficit. Land 10 (10), 1001. doi:10.3390/land10101001
Halima, I. E., and Hiroaki, S. (2022). A scenario simulation and the prediction of land use and land cover changes in Nigeria. J. Environ. Inf. Sci. 2021 (12).
Hou, M., and Braham, W. W. (2021). Land development in an urban megalopolis: A holistic environmental assessment of housing on chongming eco-island, China. J. Clean. Prod. 312, 127617. doi:10.1016/j.jclepro.2021.127617
Hu, S., Ma, R., Sun, ., Ge, M., eng, L., Huang, F., et al. (2021). Determination of the optimal ecological water conveyance volume for vegetation restoration in an arid inland river basin, northwestern China. Sci. Total Environ. 788, 147775. doi:10.1016/j.scitotenv.2021.147775
Hu, ., Chen, X., hou, Q., Chen, D., and Li, J. (2019). Diso: A rethink of taylor diagram. Int. J. Climatol. 39 (5). doi:10.1002/joc.5972
hai, H., Lv, C., Liu, W., Yang, C., Fan, D., Wang, ., et al. (2021). Understanding spatio-temporal patterns of land use/land cover change under urbaniation in wuhan, China, 2000–2019. Remote Sens. 13 (16), 3331. doi:10.3390/rs13163331
hang, D., Huang, Q., He, C., and Wu, J. (2017). Impacts of urban expansion on ecosystem services in the beijing-tianjin-hebei urban agglomeration, China: A scenario analysis based on the shared socioeconomic pathways. Resour. Conservation Recycl. 125, 115–130. doi:10.1016/j.resconrec.2017.06.003
hao, L., Liu, X., Xu, X., Liu, C., and Chen, K. (2022). Three-dimensional simulation model for synergistically simulating urban horiontal expansion and vertical growth. Remote Sens. 14 (6), 1503. doi:10.3390/rs14061503
hao, X., hang, ., Wang, X., uo, L., Liu, B., Yi, L., et al. (2014). Analysis of Chinese cultivated land's spatial-temporal changes and causes inrecent 30 years. Trans. Chin. Soc. Agric. Eng. 30 (03), 1–11.
hou, G., Di, ., Qian, ., and Tao, S. (2022). Study on the spatiotemporal evolution characteristics of the "Production–Living–Ecology" space in the Yellow River Basin and its driving factors. Sustainability 14 (22), 15227. doi:10.3390/su142215227
Jiang, X., Bingxin, L., Hongyu, ., Qiqi, ., Xiaoya, S., and Haoran, . (2022a). Examining the spatial simulation and land-use reorganisation mechanism of agricultural suburban settlements using a cellular-automata and agent-based model: Six settlements in China. Land Use Policy 120, 106304. doi:10.1016/j.landusepol.2022.106304120
Jiang, X., hai, S., Liu, H., Chen, J., hu, Y., and Wang, . (2022b). Multi-scenario simulation of production-living-ecological space and ecological effects based on shared socioeconomic pathways in henghou, China. Ecol. Indic. 137, 108750. doi:10.1016/j.ecolind.2022.108750
Lamqadem, A. A., Afrasinei, G. M., and Saber, H. (2019). Analysis of Landsat-derived multitemporal vegetation cover to understand drivers of oasis agroecosystems change. J. Appl. Remote Sens. 13 (1), 1. doi:10.1117/1.jrs.13.014517
Li, C., Wu, Y., Gao, B., heng, K., Wu, Y., and Li, C. (2021). Multi-scenario simulation of ecosystem service value for optimiation of land use in the Sichuan-Yunnan ecological barrier, China. Ecol. Indic. 132, 108328. doi:10.1016/j.ecolind.2021.108328
Li, J., Chen, Y., and Liu, . (2018). Variations in temperature and precipitation and their influences on surface waterresource in different climate ones of Xinjiang. J. Univ. Chin. Acad. Sci. 35 (03), 370–381.
Liang, X., Guan, Q., Clarke, K. C., Liu, S., Wang, B., and Yao, Y. (2021). Understanding the drivers of sustainable land expansion using a patch-generating land use simulation (PLUS) model: A case study in wuhan, China. Comput. Environ. Urban Syst. 85, 101569. doi:10.1016/j.compenvurbsys.2020.101569
Lin, J., He, P., Yang, L., He, X., Lu, S., and Liu, D. (2022). Predicting future urban waterlogging-prone areas by coupling the maximum entropy and FLUS model. Sustain. Cities Soc. 80, 103812. doi:10.1016/j.scs.2022.103812
Lin, ., and Peng, S. (2022). Comparison of multimodel simulations of land use and land cover change considering integrated constraints - a case study of the Fuxian Lake basin. Ecol. Indic. 142, 109254. doi:10.1016/j.ecolind.2022.109254
Liu, C., Xu, Y., Liu, Y., Sun, P., Huang, A., and hou, J. (2018). Research on land use functions classification and evaluation system based onSystem theory. Acta Sci. Nat. Univ. Pekin. 54 (01), 181–188.
Liu, J., Liu, Y., and Li, Y. (2017). Classification evaluation and spatial-temporal analysis of "production-living-ecological" spaces in China. Acta Geogr. Sin. 72 (07), 1290–1304.
Lu, ., Feng, Q., Xiao, S., Xie, J., ou, S., Yang, Q., et al. (2021). The impacts of the ecological water diversion project on the ecology-hydrology-economy nexus in the lower reaches in an inland river basin. Resour. Conservation Recycl. 164, 105154. doi:10.1016/j.resconrec.2020.105154
O'Neill, B. C., Kriegler, E., Ebi, K. L., Kemp-Benedict, E., Riahi, K., Rothman, D. S., et al. (2017). The roads ahead: Narratives for shared socioeconomic pathways describing world futures in the 21st century. Glob. Environ. Change 42, 169–180. doi:10.1016/j.gloenvcha.2015.01.004
O'Neill, B. C., Kriegler, E., Riahi, K., Ebi, K. L., Hallegatte, S., Carter, T. R., et al. (2014). A new scenario framework for climate change research: The concept of shared socioeconomic pathways. Clim. Change 122 (3), 387–400. doi:10.1007/s10584-013-0905-2
Ouedraogo, I., Mbow, C., Balinga, M., and Neufeldt, H. (2015). Transitions in land use architecture under multiple human driving forces in a semi-arid one. Land 4 (3), 560–577. doi:10.3390/land4030560
Philip, A., Simon, B., Ardey, C. S. N., and Mawunyo, D. F. (2023). Land use and land cover change detection and prediction based on CA-Markov chain in the savannah ecological one of Ghana. Environ. Challenges 10 (10), 100664. doi:10.1016/j.envc.2022.100664
Pokhrel, Y., Felfelani, F., Satoh, Y., Boulange, J., Burek, P., Gädeke, A., et al. (2021). Global terrestrial water storage and drought severity under climate change. Nat. Clim. Change 11 (3), 226–233. doi:10.1038/s41558-020-00972-w
Shi, M., Wu, H., Fan, X., Jia, H., Dong, T., He, P., et al. (2021). Trade-offs and synergies of multiple ecosystem services for different land use scenarios in the yili river valley, China. Sustainability 2021 (13), 1577–1580. doi:10.3390/su13031577
Song, S., Liu, ., He, C., and Lu, W. (2020). Evaluating the effects of urban expansion on natural habitat quality by coupling localied shared socioeconomic pathways and the land use scenario dynamics-urban model. Ecol. Indic. 112, 106071. doi:10.1016/j.ecolind.2020.106071
Stanley, C., Olang, L. O., and Sitoki, L. (2023). Modelling of land-use/cover change trajectories in a transboundary catchment of the Sio-Malaba-Malakisi Region in East Africa using the CLUE-s model. Ecol. Model. 476, 110256. doi:10.1016/j.ecolmodel.2022.110256
Wang, H., Cai, Y., Yang, Q., Gong, Y., and Lv, G. (2019). Factors that alter the relative importance of abiotic and biotic drivers on the fertile island in a desert-oasis ecotone. Sci. Total Environ. 697, 134096. doi:10.1016/j.scitotenv.2019.134096
Wang, H., Liu, Y., Cai, L., Fan, D., Wang, Y., and Yao, Y. (2021). Regional differentiation in the ecological effects of land cover change in China. Land Degrad. Dev. 33 (2), 346–357. doi:10.1002/ldr.4156
Wang, J., Chen, Y., Wang, W., Qi, Y., He, T., and Wu, R. (2017a). Classification system and spatio-temporal distribution of ecological land in Chinain the period of 1996-2012. Geogr. Res. 36 (03), 453–470.
Wang, N., Yang, X., hang, W., Chen, , and a, A. (2020a). The relationship between area variation of the Aral Sea in the arid Central Asiaand human activities and climate change. J. Glaciol. Geocryol. 42 (02), 681–692.
Wang, Q., and Wang, H. (2022). Dynamic simulation and conflict identification analysis of production-living-ecological space in wuhan, central China. Integr. Environ. Assess. Manag. 18, 1578–1596. doi:10.1002/ieam.4574
Wang, T., and Sun, F. (2022). Global gridded GDP data set consistent with the shared socioeconomic pathways. Sci. Data 9 (1), 221. doi:10.1038/s41597-022-01300-x
Wang, Y. (2022). Spatial–temporal evolution of “production-living-ecologica” function and layout optimiation strategy in China: A case study of liaoning province, China. Environ. Sci. Pollut. Res. Int. 30, 10683–10696. doi:10.1007/s11356-022-22899-9
Wang, Y., hou, H., Wu, B., and Li, Y. (2017b). Ecological achievement of Xinjiang production and construction Corps and ItsProblems and countermeasures. Bull. Chin. Acad. Sci. 32 (01), 55–63.
Wang, ., Chen, X., hang, X., Fan, W., Li, W., and ong, R. (2020b). Discussion of the future development of field drip irrigation in China. Agric. Res. Arid Areas 38 (04), 1–9.
Xiang, L., Jingying, F., Dong, J., Gang, L., and Chenglong, C. (2022). Land use optimiation in Ningbo City with a coupled GA and PLUS model. J. Clean. Prod. 375, 134004. doi:10.1016/j.jclepro.2022.134004
Xu, Y., Lu, F., hou, Y., Ruan, B., Dai, Y., and Wang, K. (2022). Dryness–wetness encounter probabilities' analysis for lake ecological water replenishment considering non-stationarity effects. Front. Environ. Sci. 10. doi:10.3389/fenvs.2022.806794
Keywords: plus model, land use, water resource, shared socioeconomic pathways, sustainable development
Citation: Xu X, Tian H, Yang G, Li X, He X, Li Y, Gao Y, Li F, Li P, Liu B and Xue L (2023) Spatial and temporal changes in land and water resources on the northern slopes of the Tianshan mountains from the perspective of “production-living-ecological space”. Front. Environ. Sci. 11:1121248. doi: 10.3389/fenvs.2023.1121248
Received: 11 December 2022; Accepted: 21 February 2023;
Published: 02 March 2023.
Edited by:
Hu Liu, Northwest Institute of Eco-Environment and Resources (CAS), ChinaReviewed by:
Zhibin He, Northwest Institute of Eco-Environment and Resources (CAS), ChinaCopyright © 2023 Xu, Tian, Yang, Li, He, Li, Gao, Li, Li, Liu and Xue. This is an open-access article distributed under the terms of the Creative Commons Attribution License (CC BY). The use, distribution or reproduction in other forums is permitted, provided the original author(s) and the copyright owner(s) are credited and that the original publication in this journal is cited, in accordance with accepted academic practice. No use, distribution or reproduction is permitted which does not comply with these terms.
*Correspondence: Guang Yang, bWlrZXlvcmtAMTYzLmNvbQ==; Xiaolong Li, bGl4aWFvbG9uZzQwOUBzaHUuZWR1LmNu
†These authors have contributed equally to this work and share first authorship.
Disclaimer: All claims expressed in this article are solely those of the authors and do not necessarily represent those of their affiliated organizations, or those of the publisher, the editors and the reviewers. Any product that may be evaluated in this article or claim that may be made by its manufacturer is not guaranteed or endorsed by the publisher.
Research integrity at Frontiers
Learn more about the work of our research integrity team to safeguard the quality of each article we publish.