 Catherine M. Adams
 Dana L. Winkelman2†
 Ryan M. Fitzpatrick
95% of researchers rate our articles as excellent or good
Learn more about the work of our research integrity team to safeguard the quality of each article we publish.
Find out more
ORIGINAL RESEARCH article
Front. Environ. Sci. , 07 April 2023
Sec. Freshwater Science
Volume 11 - 2023 | https://doi.org/10.3389/fenvs.2023.1120412
This article is part of the Research Topic River Rehabilitation in the Anthropocene View all 7 articles
Wastewater treatment plant effluent can increase stream water temperature from near freezing to 5°C–12°C in winter months. Recent research in the South Platte River Basin in Colorado showed that this warming alters the reproductive timing of some fishes. However, the spatial extent and magnitude of this warming are unknown. Thus, we created winter water temperature models both upstream and downstream of effluent inputs for two urban tributaries of the South Platte River, the Big Thompson River, and St. Vrain Creek. We examined the influence of air temperature, discharge, effluent temperature, and distance downstream on water temperature over the winter period (December–February). The models were also used to predict water temperature in the absence of effluent and based on air temperature predictions in 2052 and 2082. Effluent temperature was the largest driver of water temperature downstream of the effluent, while the impact of air temperature was comparatively small. Streams cooled after an initially sharp temperature increase, though were still predicted to be ∼2°C greater than they would be in the absence of effluent at ∼0.5 km. Predicted air temperatures in 2052 and 2082 had a negligible effect on water temperature, suggesting that mitigating effluent temperature is key to protecting the winter thermal regimes of effluent-impacted rivers. Our models can be used to gain insight into the magnitude and downstream extent of the impact of effluent temperature on small urban streams in winter and provide a baseline for models in other watersheds and at larger scales.
Anthropogenic modification of river systems is ubiquitous, resulting primarily from population growth and subsequent urbanization and industrialization. Modifications typically have impacts on geomorphological processes that in turn influence river health. Water temperature is particularly sensitive to human influence and anthropogenically caused deviations from natural thermal regimes are well documented, including increased overland flow (Nelson and Palmer, 2007), deforestation (Burton and Likens, 1973), rising air temperatures and declining streamflow due to climate change (Pankurst and Munday, 2011; Isaak et al., 2017). Most anthropogenic alterations increase river water temperature, though the magnitude, duration, and timing of these thermal increases vary (Cassie, 2006). Even small changes in temperature, however, can have measurable impacts on aquatic communities.
Water temperature is an environmental driver of ectotherm biology. It controls and regulates important biological functions and behaviors including activity, metabolism, development, and reproduction (Brett, 1956; Bestgen & Williams, 1994; Hester & Doyle, 2011). It has been well documented that abnormal thermal regimes resulting from changes in water temperature can alter fish life history processes, reproductive timing, and hatching success (Bestgen and Williams, 1994; Pankhurst and Munday, 2011; Starzynski and Lauer, 2015; Fraser et al., 2019; Adams et al., 2022). Human induced alterations to water temperature have been documented to have negative impacts on fish populations (Farmer et al., 2015; White et al., 2020). For example, bluegill sunfish populations in lakes warmed by electrical power plant cooling systems had shorter life spans than those in nearby ambient lakes (White et al., 2020). Increased winter water temperature also affects the reproductive biology of percid fishes (Farmer et al., 2015; Baum, 2021; Adams et al., 2022). This has led federal and state agencies to create river water temperature standards for protection of fishes and river ecosystems. Mitigation of thermal pollution is usually complex and expensive and requires managers to have accurate information to implement management options. Water temperature models can provide managers with broader temporal and spatial information to prioritize management actions more efficiently.
Statistical models have been successfully utilized to evaluate anthropogenic impacts on stream water temperature and to predict water temperatures under a variety of hypothesized management strategies or future conditions (Neumann et al., 2003; Isaak et al., 2017). These models suggest air temperature, discharge, and riparian cover have substantial effects on water temperature. Model predictions have the added benefit of providing guidance to managers on how to mitigate these impacts and what to expect in future scenarios. For example, restoring riparian vegetation may mitigate water temperature increases predicted due to increasing air temperatures and declining streamflow (Justice et al., 2017) caused by climate change. Impacts of point source thermal pollutants on rivers have been less investigated and mainly focus on water releases below dams (Daniels and Danner, 2020; Ahmad et al., 2021). Most water temperature models also focus on large river networks over the summer period (Isaak et al., 2017; Mandeville et al., 2019) when aquatic ectotherms are often already near their critical thermal maxima (Magnunson and DeStasio, 1997). Most other predictive modeling efforts have not prioritized other seasons, particularly winter. This is despite considerable documentation that discharge from wastewater treatment plant (WWTP) effluent increases river water temperatures during the winter months (Kinouchi et al., 2007; Rice et al., 2011; Graham et al., 2014), and evidence that abnormally warm winters impact aquatic communities (Farmer et al., 2015; Firkus et al., 2018; Baum, 2021; Adams et al., 2022). Models investigating the magnitude and spatial extent of WWTP effluent on the thermal regime of streams are needed to make efficient management strategies to mitigate thermal impacts in winter and meet local water temperature standards.
The main goal of our study was to create a model to investigate the magnitude and spatial impact of warm effluent on water temperature in winter (December–February) using linear regression for two urban Colorado South Platte tributaries, the Big Thompson River, and St. Vrain Creek. We chose these tributaries for our study because they have low Winter baseflows, experience WWTP effluent discharge, and are of specific conservation concern due to their recreational importance and high concentration of native species (Woodling, 1985). In addition, we have shown that warm effluent can substantially increase winter water temperature and influence the timing of fish reproduction (Adams et al., 2022). Specifically, we hypothesized that air temperature, river discharge, effluent temperature, and distance from the effluent would influence the spatial pattern of water temperature downstream of the WWTP effluent. In contrast, air temperature, discharge, and distance from the effluent would influence the spatial pattern of water temperature upstream of the effluent. We also used our upstream model to predict water temperature downstream of the WWTP in the absence of effluent. Finally, we used our models to anticipate the impact of predicted winter air temperatures on stream water temperatures 30 and 60 years in the future to compare the threat of climate change with that of effluent discharge on winter water temperature of these streams. The results of our study will provide management agencies with additional information necessary to understand the spatial and temporal extent of WWTP effluent thermal impacts on water temperature during the winter period and provide a framework for future assessment of the influence of wastewater effluents on stream ecosystems.
The Big Thompson River is a 125.5 km South Platte tributary that begins in Rocky Mountain National Park (RMNP) near Estes Park, CO, flows east through the city of Loveland, transitioning to a plains stream as it converges with the main stem South Platte near Greeley, CO (USGS, 1981a). St. Vrain Creek is a 51.8 km tributary that begins further south in RMNP and flows east through the city of Longmont transitioning to a plains stream as it converges with the main stem South Platte near Milliken, CO (USGS, 1981b). Both rivers have WWTP effluent inputs in the cities they flow through. The urban sections of these rivers sustain populations of multiple Colorado native warm-water fishes and are classified as WS–I streams by Colorado Department of Public Health and the Environment due to the presence of Johnny Darter (Etheostoma nigrum; Maximum weekly water temperature of 12.1°C permitted during December-February). Both rivers decline ∼30 m elevation through our study site that ends in natural or wildlife areas at the east edge of each town (USGS, 1981a; USGS, 1981b; Figure 1). Finally, the annual hydrographs of these streams are characterized by low baseflow discharge from September—April and peak/high flows from May-August due to montane snowmelt runoff.
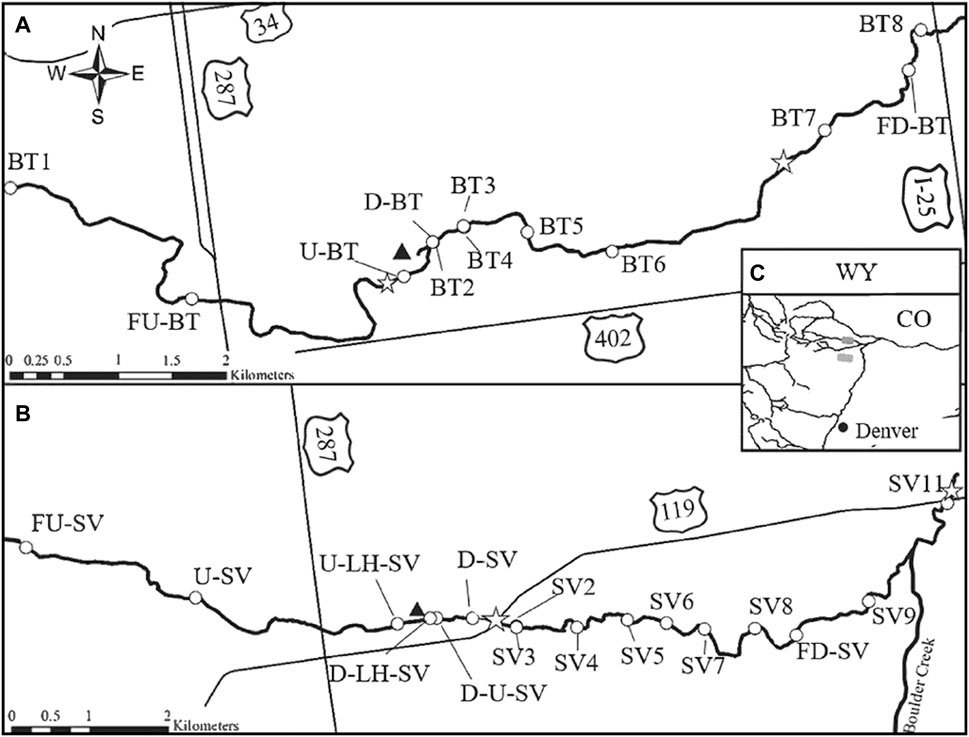
FIGURE 1. Map of temperature logger locations (circles) in the (A) Big Thompson River (BT) through Loveland (B) St. Vrain Creek (SV) through Longmont, and (C) their location relative to the South Platte River Basin on the Front Range of Colorado (grey boxes). Loveland and Longmont are 74 and 48 km northwest or Denver respectively. Lines in panel (C) show the South Platte River and its major tributaries on the Front Range of Colorado. Black triangles indicate WWTPs and white stars indicate discharge gage locations. The discharge gage used for sites upstream of the WWTP on the St. Vrain is in Hygiene, CO further upstream than the maps extent. See text for explanation of monitoring sites.
Our study area centers around the WWTP effluent inputs in the Big Thompson River and St. Vrain Creek. Our most upstream temperature monitoring sites are 6.2 and 5.9 km upstream of the WWTP on the Big Thompson River and St. Vrain respectively, while our furthest downstream sites are 6.2 and 9.1 km respectively. Left Hand Creek, a small St. Vrain tributary, flows into the St. Vrain ∼50 m upstream of the Longmont WWTP. Another St. Vrain tributary, Boulder Creek, flows into St. Vrain Creek ∼30 m upstream of our furthest downstream monitoring site in that system. No tributaries converge with the Big Thompson River through our study reach. Within our study reaches these rivers both have sand, cobble, and gravel substrate with gradual increases in the percentage of finer sediment and wider more meandering channels in the downstream direction. All Big Thompson River sites have moderate overhead cover, while St. Vrain sites have less cover overall with a few exceptions that have similar overhead cover as sites in the Big Thompson River (FU-SV, SV2, SV3, and SV4; Figure 1).
The WWTPs in both streams have similar impact on streamflow. The WWTP in Loveland, CO, (Loveland Wastewater Reclamation Facility) has the capacity to treat 38 MGD and is discharged to the Big Thompson River at an average daily flow of 13.45 MGD (City of Loveland, 2020). The WWTP in Longmont, CO (Longmont Wastewater Treatment Plant) has a capacity of 17 MGD and is discharged to St. Vrain Creek at an average daily flow of 8.0 MGD (City of Longmont, 2023). Based on nearby stream discharge gages, the WWTP effluent of the Big Thompson River and St. Vrain Creek account for 42% and 33.6% of the average daily discharge during the winter baseflow period (CDNR, 2022a; USGS, 2022a). Effluent discharges into both streams during the winter period are continual, with daily fluctuations that peak between the afternoon and midnight and are at their lowest in the early–mid-morning (Adams, unpublished data).
Hobo temperature loggers were initially placed at fish sampling locations as part of another project examining temperature impacts on the reproductive development of Johnny Darters (Adams et al., 2022). The naming of these monitoring sites is in relation to their initial position relative to the WWTP effluent, Far upstream (FU), Upstream (U), Downstream (D), and Far downstream (FD), and the river they are located, either the Big Thompson (BT) or the St. Vrain (SV). Loggers at FU–SV, FD–SV, U–BT, and D–BT were launched in the spring of 2020, FD–BT in February 2021, and at FU–BT in August of 2021 (Figure 1). All deployed temperature loggers collected water temperature every hour and data were downloaded multiple times a year. Additional effluent and water temperature data for the St. Vrain were obtained for 2020–2022 from the City of Longmont including from sites upstream of Lefthand Creek (U–LH–SV), downstream of Lefthand Creek (D–LH–SV), immediately downstream of the WWTP effluent (D–U–SV), and downstream of the WWTP effluent (D–SV; Figure 1). Winter water temperature data for D–SV were only available for Winter 2020–2021 due to logger displacement during 2021 high spring flows.
We deployed an additional 11 loggers in the St. Vrain (SV1–11) and 8 loggers in the Big Thompson (BT1–8) in late January of 2022 to increase our fine-scale spatial monitoring of stream temperature (Figure 1). Of the additional loggers deployed, one was placed upstream of the effluent on both rivers to investigate natural stream warming in the downstream direction before the impact of the warm effluent. We could only place 8 loggers in the Big Thompson due to river access restrictions. Loggers collected temperature data every 15 min and the data were downloaded in early March 2022.
Continuous discharge data were obtained from the Unitd States Geological Survey (USGS) and the Colorado Department of Natural Resources (CDNR) at sites upstream and downstream of the WWTP effluent on the Big Thompson and St. Vrain (USGS, 2022a; USGS, 2022b; CDNR, 2022a; CDNR, 2022b; CDNR, 2022c; Figure 1). Temperature monitoring sites were matched to the closest discharge gauges that also incorporated nearby sources of additional discharge. For example, all sites downstream of the effluent on the Big Thompson were assigned to discharge data collected at the “BIG THOMPSON RIVER AT HILLBOROUGH DIVERSION (BIGHILL)” to incorporate additional discharge from the WWTP effluent, despite sites D–BT and BT2 being closer to the USGS BIG THOMPSON AT LOVELAND, CO site just upstream (Figure 1). Data from USGS discharge gauges were downloaded using the dataRetrieval package in Program R (R Core Team, 2022; De Cicco et al., 2021). Discharge data were manually downloaded from the CDNR website (CDNR, 2022a; CDNR, 2022b; CDNR, 2022c).
Air temperature data were obtained for Loveland (1997–current) and Longmont (1997–current) from CoAgMet, a network of agricultural weather stations around Colorado maintained by Colorado State University (CoAgMet, 2022a; CoAgMet, 2022b). Data were downloaded from CoAgMet using the package rvest in Program R (Wickham, 2021). Water temperature monitoring sites on the Big Thompson were matched with air temperature data from Loveland, while those on the St. Vrain were matched with air temperature data from Longmont. All available discharge and air temperature records were downloaded. Only data collected during December, January, and February of the 2020–2021 and 2021–2022 Winters were used to create the model. All data were formatted, organized, and prepared for analysis using Program R.
Average daily Winter water temperatures downstream of the WWTP were analyzed using multiple linear regression with air temperature, effluent temperature, river discharge, the interaction between river discharge and effluent temperature, and a second-degree polynomial relationship with the distance from the effluent input as predictor variables. We believe the relationship with distance from the effluent is a polynomial because temperatures rapidly decline after initial effluent mixing with cool river water followed by a more gradual temperature decline further from the initial effluent input. An interaction effect between effluent temperature and river discharge was modeled because higher river discharge dilutes effluent and subsequently its thermal impact (Miara et al., 2018). We chose not to include effluent discharge in the model because it varies little through the winter period (Adams, unpublished data). Thus, the regression model used to investigate downstream winter water temperature in relation to the WWTP effluent was:
where Tw is water temperature, Ta is the air temperature (°C), D is the discharge (cfs), Te is the effluent temperature (°C) and De is the distance (m) from the WWTP effluent. Preliminary results revealed the effluent discharge did not mix fully with the stream until ∼390 m downstream of its input into the Big Thompson (BT3 and BT4; Figure 1). Because of this, we averaged the water temperatures at D–BT and BT2 for the model, which were both ∼50 m from the effluent input (Figure 1). We refer to these models for both rivers as the downstream models.
Water temperature upstream of the effluent was also analyzed using multiple linear regression with distance from the effluent, discharge, and a second–degree polynomial relationship with air temperature as predictor variables. Distance from the effluent was used in the model to account for water temperature spatial variation in the downstream direction if present. A second–degree polynomial of air temperature was used because streams typically reach an asymptote near 0°C due to freezing (Mohseni & Stefan, 1999). Thus, to model water temperature upstream of the effluent we used:
where Tw is water temperature, Ta is the air temperature (°C), D is the discharge (cfs), and De is the distance (m) from the WWTP effluent. We refer to these models for both rivers as the upstream models. Regression analyses were conducted in Program R using the lm function in base R in conjunction with the dyplr and broom packages (Wickham et al., 2021; Robinson et al., 2022).
We wanted to estimate winter water temperature downstream of the effluent input as if the effluent did not exist to understand the magnitude of effluent temperature on winter thermal regimes. Thus, we used the upstream model coefficients along with average air temperature and discharge values from the 2020–2021 and 2021–2022 winter seasons to predict unimpacted water temperatures downstream of the effluent. Discharge values used for predictions were additionally modified to exclude any inputs attributed to the effluent. For example, average discharge downstream of the WWTP was considered to be the same as upstream. One exception to this was the discharge used for predictions >9,150 m from the effluent on the St. Vrain (approximate location of confluence with Boulder Creek), which was calculated as the average measured discharge at that location subtracted from the discharge attributed to the effluent. The differences between our model predictions and our measured thermal data provided estimates of the magnitude and spatial extent of the thermal impact of the WWTP effluent.
Predicting winter thermal regimes 30 and 60 years in the future required collecting historical air temperature data from the region and estimating average effluent temperatures. The National Oceanic and Atmospheric Administration (NOAA) provided air temperature data from the U.S. Climate Divisional Dataset for Colorado’s Platte drainage from 1895 to the present day (NOAA, 2022). For our predictive model, we used the average 3-month Winter (December–February) temperature from the last 20 years for our baseline current air temperature. For our predictions of average air temperature 30 and 60 years in the future (2052 and 2082), we used the 3-month winter average air temperature trend in Colorado’s Platte drainage over the last 50 years (1972–2022). Effluent discharge temperature for winter 2020–2021 and 2021–2022 ranged between 12°C–18°C and averaged ∼14.5°C in both rivers (14.48°C on the Big Thompson and 14.62°C on the St. Vrain). For simplicity, we used 14.50°C as the effluent temperature when making our predictions. Using this and forecasted winter air temperatures, we modeled current, 2052, and 2082 winter water temperatures for both streams. We chose not to make predictions about discharge because current winter conditions are near or at base flow, discharge in these rivers is highly managed, and future conditions are uncertain.
Average winter water temperature in 2020–2021 and 2021–2022 ranged from 7.14°C to 2.96°C from 241–9,181 m downstream from the effluent on the St. Vrain and 8.04°C to 4.31°C from 52–6,185 m downstream from the effluent on the Big Thompson (Figures 2, 3). Regression analysis showed all coefficients were significant in the downstream models, suggesting air temperature, discharge, effluent temperature, and distance from the effluent were correlated with water temperature (Table 1). The effluent temperature (β3) had the greatest influence on water temperature, followed by discharge (β2), and air temperature (β1; Table 1). Only two variables, the interaction of discharge and effluent temperature (β4) and distance from the effluent (β5) had negative impacts on water temperature, though the magnitude of these effects were relatively small (Table 1). All variables except for air temperature appeared to have a greater effect on water temperature in the Big Thompson than the St. Vrain, most notably effluent temperature (2.67°C vs. 0.76°C respectively) and the second order polynomial distance from the effluent, which was an order of magnitude greater in the Big Thompson model than the St. Vrain model (Table 1). The R2 values were high for both the St. Vrain (0.79) and Big Thompson (0.76) models suggesting they fit the data well (Møller & Jennions, 2002).
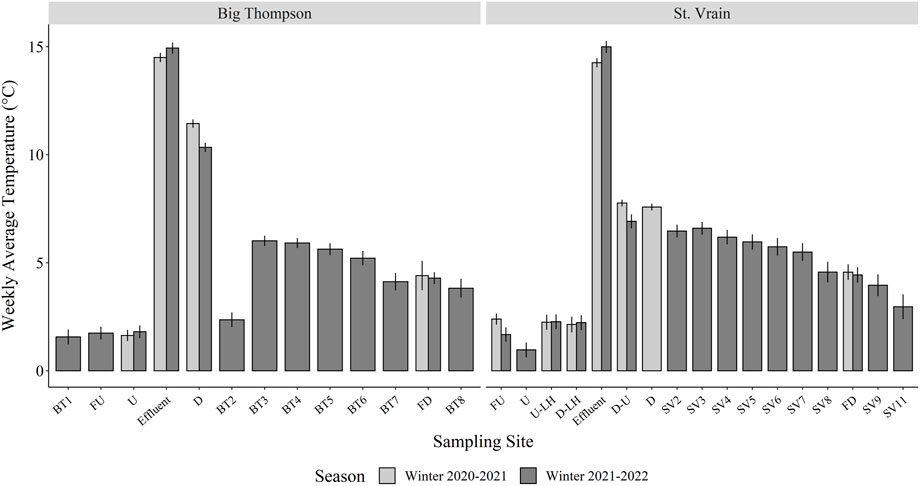
FIGURE 2. Average water temperatures at each temperature monitoring site for winter 2020–2021 and 2021–2022. BT1–BT8 and SV2–SV11 were deployed for a month in 2022 to collect more fine-scale spatial temperature data while other loggers were deployed prior to winter 2020–2021. D–SV was lost during the spring of 2021 and not replaced for the following winter. Sites are organized from upstream to downstream from left to right for each river.
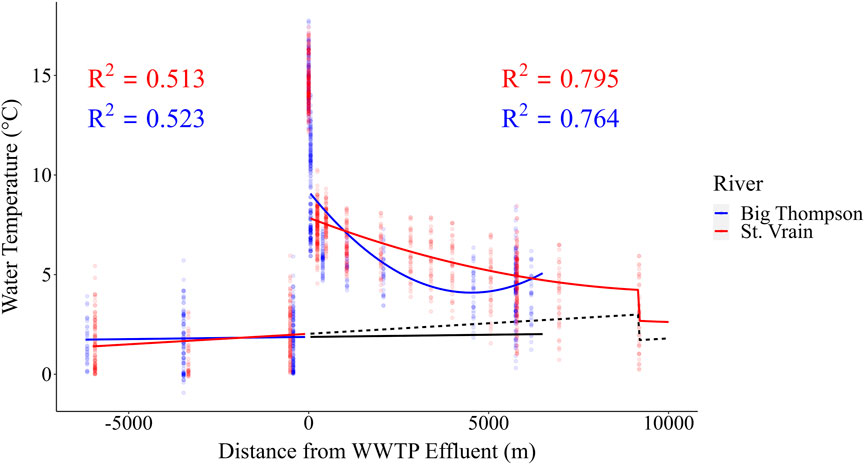
FIGURE 3. Daily average water temperatures at each monitoring site on the Big Thompson and St. Vrain for winters 2020–2021 and 2021–2022 in relation to distance from the WWTP effluent input and predicted water temperatures from the upstream and downstream models (Table 1; Table 2). Measured effluent temperatures are represented at point 0. Predictions were calculated using model coefficients along with average air temperature, discharge, and effluent temperature (14.5°C). The black lines (solid for Big Thompson and dashed for St. Vrain) show predicted daily average water temperature calculated with upstream model coefficients, average daily air temperature and average daily discharge for comparison of water temperature estimates if no effluent input was present.
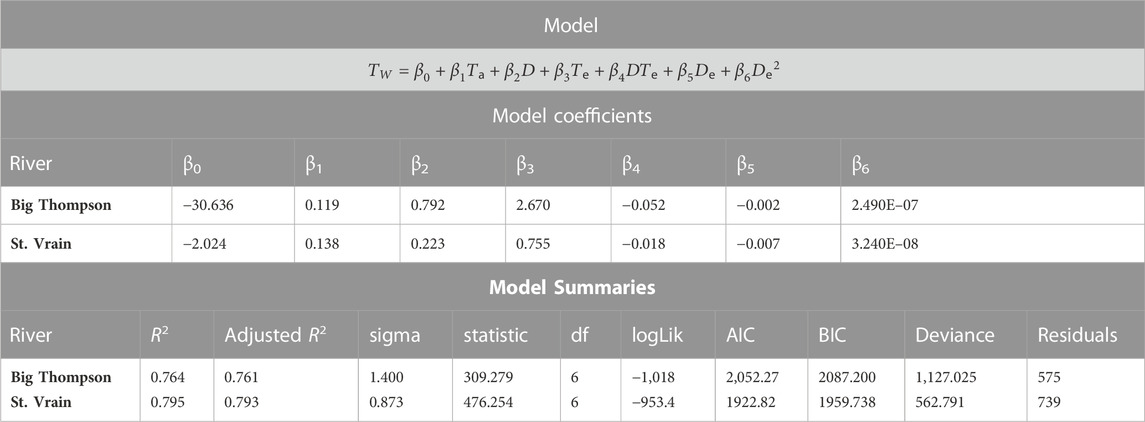
TABLE 1. Model coefficients and summaries for winter water temperature in the Big Thompson and St. Vrain downstream of the WWTP effluent. All coefficients in the models were significant predictors of water temperature (p < 0.05). Tw is water temperature, Ta is the air temperature (°C), D is the discharge (cfs), Te is the effluent temperature (°C) and De is the distance (m) from the WWTP effluent.
Upstream of the effluent, the average Winter water temperature ranged from 1.56°C–1.74°C on the Big Thompson and 0.96°C −2.26°C on the St. Vrain (Figure 2). Only FU–SV in winter 2020–2021 was significantly different and slightly higher, than other upstream sites. All other upstream sites had similar average Winter water temperatures. All upstream model coefficients were significant except distance from the effluent for the Big Thompson (β4; Table 2). This suggests that air temperature and discharge are correlated with water temperature, and on the St. Vrain, distance is also correlated with water temperature. The latter suggests a spatial relationship with St. Vrain water temperature as the river flows downstream. In the upstream models, air temperature (β1) had the greatest influence on water temperature (Table 2). The R2 values were 0.51 and 0.52 for both the St. Vrain and the Big Thompson respectively suggesting a good model fit (Møller & Jennions, 2002).

TABLE 2. Model coefficients and summaries for winter water temperature in the Big Thompson and St. Vrain upstream of the WWTP effluent. All coefficients in the models, except for the distance from the WWTP effluent coefficient (β4; in bold), were significant predictors of water temperature (p < 0.05). Tw is water temperature, Ta is the air temperature (˚C), D is the discharge (cfs), and De is the distance (m) from the WWTP effluent.
The predicted downstream unimpacted winter water temperatures were cooler than all measured average Winter water temperatures within our study reaches on the Big Thompson and the St. Vrain (Figure 4). Predicted unimpacted water temperatures at BT7 (4,578 m), FD–BT (5,755 m), and BT8 (6,185 m) were 1.97°C, 1.99°C, and 2.00°C respectively while the actual average measured temperatures were 4.12°C, 4.25°C, and 3.82°C (a difference of 2.15°C, 2.26°C, 1.82°C respectively). Predicted unimpacted water temperatures at SV8 (5,060 m), FD–SV (5,786 m), SV9 (6,959 m), and SV11 (9,181 m) were 2.56°C, 2.64°C, 2.76°C, and 1.71°C respectively while the actual average measured temperatures were 4.57°C, 4.45°C, 3.95°C, and 2.96°C (a difference of 2.01°C, 1.81°C, 1.19°C, and 1.26°C respectively; Figure 3).
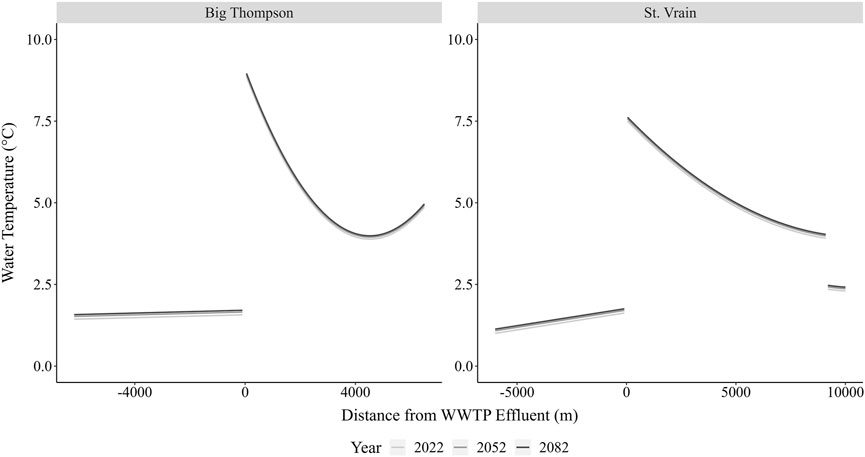
FIGURE 4. Predicted winter water temperatures in the Big Thompson and the St. Vrain under 2022, 2052, and 2082 winter air temperature conditions from coefficients in the upstream and downstream winter water temperature models (Table 1; Table 2).
The average winter air temperature from 2002 to 2022 in Colorado’s South Platte drainage was −2.67°C. The air temperature trend from 1972 to 2022 was +0.17°C/year resulting in predicted average Winter air temperatures of −2.16°C in 2052 and −1.82°C in 2082. Estimated changes in air temperature in 30 and 60 years had little influence on winter water temperature both upstream and downstream of the effluent input in our models (0.06°C–0.10°C increase; Figure 4).
Effluent temperature had a measurable effect on Winter water temperature within our Big Thompson River and St. Vrain Creek study reaches. Our models indicated that effluent temperature had the greatest effect on water temperatures downstream of the effluent compared to all other factors, including air temperature. Our models also showed that the interaction of river discharge with effluent temperature negatively influenced water temperature, suggesting that higher flows may help offset the influence of effluent temperature, though generally river discharge alone increased water temperature in the winter period. In the downstream models, the coefficient of air temperature had a comparatively small effect on water temperature, indicating that effluent temperature is of greatest concern to managing Winter stream warming downstream of effluent inputs. The effect of air temperature was greatest among coefficients in the upstream models; however, the magnitude of the effect was similar to downstream models. Distance from the effluent had a small effect, albeit significant, in all models except the upstream Big Thompson model.
We show that WWTP effluent can warm Winter stream water temperature by as much as 12°C. This temperature increase has been shown to affect the timing of fish reproduction in our study reaches (Adams et al., 2022). Laboratory studies also indicate that warming of this magnitude can substantially influence the timing of reproduction (Baum, 2021). However, by 0.5 km downstream the water temperature was about only 2°C above predicted temperatures and declining, indicating that these tributaries can recover from warming during the Winter over relatively short distances. In other effluent dominated rivers, where effluent discharge accounts for greater than 50% of baseflow, effluent likely has greater impacts on winter water temperature and has been documented to increase water temperature by 3°C–10°C as far as 27 km from the source (Kinouchi et al., 2007; Lewis and McCutchan, 2012; Graham et al., 2014). This is likely not the case in our smaller non-effluent dominated South Platte tributaries.
Air temperature is generally considered to be the most influential variable determining stream temperature (Ward, 1985) and winter air temperatures have been increasing globally (NOAA, 2022). Thus, we incorporated air temperature into our models to understand its role in winter water temperature in impacted systems. Our models revealed that downstream of the effluent input air temperature has a minimal effect in comparison to effluent temperature. This was additionally apparent in our predictions of water temperature using projected air temperatures 30 and 60 years in the future. Despite increasing winter air temperatures, the predicted changes in water temperatures increased by a maximum of only 0.06°C in 2052°C and 0.10°C in 2082. While climate change poses a serious threat to aquatic communities worldwide, warm water inputs like WWTP effluent are potentially a more serious threat to urban stream ecosystems and may affect these streams in rural areas as well. Thus, Winter thermal regimes in South Platte tributaries on the Front Range, and likely other urban streams, require prioritization to mitigate the effect of point source thermal pollutants, like WWTP effluent.
Our models suggest that predicted changes in air temperature due to climate warming will have only slight effects on winter water temperature increases in 30–60 years in Front Range South Platte streams. This conclusion is notably opposite of most water temperature models where predicted air temperature increases have significant influence on water temperature, though these models generally incorporate warmer seasons (Stefan & Sinokrot, 1993; Mohseni et al., 1998; Isaak et al., 2017). This is likely due to unimpacted streams in the Front Range of Colorado having winter water temperatures that are already near zero. Additionally, it is possible for impacted reaches to reach near freezing temperatures as effluent cools as it flows downstream (Mohseni & Stefan, 1999). Air temperature may have larger impacts on Winter thermal regimes of streams and rivers in areas with warmer winters than our study reaches. This contrasts with the impact of effluent temperature on river thermal regimes in these areas, possibly dampened due to the smaller difference in basal water temperature and effluent temperature. Increased winter air temperatures due to climate change may have the greatest impact on streams and rivers in areas that currently have average winter air temperatures near 0°C. In these areas, small increases in air temperature may prevent streams from returning to near freezing water temperatures, potentially impacting the aquatic ecosystems which evolved with this overwintering environment. Investigations on the winter thermal regime of streams in warmer climates are warranted to determine the impact of current and future predicted winter air temperatures.
When we predicted downstream winter water temperature without the influence of WWTP effluent, the predicted temperatures were slightly lower than those we measured by about 2°C approximately 0.5 km downstream of the effluent. The difference between the predicted and actual temperature declines as water moves downstream. At the furthest downstream point in our study reaches, 6.2 km from the effluent on the Big Thompson and 9.3 km on the St. Vrain, the difference between actual and predicted was 1.8°C and 1.3°C respectively. While the full impact of this relatively small thermal increase is unknown, it is known that even small increases in water temperature can have measurable effects on fish populations in all seasons (Pankurst and Munday, 2011; Heggenes et al., 2018; White et al., 2020). Warmer overwintering temperatures are known to decrease overwinter survival (Cunjak & Power, 1987) and impact the spring reproduction of some fishes (Ficke et al., 2007; Im, Kong, & Ghil, 2016), including accelerating the reproductive timing of Johnny Darter in our study reaches (Adams et al., 2022). However, most studies that investigate the impact of warm Winter water temperatures evaluate increases greater than we observed or predicted in our study system (Firkus et al., 2018; Baum, 2021). Additional studies are needed to understand how these small increases in overwinter temperature impact all local fish populations.
Predicting winter water temperatures or attempting to predict them without the influence of WWTP effluents aids in understanding and subsequently mitigating the impact of effluent temperature. However, predictions assume that the factors we included in the model will not change significantly over time. For instance, we assume that the average contribution of WWTP effluent will not increase over time and that winter air temperature will remain near freezing. Our unimpacted predictions were based on models that incorporated air temperature, discharge, and distance downstream. A more accurate model would include other natural or anthropogenic warm water sources (i.e., overland flow and tributary or groundwater inputs) that increase in the downstream direction (Nelson & Palmer, 2007; Brown et al., 2011). The rivers in our study also both pass through urban areas, a known cause of increased stream temperatures (Somers et al., 2013). Another factor specific to our study area that complicates our predictions of effluent free stream temperature is that it lies in the transition zone between cold–high–elevation–mountain and warm–open–plains reaches (Ward, 1985). The downstream reaches of our study sites may be expected to be slightly warmer than our upstream sites because they are shallow, wide-open, and low gradient, though the effect of stream morphology on temperature is not well documented in these streams. Thus, it is possible that the water temperature we measured is similar to what it might be without effluent inputs, although our models suggest otherwise. Research incorporating more comprehensive variables including land use and geomorphology may provide further insight into factors that mitigate or aggravate thermal recovery from point source pollutants like WWTP effluent.
Mitigating the impact of warm WWTP effluent on urban streams is not straightforward and will likely require situational mitigation to address unique stream characteristics. However, understanding the magnitude and extent of WWTP effluent warming is a critical first step in identifying and mitigating warming Winter water temperatures. Our models provide a fine-scale view of the magnitude and spatial extent of WWTP effluent impact on winter water temperature in South Platte tributaries that are economically important, have high fish biodiversity, and should be conserved. We believe the models presented in our study can be used to gain insight into how best to manage and conserve these smaller urban streams. Additionally, our models provide a baseline for the creation of larger models to examine the thermal impact of effluent inputs on a watershed scale that will ultimately be necessary for conserving and managing thermal effluent on a watershed scale.
The raw data supporting the conclusion of this article will be made available by the authors, without undue reservation.
Conceptualization, CA, DW, and RF; Methodology, CA and DW; Software, CA; Validation, CA; Formal analysis, CA; Investigation, CA and DW; Resources, DW and RF; Data curation, CA; writing—original draft preparation, CA; Writing—review and editing, CA, DW, and RF; Visualization, CA; supervision, DW and RF; Project administration, DW and RF; Funding acquisition, DW and RF. All authors have read and agreed to the published version of the manuscript.
This research was funded by Colorado Parks and Wildlife, Species Conservation Trust Fund Project Number SCA807.
We thank Colorado Parks and Wildlife (CPW) and the City of Longmont for providing funding and contributions to this manuscript. Jim Krick with the City of Longmont was an invaluable contact who provided us information and access to the St. Vrain throughout Longmont and a tour of their WWTP. Additionally, CPW and the Colorado Department of Public Health and the Environment (CDPHE) provided valuable discussion and field aid. Andy Treble and Mindi May of CPW provided valuable temperature logger deployment advice and aid and Dan Isaak provided critical modeling advice for which we are grateful. The City of Loveland graciously provided access to their natural areas, a tour of their WWTP, and interest in our project. We would additionally like to thank Andrew Albright and Desirray Bonsall who graciously provided us with valuable water temperature data on the St. Vrain and Big Thompson. Any use of trade, firm, or product names is for descriptive purposes only and does not imply endorsement by the U.S. Government.
The authors declare that the research was conducted in the absence of any commercial or financial relationships that could be construed as a potential conflict of interest.
All claims expressed in this article are solely those of the authors and do not necessarily represent those of their affiliated organizations, or those of the publisher, the editors and the reviewers. Any product that may be evaluated in this article, or claim that may be made by its manufacturer, is not guaranteed or endorsed by the publisher.
Adams, C. A., Winkelman, D. L., Schaffer, P. A., Villeneuve, D. L., Cavallin, J. E., Ellman, M., et al. (2022). Elevated stream temperatures below wastewater treatment plants influence reproductive development of female Johnny darter Etheostoma nigrum: A field and histologic approach. Fishes 7, 361. doi:10.3390/fishes7060361
Ahmad, S. K., Hossain, F., Holtgrieve, G. W., Pavelsky, T., and Galelli, S. (2021). Predicting the likely thermal impact of current and future dams around the world. Earth’s Future 9, e2020EF001916. doi:10.1029/2020EF001916
Baum, C. M. (2021). Temperature and winter duration requirements for reproductive success in Johnny dart etheostoma nigrum in the South Platte River Basin, Colorado. Master’s thesis. Fort Collins, Colorado: Colorado State University.
Bestgen, K. R., and Williams, M. A. (1994). Effects of fluctuating and constant temperatures on early development and survival of Colorado Squawfish. Trans. Am. Fish. Soc. 123, 574–579. doi:10.1577/1548-8659(1994)123<0574:eofact>2.3.co;2
Brett, J. R. (1956). Some principles in the thermal requirements of fishes. Q. Rev. Biol. 31, 75–87. doi:10.1086/401257
Brown, R. S., Hubert, W. A., and Daly, S. F. (2011). A primer on winter, ice, and fish: What fisheries biologists should know about winter ice processes and stream-dwelling fish. Fisheries 36, 8–26. doi:10.1577/03632415.2011.10389052
Burton, T. M., and Likens, G. E. (1973). The effect of strip-cutting on stream temperatures in the hubbard brook experimental forest, New Hampshire. BioScience 23, 433–435. doi:10.2307/1296545
Cassie, D. (2006). The thermal regime of rivers: A review. Freshw. Biol. 51, 1389–1406. doi:10.1111/j.1365-2427.2006.01597.x
CDNR (Colorado Department of Natural Resources) (2022b). Big Thompson River at hillsborough DIVERSION (bighillco). Retrieved from: https://dwr.state.co.us/tools/Stations/BIGHILCO?params=DISCHRG.
CDNR (Colorado Department of Natural Resources) (2022c). Saint vrain creek at hygeiene, CO (svchgiCO). Retrieved from: https://dwr.state.co.us/tools/Stations/SVCHGICO?params=DISCHRG.
CDNR (Colorado Department of Natural Resources) (2022a). Saint vrain creek below ken pratt blvd at longmont, CO (svclopCO). Retrieved from: https://dwr.state.co.us/tools/Stations/SVCLOPCO?params=DISCHRG.
City of Longmont (2023). Wastewater treatment plant. Retrieved from: https://www.longmontcolorado.gov/departments/departments-n-z/water/wastewater-treatment (Accessed January 11, 2023).
City of Loveland (2020). Fact sheet: Water and wastewater. Retrieved from: https://www.lovelandwaterandpower.org/home/showpublisheddocument/55144/637570947471270000 (Accessed January 11, 2023).
CoAgMet (2022a). Longmont West (LMT02) – northern water. Retrieved from: https://coagmet.colostate.edu/table/hourly/lmt02.
CoAgMet (2022b). Loveland (LOV01) – northern water. Retrieved from: https://coagmet.colostate.edu/table/hourly/lov01.
Cunjak, R. A., and Power, G. (1987). The feeding and energetics of stream-resident trout in winter. J. Fish Biol. 31, 493–511. doi:10.1111/j.1095-8649.1987.tb05254.x
Daniels, M. E., and Danner, E. M. (2020). The drivers of river temperatures below a large dam. Water Resour. Res. 56, e2019WR026751. doi:10.1029/2019WR026751
De Cicco, L. A., Hirsch, R. M., Lorenz, D., and Watkins, W. D. (2021). dataRetrieval: R packages for discovering and retrieving water data available from Federal hydrologic web services, Avaliable at: https://code.usgs.gov/water/dataRetrieval.
Farmer, T. M., Marshall, E. A., Dabrowski, K., and Ludsin, S. A. (2015). Short winters threaten temperate fish populations. Nat. Commun. 6, 7724–7810. doi:10.1038/ncomms8724
Ficke, A. D., Myrick, C. A., and Hansen, L. J. (2007). Potential impacts of global climate change on freshwater fisheries. Rev. Fish Biol. Fish. 17, 581–613. doi:10.1007/s11160-007-9059-5
Firkus, T., Rahel, F. J., Bergman, H. L., and Cherrington, B. D. (2018). Warmed winter water temperatures alter reproduction in two fish species. Environ. Manag. 61, 291–303. doi:10.1007/s00267-017-0954-9
Fraser, G. S., Bestgen, K. R., Winkelman, D. L., and Thompson, K. G. (2019). Temperature — Not flow — Predicts native fish reproduction with implications for climate change. Trans. Am. Fish. Soc. 148, 509–527. doi:10.1002/tafs.10151
Graham, J. L., Stone, M. L., Rasmussen, T. J., Foster, G. M., Poulton, B. C., Paxson, C. R., et al. (2014). Effects of wastewater effluent discharge and treatment facility upgrades on environmental and biological conditions of Indian Creek, Johnson County, Kansas, June 2004 through June 2013. Report No. 2014–5187). U.S. Geological Survey Scientific Investigations. doi:10.3133/sir20145187
Heggenes, J., Alfredsen, K., Bustos, A. A., Huusko, A., and Stickler, M. (2018). Be cool: A review of hydro-physical changes and fish responses in winter in hydropower-regulated northern streams. Environ. Biol. Fishes 101, 1–21. doi:10.1007/s10641-017-0677-z
Hester, E. T., and Doyle, M. W. (2011). Human impacts to river temperature and their effects on biological processes: A quantitative Synthesis1. J. Am. Water Resour. Assoc. 47, 571–587. doi:10.1111/j.1752-1688.2011.00525.x
Im, J., King, D., and Ghil, S. (2016). Effects of water temperature on gonad development in the cold-water fish, Kumgang fat minnow Rhynchocypris kumgangensis. Jpn. Mendel Soc. 81, 311–317. doi:10.1508/cytologia.81.311
Isaak, D. J., Wenger, S. J., Peterson, E. E., Ver Hoef, J. M., Nagel, D. E., Luce, C. H., et al. (2017). The NorWest summer stream temperature model and scenarios for the western U.S.: A crowd-sourced database and new geospatial tools foster a user community and predict broad climate warming of rivers and streams. Water Resour. Res. 53, 9181–9205. doi:10.1002/2017WR020969
Justice, C., White, S. M., McCullough, D. A., Graves, D. S., and Blanchard, M. R. (2017). Can stream and riparian restoration offset climate change impacts to salmon populations? J. Environ. Manag. 188, 212–227. doi:10.1016/j.jenvman.2016.12.005
Kinouchi, T., Yagi, H., and Miyamoto, M. (2007). Increase in stream temperature related to anthropogenic heat input from urban wastewater. J. Hydrology 335, 78–88. doi:10.1016/j.jhydrol.2006.11.002
Lewis, W. M., and McCutchan, J. H. (2012). Regulatory temperature compliance for the South Platte river downstream of the metro district R. W. Hite treatment facility (RWHTF) (report No. 326). Denver, CO: Metro Wastewater Reclamation District.
Magnuson, J. J., and DeStasio, B. T. (1997). “Thermal niche of fishes and global warming,” in Global warming: Implications for freshwater and marine fish. Editors C. M. Wood, and D. G. McDonald (Cambridge: Cambridge University Press), 377–408.
Mandeville, C. P., Rahel, F. J., Patterson, L. S., and Walters, A. W. (2019). Integrating fish assemblage data, modeled stream temperatures, and thermal tolerance metrics to develop thermal guilds for water temperature regulation: Wyoming case study. Trans. Am. Fish. Soc. 148, 739–754. doi:10.1002/tafs.10169
Miara, A., Vörösmarty, C. J., Macknick, J. E., Tidwell, V. C., Fete, B., Corsi, F., et al. (2018). Thermal pollution impacts on rivers and power supply in the Mississippi River watershed. Environ. Res. Lett. 13, 034033. doi:10.1088/1748-9326/aaac85
Mohseni, O., Stefan, H. G., and Erickson, T. R. (1998). A nonlinear regression model for weekly stream temperatures. Water Resour. Res. 34, 2685–2692. doi:10.1029/98wr01877
Mohseni, O., and Stefan, H. G. (1999). Stream temperature/air temperature relationship: A physical interpretation. J. Hydrology 218, 128–141. doi:10.1016/s0022-1694(99)00034-7
Møller, A. P., and Jennions, M. D. (2002). How much variance can be explained by ecologists and evolutionary biologists? Oecologia 132, 492–500. doi:10.1007/s00442-002-0952-2
Nelson, K., and Palmer, M. A. (2007). Stream temperature surges under urbanization and climate change: Data, models, and responses. J. Am. Water Resour. Assoc. 43, 440–452. doi:10.1111/j.1752-1688.2007.00034.x
Neumann, D. W., Rajagopalan, B., and Zagona, E. A. (2003). Regression model for daily maximum stream temperature. J. Environ. Eng. 129, 667–674. doi:10.1061/(asce)0733-9372(2003)129:7(667)
NOAA (National Oceanic Atmospheric Administration) (2022). National centers for environmental information, climate at a glance: Divisional time series. Retrieved from: https://www.ncdc.noaa.gov/cag/.
Pankhurst, N. W., and Munday, P. L. (2011). Effects of climate change on fish reproduction and early life history stages. Mar. Freshw. Res. 62, 1015–1026. doi:10.1071/mf10269
R Core Team (2022). R: A language and environment for statistical computing. Vienna: R Foundation for Statistical Computing. Available: https://www.R-project.org/.
Rice, J. S., Anderson, W. P., and Thaxton, C. S. (2011). Urbanization influences on stream temperature behavior within low-discharge headwater streams. Hydrological Res. Lett. 5, 27–31. doi:10.3178/hrl.5.27
Robinson, D., Hayes, A., and Couch, S. (2022). broom: Convert statistical objects into tidy tibbles R package version 0.7.12. Retrieved from: https://CRAN.R–project.org/package=broom.
Somers, K. A., Bernhardt, E. S., Grace, J. B., Hassett, B. A., Sudduth, E. B., Wang, S., et al. (2013). Streams in the urban heat island: Spatial and temporal variability in temperature. Freshw. Sci. 32, 309–326. doi:10.1899/12-046.1
Starzynski, D., and Lauer, T. E. (2015). How temperature affects timing and duration of yellow perch spawning in the Indiana waters of Lake Michigan. J. Freshw. Ecol. 30, 445–453. doi:10.1080/02705060.2014.988761
Stefan, H. G., and Sinokrot, B. A. (1993). Projected global climate change impact on water temperatures in five north central U.S. streams. Climactic Change 24, 353–381. doi:10.1007/bf01091855
USGS (United States Geological Survey) (2022a). Big Thompson River at LOVELAND,CO. Station id: 0674150. Retrieved from: https://waterdata.usgs.gov/monitoring–location/06741510/#parameterCode=00060&period=P7D.
USGS (United States Geological Survey) (1981a). Big Thompson River. Geographic names phase I data compilation (1976–1981) feature ID: 205019. Retrieved from: https://edits.nationalmap.gov/apps/gaz–domestic/public/search/names/95b1cb90–3593–5668–b8e5–b046b4a8f8ac/summary.
USGS (United States Geological Survey) (1981b). Saint vrain Creek. Geographical names phase I data compilation (1976–1981) feature ID: 205012. Retrieved from: https://edits.nationalmap.gov/apps/gaz–domestic/public/summary/205012.
USGS (United States Geological Survey) (2022b). ST vrain cr blw boulder cr at HWY 199 NR longmont. Station id: 06730525. Retrieved from: https://waterdata.usgs.gov/monitoring–location/06752280/#parameterCode=00060&period=P7D.
Ward, J. V. (1985). Thermal characteristics of running waters. Hydrobiologia 125, 31–46. doi:10.1007/bf00045924
White, D. P., Colombo, R. E., and Wahl, D. (2020). Persistently warmer temperatures lead to life history changes in bluegill sunfish (Lepomis macrochirus). Environ. Biol. Fishes 103, 1165–1177. doi:10.1007/s10641-020-01009-z
Wickham, H., François, R., Henry, L., and Müller, K. (2021). dplyr: A Grammar of Data Manipulation. R package version 1.0.7. Retrieved from: https://CRAN.R–project.org/package=dplyr.
Wickham, H. (2021). rvest: Easily harvest (scrape) web pages. R package version 1.0.2. Retrieved from: https://CRAN.R–project.org/package=rvest.
Keywords: winter water temperature, urban rivers, wastewater treatment effluent, South Platte river basin, temperature model
Citation: Adams CM, Winkelman DL and Fitzpatrick RM (2023) Impact of wastewater treatment plant effluent on the winter thermal regime of two urban Colorado South Platte tributaries. Front. Environ. Sci. 11:1120412. doi: 10.3389/fenvs.2023.1120412
Received: 09 December 2022; Accepted: 28 March 2023;
Published: 07 April 2023.
Edited by:
Jason Deboer, Illinois Natural History Survey, United StatesReviewed by:
Doru Stelian Banaduc, Lucian Blaga University of Sibiu, RomaniaCopyright © 2023 Adams, Winkelman and Fitzpatrick. This is an open-access article distributed under the terms of the Creative Commons Attribution License (CC BY). The use, distribution or reproduction in other forums is permitted, provided the original author(s) and the copyright owner(s) are credited and that the original publication in this journal is cited, in accordance with accepted academic practice. No use, distribution or reproduction is permitted which does not comply with these terms.
*Correspondence: Catherine M. Adams, Q2F0LmFkYW1zQGNvbG9zdGF0ZS5lZHU=
†ORCID ID: Catherine M. Adams, https://orcid.org/0000-0003-0181-0710; Dana L. Winkelman, https://orcid.org/0000-0002-5247-0114; Ryan M. Fitzpatrick, https://orcid.org/0000-0001-6962-651X
Disclaimer: All claims expressed in this article are solely those of the authors and do not necessarily represent those of their affiliated organizations, or those of the publisher, the editors and the reviewers. Any product that may be evaluated in this article or claim that may be made by its manufacturer is not guaranteed or endorsed by the publisher.
Research integrity at Frontiers
Learn more about the work of our research integrity team to safeguard the quality of each article we publish.