 Lijie Lin
 Meiyu Guo
94% of researchers rate our articles as excellent or good
Learn more about the work of our research integrity team to safeguard the quality of each article we publish.
Find out more
ORIGINAL RESEARCH article
Front. Environ. Sci., 19 January 2023
Sec. Interdisciplinary Climate Studies
Volume 11 - 2023 | https://doi.org/10.3389/fenvs.2023.1117443
This article is part of the Research TopicHydro-Climate Extremes and Natural Disasters During Global Warming: Observation, Projection, and MitigationView all 11 articles
Under the combined effects of global warming and local human activities such as urbanization, increasing populations are exposed to the threat of extreme heat events. While the effects of regional urbanization on the changes in air temperature and its extremes have been well studied, the effects on mean and extreme human perceived temperatures (HPT) are still to be explored. Based on a dynamic meteorological station classification approach, this study quantitatively assessed the impacts and relative contribution of urbanization on the mean and extreme human perceived temperatures in South China by analyzing ten different human perceived temperatures indicators and taking Guangdong Province as an example. It was found that for all human perceived temperatures indicators, the mean human perceived temperatures and the frequency of extreme human perceived temperatures events in South China notably increased from 1971 to 2020, especially in the regions with comparatively higher levels of local urbanization (e.g., the Pearl River Delta). Urbanization contributed significantly to the long-term changes in both mean and extreme human perceived temperatures in Guangdong. On average, the relative contributions of urbanization to the total increases in mean human perceived temperatures and the frequency of extreme human perceived temperatures events were 15.5% and 15.1%, respectively. These contributions vary across different human perceived temperatures indicators, and the urbanization contributions to the human perceived temperatures indicators that consider the combined effects of wind speed were even higher than those merely related to near-surface air temperature and humidity. Among different seasons, the contributions of urbanization to mean and extreme human perceived temperatures in both fall and winter were greater than that in spring and summer. The findings reported here provide scientific advice for governments’ policy-making and adaption for human-perceived thermal comfort in subtropical humid climate zones.
In the context of global climate change, air temperatures have been increasing and will continue to rise worldwide, with posing impacts on human society and the ecological environment (Sun et al., 2014; Mishra et al., 2015; Hua et al., 2021; IPCC, 2021; Tuholske et al., 2021; Wang and Yan, 2021). Accordingly, extreme heat events are becoming more frequent and intense and will exhibit a significant increase tendency in the near future (Liu et al., 2018; Perkins-Kirkpatrick and Lewis, 2020; Ning et al., 2022). With rapid economic growth and urbanization since the reform and opening up, China has become one of the most vulnerable and sensitive regions suffering from extreme heat (Lin et al., 2020; Wang et al., 2021a; Luo and Lau, 2021; Tian et al., 2021). The increasing risk of high temperature has been a growing threat to China’s social environment and ecosystem over the past half-century (Chen and Zhai, 2017; You et al., 2017).
Land use changes together with the anthropogenic release of greenhouse gases and heat during the process of urbanization have contributed to increasing the occurrence of extreme heat events in Guangdong, especially in the Pearl River Delta (PRD) (Hao et al., 2018; Lin et al., 2020). People living in urban areas are exposed to both global warming and urbanization effects, such as the Urban Heat Island (UHI), which intensifies the risk of urban residents to heat events (Oke, 1973; Oke, 1982; Kim, 1992; Li et al., 2019). Additionally, the low albedo of the urban subsurface leads to increased absorption of short-wave radiation, creating a heating effect on urban areas. Also, urban buildings increase surface roughness and frictional resistance, thus leading to lower surface wind speeds and inhibiting heat exchange at the air-land interface. The slowed wind speed hinders the exchange of heat and air emitted from the human surface, making the temperature felt by the human body higher (Wang et al., 2021b).
Compared with extensive studies on surface temperature or near-surface temperature warming, fewer studies have focused on the effects of rapid urbanization on the changes in human perceived temperature (HPT) (Liu et al., 2018; Wang et al., 2021b; Luo and Lau, 2021), which describes the joint influences of multiple surrounding atmospheric factors, including air temperature, relative humidity, and wind speed, etc. HPT is a bio-meteorological indicator that measures human comfort in different environments from a meteorological perspective based on the heat exchange between the human organism and the surrounding environment. It plays an important role in urban environmental meteorological services. However, there is still no universally accepted or unified indicator of HPT currently (Blazejczyk et al., 2012; Li et al., 2018; Zhang et al., 2022). On the one hand, previous studies on extreme high temperatures mainly focused on near-surface air temperature, such as daily maximum and minimum temperatures, yet few considered the combined effects of multiple environmental factors on HPT (Liu et al., 2018; Wang et al., 2021b). On the other hand, previous studies mostly focused on a single indicator of HPT, but there was a scarcity of cross-sectional comparisons of HPT defined by multiple methods.
With more and more people moving to urban areas, the world’s urbanization level has climbed from 36.6% in 1970% to 56.6% in 2021. It is projected to reach 60.4% in 2030 (United Nations Department of Economic Social Affairs, 2018). As the largest provincial economy in China, Guangdong Province has a high urbanization level of 74.63%. The high level of industrialization and urbanization attracts a large number of labor force extremely concentrated in Guangdong. However, it is still unclear whether and to what extent regional urbanization affects the long-term changes in HPT in Guangdong and its extremes as defined by multiple indicators. It is also unclear whether the distinctions exist in the effects of urbanization on various definitions of HPT under global warming. Therefore, it is of great significance to examine the changes in multiple HPT indicators and their extremes to understand regional climate change with urbanization effects comprehensively.
This study aims to examine the spatial and temporal changes in HPT based on multiple definitions and their extremes in South China from 1971 to 2020 by taking Guangdong Province as an example, and to quantitatively assess the effect of urbanization on the long-term changes of mean and extreme HPT. Exploring the risk of increasing HPT and its extremes under global warming and regional urbanization has great implications for governmental decision-makers and urban planners in mitigating extreme weather events and severe thermal conditions.
In southern China, Guangdong Province is characterized by a subtropical monsoon climate with long, hot, and humid summers and relatively short and cool winters. Although Guangdong accounts for only 1.87% of the country’s land area, it holds the largest provincial economy in China, contributing 10.87% of its Gross Domestic Product (GDP). In 2021, the resident population in Guangdong reached 126.84 million, accounting for 8.23% of the country’s total population. The urbanization level in Guangdong reached 74.6% in 2021, notably 87.5% in the PRD in central Guangdong. PRD gathers 53.35% of the total population of the whole province but with less than one-third of the provincial land area (National Bureau of Statistics of China, 2020; Statistics Bureau of Guangdong Province, 2020). As one of the most highly urbanized and populated provinces in China, Guangdong Province has been experiencing pronounced regional climate change extremes, resulting in severe impacts on the local human social and economic development (Luo and Lau, 2017; Lin et al., 2020).
In this study, meteorological observations were collected from the China Meteorological Data Service Center (http://data.cma.cn/). The data have been homogenized, homogeneity-checked, and widely used in climate change studies (Xu et al., 2013). To ensure time continuity and data completeness, a total of 86 meteorological observations in Guangdong from 1971 to 2020 were selected (Figure 1A).
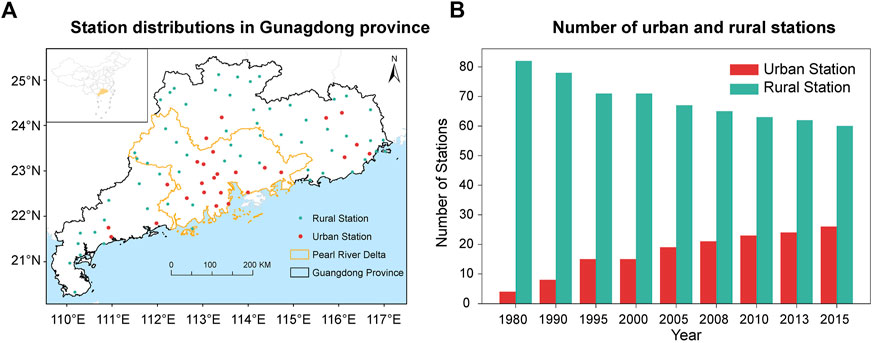
FIGURE 1. Spatial distribution and classification of urban and rural meteorological stations in Guangdong Province. (A) Spatial distribution of 86 meteorological stations in Guangdong Province, with red and cyan dots representing urban and rural stations in 2015, respectively; (B) Changes in urban and rural stations from 1980 to 2015, with red and cyan representing the number of urban and rural stations, respectively.
To classify urban and rural stations and then further quantify the urbanization effects on HTP changes, land use change data were obtained from the Resources and Environmental Science Data Center, the Chinese Academy of Sciences (http://www.resdc.cn/). This dataset contains the land use information of China in nine individual years (i.e., 1980, 1990, 1995, 2000, 2005, 2008, 2010, 2013, and 2015) at a horizontal resolution of 30 m. As suggested by previous studies (Yang et al., 2017; Luo and Lau, 2019; Tong et al., 2022), a circular buffer zone with a radius of 7 km was first established at the center of each station, and then the built-up area fraction (BAF) within each buffer zone was calculated. A larger value of BAF indicates a higher level of urbanization around the station and vice versa. A station is considered as an urban type only if its BAF within the buffer zone of the site is greater than 20%, and vice versa for a rural station (Yang et al., 2017; Luo and Lau, 2019; Tong et al., 2022). Figure 1A maps the spatial distribution of urban and rural sites in Guangdong in 2015, showing that urban stations in Guangdong are mainly distributed within the PRD region and the Chaozhou-Shantou region, suggesting the high level of urbanization in these regions. Rural stations are mainly distributed in the mountainous areas of northern Guangdong. Figure 1B depicts the time-varying classification of urban sites and rural stations from 1980 to 2015, and shows that a large number of rural stations have been transformed into urban types during the process of urbanization since the 1970s.
To ensure a comprehensive investigation, we compared the HPT changes based on ten different definitions in this study. As listed in Table 1, most of these HPT indicators are calculated from temperature (T, unit: °C) and relative humidity (RH, unit: %) or water vapor pressure (Ea), and outdoor apparent temperature (ATout), net effective temperature (NET) and wind chill temperature (WCT) consider the additional effect of wind velocity (V, unit: m/s). In this study, we first calculated daily HPT values from daily T, RH, and V values, and then aggregated daily HPT to monthly means.
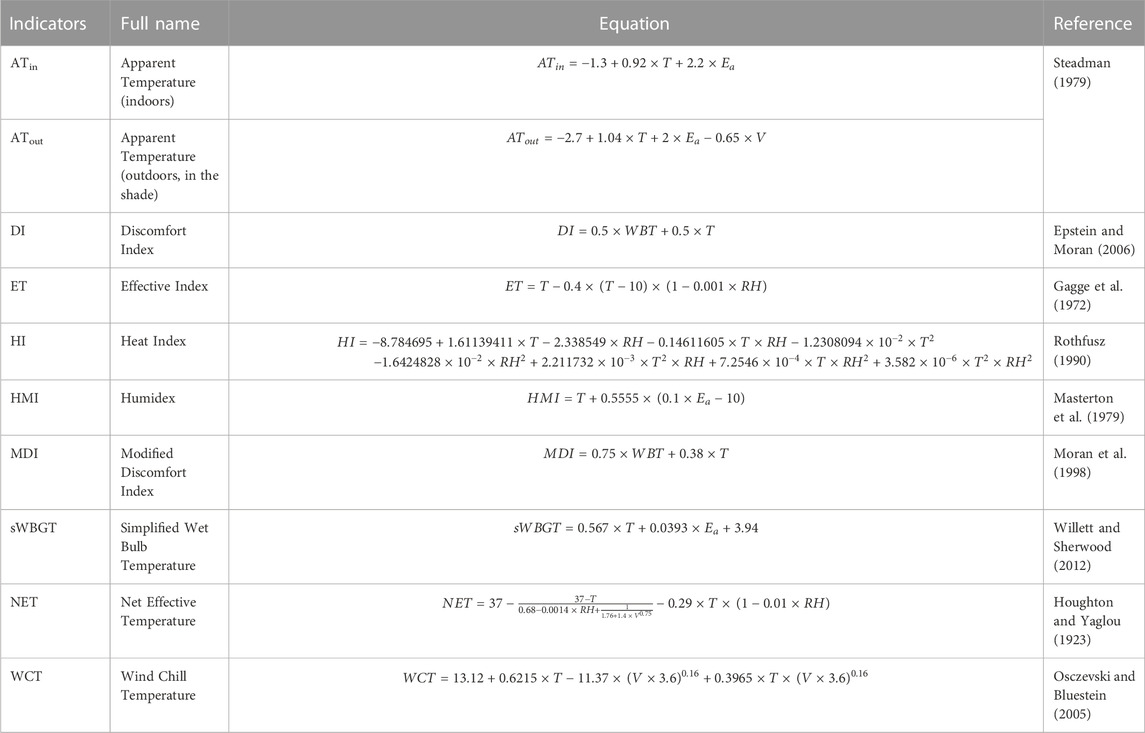
TABLE 1. Summary of multiple human perceived temperature (HPT) indicators in this study.
To exclude the possible influence of the absolute HPT magnitudes in different subregions of Guangdong, we examined the HPT anomalies in this study. The yearly and seasonal mean HPT anomalies were obtained by averaging the monthly anomalies, which were calculated by subtracting the multi-year climatological mean in the same calendar month of the reference period of 1971–2000 from the original monthly HPT value. For example, the HPT anomalies for January 1971 are equal to the HPT value in January 1971 minus the average of 30 HPT values in 30 Januaries of 1971–2000. In addition to the mean HPT, this paper also explored the long-term changes and effects of extremely high HPT events. An extremely high HPT day was defined as when daily HPT exceeds the 90th quantile of HPT over a 15-day window centering the same calendar day of the reference period (Wang et al., 2019; Wang et al., 2021b).
In this study, the urbanization effect (UE) was quantified as the difference in the long-term trends between urban and rural time series of HPT (Ren and Zhou, 2014; Sun et al., 2016; Luo and Lau, 2018):
Figure 2 shows the spatial distribution of the long-term trend in annual mean HPT based on different definitions from 1971 to 2020. Figures 2A–J represent trends of different HPT indicators in Guangdong Province, and Figure 2K represents the actual air temperature (T) for comparison. As the figure shows, all T and HPT indicators exhibit increasing trends during 1971–2020, and the warming trends of mean HPT and T in the PRD and Chaozhou-Shantou regions are generally stronger than those in other regions. Among different HPT indicators, HI and HMI have stronger increasing tendencies, while ET and DI exhibit relatively smaller increases. Also, compared with other indicators, NET and WCT that consider the combined effect of wind speed warm even faster, especially in more urbanized areas such as the PRD region. Rural areas such as northern Guangdong experienced a relatively slower warming trend in all temperature indicators. These differences suggest that urbanization may have a greater effect on wind speed-related HPT, such as NET and WCT, than other HPT indicators.
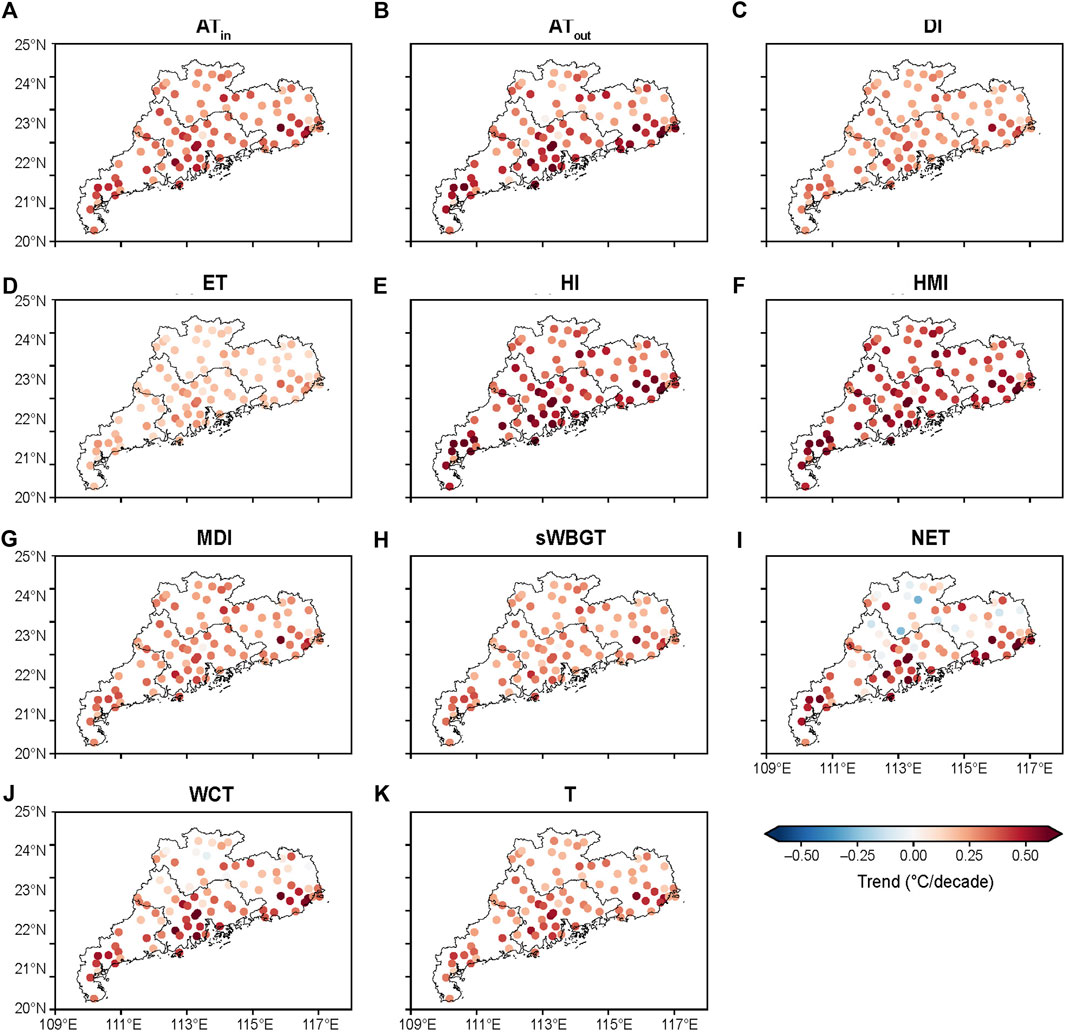
FIGURE 2. Spatial distribution of the long-term trends in annual mean HPT and actual air temperature (T) in Guangdong from 1971 to 2020: (A) ATin, (B) ATout, (C) DI, (D) ET, (E) HI, (F) HMI, (G) MDI, (H) sWBGT, (I) NET, (J) WCT, and (K) T.
Figure 3 shows the temporal changes of annual mean HPT and T in urban and rural areas of Guangdong. All temperature indicators in both rural and urban areas show significant increasing trends since the 1970s. Interestingly, the magnitudes of the increasing HPT trend in urban areas are stronger than those in rural areas, demonstrating a prominent urbanization effects on increasing temperature, either for actual air temperature or human perceived ones. Comparatively, the increasing tendencies and fluctuation of HI, HMI, and NET were much stronger than other temperature indicators, and that of ET and DI were much weaker. The differences between urban and rural series are also larger in HI, HMI, and NET.
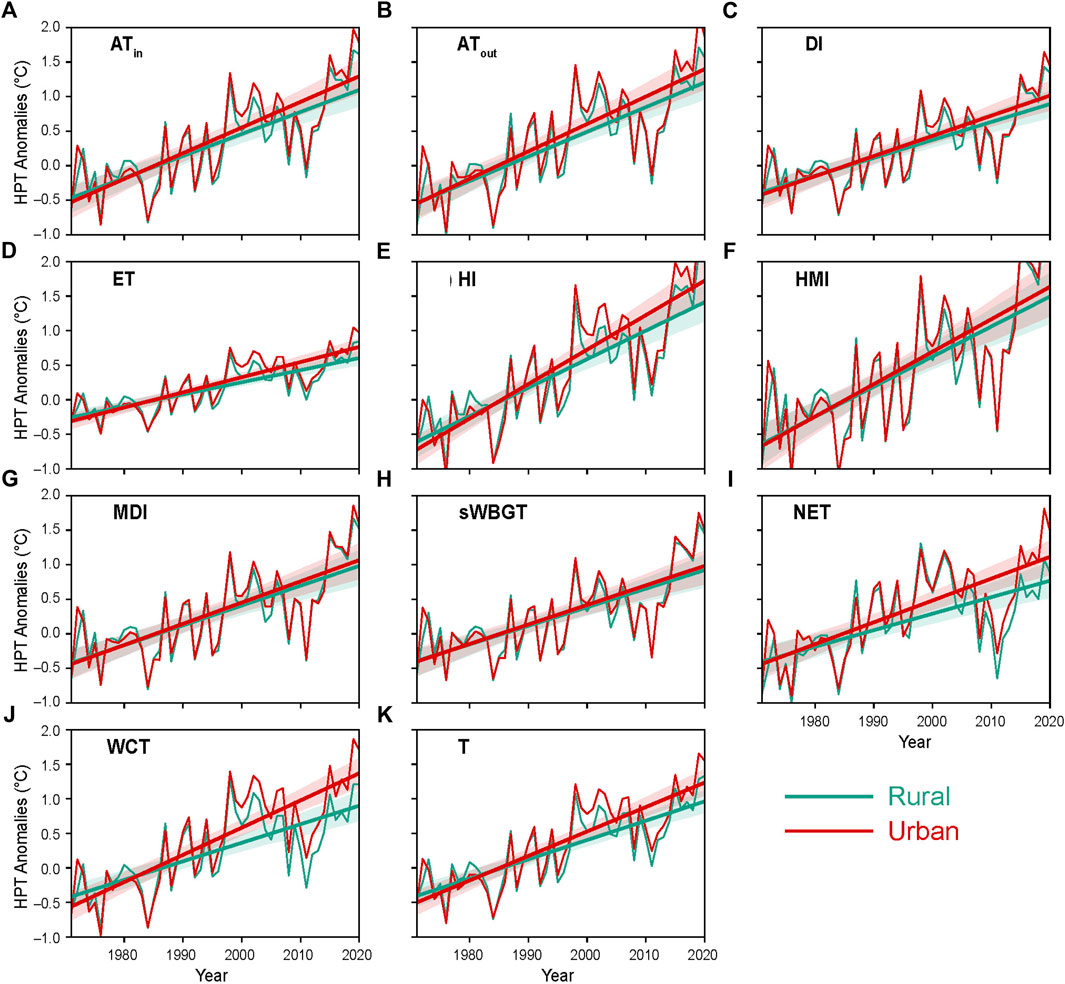
FIGURE 3. Temporal changes of the annual mean of HPT and T in the urban (red) and rural (cyan) areas of Guangdong from 1971 to 2020: (A) ATin, (B) ATout, (C) DI, (D) ET, (E) HI, (F) HMI, (G) MDI, (H) sWBGT, (I) NET, (J) WCT, and (K) T. The red and cyan straight lines indicate the linear trends of urban and rural mean series, respectively, with the shading denoting their corresponding 95% confidence intervals.
The magnitudes of the long-term trend of annual mean of multiple HPTs and T from 1971 to 2020, as well as the effect and contribution of urbanization on these trends, are depicted in Figure 4. In urban areas, HI exhibits the largest increase of 0.499°C/10a, while ET receives the smallest increase of 0.219°C/10a. In rural areas, HMI has the largest increasing trend of 0.435°C/10a, and ET gets the smallest increase of 0.175°C/10a. Clearly, both urban and rural temperatures show growing trends, and the growth is even higher in urban than rural areas. This difference characterizes the significant effects of local urbanization, which exists in all temperature indicators.
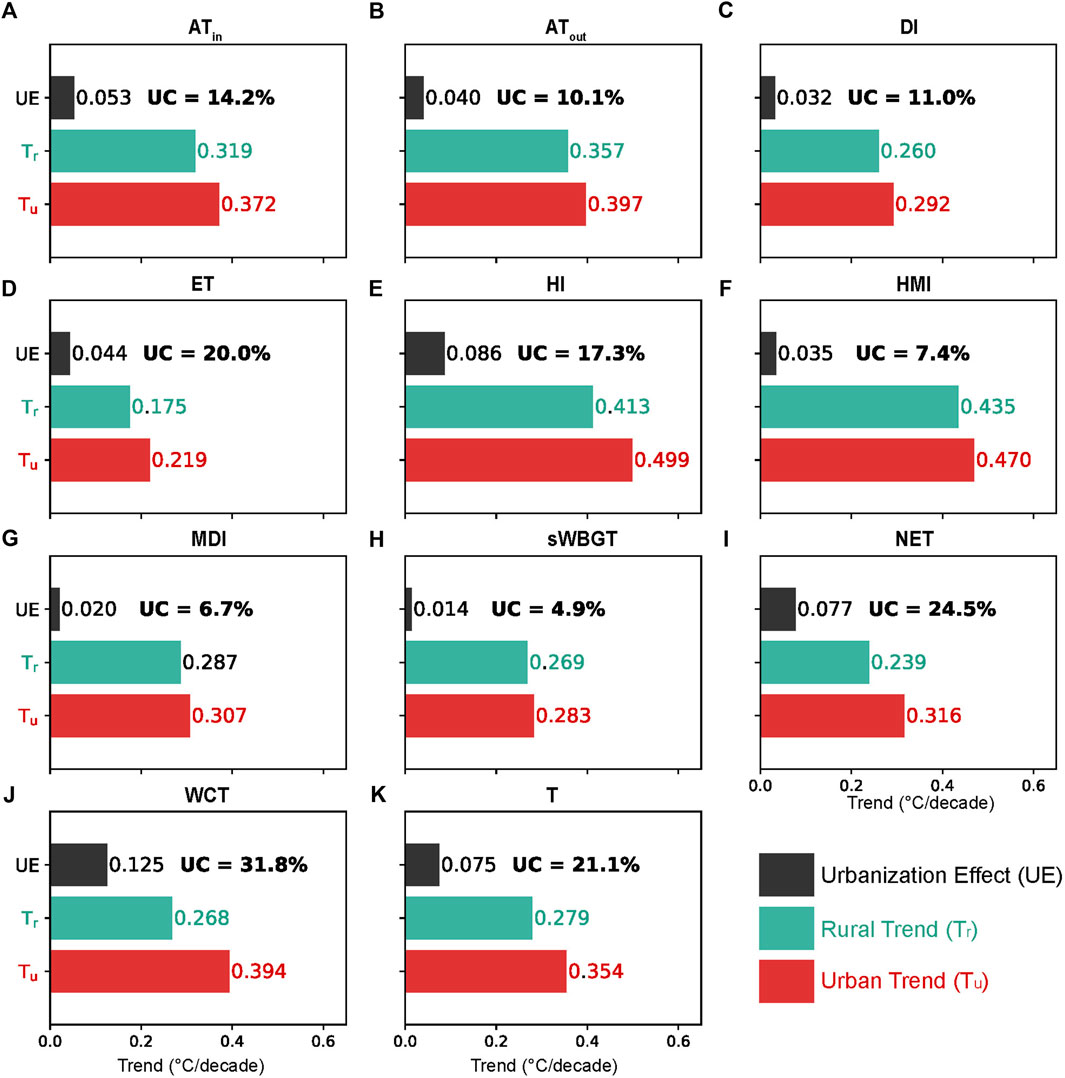
FIGURE 4. Long-term trends in urban (red) and rural (cyan) means of HPT and T in Guangdong from 1971 to 2020 and their urbanization effects (black): (A) ATin, (B) ATout, (C) DI, (D) ET, (E) HI, (F) HMI, (G) MDI, (H) sWBGT, (I) NET, (J) WCT, and (K) T. The percentage number in black color indicates the corresponding relative urbanization contribution (UC).
By averaging the relative urbanization contributions for all HPT indicates, it is estimated that regional urbanization contributed to 15.5% of the total increases in HPT since the 1970s. It is also noted that various HPT indicators receive different urbanization effects and relative contributions. For example, urbanization effects contributed to 31.8% of the total increase in WCT, while it contributed to only 4.9% of the rise in sWBGT. Also, urbanization induced a relatively larger contribution to the increases in NET by 24.5% (0.077°C/10a), which is higher than that to air temperature (0.075°C/10a, 21.1%). The larger contributions to WCT and NET are due to the fact that both indicators consider the combined effects of wind velocity, which is often slowed down by the increases in surface roughness caused by the presence of built-ups in urban areas. In particular, the higher roughness of the sub-bedding surface of the urban areas and the higher friction have a deceleration effect on wind speed; and the higher density of buildings in urban areas forms a natural baffle, which has a hindering and gridding effect on wind speed (Xu et al., 2017; Li et al., 2019; Moon et al., 2020). Note that wind speed can accelerate the airflow around the human body, speeding up the heat exchange between the human body surface and the air to play a cooling effect (Edwards et al., 2015; Roshan et al., 2020), so the wind speed in urban areas is reduced due to the impact of urbanization, which in turn leads to a higher local body temperature than the surrounding areas. The urbanization contribution to other HPT indicators without considering the effect of wind speed is generally smaller than that on air temperature, which may be related to the urban dry island (UDI) effect due to urbanization, which may reduce the atmospheric humidity and thus offsetting the HPT increases to some extent (Hao et al., 2018; Luo and Lau, 2019; Huang et al., 2022; Wang et al., 2022).
Table 2 summarizes the mean urban trend (Tu), rural trend (Tr), urbanization effect (UE), and urbanization contribution (UC) of the HPT under different seasons by averaging all HPT indicators. In this study, spring refers to March, April, and May, summer includes June, July, and August, autumn comprises September, October, and November, and winter includes December, January, and February. The HPT trend in both urban and rural areas was significantly greater than zero in all four seasons, indicating a significant increasing trend in four seasons. In all four seasons, the increases in mean HPT in urban areas were again greater than in rural areas. Seasonally, the increases in mean HPT in both urban and rural areas in the fall and winter were greater than in the spring and summer. The largest gains in both urban (0.47°C/10a) and rural mean HPT (0.39°C/10a) were observed in autumn, and the smallest increases were observed in spring, i.e., 0.29°C/10a and 0.24°C/10a for urban and rural series, respectively. Among different HPT indicators, the fastest increases in mean HPT in both urban and rural were observed in HI and HMI in all seasons, i.e., 0.62°C/10a and 0.63°C/10a for HI and HMI, respectively.

TABLE 2. Long-term trends in seasonal mean HPT in Guangdong from 1971 to 2020 and their urbanization effects and contributions. It includes the average urban trend (Tu, °C/10a), average rural trend (Tr, °C/10a), urbanization effect (UE, °C/10a), and urbanization contribution (UC, %), and the HPTmean column indicates the mean value by averaging all HPT indicators (by excluding T). All trends are significant at the 0.05 level, as evaluated by the modified non-parametric Mann-Kendall trend test.
Urbanization has a significant effect on mean HPT changes in all four seasons, with the magnitudes of 0.04°C/10a, 0.04°C/10a, 0.08°C/10a, and 0.09°C/10a and the corresponding relative contributions of 14.3%, 13.5%, 15.8%, and 22.3%, for spring, summer, autumn, and winter, respectively. It can be seen that the effects and contributions of urbanization on HPT in autumn and winter were greater than those in spring and summer. Among them, the impacts and contributions of urbanization on wind speed-related HPT indicators (i.e., NET and WCT) are higher in the spring and winter seasons than the air temperature T. The UE and UC values for WCT in all seasons are higher than in T. In spring, summer, and fall, sWBGT tends to receive the smallest relative contribution of urbanization (i.e., 3.2%, 1.8%, 7.1%, respectively), compared with other HPT indicators, whereas, in the winter season, MDI receives the smallest urbanization effect and contribution.
Compared with mean HPT, extreme HPT poses even greater threats to the human body (Wang et al., 2019; Wang et al., 2021b). This subsection defines an extremely hot HPT day (HPT90p) when the daily HPT value exceeds the 90% quantile of the reference period (recall Section 2). Figure 5 shows the spatial distribution of the long-term trend of the annual occurrence frequency of HPT90p in Guangdong Province from 1971 to 2020. It is observed in Figure 5 that the annual frequency of extremely hot days in Guangdong Province exhibited an increasing trend over the past 5 decades, and such an increase appears in all temperature indicators (including both HPT and T). Spatially, the growing frequency of HPT90p in the coastal areas (especially in densely populated and highly urbanized regions such as the Pearl River Delta and Chaozhou-Shantou) was higher than in the northern regions of mountainous Guangdong. This regional disparity indicates that urbanization may be one of the inducing factors for increasing the occurrence of HPT90p. Figure 6 shows the long-term changes in the average annual frequencies of HPT90p and T90p in both urban and rural areas of Guangdong Province. Overall, the average annual HPT90p and T90p in both rural and urban areas showed a fluctuating but upward trend, and the increases in urban areas (including both HPT90p and T90p) were greater than those in rural areas, proving that the urbanization effect contributed to the occurrence of both HPT90p and T90p.
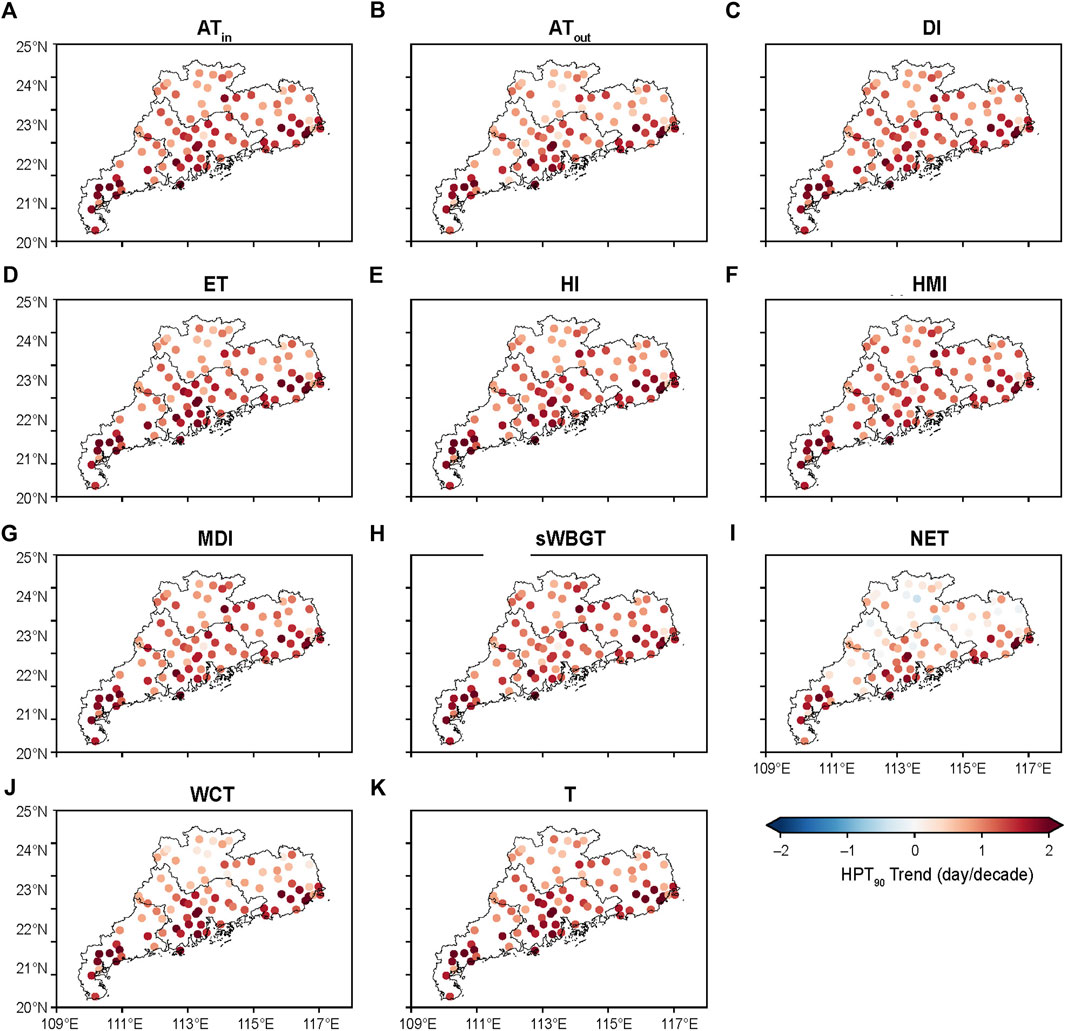
FIGURE 5. Spatial distribution of the long-term trends in annual frequencies of extremely hot HPT and T days in Guangdong from 1971 to 2020: (A) ATin, (B) ATout, (C) DI, (D) ET, (E) HI, (F) HMI, (G) MDI, (H) sWBGT, (I) NET, (J) WCT, and (K) T.
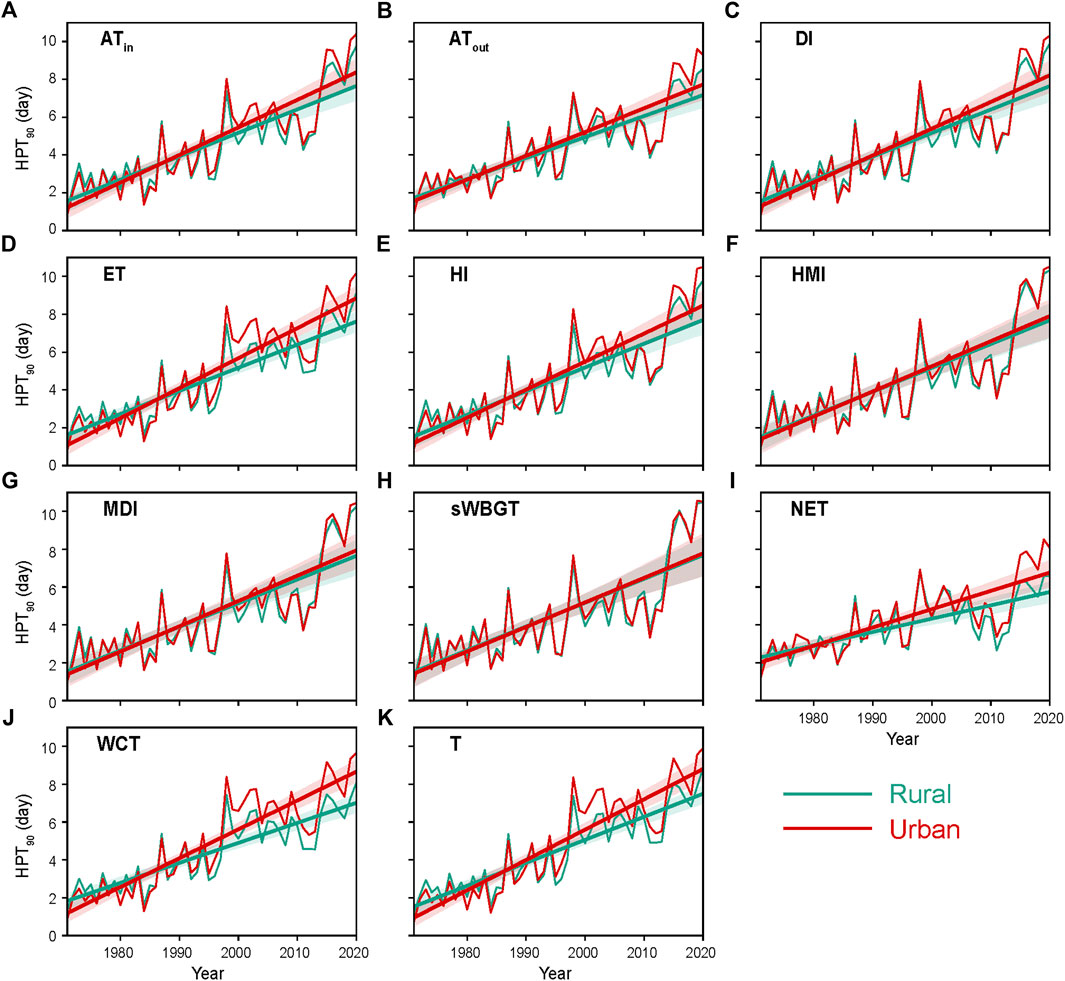
FIGURE 6. Temporal changes in urban (red) and rural (cyan) means frequencies of extremely hot HPT and T days in Guangdong from 1971 to 2020 and their urbanization effects (black): (A) ATin_90p, (B) ATout_90p, (C) DI90p, (D) ET90p, (E) HI90p, (F) HMI90p, (G) MDI90p, (H) sWBGT90p, (I) NET90p, (J) WCT90p, and (K) T90p. The red and cyan straight lines indicate the linear trends of urban and rural mean series, respectively, with the shading denoting their corresponding 95% confidence intervals.
Figure 7 shows the quantitative trends of the average frequency of HPT90p and T90 in urban and rural areas of Guangdong. The frequency trend of HPT90p in urban and rural areas exceeded 1.0 days/10a for all HPT indicators except for NET. On average, the frequencies of HPT90p were 1.37 days/10a in urban areas and 1.16 days/10a in rural areas. This difference measures an urbanization effect of 0.21 days/10a, and the relative contribution of urbanization was 15.1%. Among different indicators in urban areas, the largest increase is seen in extreme ET (1.59 days/10a), while the smallest increase is in extreme NET (0.97 days/10a). In rural areas, the largest increases are observed in extreme HMI and sWBGT (both at 1.26 days/10a), and the smallest increase is still in extreme NET (0.7 days/10a). The largest urbanization contribution to the change of HPT90p was WCT (30.7%), while the smallest contribution was in sWBGT (2.9%). Notably, the relative contribution of urbanization to the HPT90p changes in both NET and WCT is higher than the relative contribution made by the T90p changes.
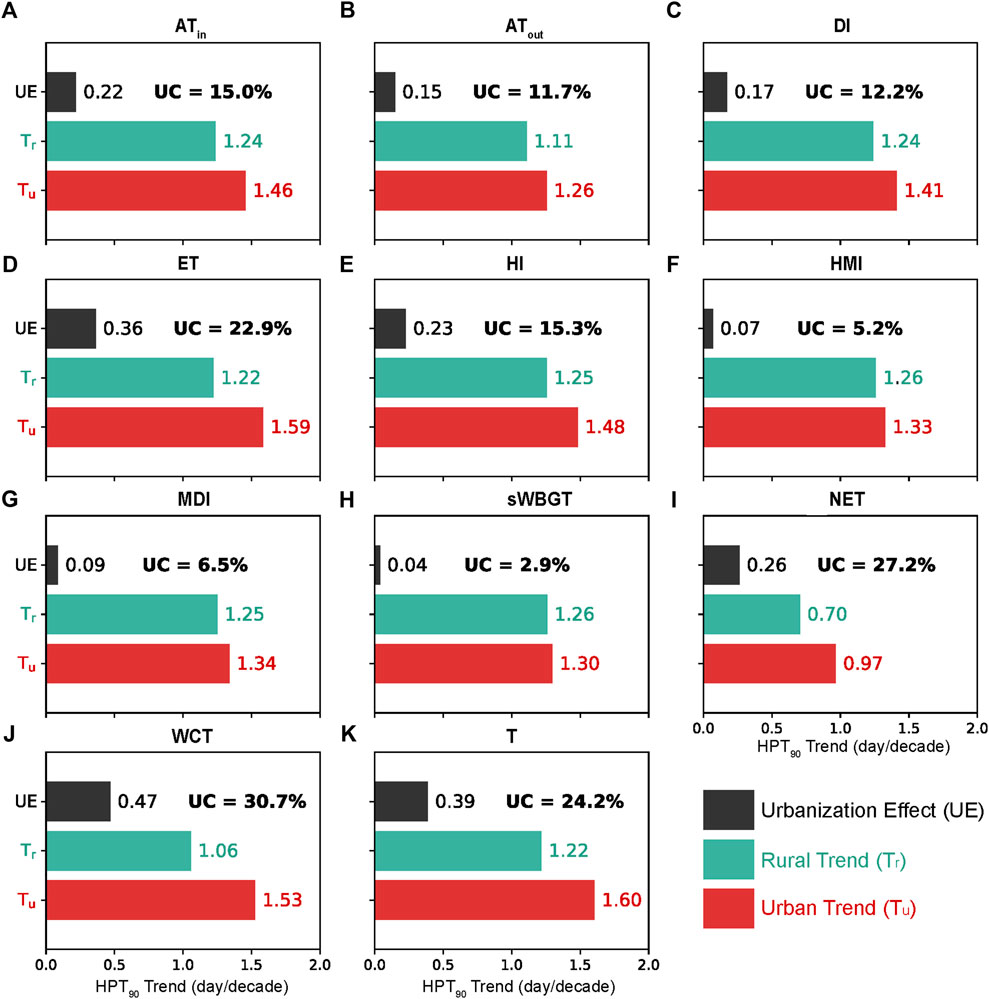
FIGURE 7. Long-term trends in urban (red) and rural (cyan) means of the annual frequency of extreme HPT and T days in Guangdong from 1971 to 2020 and their urbanization effects (black): (A) ATin_90p, (B) ATout_90p, (C) DI90p, (D) ET90p, (E) HI90p, (F) HMI90p, (G) MDI90p, (H) sWBGT90p, (I) NET90p, (J) WCT90p, and (K) T90p. The percentage number in black color indicates the corresponding relative urbanization contribution (UC).
Table 3 summarizes the quantitative long-term trends of urbanization contribution to HPT90p in Guangdong in different seasons. It is seen that the trends of the frequencies of HPT90p in both urban and rural areas are greater than 0 in all four seasons, indicating increasing risks of HPT90p throughout the calendar year. As expected, the increases in HPT90p in urban areas are even stronger than those in rural areas in all four seasons, demonstrating the remarkable role of urbanization in intensifying HPT90p risks. Seasonally, the increases in HPT90p in urban and rural areas are greater in summer and autumn than in spring and winter. On average, the summer season experienced the largest increase of HPT90p in urban (1.97 days/10a) and rural areas (1.73 days/10a), and winter witnessed the smallest increase, i.e., 0.91 days/10a and 0.69 days/10 for urban and rural areas, respectively. Urbanization had posed significant effects on increasing HPT90p in all four seasons, with the exception of extreme sWBGT days in the summer season.
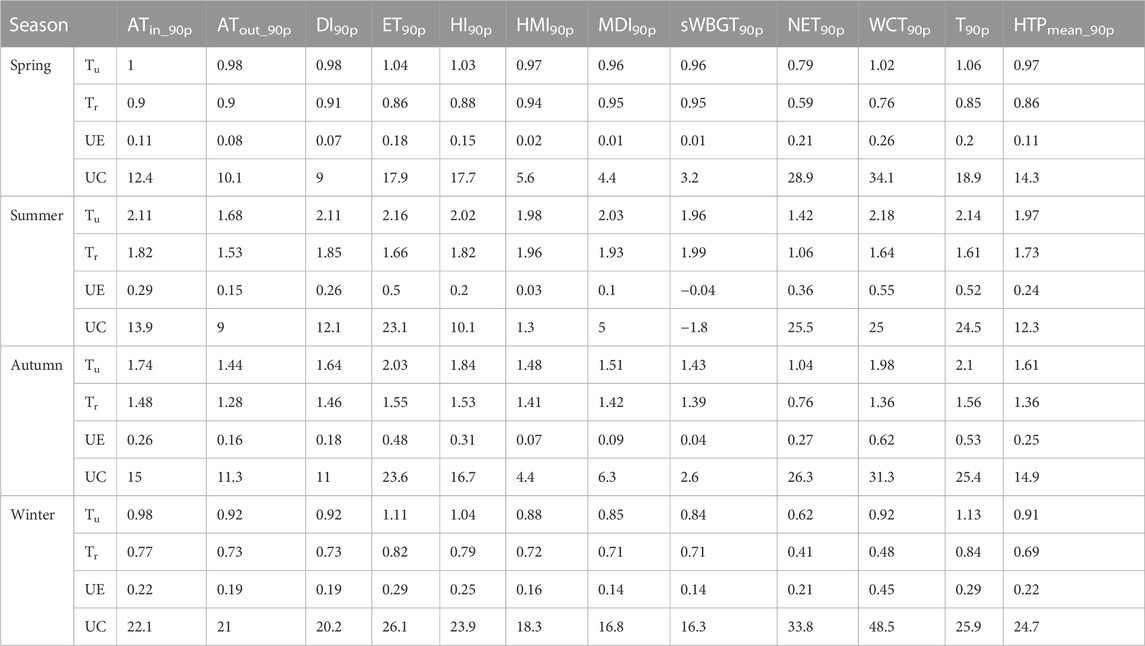
TABLE 3. As Table 2 but for the frequencies of extreme HPT and T days. All trends are significant at the 0.05 level, as evaluated by the modified non-parametric Mann-Kendall trend test.
Regarding the relative contribution of urbanization, by averaging all HPT90p indicators, the HPT90p frequency in the winter (24.7%) and autumn (14.9%) and seasons receive a larger relative urbanization contribution than spring (14.3%) and summer (12.3%). Similarly, the contribution of urbanization to the frequency of extreme events based on wind speed-related HTP indicators (i.e., NET and WCT) is notably higher than that of other HPT indicators with the consideration of wind. Among all HPT indicators, the HPT90p based on sWBGT receives the smallest contribution of urbanization in all four seasons.
Over the past half-century, China has experienced rapid urbanization, which has brought about significant changes in urban structure and land use (Fang, 2015). These changes have exerted profound effects on local a regional climate change in terms of increasing temperature and extreme heat events (Sun et al., 2014; Sun et al., 2016). However, fewer studies have fully delved into the extent to which urbanization affects human perceived temperature changes (HPT), especially the comparison of multiple HPT indicators is not yet clear. Hence, this study explored the long-term changes in mean and extreme HPT based on ten different HPT indicators in South China from 1971 to 2020 by taking Guangdong Province as an example, and further quantitatively assessed the impact of urbanization on long-term changes in mean HPT and extreme HPT on the basis of a dynamic classification of urban and rural weather stations.
The analysis results show that the mean HPT and extreme HPT (i.e., HPT90p) in Guangdong have increased significantly, with higher increases in more urbanized and populated regions such as the Pearl River Delta and Chaozhou-Shantou region. The increasing trends in annual mean HPT based on HI and HMI are ∼0.5°C/10a, which is much higher than the warming trend of air temperature (0.354°C/10a). Seasonally, the average increase in HPT was higher in autumn and winter than in spring and summer for both urban and rural areas. In contrast, the increasing trend of HPT90p was greater in summer and autumn than in spring and winter. Urbanization contributed significantly to the long-term changes in both mean HPT and HPT90p. On average, urbanization contributed to 15.5% of the increase in annual mean HPT and 15.1% of the rise in the HPT90p frequency. In addition, the relative contributions of urbanization to both mean HPT and HPT90p were larger in fall and winter than in spring and summer. Specifically, the urbanization contributions to HPT and HPT90p exceeded 20% in winter.
We also noted that the contribution of urbanization to wind speed-related HPT indicators (for both mean HPT and HPT90p), such as NET and WCT exceeds the contribution to air temperature. In contrast, the contribution to the other indicators is smaller than that to air temperature. The possible reasons are discussed as follows. Firstly, the UDI effect offsets the role of increasing air temperature in increasing HPT, thus leading to a lower contribution of urbanization to HPT than to air temperature. Secondly, the high wind resistance caused by the higher roughness of urban areas and the natural blocking effect of tall urban buildings lead to a significant decrease in wind speed in urban areas compared to the surrounding areas, which consequently leads to a rise in heat sensation in urban areas, thus leading to a stronger urbanization contribution to wind speed relative HPT indicators.
Our examinations of the spatio-temporal changes in multiple HPT indicators and their extremes, and the urbanization effects on these changes are based on the observations recorded at 86 weather stations across Guangdong. We also discussed possible reasons for these changes. It should be acknowledged that further investigations based on regional climate model simulations are also of interest and significance. Such examinations help reveal the underlying mechanism of urbanization effects on various meteorological parameters, and warrant further investigations in the future.
The original contributions presented in the study are included in the article/Supplementary Material, further inquiries can be directed to the corresponding author.
LL and MG designed the research; LL carried out the analyses and wrote the first draft of the paper; all co-authors interpreted the results and edited the paper.
This research is supported by the Guangdong Basic and Applied Basic Research Foundation (2019A1515011025) and the National Natural Science Foundation of China (42001148).
The authors are thankful to Peng Wang for collecting and preparing the data used in this research. The authors are also thankful to two reviewers who provided helpful comments on an earlier version of the paper.
The authors declare that the research was conducted in the absence of any commercial or financial relationships that could be construed as a potential conflict of interest.
All claims expressed in this article are solely those of the authors and do not necessarily represent those of their affiliated organizations, or those of the publisher, the editors and the reviewers. Any product that may be evaluated in this article, or claim that may be made by its manufacturer, is not guaranteed or endorsed by the publisher.
Blazejczyk, K., Epstein, Y., Jendritzky, G., Staiger, H., and Tinz, B. (2012). Comparison of UTCI to selected thermal indices. Int. J. Biometeor. 56, 515–535. doi:10.1007/s00484-011-0453-2
Chen, Y., and Zhai, P. (2017). Revisiting summertime hot extremes in China during 1961-2015: Overlooked compound extremes and significant changes. Geophys. Res. Lett. 44, 5096–5103. doi:10.1002/2016gl072281
Edwards, N. M., Myer, G. D., Kalkwarf, H. J., Woo, J. G., Khoury, P. R., Hewett, T. E., et al. (2015). Outdoor temperature, precipitation, and wind speed affect physical activity levels in children: A longitudinal cohort study. J. Phys. Act. Health 12, 1074–1081. doi:10.1123/jpah.2014-0125
Epstein, Y., and Moran, D. (2006). Thermal comfort and the heat stress indices. Ind. Health 44, 388–398. doi:10.2486/indhealth.44.388
Fang, C. (2015). Important progress and future direction of studies on China’s urban agglomerations. J. Geog. Sci. 25, 1003–1024. doi:10.1007/s11442-015-1216-5
Gagge, A., Stolwijk, J., and Nishi, Y. (1972). An effective temperature scale based on a simple model of human physiological regulatiry response. Memoirs Fac. Eng. Hokkaido Univ. 13, 21–36.
Hamed, K. H., and Rao, A. R. (1998). A modified Mann-Kendall trend test for autocorrelated data. J. Hydro. 204, 182–196. doi:10.1016/s0022-1694(97)00125-x
Hao, L., Huang, X., Qin, M., Liu, Y., Li, W., and Sun, G. (2018). Ecohydrological processes explain urban dry island effects in a wet region, southern China. Water Resour. Res. 54, 6757–6771. doi:10.1029/2018wr023002
Houghton, F. C., and Yaglou, C. P. (1923). Determining equal comfort lines. J. Am. Soc. Heat. Vent. Engl. 29, 165–176.
Hua, J., Zhang, X., Ren, C., Shi, Y., and Lee, T.-C. (2021). Spatiotemporal assessment of extreme heat risk for high-density cities: A case study of Hong Kong from 2006 to 2016. Sustain. Cities Soc. 64 (2021), 102507. doi:10.1016/j.scs.2020.102507
Huang, X., Hao, L., Sun, G., Yang, Z., Li, W., and Chen, D. (2022). Urbanization aggravates effects of global warming on local atmospheric drying. Geophys. Res. Lett. 49 (2022), e2021GL095709. doi:10.1029/2021gl095709
IPCC (2021). Climate change 2021: The physical science basis. Contribution of working group I to the sixth assessment report of the intergovernmental panel on climate change. Editor V. P. Masson-Delmotte, A. Zhai, S. L. Pirani, C. Connors, S. Péan, N. Bergeret al. (Cambridge, United Kingdom and New York, NY: Cambridge University Press), p. 2391. doi:10.1017/9781009157896
Kim, H. H. (1992). Urban heat island. Int. J. Remote Sens. 13, 2319–2336. doi:10.1080/01431169208904271
Li, J., Chen, Y. D., Gan, T. Y., and Lau, N.-C. (2018). Elevated increases in human-perceived temperature under climate warming. Nat. Clim. Change 8, 43–47. doi:10.1038/s41558-017-0036-2
Li, D., Liao, W., Rigden, A. J., Liu, X., Wang, D., Malyshev, S., et al. (2019). Urban heat island: Aerodynamics or imperviousness? Sci. Adv. 5, eaau4299. doi:10.1126/sciadv.aau4299
Lin, L., Chan, T. O., Ge, E., Wang, X., Zhao, Y., Yang, Y., et al. (2020). Effects of urban land expansion on decreasing atmospheric moisture in Guangdong, South China. Urban Clim. 32, 100626. doi:10.1016/j.uclim.2020.100626
Liu, X., Tang, Q., Zhang, X., and Sun, S. (2018). Projected changes in extreme high temperature and heat stress in China. J. Meteorological Res. 32, 351–366. doi:10.1007/s13351-018-7120-z
Luo, M., and Lau, N.-C. (2017). Heat waves in southern China: Synoptic behavior, long-term change, and urbanization effects. J. Clim. 30, 703–720. doi:10.1175/jcli-d-16-0269.1
Luo, M., and Lau, N. C. (2018). Increasing heat stress in urban areas of eastern China: Acceleration by urbanization. Geophys. Res. Lett. 45, 13060–13069. doi:10.1029/2018gl080306
Luo, M., and Lau, N. C. (2019). Urban expansion and drying climate in an urban agglomeration of East China. Geophys. Res. Lett. 46, 6868–6877. doi:10.1029/2019gl082736
Luo, M., and Lau, N.-C. (2021). Increasing human-perceived heat stress risks exacerbated by urbanization in China: A comparative study based on multiple metrics. Earth's Future 9, e2020EF001848. doi:10.1029/2020ef001848
Masterton, J. M., Service, C. A. E., Richardson, F. A., and Canada, C. E. (1979). Humidex: A method of quantifying human discomfort due to excessive heat and humidity. Downsview, Ontario: Environment Canada, Atmospheric Environment.
Mishra, V., Ganguly, A. R., Nijssen, B., and Lettenmaier, D. P. (2015). Changes in observed climate extremes in global urban areas. Environ. Res. Lett. 10, 024005. doi:10.1088/1748-9326/10/2/024005
Moon, M., Li, D., Liao, W., Rigden, A. J., and Friedl, M. A. (2020). Modification of surface energy balance during springtime: The relative importance of biophysical and meteorological changes. Agric. For. Meteorology 284, 107905. doi:10.1016/j.agrformet.2020.107905
Moran, D., Shapiro, Y., Epstein, Y., Matthew, W., and Pandolf, K. (1998). A modified discomfort index (MDI) as an alternative to the wet bulb globe temperature (WBGT). Editor J. A. Hodgdon, J. H. Heaney, and M. J. Buono San Diego, CA: Environmental Ergonomics VIII, 77–80.
National Bureau of Statistics of China (2020). China statistical yearbook 2020. Beijing, China Statistics Press.
Ning, G., Luo, M., Zhang, W., Liu, Z., Wang, S., and Gao, T. (2022). Rising risks of compound extreme heat-precipitation events in China. Int. J. Climatol. 42, 5785–5795. doi:10.1002/joc.7561
Oke, T. R. (1973). City size and the urban heat island. Atmos. Environ. 7, 769–779. doi:10.1016/0004-6981(73)90140-6
Oke, T. R. (1982). The energetic basis of the urban heat island. Q. J. R. Meteorological Soc. 108, 1–24. doi:10.1002/qj.49710845502
Osczevski, R., and Bluestein, M. (2005). The new wind chill equivalent temperature chart. Bull. Amer. Meteor. Soc. 86, 1453–1458. doi:10.1175/bams-86-10-1453
Perkins-Kirkpatrick, S. E., and Lewis, S. C. (2020). Increasing trends in regional heatwaves. Nat. Commun. 11, 3357. doi:10.1038/s41467-020-16970-7
Ren, G., and Zhou, Y. (2014). Urbanization effect on trends of extreme temperature indices of national stations over mainland China, 1961–2008. J. Clim. 27, 2340–2360. doi:10.1175/jcli-d-13-00393.1
Roshan, G., Moghbel, M., and Attia, S. (2020). Evaluating the wind cooling potential on outdoor thermal comfort in selected Iranian climate types. J. Therm. Biol. 92, 102660. doi:10.1016/j.jtherbio.2020.102660
Rothfusz, L. P. (1990). The heat index equation (or, more than you ever wanted to know about heat index). Fort Worth, TX: National Oceanic and Atmospheric Administration, National Weather Service, Office of Meteorology. SR 90-23.
Statistics Bureau of Guangdong Province (2020). Guangdong statistical yearbook 2020. Beijing, China: Statistics Press.
Steadman, R. G. (1979). The assessment of sultriness. Part I: A temperature-humidity index based on human physiology and clothing science. J. Appl. Meteorology Climatol. 18, 861–873. doi:10.1175/1520-0450(1979)018<0861:taospi>2.0.co;2
Sun, Y., Zhang, X., Zwiers, F. W., Song, L., Wan, H., Hu, T., et al. (2014). Rapid increase in the risk of extreme summer heat in Eastern China. Nat. Clim. Change 4, 1082–1085. doi:10.1038/nclimate2410
Sun, Y., Zhang, X., Ren, G., Zwiers, F. W., and Hu, T. (2016). Contribution of urbanization to warming in China. Nat. Clim. Change 6, 706–709. doi:10.1038/nclimate2956
Tian, H., Zhou, Y., Wang, Z., Huang, X., Ge, E., Wu, S., et al. (2021). Effects of high-frequency temperature variabilities on the morbidity of chronic obstructive pulmonary disease: Evidence in 21 cities of Guangdong, South China. Environ. Res. 201, 111544. doi:10.1016/j.envres.2021.111544
Tong, X., Wang, P., Wu, S., and Luo, M. (2022). Urbanization effects on high-frequency temperature variability over South China. Urban Clim. 42 (2022), 101092. doi:10.1016/j.uclim.2022.101092
Tuholske, C., Caylor, K., Funk, C., Verdin, A., Sweeney, S., Grace, K., et al. (2021). Global urban population exposure to extreme heat. Proc. Natl. Acad. Sci. 118, e2024792118. doi:10.1073/pnas.2024792118
United Nations Department of Economic Social Affairs (2018). World urbanization prospects. The 2018 revision, highlights. New York, NY: United Nations Department of Economic Social Affairs.
Wang, J., and Yan, Z. W. (2021). Rapid rises in the magnitude and risk of extreme regional heat wave events in China. Weather Clim. Extrem. 34, 100379. doi:10.1016/j.wace.2021.100379
Wang, Y., Chen, L., Song, Z., Huang, Z., Ge, E., Lin, L., et al. (2019). Human-perceived temperature changes over South China: Long-term trends and urbanization effects. Atmos. Res. 215, 116–127. doi:10.1016/j.atmosres.2018.09.006
Wang, J., Chen, Y., Liao, W., He, G., Tett, S. F. B., Yan, Z., et al. (2021a). Anthropogenic emissions and urbanization increase risk of compound hot extremes in cities. Nat. Clim. Change 11, 1084–1089. doi:10.1038/s41558-021-01196-2
Wang, P., Luo, M., Liao, W., Xu, Y., Wu, S., Tong, X., et al. (2021b). Urbanization contribution to human perceived temperature changes in major urban agglomerations of China. Urban Clim. 38, 100910. doi:10.1016/j.uclim.2021.100910
Wang, P., Tong, X., Qiu, J., Chen, Y., Wu, S., Chan, T. O., et al. (2022). Amplification effect of urbanization on atmospheric aridity over China under past global warming. Earth's Future 10, e2021EF002335. doi:10.1029/2021ef002335
Willett, K. M., and Sherwood, S. (2012). Exceedance of heat index thresholds for 15 regions under a warming climate using the wet-bulb globe temperature. Int. J. Climatol. 32, 161–177. doi:10.1002/joc.2257
Xu, W., Li, Q., Wang, X. L., Yang, S., Cao, L., and Feng, Y. (2013). Homogenization of Chinese daily surface air temperatures and analysis of trends in the extreme temperature indices. J. Geophys. Res. Amos. 118, 9708–9720. doi:10.1002/jgrd.50791
Xu, Y., Ren, C., Ma, P., Ho, J., Wang, W., Lau, K. K. L., et al. (2017). Urban morphology detection and computation for urban climate research. Landsc. Urb. Plan. 167, 212–224. doi:10.1016/j.landurbplan.2017.06.018
Yang, X., Ruby Leung, L., Zhao, N., Zhao, C., Qian, Y., Hu, K., et al. (2017). Contribution of urbanization to the increase of extreme heat events in an urban agglomeration in east China. Geophys. Res. Lett. 44, 6940–6950. doi:10.1002/2017gl074084
You, Q., Jiang, Z., Kong, L., Wu, Z., Bao, Y., Kang, S., et al. (2017). A comparison of heat wave climatologies and trends in China based on multiple definitions. Clim. Dyn. 48, 3975–3989. doi:10.1007/s00382-016-3315-0
Keywords: urbanization effects, extreme weather events, South China, compound heat-humidity extremes, human perceived temperature
Citation: Lin L and Guo M (2023) Effects of urbanization on multiple human perceived temperatures in South China. Front. Environ. Sci. 11:1117443. doi: 10.3389/fenvs.2023.1117443
Received: 06 December 2022; Accepted: 06 January 2023;
Published: 19 January 2023.
Edited by:
Zhen Liu, Institute for Basic Science, Republic of KoreaCopyright © 2023 Lin and Guo. This is an open-access article distributed under the terms of the Creative Commons Attribution License (CC BY). The use, distribution or reproduction in other forums is permitted, provided the original author(s) and the copyright owner(s) are credited and that the original publication in this journal is cited, in accordance with accepted academic practice. No use, distribution or reproduction is permitted which does not comply with these terms.
*Correspondence: Meiyu Guo, bWVpeXVndW9AaGtidS5lZHUuaGs=
Disclaimer: All claims expressed in this article are solely those of the authors and do not necessarily represent those of their affiliated organizations, or those of the publisher, the editors and the reviewers. Any product that may be evaluated in this article or claim that may be made by its manufacturer is not guaranteed or endorsed by the publisher.
Research integrity at Frontiers
Learn more about the work of our research integrity team to safeguard the quality of each article we publish.