 Workiyie Worie Assefa
 Belachew Getnet Eneyew
 Ayalew Wondie3
- 1Department of Biology and Blue Nile Water Institute, School of Fisheries and Wildlife, Bahir Dar University, Bahir Dar, Ethiopia
- 2Faculty of Social Science and Blue Nile Water Institute, Bahir Dar University, Bahir Dar, Ethiopia
- 3School of Fisheries and Wildlife, and Lake Tana and Other Water Bodies Management Agency, Bahir Dar University, Bahir Dar, Ethiopia
Developing multi-metric indices (MMIs) as a tool for inland water ecosystem assessment has attracted the attention of the global scientific community. The number of studies, which developed macroinvertebrate-based multi-metric indices for wetlands, however, was very limited. Thus, more work is needed to refine and implement it depending on the ecological contexts of wetlands. On top of this, we developed multi-metric indices based on macroinvertebrate assemblages that could be used for the ecological health assessment of wetlands that are impacted by agricultural activities in North-western Ethiopia. About 20 sampling sites were established in four wetlands along the disturbance gradient to take water and macroinvertebrates samples. The reference sites, which were least disturbed by human intervention, were established for the construction of multi-metric indices. Six core metrics were selected for the development of the final multi-metric indices from fifty-six potential metrics of macroinvertebrate assemblages after passing through sensitivity and statistical tests. The findings demonstrated all reference sites had good or high ecological conditions. On the contrary, the ecological statuses of nearly 70% of the impaired sites were found to be in bad to poor conditions. A significant distinction between reference and impaired sites suggested our index ability to identify the gradient variation in the ecological condition of wetlands. A strong negative relationship of the multi-metric indices model with most of the physicochemical variables and all human disturbance factors also suggested the appropriateness of the developed index in informing the ecological status of wetlands. Thus, we believe that our multi-metric indices could be a useful biomonitoring tool for the assessment and monitoring of wetland ecological conditions in predominantly agricultural landscapes in the Upper Blue Nile basin and beyond.
1 Introduction
A wetland is a concept that is defined differently by various authors. In other words, there is no universal definition of wetlands in which authors have reached a consensus. In spite of differences, most authors agreed that wetlands are the ecosystems that have either seasonal or permanent water, hydric soils, and hydrophytic vegetation. Because of their unique characteristics, wetlands are renderring a wide range of ecosystem services that contribute to human wellbeing. Despite providing such a wide variety of services, they are severely threatened ecosystems on our planet by anthropogenic activities (MEA, 2005; Kingsford et al., 2016) that lead to major hydrologic alterations, loss of biodiversity and ecological functions (MEA, 2005; Zedler and Kercher, 2005). Globally, 69%–75% of inland wetlands had been lost in the 20th century (Davidson, 2014) and more than 1/3rd of global wetlands have been lost in the two decades of the 21st century. In order to reverse an enormous loss of wetlands, governments in many countries have committed themselves to promote sustainable wetland management in their territory since the Ramsar Convention (Gardner and Davidson, 2011). The growing acceptance of sustainable wetland management as an overarching guiding principle has stimulated the demand for information on the ecological health status of wetlands and their threats (Jørgensen, 2005). Various ecological indicators have, thus, been developed to assess the ecological health of aquatic ecosystems (Jørgensen, 2010). Bioassessment methods are among the ecological health assessment indicators that have been developed for aquatic ecosystems (Karr and Chu., 1999; Bonada et al., 2006). Multi-metric indices (MMIs) are among the bioassessment methods that have been widely applied for the assessment of the ecological condition of the inland water ecosystem (Karr, 1981; Kuehne et al., 2017; Martins et al., 2020) since the early 1980s. MMIs are developed based on individual metrics such as taxa richness, diversity measures, the proportion of sensitive and tolerant species, and trophic structure. These metrics are able to reflect various dimensions of the environmental conditions and characteristics of the community (Karr and Chu, 2000).
In spite of missing the biological information during the aggregation of metrics (Suter, 1993), MMIs development is more advantageous than other single-taxon metrics like species richness and diversity indices (Karr and Chu, 1999; Ruaro et al., 2020) because of their flexibility or adaptability to various local conditions (Gabriels et al., 2010; Nguyen et al., 2014). Their ability to reflect human impacts on aquatic ecosystems by integrating multiple variables into a single value (Karr and Chu, 1999) and its efficiency of distinguishing the cumulative and synergistic impacts of water pollution, hydrological alteration, and physical habitat degradation (Karr, 1981; Lunde and Resh, 2012; Karr et al., 2022) have also made MMIs more preferable to single taxa metrics.
Fish communities were used as bioindicators in the early periods of multi-metric index development. Later, macroinvertebrates have, however, been widely used to develop the MMIs for aquatic ecosystems’ ecological health assessment (Plafkin et al., 1989; Barbour et al., 1992; Kerans and Karr, 1994; Karr and Chu, 2000; Ruaro and Gubiani, 2013) due to their ability to indicate all kinds of anthropogenic disturbances (Karr and Chu, 1999), their response to a broad range of environmental conditions (Bonada et al., 2006; Mereta et al., 2013) and their abundance in aquatic ecosystems (Bonada et al., 2006).
As in other countries of the world, rivers and wetlands ecological assessments have been done in Ethiopia (Assefa et al., 2020; Fentaw et al., 2022). Most of these assessment studies were mainly focused on the water quality of rivers and wetlands. Physicochemical parameters have been used by most of studies as important indicators of the water quality of rivers and wetlands even though they could not properly reflect the conditions of fresh water ecosystems (Rosenberg and Resh, 1993). Rosenberg and Resh (1993) stated that physicochemical variables give information about only the situation of water at the time of measurement. Due to the pitfalls of physicochemical parameters in demonstrating the ecological conditions of freshwater ecosystems including wetlands, the use of biotic indices has recently increased in Ethiopia (Assefa et al., 2020). Most of the bioindicators, however, were a single metric biotic approach (e.g., Getachew et al., 2012; Beneberu et al., 2014; Gezie et al., 2017; Desalegne, 2018). The use of MMIs for wetland ecological health assessment has gained limited attention. Besides, multi-metrics indices that have been developed in Ethiopia are skewed in riverine systems (Lakew and Moog, 2015; Moges et al., 2016; Alemneh et al., 2019; Zewudu et al., 2022). Only a few studies developed MMIs based on macroinvertebrates in wetland ecosystems (e.g., Yimer and Mengistou, 2010; Mereta et al., 2013).
ECCC (Environment and Climate Change Canada) (2018) Boulton et al. (2008), Pearson and Boyero (2009) argued that metrics and indices that are developed for riverine ecosystems may not be directly used for wetlands due to the variation of macroinvertebrate assemblages and the disparity of dominant taxa between rivers and wetlands. Thus, the local-based multi-metric index development is important (Chessman and McEvoy, 1997). According to Martins et al. (2020), MMIs are more accurately assess ecological conditions in the areas where they are developed. Taking this into account, the present study aimed to develop a new multi-metric index based on macroinvertebrate assemblages that were sensitive to the impacts of agricultural activity. Developing MMIs is very important to understand the impact of human activities on the ecological conditions of the studied wetlands and then to take wetland conservation or management measures in the Fetam River Watershed of Upper Blue Nile. Besides, it will be vital in developing methodological guidance for the wider application of biomonitoring programs at the national level.
2 Materials and methods
2.1 Study area
This study was conducted in four wetlands (Chakun, Denbun, Kotlan and Bergiz) located in Bure and Wonberma Woredas, Amhara National Regional State, Ethiopia. All of them are belonging to Fetam River watershed, lying between 10°57 ʹ17 ʹto 11°03 ʹ05 ʹNorth and longitude of 36°39 ʹ09″ to 36°48 ʹ25” East (Figure 1). The area of these wetlands varied from 149 to 1,602 ha and their average elevation ranges from 2020 to 2047 m above sea level. The major soil types of the study wetlands’ watersheds include Alisols, Nitosols, Vertisols and Leptosols. Typha Latifolia and Cyprus Latifolious are dominant types of macrophytes in both studied wetlands. Juncus and Persicaria species are also covered significant area of Bergez and Kotlan wetlands.
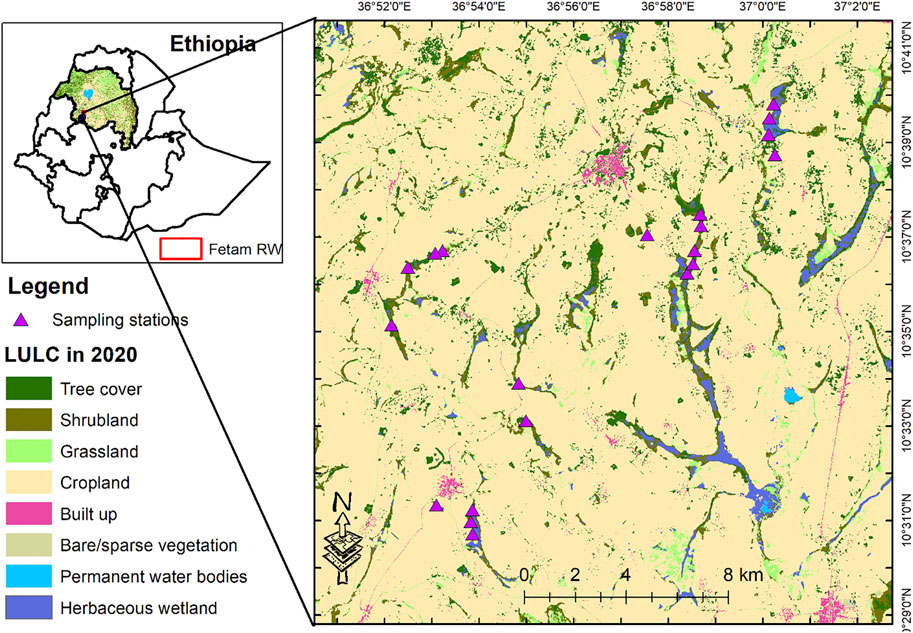
FIGURE 1. The location of the study area and wetland sampling stations in the Fetam River watershed, Upper Blue Nile basin, northwestern Ethiopia.
The climatic condition is generally a sub-humid type. The rainfall pattern is uni-modal, stretching from May to September. Based on records from 2010 to 2016, the mean annual rainfall of the wetlands’ watersheds was 1,750 mm. The highest rainfall is recorded from June to September and the lowest from February to May. The mean monthly temperature varies between 17.9°C and 22.7°C with a mean temperature of 19.8°C.
The projection made based on the 2007 housing and population census (CSA, 2008) indicated that the total population of the kebele administrations found in the study wetlands’ watersheds was estimated to be 68,209 in 2021 i.e., 284.20 persons resided per km2, which was higher than the population density of Amhara Region (143.58 people per km2). The higher population density of the wetland watershed implies a situation that puts pressure on the wetlands.
The primary economic activity of the people, who are residing in the watersheds of the study wetlands, is a subsistence mixed crop-livestock farming system. Crop production is mainly rain-fed. Cereals such as maize and wheat are dominant crops. More than 60% of the watersheds of the study wetlands are used for the cultivation of these crops (Figure 1). Mineral fertilizers have been applied for the enhancement of crop productivity. Based on woreda agricultural offices, the mean amount of chemical fertilizers applied from 2013 to 2021 in the watersheds of the study wetlands was 11,500 ton/ha. An increase in chemical fertilizers application in the upper watersheds may contribute to the concentration of higher nutrients in the study wetlands. Livestock husbandry has also a significant contribution to the livelihood of farmers. Farmers in the watersheds of the study wetlands have reared cattle, sheep, goats, donkeys, and mule. Based on agricultural office reports, the total livestock population kept in the wetlands’ watersheds was 87,477.8 TLU. Keeping livestock in conjunction with crop production may create heavy pressure on the study wetlands.
Watershed, Upper Blue Nile basin, northwestern Ethiopia.
2.2 Site selection
A total of 20 sample sites were established in four study wetlands (Chakun, Denbun, Kotlan and Bergiz). Their area coverage was used as a criterion to determine the number of sample sites established in each study wetland. Human disturbance parameters such as hydrological modifications (ditching or draining), habitat alteration (grazing intensity, buffer alteration, the intensity of invasive plants infestation, eucalyptus plantation and macrophyte coverage) and land use practices (crop farming and conservation practices in the watershed) were used as criteria to select the sample sites. Prior to the selection of sample sites, transect walks were employed for the assessment of the extent of human disturbance along the whole studied wetlands. During the transect walks, observations of hydrological modifications, habitat alteration and land use practices were done. Afterward, we digitized a 50 m buffer zone of each wetland from Google Earth and then calculated it in ArcMap 10.4 to rate the extent of buffer zone alteration. Other land use types (cultivated land and settlement) were measured at the landscape scale using Landsat satellite images. Detailed methodological information can be obtained from Assefa et al. (2022).
2.3 Water quality sampling
The water samples were collected from 20 selected sample sites. Limnological characteristics such as dissolved oxygen (DO), electrical conductivity (EC), total dissolved solids (TDS), pH and water temperature were measured on-site using a professional YSI multi-probe. Likewise, turbidity and, the depths of water and sludge were measured with a portable turbidimeter and graduated stick in the standing water with the deepest point, respectively. Furthermore, integrated water samples (500 mL) from a wetland with standing water were taken with a plastic bottle washed with hydrochloric acid. These samples were kept in an ice box and brought to the laboratory for nutrient determination. In the laboratory, water samples were immediately filtered through a Whatman GF/F filter (0.7 µm) paper. Total nitrogen-TN and total phosphorus-TP were measured from unfiltered water samples using the persulfate digestion procedure and standard colorimetric method (APHA, 1995). Dissolved nutrients were analyzed on filtered water samples using standard colorimetric methods (APHA, 1995). The NO2−, NO3−, and PO43− were analyzed by using the cadmium reduction method, and the acid ascorbic, respectively.
2.4 Macroinvertebrate sampling and identification
Sampling of macroinvertebrates took place in March and April 2022. The main reasons for taking macroinvertebrates during dry season are: 1) The signature of maximum anthropogenic impacts is more easily detected during dry period (Helson and Williams, 2013), 2) macroinvertebrate abundance and richness are greatest in the dry season (Leung and Duudgeon, 2011; Eriksen et al., 2021), 3) sampling environmental variables and macroinvertebrates during heavy precipitation season is unsafe or difficult (Dedieu et al., 2016; Nhiwatiwa et al., 2017).
Macroinvertebrate samples were collected at each sample site using a handheld kick net (30 × 30 cm) with a mesh size of 500 μm (ECCC (Environment and Climate Change Canada), 2018). Sweeping nets were used due to 1) its ability to collect all invertebrates from wetlands and 2) its lower cost by reducing sample volume and processing time relative to the 250 μm mesh sieve (Pinna et al., 2014). Samplings were carried out by disturbing and kicking the bottom sediment and vegetation for 10 min over a distance of 10 m covering different multiple-habitats (open water, submerged vegetation and emergent vegetation) of the wetlands at each site (Baldwin et al., 2005; Mereta et al., 2013). Excess sediment, detritus and vegetation debris associated with the samples were removed by passing through a series of sieves (250, 500, 1,000, and 2,000 μm). The 250 μm sieve is used to retain chironomids dislodged from the vegetation. Subsequently, macroinvertebrates were hand-sorted in the field and placed in a labeled vial containing 80% ethanol (Baldwin et al., 2005) and transported to the laboratory.
Macroinvertebrates were identified in the laboratory by using a dissecting microscope (×10 magnifications) Lenat and Resh argued that the precision of biological monitoring indices can be increased if the analysis is done based on genus- or species-level (Lenat and Resh, 2001). In this study, identifying macroinvertebrates based on genus or species level was difficult as other African countries (Eriksen et al., 2021) due to: 1) Limited resources for conducting analysis, 2) lack of taxonomists who trained on macroinvertebrates identification at the lowest taxonomic unit and 3) lack of developed specific keys for the identification of macroinvertebrates in the Ethiopian context. Jones (2008) argued that macroinvertebrates family based MMI development are sufficient to detect nutrient and organic pollutions as well as human disturbances even though it is not most accurate as the genus- or species-level taxonomy (Jones, 2008). Considering this into account, many previous studies that were conducted in Africa, Asia and Europe identified macroinvertebrates at family level and then developed multi-metric indices (Mereta et al., 2013; Nguyen et al., 2014; Costas et al., 2018). Similarly, we identified the macroinvertebrates at the family level except for Diptera (Chironomidae) considering their capacity in detecting nutrient and organic pollutions as well as human disturbances.
We used different guides and keys (Gerber and Gabriel, 2002; Bouchard, 2004; Marshall, 2006; Merritt et al., 2008; Thorp and Covich, 2010) to identify macroinvertebrates into different families. Chironomidae larvae were identified to genus and species levels by immersing larvae head parts in 10% KOH solution for 12–24 h and then, cleaning the samples with distilled water. Finally, individual specimens were mounted on a slide with glycerin using a dissecting microscope and identified in the compound microscope with the help of various taxonomic keys (Epler, 2001; Eggermont and Verschuren, 2004; 2003; Beneberu et al., 2014).
2.5 Selection of reference and impaired wetland sites
Establishing reference conditions is very important for the development of MMIs (Barbour et al., 1996). Hering et al. (2006) defined a reference site as a condition that is representative of a group of ‘least impaired’ sites that are characterized by selected physical, chemical, and biological characteristics. Obtaining non-disturbed sites in our study wetlands, however, was very difficult. According to Assefa et al. (2022), these study wetlands have been threatened by anthropogenic activities. Consequently, the least disturbed sampling sites were taken as reference sites. The classification of sampling sites as a reference and impaired sites was done based on the intensity of hydrological modifications, vegetation alterations, level of cultivation and upstream watershed conditions of the wetland sites (Lu et al., 2019; Melo et al., 2015; Mereta et al., 2013. A value of each parameter was given following Mereta et al. (2013) rating criteria (1 = no or minimal; 2 = moderate; and 3 = high) to classify the sample sites into reference and impaired sites (Supplementary Table S1).
2.6 Multi-metric index development
A total of 56 potential metrics (Supplementary Table S2) were nominated based on the abundance, structure and function of macroinvertebrates communities in reference and impaired sites. Five components of the macroinvertebrate community including family richness, taxonomic composition, tolerance measures, biotic indices and the composition of functional feeding groups (Barbour et al., 1996) were considered for the purpose of reflecting a diversity of responses and increasing the amount of information contained in the final index (Kerans and Karr, 1994; Barbour et al., 1996).
The metrics that are sensitive to anthropogenic perturbations were examined using a four-step procedure (Hering et al., 2006) to separate reference wetlands from impaired wetlands. Firstly, low-value metrics (median = 0) were filtered by running a range test and eliminated in the subsequent calculation due to their less importance to differentiate impaired and reference wetlands. Secondly, the metrics that demonstrated a significant difference between the reference and impaired sites were determined by using the Mann-Whitney U test (p < 0.05). Thirdly, the discrimination power (DP) of the remaining metrics was evaluated by using whisker-box plot tests. The DP was measured by the degree of interquartile overlap of each metric in the box plot, and it was represented by an interquartile range (IQ). The metrics possessing a higher DP (IQ ≥ 2) (Barbour et al., 1996) were retained for further analysis. Finally, the relationship between metrics was tested with a Pearson correlation coefficient to avoid redundant information. A pair of metrics is redundant if the correlation coefficient is greater than 0.70 (Whittier et al. (2007). Only one metric from each component of the macroinvertebrate community (composition/abundance, richness/diversity, sensitivity/tolerance, functional) (Barbour et al., 1996; Hering et al., 2006) remained in a set of correlated metrics for calculating the final MMI.
The values of core metrics were standardized and normalized to construct the final MMI. The Continuous Scoring Method suggested by Frey (1977) was used to standardize and normalize the core metrics values due to its advantage of offering better results than discrete scoring in terms of responsiveness, variability and subjectivity (Stoddard et al., 2006; Ruaro et al., 2020). The following tasks were done to complete the scoring procedure effectively (Baptista et al., 2013; Tampo et al., 2020). 1) All the selected core metrics that showed a decreasing trend with increasing impairment were calculated by using Eq. 1; 2) the metrics that showed an increasing trend with increasing impairment were calculated by using Eq. 2; 3) the metric values were adjusted between 1 and 10: Where values < 0 are regarded as 0 and values >10 are considered as 10; 3) the final MMI value was obtained by summing the scores of core metrics and class boundaries have been established to promote the local use of the index for management purposes.
2.7 Validation of MMIs
Responsiveness, sensitivity and precision (Zhang et al., 2021) of the MMIs were measured to validate the performance of MMIs in this study. Responsiveness, which is the ability to statistically distinguish the MMI values between reference and impaired wetlands, has been assessed by using one-way ANOVA. The sensitivity of the index was tested by using Whisker-Box plot tests. Lastly, precision was measured based on the concept of correct classification percentage (CCP >80%) (Zhang et al., 2021). Reference site CCP was computed in terms of percentage and classified as “high”, “good” and “moderate”. Similarly, impacted site CCP was computed in percentage to classify as “moderate”, “poor” and “bad”.
2.8 Influence of environmental variables
The relationships between environmental variables, core metrics and MMIs were analyzed by employing different statistical approaches. One-way ANOVA was applied to investigate the differences of environmental variables between the reference and impacted wetlands. Pearson correlation coefficient was used to evaluate the relationship between core metrics and environmental variables as well as environmental variables and MMI. Besides, the influence of environmental variables on MMI was analyzed by Stepwise Multiple Linear Regression (SMLR). The function “lm” in the R-package “MASS” was used to analyze the relationship between SMLR and environmental factors. Then, the final model was constructed using the function “trendline” in the R-package “basicTrendline” (RCoreTeam, 2022).
3 Results
3.1 Site characteristics
3.1.1 Physicochemical parameters of sample sites
The results of environmental variables for the reference and impaired wetland sites shown in Table 1 revealed that the concentrations of all nutrients (e.g., nitrogen, phosphorus) were lower in the reference sites than in impacted sites (Table 1). Moreover, the reference sites had a lower rate of human disturbance (hydrological modifications, vegetation modifications, evidence of chemical pollution and agriculture) than the impaired site. On the contrary, pH and dissolved oxygen concentrations were lower in the impacted sites than in the reference sites. There were no pronounced differences in water temperature, electrical conductivity and total dissolved solids between reference and impacted sites (Table 1).
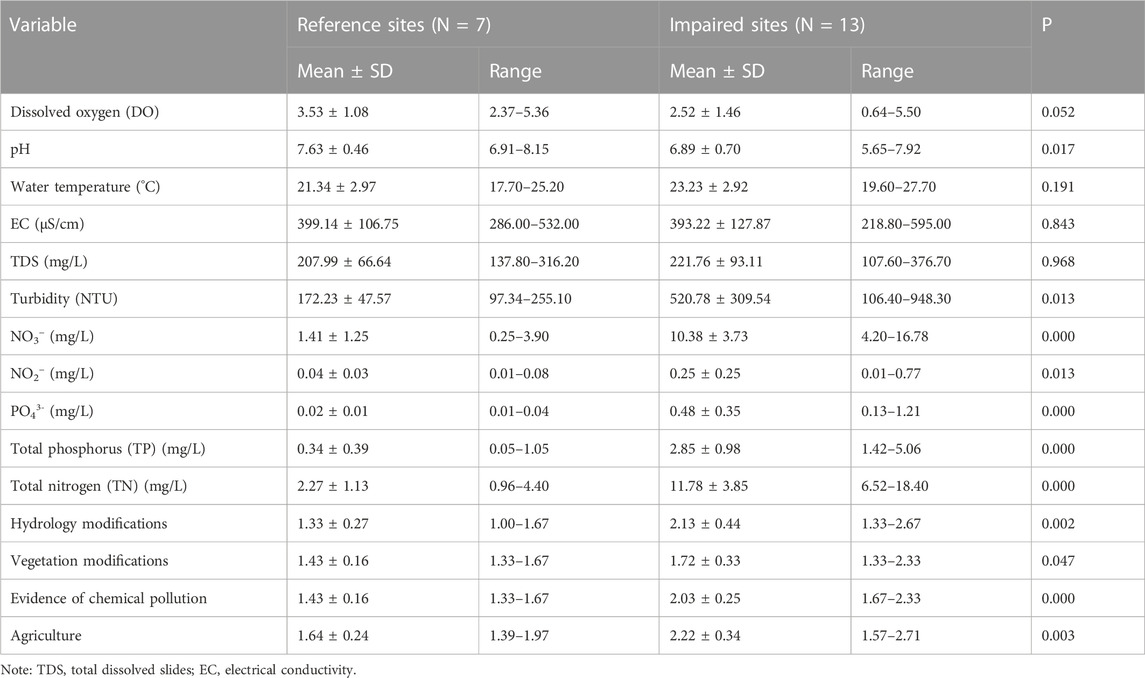
TABLE 1. Summary statistics of environmental variables in reference and impaired sites.
3.1.2 Macroinvertebrates assemblages in the reference and impaired sites
A total of 2,456 macroinvertebrates were recorded across all samples. They were belonged to 62 taxa, 60 families, nine orders, four classes and one phylum. Coleoptera (45%), Diptera (28.8%), Odonata (11%), and Mollusks (8%) were the most dominant taxa in the samples. The dominance of Diptera, Coleoptera and Odonata was as well in 447 wetlands by the review work (Batzer and Ruhí, 2013). The significance difference (p < 0.001) was observed between the number of taxa in reference (mean = 23) and impaired (mean = 15) sites as confirmed by the Mann–Whitney U test analysis. Similarly, macroinvertebrate assemblages’ differences were detected between the references and impacted sites (ANOSIM, p < 0.002). Dytiscidae, Chironominae (Polypedilum witti), Hydrophilidae, Hydraenidae, Elmidae and Notonectidae were abundant in the reference sites, whereas Scirtidae, Culicidae, Sphaeriidae and Chironominae (Chironomus alluaudie, Chironomus imicola) were highly abundant in the impacted sites. Chironominae (15.56%) (Chironomus alluaudie P. witti), Dytiscidae (10.96%, Scirtidae (8.51%) and Hydrophilidae (6.11%) contributed to the difference between the reference and impacted sites macroinvertebrate assemblages.
3.2 Metric selection
A set of 34 metrics (Table 2) were selected from 56 potential metrics by using a range test. Of these, about 22 metrics did not pass a range test because they had zero median values both at the reference and impaired sites, only 15 metrics that showed a significant difference between reference and impaired sites were passed to the next step and subjected to the Mann-Whitney U test (p < 0.05) analysis. Then, six core metrics were selected from 15 metrics to develop the final MMI model based on the box-whisker plot and redundancy tests. These metrics consisted of Total taxa, #ETO, ASPT-ETHbios, Marg-I, %Cole and %CF. As confirmed by the redundancy test, the six metrics were not highly correlated with their respective metric category (Pearson correlation, r < 0.70). Thus, they were selected with the highest priority for the MMI since they are representative of most sites and fulfilled all metric selection procedures. On other hand, the metrics such as ETHbios, #Odon, #Cole, and % Dyti were excluded because of their significant correlation (r > 0.70). However, we did not automatically reject one of them because of a strong correlation between two metrics representing two different biological dimensions of the macroinvertebrate community. Accordingly, we keep at least one metric representing richness-diversity (e.g., Margalef index), sensitivity/tolerance (e.g., ASPT-ETHbios), composition (e.g., %Cole) and functional feeding groups (e.g., %CF) that have high discrimination power, extensive ecological representation and application (Figure 2).
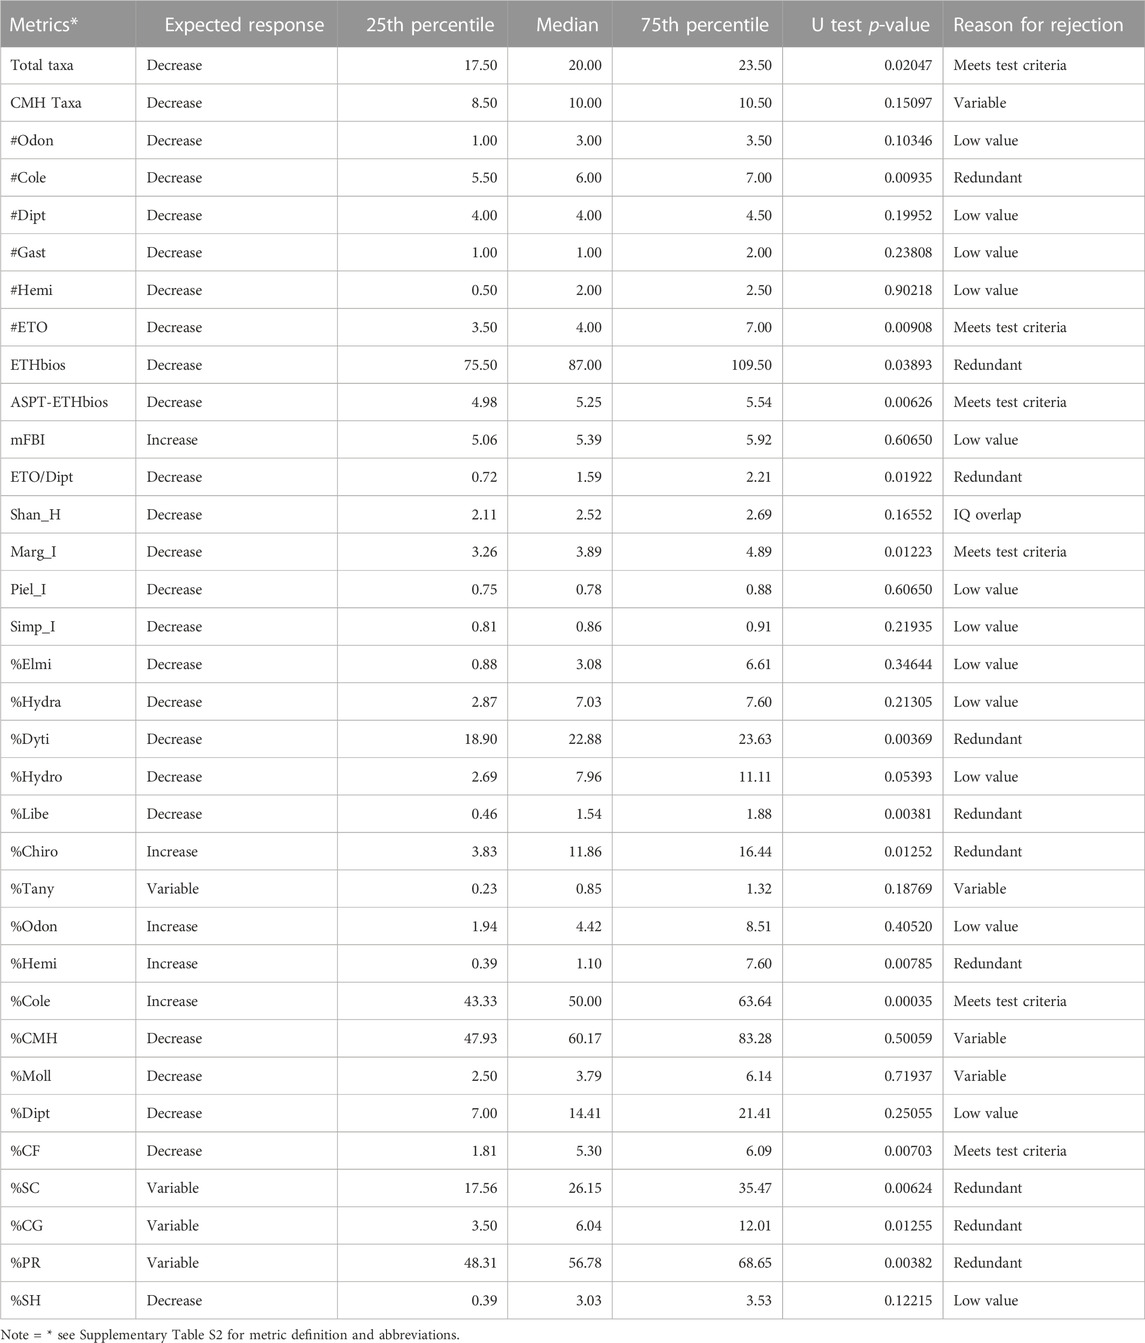
TABLE 2. The 34-candidate metrics passed the range test and core metrics selected for the MMI development in the reference sites with their interquartile values (25th percentile, median and 75th percentile).
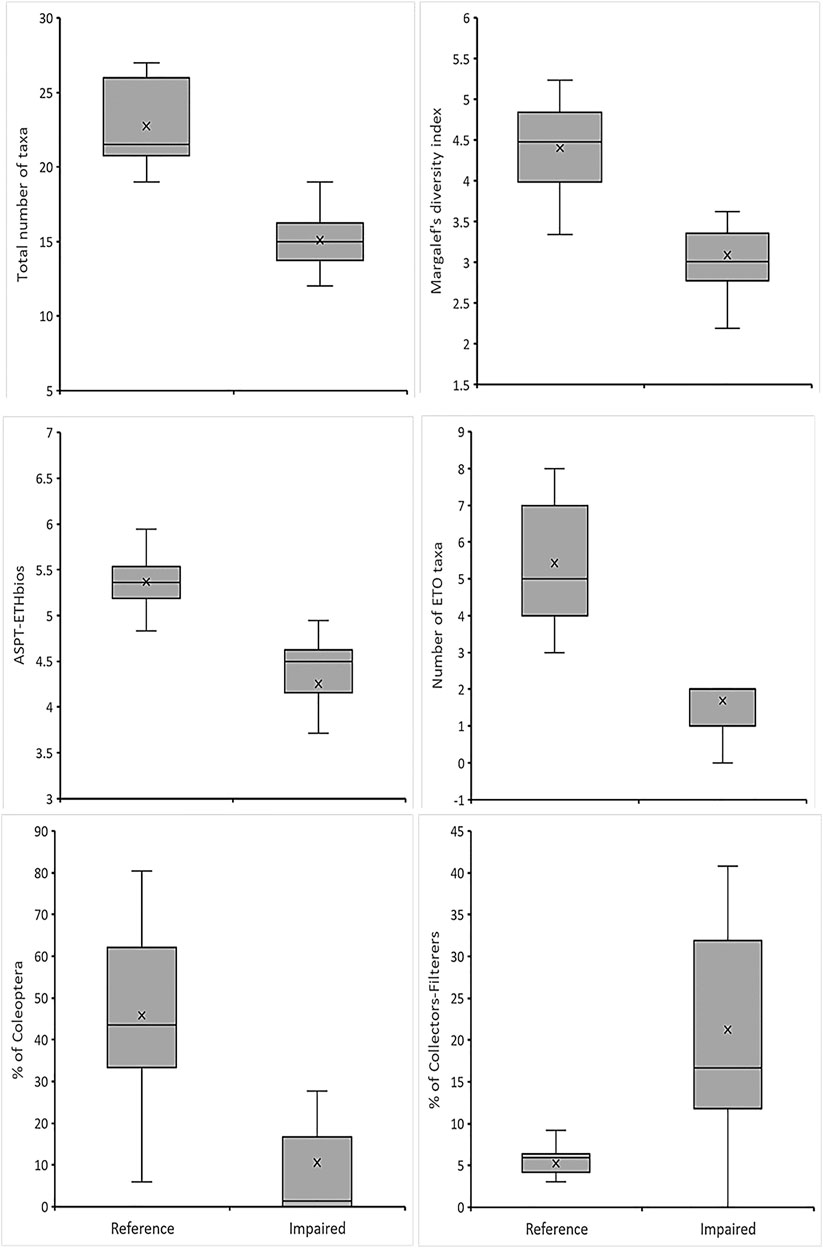
FIGURE 2. Box-Whisker plots of the six-core metrics used to discriminate between reference and impaired 781 wetland sites.
The Pearson correlation coefficient analysis shown in Table 3 indicated that MMI was significantly correlated with some of the physicochemical parameters (turbidity, NO3−, TP and TN) and all of the human disturbance variables (hydrological modification, vegetation modification, chemical pollution and cultivation). The human disturbance parameters except vegetation modification were significantly correlated with MMI at p < 0.01 whereas; turbidity and TP were among the physicochemical parameter which had a significant correlation at p < 0.01. Similarly, the proportional abundance of collector-filterers had a strong correlation with nine environmental variables. Its relationship with water temperature, phosphate, TN, NO2−, and hydrological modification was significant at p < 0.05 and it was significantly correlated with turbidity, TP, chemical pollution and cultivation at p < 0.01. The final core variables such as ASPT-ETHbios and proportion of coleopteran had also a significant correlation with eight and six environmental variables, respectively (see Table 3). The core metrics, which had a significant correlation with only a few environmental variables, were #ETO, the total number of taxa and Marg_I. As is shown in Table 3, human disturbance parameters such as hydrological modification, cultivation practices, vegetation modification and chemical pollution were significantly correlated with most of the final core metrics as well as MMI. Besides, among the physicochemical parameters, TP was significantly correlated with most (66.7%) of final core metrics and MMI. It was noted from Table 3 that TDS and nitrate had insignificant correlations with the six final core metrics although their influence was predictable.
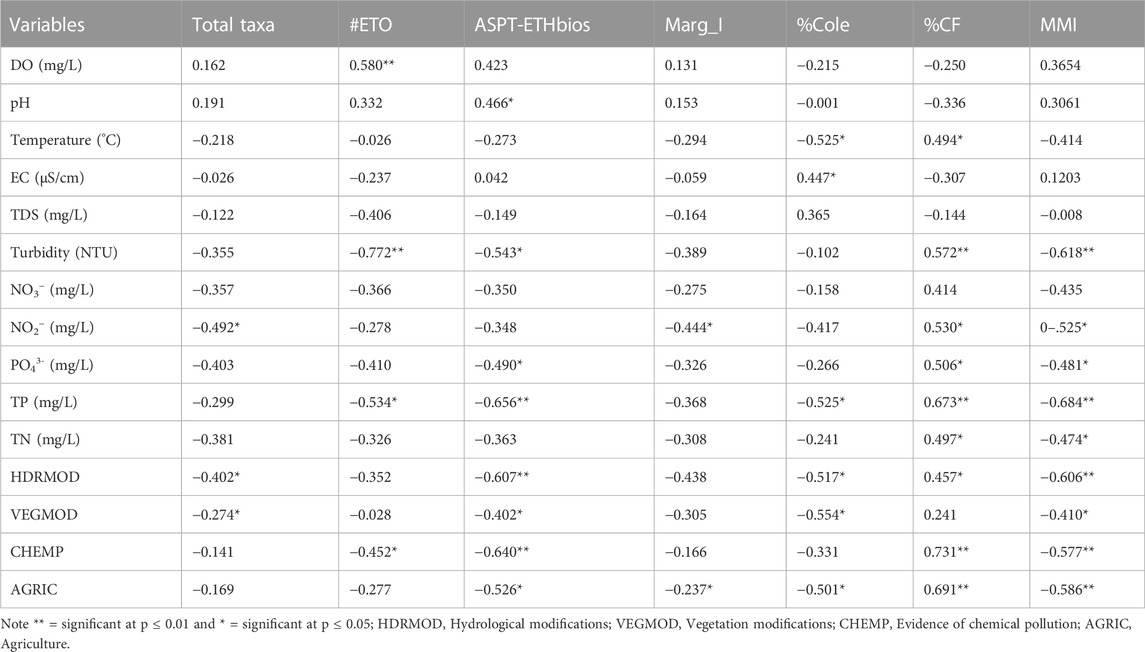
TABLE 3. Pearson correlation coefficients between core metrics and MMI, and environmental variables.
The Stepwise Multiple Linear Regression model presented in Figure 3 shows that PO43− and turbidity had significantly influenced the MMI score at p = 0.0047 and p = 0.0191, respectively. The effect of other environmental variables (TP, TN, hydrological modification, chemical pollution, vegetation modification and cultivation), which had a significant correlation with MMI, was found to be insignificant. PO43− was the most contributing variable to the variation of MMI scores, indicating that the MMI could provide information about the pressure of nutrient enrichment on macroinvertebrate assemblages (Figure 3).
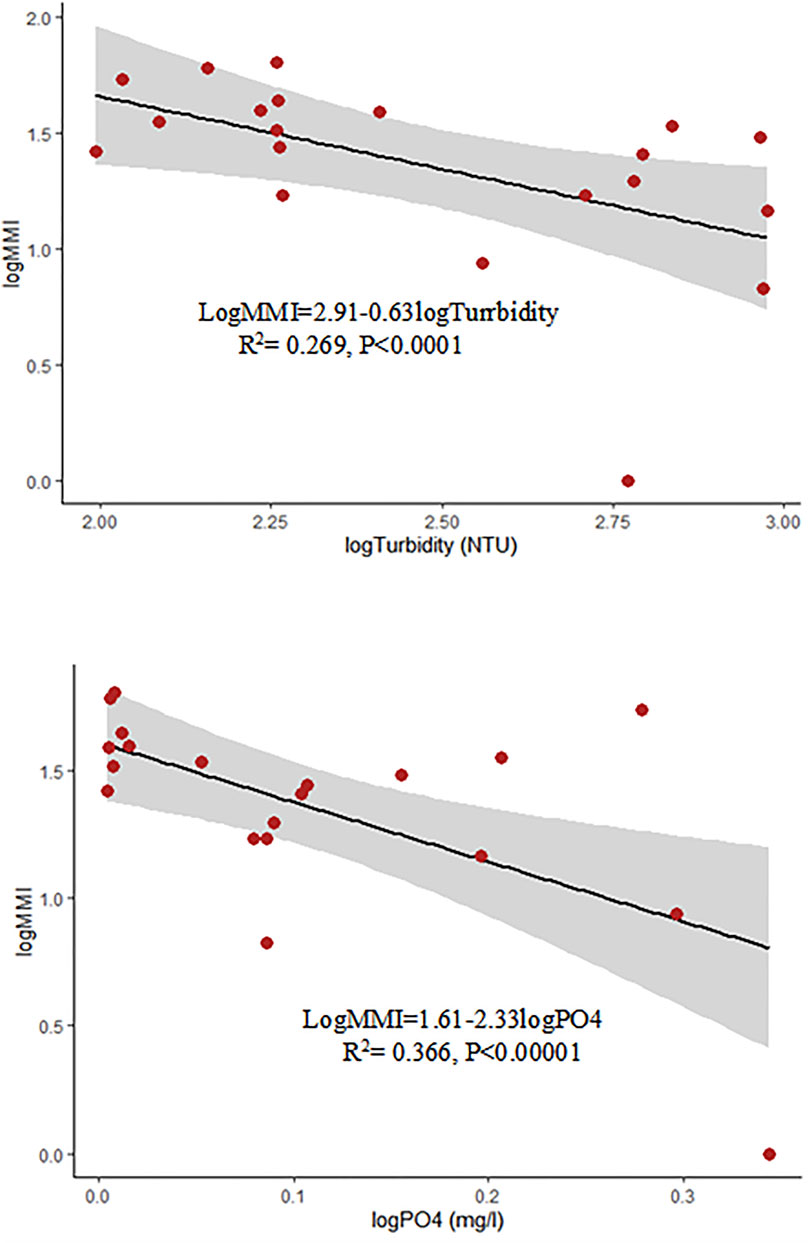
FIGURE 3. Regression models showing the relationships between MMI and the concentration of turbidity and PO43−.
3.3 MMI development and validation
The final MMI of the study wetlands was computed by aggregating the six metrics into a single value. The value of MMI value was given from 0 to 60 by summing the minimum and maximum scores for each metric. The lowest threshold (0) represents the most impaired condition whereas the upper threshold (60) represents the most reference condition (Figure 4). The wetlands sites, thus, were categorized into five quality classes corresponding to their different biological and water quality conditions. These are 1) bad quality class with MMI score ranging from 0 to 13; 2) poor quality class with an MMI score varies from 14 to 25; 2) moderate-quality class with index values between 26 and 35; 4) good quality class with the index values range from 36 to 45; 5) high-quality class with index values range from 46 to 60. Based on these ordinal rating categories, five sites (38.46%) from the samples collected in the impaired wetland sites were classified as bad, 4 (30.76%) were classified as poor, 3 (23.08%) as moderate and only 1 (7.69%) was classified as good. In reference sites, 3 (42.87%) of them were classified as good and 4 (57.14%) were classified as high. Generally, 69.23% of the impaired wetlands sites were found to be in bad or poor-quality condition. On the contrary, 100% of the reference sites were in good or high-quality condition.
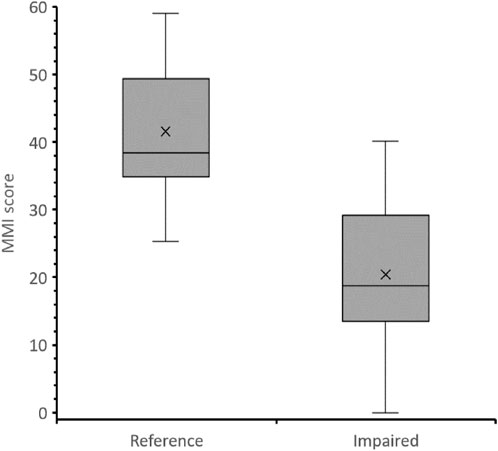
FIGURE 4. Box-Whisker plot of multi-metric index scores of reference and impaired wetland sites.
Reference and impacted sites had CCP values of 85.7% and 92.3%, respectively, suggesting that the newly developed MMI index is endowed with high precision. One-way ANOVA analysis also indicated the strong significance of MMI in differentiating the impacted sites from the reference sites (p = 0.003), which suggested MMI’s good responsiveness. Besides, the higher sensitivity of MMI in distinguishing the impacted sites from the reference sites (IQ = 3) was shown by box-and-whisker plots (Figure 4).
4 Discussions
We assessed the ecosystem health of wetlands in predominantly agricultural landscapes in northwestern Ethiopia by developing the multi-metrics index based on macroinvertebrate communities. We established reference sites for the development of MMI (Hering et al., 2006). We did not find the wetland or parts of the wetlands that were not totally affected by human intervention like some previous studies (Mereta et al., 2013; Melo et al., 2015). This is because close to 30% of the study wetlands were converted to cultivated lands in the last 35 years; nearly a hundred thousand livestock have freely set to graze in the study wetlands; their sizes have been shrunk as the result of gully expansion and deposition of bulky sediments; and the macrophytes have heavily harvested (Assefa et al., 2022). Thus, as some other studies (Lu et al., 2019; Liu et al., 2022) we selected seven reference sites where the wetland areas were less polluted, hydrologically less modified, non-cultivated and least deforested, which is equivalent to 35% of the total sample sites. The rest (65%) sample sites were highly disturbed by anthropogenic activities.
Exploring a wide range of metrics is necessary for the development of a multi-metric index after differentiating the reference sites and impacted sites (Karr and Chu, 1999; Hering et al., 2006). Cognizant of this fact, fifty-six potential metrics were identified and iteratively tested. Six core metrics that are representative of five components of the macroinvertebrate community including family richness, taxonomic composition, tolerance measures, biotic indices and the composition of functional feeding groups were chosen from the potential metrics for the final MMI construction. In bioassessment studies, the most commonly used macroinvertebrate metrics were related to sensitivity/tolerance and richness/diversity measures. The metrics derived from functional feeding groups and diversity were presented only in a few studies (Ruaro et al., 2020). In our study, however, both sensitivity/tolerance and richness/diversity measures as well as functional feeding groups and diversity were identified as the core metrics for the framework of MMIs development.
The total number of taxa was one of the six core metrics chosen for the development of our MMI. The metric taxa richness was widely selected as a core metric by the previous studies (Mereta et al., 2013; Melo et al., 2015; Lu et al., 2019; Wu et al., 2019) as well because of its ability to separate impaired wetlands from reference wetlands. Barbour et al. (1996) reported that a high taxonomic richness implies a better status of aquatic ecosystem conditions and the existence of adequate food resources availability for many species in aquatic ecosystems As it was previous results (Burton et al., 1999; USEPA, 2002; Menetrey et al., 2011; Lunde and Resh, 2012; Melo et al., 2015), we found the decreasing trend total number of taxa with increasing anthropogenic impacts such as hydrological modification and upstream agricultural activities, This suggested the poorer status of wetland ecosystem conditions in the impaired sites of our study wetlands than the ecosystem conditions in the reference sites.
Another core metric that was selected for the construction of the MMI was Margalef’s Index. Margalef’s Index has not been commonly used to develop MMI for the assessment of ecological conditions and water quality of wetlands (Kashian and Burton, 2000; Haugerud, 2003; Lunde and Resh, 2012; Mereta et al., 2013; Melo et al., 2015; Lu et al., 2019; Wu et al., 2019). It has been selected as a core metric by the studies (Nguyen et al., 2014; Odabaşı et al., 2022), which were conducted for streams’ water quality or ecological health assessment. The representation of Margalef’s Index as a core metric of our study may be because all of the wetlands are riverine and a few sample sites were established in the river courses. Margalef’s Index focuses on the number of species relative to the number of individuals (Lakew and Moog, 2015). In this study, the value of the Margalef index in impaired sites was lower than in reference sites. The lower value of Margalef’s Index in impaired sites suggested the poor ecological condition of 65 percent of our study wetlands. On the contrary, the higher Margalef’s Index value in our reference sites suggested greater biodiversity and, a cleaner aquatic ecosystem.
Ephemeroptera, Plecoptera and Trichoptera (EPT) have not been identified for the construction of a multi-metrics index in many wetland studies because of their less abundance in the wetland ecosystem. As reported by Batzer and Ruhí (2013), EPT taxa are dominant in streams. In this study, Plecoptera was absent may be due to the ecological disturbance of our study wetlands (Assefa et al., 2022). Thus, we selected EOT as one of six core metrics by replacing Plecoptera with Odonata in the EPT metrics (Ephemeroptera, Plecoptera and Trichoptera) similar to Mereta et al. (2013) and Tampo et al. (2020). Odonata is an appropriate indicator in the freshwater bioassessment (Berquier et al., 2016; Miguel et al., 2017) because of their trophic position and sensitivity to environmental degradation (Berquier et al., 2016; Miguel et al., 2017). Ephemeroptera are ecologically sensitive groups for tracking organic pollution or degradation of aquatic ecosystems due to their abundance in freshwater habitats having adequate oxygen levels. Although they are less consistent in monitoring human impacts, Trichoptera are good to detect the short-term impacts of anthropogenic intervention (Kashian and Burton, 2000). Similar to previous studies (Mereta et al., 2013; Tampo et al., 2020), we observed the decline of the EOT abundance with increasing anthropogenic intervention. In other words, the number of EOT has decreased as we go from reference sites to impaired sites. This implied that the impaired sites (65% of parts of our study wetlands) were highly affected by anthropogenic interventions. A significant and negative correlation of EOT taxa with phosphate and anthropogenic disturbances is also important evidence for the severe impacts of anthropogenic stressors in the studied wetlands (Table 3).
Although the proportional abundance of the Coleoptera taxa metric is less widely used in other wetland studies, we selected Coleoptera as an important metric for the development of the multi-metrics index. We found that the proportion of Coleoptera decreased with increasing anthropogenic stressors which is consistent with prior reports (Lunde and Resh, 2012). Lunde and Resh reported that the proportion of the Coleoptera metric was declined negatively with increasing urbanization. As confirmed by Pearson correlation coefficient analysis, the proportion of Coleoptera taxa was significantly and negatively correlated with nutrient enrichment and anthropogenic disturbances such as hydrological modifications (Table 3). Its significant and negative relationship with environmental variables suggested that the proportion of Coleoptera taxa is the better indicator for the ecological status of the wetland ecosystem in our study areas.
Metrics namely ETHbios, ASPT-ETHbios, mFBI index, and EOT/Dipt were considered as well in the process of core metrics selection in the present study since they are highly sensitive to disturbances. However, only ASPT-ETHbios was selected as part of the core metrics for final MMI development though it was widely used for the water quality or ecological conditions of running water bodies (Aschalew and Moog, 2015). The others were discarded as possessing either weak discrimination power or redundant. Similar to Aschalew and Moog (2015) findings, we observed a strong correlation of ASPT-ETHbios with various environmental parameters (Table 3). This suggested its sensitivity to the impairment in the studied wetlands.
Last but not least core metric that was selected for the development of the current multi-metric index was the proportion of Collector-Filterers. Most of the Collector-Filterers in this study belonged to tolerant taxa such as the Bivalvia (Uniodidae, Sphaeriidae), Culicidae, and Simuliidae. Trophic metrics based on FFGs reflect the availability of food sources (Barbour et al., 1999). Thus, their distribution and relative abundance can be used to detect changes in the availability of various types of food (Balderas et al., 2016). FFGs-based macroinvertebrate metrics are considered as a reliable indicator due to their variability in responses to anthropogenic impact (Barbour et al., 1999; Moya et al., 2011). On the contrary to some prior studies carried out in wetlands (Kashian and Burton, 2000; Mereta et al., 2013), we observed an increasing trend of % of Collector-Filterers with increasing human disturbance (impairment). This may be due to the dominance of some Collector-Filterers such as Uniodidae, Sphaeriidae, Culicidae, and Simuliidae in our study wetlands. Our findings, however, were consistent with the results obtained in rivers (Balderas et al., 2016) which reported that the proportion of Collectors-Filters was high in sample sites where anthropogenic interventions were intensive. The high abundance of tolerant taxa implied the existence of ecological disturbance of freshwater ecosystems (Odume et al., 2012; Masese et al., 2013).
Generally, considering the potential variation of ecoregions in terms of environmental characteristics and biological communities (Ruaro et al., 2020), we developed the MMI for four wetlands located in Bure and Wonberma Woreda, Upper Blue Nile. As our prior expectation, our MMI has accurately differentiated the reference and impaired wetlands. The results indicated that more than 69.23% of the impaired wetland sites had poor water quality. On the contrary, all reference wetlands had good to high (excellent) water quality. The developed MMI also able to categorize the ecological status into classes as high, good, moderate, fair, and bad in the context of water quality. Moreover, it could able to provide information about the influence of nutrient enrichment on the studied wetlands’ ecological status, which is in line with Zhang et al. (2021) study on lake systems. Overall, our index has successful in detecting the effects of anthropogenic pressures on macroinvertebrate community assemblages. The endowment of developed MMI with high precision (85.5% and 92.3% CCP values of reference and impacted cites, respectively), its good responsiveness (p = 0.003) and its higher sensitivity (IQ = 3) in distinguishing the impacted sizes from reference sites clearly confirmed its worth for the assessment of wetland ecological conditions in predominantly agricultural landscapes in the upper Blue Nile Basin and beyond. As stated by Hering et al. (2006) and Zhang et al. (2021), the developed MMI can be considered as a robust tool for ecological status assessment when its precision (CCP) is higher than 80%, has good responsiveness (p < 0.05) and its sensitivity is higher than IQ greater than 2.
Nonetheless, the use of our MMI was not exempt from some limitations. As stated by NRC, (2000), capturing the dynamics of essential ecological components by a simple index may obscure the necessary information. The selection of six core metrics from 56 candidate metrics for our MMI development may thus limit the tracking of all sources of contamination and environmental perturbations. The other limitation of our MMI development may be related to sampling procedures. As explained in the site selection section, human disturbance parameters were used as criteria to select the sample sites. For the selection of sampling sites, extent of each human disturbance parameter was scaled into three categories (1 = no or minimal; 2 = moderate; and 3 = high)). Then, sampling sites were selected from minimally impacted sites, medium impacted sites, and highly disturbed sites following Mereta et al. (2013) rating criteria. Scaling of human disturbance rates into three may not able to select representative samples. According to Connors and DiFranco (2019), the extent of each human disturbance rate should be categorized into five scales for increasing of representativeness of the samples. In addition, evaluation of the magnitude of human disturbance based on visual assessment may affect the selection of representative samples. Gill et al. (1996) argued that quantitative approach is better to measure the magnitude of human disturbance than a qualitative assessment.
5 Conclusion
In this study, an MMI index has developed based on macroinvertebrates to assess the ecological condition of wetlands in predominantly agricultural landscapes, the Upper Blue Nile basin, Northwestern Ethiopia. The index was constructed by combining six core metrics selected based on rigorous criteria from 56 potential metrics. These six-core metrics (total number of taxa, Margalef’s index, #EOT, ASPT-ETHbios, %Cole, %Collector-Filterers) differed significantly between reference and impaired wetland sites. They represent a variety of macroinvertebrate community attributes such as the richness, biodiversity, relative abundance, tolerance, and functional feeding groups. The newly developed MMI could separate degraded sites from reference sites and has also shown a strong negative relationship with most of the physicochemical variables and all human disturbance factors. Thus, we believe that our MMI could be a useful biomonitoring tool for the assessment and monitoring of wetland ecological conditions in predominantly agricultural landscapes in the upper Blue Nile basin and beyond.
Data availability statement
The original contributions presented in the study are included in the article/Supplementary Materials, further inquiries can be directed to the corresponding author.
Author contributions
Writing—original draft preparation; review and editing WWA, BGE, and AW.
Funding
The study was financially supported by the International Foundation of Science (IFS). Grant Number is 6536.
Acknowledgments
We also acknowledge the Blue Nile Water Institute of Bahir Dar University for logistic and Lab space support. We would like to thank Woreda and Kebele Chiefs for granting permission to sample the study wetlands.
Conflict of interest
The authors declare that the research was conducted in the absence of any commercial or financial relationships that could be construed as a potential conflict of interest.
Publisher’s note
All claims expressed in this article are solely those of the authors and do not necessarily represent those of their affiliated organizations, or those of the publisher, the editors and the reviewers. Any product that may be evaluated in this article, or claim that may be made by its manufacturer, is not guaranteed or endorsed by the publisher.
Supplementary material
The Supplementary Material for this article can be found online at: https://www.frontiersin.org/articles/10.3389/fenvs.2023.1117190/full#supplementary-material
References
Alemneh, T., Ambelu, A., Zaitchik, B. F., Bahrndorff, S., Mereta, S. T., and Pertoldi, C. (2019). A macroinvertebrate multi-metric index for Ethiopian highland streams. Hydrobiologia 843, 125–141. doi:10.1007/s10750-019-04042-x
APHA (1995). Standard methods for the examination of water and wastewater. New York: American Public Health Association.
Aschalew, L., and Moog, O. (2015). Benthic macroinvertebrates based new biotic score “ETHbios” for assessing ecological conditions of highland streams and rivers in Ethiopia. Limnologica 52, 11–19. doi:10.1016/j.limno.2015.02.002
Assefa, W. W., Beneberu, G., Sitotaw, B., and Wondie, A. (2020). Biological monitoring of freshwater ecosystem health in Ethiopia: A review of current efforts, challenges, and future developments. Ethiop. J. Sci. Technol. 13, 229–264. doi:10.4314/ejst.v13i3.5
Assefa, W. W., Eneyew, B. G., and Wondie, A. (2022). The driving forces of wetland degradation in bure and Wonberma woredas, upper Blue Nile basin, Ethiopia. Environ. Monit. Assess. 194, 838. doi:10.1007/s10661-022-10516-8
Balderas, E. C. S., Grac, C., Berti-Equille, L., and Hernandez, Ma.A. A. (2016). Potential application of macroinvertebrates indices in bioassessment of Mexican streams. Ecol. Indic. 61, 558–567. doi:10.1016/j.ecolind.2015.10.007
Baldwin, D. S., Nielsen, D. L., Bowen, P. M., and Williams, J. (2005). Recommended methods for monitoring floodplains and wetlands. Canberra: Murray-Darling Basin Commission.
Baptista, D. F., Henriques-Oliveira, A. L., Oliveira, R. B. S., Mugnai, R., Nessimian, J. L., and Buss, D. F. (2013). Development of a benthic multimetric index for the Serra da Bocaina bioregion in Southeast Brazil. Braz. J. Biol. 73, 573–583. doi:10.1590/S1519-69842013000300015
Barbour, M. T., Gerritsen, J., Griffith, G. E., Frydenborg, R., McCarron, E., White, J. S., et al. (1996). A framework for biological criteria for Florida streams using benthic macroinvertebrates. J. North Am. Benthol. Soc. 15, 185–211. doi:10.2307/1467948
Barbour, M. T., Gerritsen, J., Snyder, B. D., and Stribling, J. B. (1999). Rapid bioassessment protocols for use in streams and wadeable rivers: Periphyton, benthic macroinvertebrates and fish. Washington, DC: US Environmental Protection Agency.
Barbour, M. T., Graves, C. G., Plafkin, J. L., Wisseman, R. W., and Bradley, B. P. (1992). Evaluation of EPA’s rapid bioassessment benthic metrics: Metric redundancy and variability among reference stream sites. Environ. Toxicol. Chem. 11, 437–449. doi:10.1002/etc.5620110401
Batzer, D. P., and Ruhí, A. (2013). Is there a core set of organisms that structure macroinvertebrate assemblages in freshwater wetlands? Freshw. Biol. 58, 1647–1659. doi:10.1111/fwb.12156
Beneberu, G., Mengistou, S., Eggermont, H., and Verschuren, D. (2014). Chironomid distribution along a pollution gradient in Ethiopian rivers, and their potential for biological water quality monitoring. Afr. J. Aquat. Sci. 39, 45–56. doi:10.2989/16085914.2013.870525
Berquier, C., Orsini, A., Ferrat, L., and Andrei-Ruiz, M.-C. (2016). Odonata community index – corsica” (OCIC): A new biological index based on adult odonate populations for assessment of the ecological status of watercourses in corsica. Ecol. Indic. 66, 163–172. doi:10.1016/j.ecolind.2016.01.022
Bonada, N., Prat, N., Resh, V. H., and Statzner, B. (2006). Developments in aquatic insect biomonitoring: A comparative analysis of recent approaches. Annu. Rev. Entomol. 51, 495–523. doi:10.1146/annurev.ento.51.110104.151124
Bouchard, R. W. (2004). Guide to aquatic invertebrates of the upper midwest: Identification manual for students, citizen monitors, and aquatic resource professionals. St. Paul: University Of Minnesota.
Boulton, A. J, Boyero, L., Covich, A. P., Dobson, M., Lake, S., and Pearson, R. (2008). “Are tropical streams ecologically different from temperate streams?,” in Tropical stream ecology. Editor D. Dudgeon London: Elsevier Inc., 257–284.
Burton, T. M., Uzarski, D. G., Gathman, J. P., Genet, J. A., Keas, B. E., and Stricker, C. A. (1999). Development of a preliminary invertebrate index of biotic integrity for Lake Huron coastal wetlands. Wetlands 19, 869–882. doi:10.1007/bf03161789
Chessman, B. C., and McEvoy, P. K. (1997). Towards diagnostic biotic indices for river macroinvertebrates. Hydrobiologia 364, 169–182. doi:10.1023/A:1003142819625
Connors, B, and DiFranco, J. (2019). Protocols for completing the biological monitoring wetland human disturbance assessment. No. DEP-LW1259. Portland.
Costas, N., Pardo, I., Méndez-Fernández, L., Martínez-Madrid, M., and Rodríguez, P. (2018). Sensitivity of macroinvertebrate indicator taxa to metal gradients in mining areas in Northern Spain. Ecol. Indic. 93, 207–218. doi:10.1016/j.ecolind.2018.04.059
CSA (Central Statistics Agency) (2008). Summary of the 2007 population and housing census of 575 Ethiopia: Statistical report at country level.
Davidson, N. C. (2014). How much wetland has the world lost? Long-term and recent trends in global wetland area. Marine Freshwater Res. 65 (10), 934. doi:10.1071/MF14173
Dedieu, N., Clavier, S., Vigouroux, R., Cerdan, P., and Céréghino, R. (2016). A multimetric macroinvertebrate index for the implementation of the European water framework directive in French guiana, East amazonia. River Res. Appl. 32, 501–515. doi:10.1002/rra.2874
Desalegne, S. A. (2018). Macroinvertebrate-based bioassessment of rivers in addis ababa, Ethiopia. Afr. J. Ecol. 56, 262–271. doi:10.1111/aje.12444
ECCC (2018). CABIN wetland macroinvertebrate protocol. Gatineau: Environment and Climate Change Canada.
Eggermont, H., and Verschuren, D. (2004). Sub-fossil Chironomidae from East Africa. 2. Chironominae (chironomini and tanytarsini). J. Paleolimnol. 32, 413–455. doi:10.1007/s10933-004-0327-2
Eggermont, H., and Verschuren, D. (2003). Subfossil Chironomidae from lake tanganyika, East Africa. 2. Chironominae (chironomini and tanytarsini). J. Paleolimnol. 29, 423–457. doi:10.1023/A:1024492119609
Epler, J. H. (2001). Identification manual for the larval Chironomidae (Diptera) of North and South Carolina. A guide to the taxonomy of the midges of the southeastern United States, including Florida. Special Publ. SJ2001-SP13, N. C. Dep. Environ.
Eriksen, T. E., Brittain, J. E., Søli, G., Jacobsen, D., Goethals, P., and Friberg, N. (2021). A global perspective on the application of riverine macroinvertebrates as biological indicators in Africa, South-Central America, Mexico and Southern Asia. Ecol. Indic. 126, 107609. doi:10.1016/j.ecolind.2021.107609
Fentaw, G., Mezgebu, A., Wondie, A., and Getnet, B. (2022). Ecological health assessment of Ethiopian wetlands: Review and synthesis. Environ. Sustain. Indic. 15, 100194. doi:10.1016/j.indic.2022.100194
Frey, D. G. (1977). “Biological integrity of water – A historical approach,” in The integrity of water. Editors R. K. Ballentine, and L. J. Guarria (Washington, DC: US Environmental Protection Agency).
Gabriels, W., Lock, K., de Pauw, N., and Goethals, P. L. M. (2010). Multimetric macroinvertebrate index flanders (MMIF) for biological assessment of rivers and lakes in flanders (Belgium). Limnologica - Ecol. Manag. Inland Waters 40, 199–207. doi:10.1016/j.limno.2009.10.001
Gardner, R. C., and Davidson, N. C. (2011). “The ramsar convention,” in Wetlands. Editor B. A. LePage (Dordrecht: Springer Netherlands).
Gerber, A., and Gabriel, M. J. M. (2002). Aquatic invertebrates of South African rivers: Field guide. Pretoria, South Africa: Institute for Water Quality Studies Department of Water Affairs and Forestry, Resource Quality Services.
Getachew, M., Ambelu, A., Tiku, S., Legesse, W., Adugna, A., and Kloos, H. (2012). Ecological assessment of cheffa wetland in the borkena valley, northeast Ethiopia: Macroinvertebrate and bird communities. Ecol. Indic. 15, 63–71. doi:10.1016/j.ecolind.2011.09.011
Gezie, A., Anteneh, W., Dejen, E., and Mereta, S. T. (2017). Effects of human-induced environmental changes on benthic macroinvertebrate assemblages of wetlands in Lake Tana Watershed, Northwest Ethiopia. Environ. Monit. Assess. 189, 152. doi:10.1007/s10661-017-5853-2
Gill, J. A., Sutherland, W. J., and Watkinson, A. R. (1996). A method to quantify the effects of human disturbance on animal populations. J. Appl. Ecol. 33, 786–792. doi:10.1016/s1240-1307(97)86237-1
Haugerud, N. J. (2003). Macroinvertebrate biomonitoring criteria and community composition in seasonal floodplain wetlands of the upper Missouri river. United States: South Dakota University.
Helson, J. E., and Williams, D. D. (2013). Development of a macroinvertebrate multimetric index for the assessment of low-land streams in the neotropics. Ecol. Indic. 29, 167–178. doi:10.1016/j.ecolind.2012.12.030
Hering, D., Feld, C. K., Moog, O., and Ofenböck, T. (2006). Cook book for the development of a Multimetric Index for biological condition of aquatic ecosystems: Experiences from the European AQEM and STAR projects and related initiatives. Hydrobiologia 566, 311–324. doi:10.1007/s10750-006-0087-2
Jones, F. C. (2008). Taxonomic sufficiency: The influence of taxonomic resolution on freshwater bioassessments using benthic macroinvertebrates. Environ. Rev. 16, 45–69. doi:10.1139/A07-010
Jørgensen, S. E. (2010). “Application of ecological indicators for the assessment of wetland ecosystem health,” in Handbook of ecological indicators for assessment of ecosystem health. Editors Sven E. Jørgensen, F.-L. Xu, and R. Costanza Second Edition (Boca Raton: CRC Press).
Jørgensen, S. E. (2005). “Introduction,” in Handbook of ecological indicators for assessment of ecosystem health. Editors S. E. Jørgensen, R. Costanza, and F.-L. Xu (London: CRC Press).
Karr, J. R. (1981). Assessment of biotic integrity using fish communities. Fish. (Bethesda) 6, 21–27. doi:10.1577/1548-8446(1981)006<0021:AOBIUF>2.0.CO;2
Karr, J. R., and Chu, E. W. (1999). Restoring life in running waters: Better biological monitoring. Washington, DC: Island Press.
Karr, J. R., and Chu, E. W. (2000). Sustaining living rivers. Hydrobiologia 422, 1–14. doi:10.1023/A:1017097611303
Karr, J. R., Larson, E. R., and Chu, E. W. (2022). Ecological integrity is both real and valuable. Conserv. Sci. Pract. 4, 1–10. doi:10.1111/csp2.583
Kashian, D. R., and Burton, T. M., 2000. A comparison of macroinvertebrates of two great lakes coastal wetlands: Testing potential metrics for an index of ecological integrity. J. Gt. Lakes. Res. 26, 460–481. doi:10.1016/S0380-1330(00)70708-8
Kerans, B. L., and Karr, J. R. (1994). A benthic index of biotic integrity (B-ibi) for rivers of the Tennessee valley. Ecol. Appl. 4, 768–785. doi:10.2307/1942007
Kingsford, R. T., Basset, A., and Jackson, L. (2016). Wetlands: conservation’s poor cousins. Aquat. Conserv. Mar. Freshw. Ecosyst. 26, 892–916. doi:10.1002/aqc.2709
Kuehne, L. M., Olden, J. D., Strecker, A. L., Lawler, J. J., and Theobald, D. M. (2017). Past, present, and future of ecological integrity assessment for fresh waters. Front. Ecol. Environ. 15, 197–205. doi:10.1002/fee.1483
Lakew, A., and Moog, O. (2015). A multimetric index based on benthic macroinvertebrates for assessing the ecological status of streams and rivers in central and southeast highlands of Ethiopia. Hydrobiologia 751, 229–242. doi:10.1007/s10750-015-2189-1
Liu, D., Liu, L., You, Q., Hu, Q., Jian, M., Liu, G., et al. (2022). Development of a landscape-based multi-metric index to assess wetland health of the Poyang Lake. Remote Sens. 14, 1082. doi:10.3390/rs14051082
Lenat, D. R., and Resh, V. H. (2001). Taxonomy and stream ecology—the benefits of genus- and species-level identifications. J. North Am. Benthol. Soc. 20, 287–298. doi:10.2307/1468323
Leung, A. S. L., and Duudgeon, D. (2011). Scales of spatiotemporal variability in macroinvertebrate abundance and diversity in monsoonal streams: Detecting environmental change. Freshw. Biol. 56, 1193–1208. doi:10.1111/j.1365-2427.2010.02556.x
Lu, K., Wu, H., Xue, Z., Lu, X., and Batzer, D. P. (2019). Development of a multi-metric index based on aquatic invertebrates to assess floodplain wetland condition. Hydrobiologia 827, 141–153. doi:10.1007/s10750-018-3761-2
Lunde, K. B., and Resh, V. H. (2012). Development and validation of a macroinvertebrate index of biotic integrity (IBI) for assessing urban impacts to Northern California freshwater wetlands. Environ. Monit. Assess. 184, 3653–3674. doi:10.1007/s10661-011-2214-4
Marshall, S. A. (2006). Insects: Their natural history and diversity with a photographic guide to insects of eastern North America. Buffalo: Firefly Books.
Martins, I., Macedo, D. R., Hughes, R. M., and Callisto, M. (2020). Are multiple multimetric indices effective for assessing ecological condition in tropical basins? Ecol. Indic. 110, 105953. doi:10.1016/j.ecolind.2019.105953
Masese, F. O., Omukoto, J. O., and Nyakeya, K. (2013). Biomonitoring as a prerequisite for sustainable water resources: A review of current status, opportunities and challenges to scaling up in East Africa. Ecohydrol. Hydrobiology 13, 173–191. doi:10.1016/j.ecohyd.2013.06.004
MEA (2005). Ecosystems and human well-being: Synthesis. Washington, DC: Millennium Ecosystem Assessment.
Melo, S., Stenert, C., Dalzochio, M. S., and Maltchik, L. (2015). Development of a multimetric index based on aquatic macroinvertebrate communities to assess water quality of rice fields in southern Brazil. Hydrobiologia 742, 1–14. doi:10.1007/s10750-014-1957-7
Menetrey, N., Oertli, B., and Lachavanne, J.-B. (2011). The ciept: A macroinvertebrate-based multimetric index for assessing the ecological quality of Swiss lowland ponds. Ecol. Indic. 11, 590–600. doi:10.1016/j.ecolind.2010.08.005
Mereta, S. T., Boets, P., de Meester, L., and Goethals, P. L. M. (2013). Development of a multimetric index based on benthic macroinvertebrates for the assessment of natural wetlands in Southwest Ethiopia. Ecol. Indic. 29, 510–521. doi:10.1016/j.ecolind.2013.01.026
Merritt, R. W., Cummins, K. W., and Berg, M. B. (2008). An introduction to the aquatic insects of North America. Dubuque: Kendall/Hunt Publishing Co.
Miguel, T. B., Oliveira-Junior, J. M. B., Ligeiro, R., and Juen, L. (2017). Odonata (Insecta) as a tool for the biomonitoring of environmental quality. Ecol. Indic. 81, 555–566. doi:10.1016/j.ecolind.2017.06.010
Moges, A., Beyene, A., Kelbessa, E., Mereta, S. T., and Ambelu, A. (2016). Development of a multimetric plant-based index of biotic integrity for assessing the ecological state of forested, urban and agricultural natural wetlands of Jimma Highlands, Ethiopia. Ecol. Indic. 71, 208–217. doi:10.1016/j.ecolind.2016.06.057
Moya, N., Hughes, R. M., Domínguez, E., Gibon, F.-M., Goitia, E., and Oberdorff, T. (2011). Macroinvertebrate-based multimetric predictive models for evaluating the human impact on biotic condition of Bolivian streams. Ecol. Indic. 11, 840–847. doi:10.1016/j.ecolind.2010.10.012
National Research Council (NRC) (2000). Ecological indicators for the nation. Washington, DC: Academic Press.
Nguyen, H. H., Everaert, G., Gabriels, W., Hoang, T. H., and Goethals, P. L. M. (2014). A multimetric macroinvertebrate index for assessing the water quality of the Cau river basin in Vietnam. Limnologica 45, 16–23. doi:10.1016/j.limno.2013.10.001
Nhiwatiwa, T., Dalu, T., and Brendonck, L. (2017). Impact of irrigation based sugarcane cultivation on the Chiredzi and Runde Rivers quality, Zimbabwe. Sci. Total Environ. 587–588, 316–325. doi:10.1016/j.scitotenv.2017.02.155
Odabaşı, D. A., Odabaşı, S., Ergül, H. A., Özkan, N., Boyacı, Y. Ö., Bayköse, A., et al. (2022). Development of a macroinvertebrate-based multimetric index for biological assessment of streams in the Sakarya River Basin, Turkey. Biol. Bratisl. 77, 1317–1326. doi:10.1007/s11756-022-01041-7
Odume, O., Muller, W., Arimoro, F., and Palmer, C. (2012). The impact of water quality deterioration on macroinvertebrate communities in the swartkops river, south Africa: A multimetric approach. Afr. J. Aquat. Sci. 37, 191–200. doi:10.2989/16085914.2012.670613
Pearson, R. G., and Boyero, L. (2009). Gradients in regional diversity of freshwater taxa. J. North. Am. Benthol. Soc. 28, 504–514. doi:10.1899/08-118.1
Plafkin, J. L., Barbour, M. T., Porter, K. D., Gross, S. K., and Hughes, R. M. (1989). Rapid bioassessment protocols for use in streams and rivers: Benthic macroinvertebrates and fish. Washington, DC: U.S. Environmental Protection Agency.
Pinna, M., Marini, G., Mancinelli, G., and Basset, A. (2014). Influence of sampling effort on ecological descriptors and indicators in perturbed and unperturbed conditions: A study case using benthic macroinvertebrates in Mediterranean transitional waters. Ecol. Indic. 37, 27–39. 718. doi:10.1016/j.ecolind.2013.09.038
RcoreTeam, (2022). R: A language and environment for statistical computing. Vienna, Austria: R Foundation for Statistical Computing.
Rosenberg, D. M., and Resh, V. H. (1993). Freshwater biomonitoring and benthic macroinvertebrates. London: Chapman & Hall.
Ruaro, R., and Gubiani, É. A. (2013). A scientometric assessment of 30 years of the Index of Biotic Integrity in aquatic ecosystems: Applications and main flaws. Ecol. Indic. 29, 105–110. doi:10.1016/j.ecolind.2012.12.016
Ruaro, R., Gubiani, É. A., Hughes, R. M., and Mormul, R. P. (2020). Global trends and challenges in multimetric indices of biological condition. Ecol. Indic. 110, 105862. doi:10.1016/j.ecolind.2019.105862
Stoddard, J., Larsen, D., Hawkins, C., Norris, R., and Johnson, R. (2006). Setting expectations for the ecological condition of running waters: The concept of reference condition. Ecol. Appl. 16, 1267–1276. doi:10.1890/1051-0761(2006)016[1267:seftec]2.0.co;2
Suter, G. W. (1993). A critique of ecosystem health concepts and indexes. Environ. Toxicol. Chem. 12, 1533–1539. doi:10.1002/etc.5620120903
Tampo, L., Lazar, I. M., Kaboré, I., Oueda, A., Akpataku, K. V., Djaneye-Boundjou, G., et al. (2020). A multimetric index for assessment of aquatic ecosystem health based on macroinvertebrates for the Zio river basin in Togo. Limnologica 83, 125783. doi:10.1016/j.limno.2020.125783
Thorp, J. H., and Covich, A. P. (2010). Ecology and classification of North American freshwater invertebrates. 3rd ed. San Diego: Academic.
USEPA (2002). Methods for evaluating wetland condition: Introduction to wetland biological assessment. Office of water. Washington, DC: U.S. Environmental Protection Agency.
Whittier, T. R., Stoddard, J. L., Larsen, D. P., and Herlihy, A. T. (2007). Selecting reference sites for stream biological assessments: Best professional judgment or objective criteria. J. North Am. Benthol. Soc. 26, 349–360. doi:10.1899/0887-3593(2007)26[349:srsfsb]2.0.co;2
Wu, H., Lu, K., Lyu, X., and Xue, Z. (2019). A macroinvertebrate multimetric index for the bioassessment of wetlands adjacent to agriculture fields in the sanjiang plain, China. Chin. Geogr. Sci. 29, 974–984. doi:10.1007/s11769-019-1083-6
Yimer, H. D., and Mengistou, S. (2010). Water quality parameters and macroinvertebrates index of biotic integrity of the jimma wetlands, southwestern Ethiopia. J. Wetl. Ecol. 3, 79–99. doi:10.3126/jowe.v3i0.2265
Zedler, J. B., and Kercher, S. (2005). Wetland resources: Status, trends, ecosystem services, and restorability. Annu. Rev. Environ. Resour. 30, 39–74. doi:10.1146/annurev.energy.30.050504.144248
Zewudu, A., Beneberu, G., Minigst, M., and Mezgebu, A. (2022). Development of a multimetric index for assessing the ecological integrity of some selected rivers and streams in the north-eastern part of Lake Tana sub-basin, Ethiopia. Afr. J. Aquat. Sci. 47, 1–10. doi:10.2989/16085914.2021.1933375
Zhang, Y., Leung, J. Y. S., Zhang, Y., Cai, Y., Zhang, Z., and Li, K. (2021). Agricultural activities compromise ecosystem health and functioning of rivers: Insights from multivariate and multimetric analyses of macroinvertebrate assemblages. Environ. Pollut. 275, 116655. doi:10.1016/j.envpol.2021.116655
Keywords: biotic indices, bioassessment, multi-metric index, macroinvertebrate, wetland, wetland index of biotic integrity
Citation: Assefa WW, Eneyew BG and Wondie A (2023) Development of a multi-metric index based on macroinvertebrates for wetland ecosystem health assessment in predominantly agricultural landscapes, Upper Blue Nile basin, northwestern Ethiopia. Front. Environ. Sci. 11:1117190. doi: 10.3389/fenvs.2023.1117190
Received: 06 December 2022; Accepted: 24 January 2023;
Published: 06 February 2023.
Edited by:
Teresa Ferreira, University of Lisbon, PortugalReviewed by:
Rui Manuel Vitor Cortes, University of Trás-os-Montes and Alto Douro, PortugalAgustina Cortelezzi, National Scientific and Technical Research Council (CONICET), Argentina
Copyright © 2023 Assefa, Eneyew and Wondie. This is an open-access article distributed under the terms of the Creative Commons Attribution License (CC BY). The use, distribution or reproduction in other forums is permitted, provided the original author(s) and the copyright owner(s) are credited and that the original publication in this journal is cited, in accordance with accepted academic practice. No use, distribution or reproduction is permitted which does not comply with these terms.
*Correspondence: Workiyie Worie Assefa, d29ya2l5ZTIwMDhAZ21haWwuY29t