 Keyu Chen1
 Yaguai Yu
 Pengtao Jiang
 Hanlu Bao
- 1Business School, Ningbo University, Ningbo, Zhejiang, China
- 2Donghai Academy, Ningbo University, Ningbo, Zhejiang, China
- 3Nottingham University Business School China, University of Nottingham Ningbo China, Ningbo, Zhejiang, China
- 4School of Information Science and Engineering, NingboTech University, Ningbo, China
- 5Business School, Wenzhou-Kean University, Wenzhou, Zhejiang, China
Based on the data of 253 A-share listed new energy enterprises from 2010–2021, this paper studies the correlations among equity incentives, the three contract elements of equity incentives and the financial performance of new energy enterprises by using fixed-effect regression analysis, and on this basis, Granger causality analysis is applied to determine the causal relationship, and finally, the degree of influence of equity incentives contract elements is further studied by Grey Relational Analysis. It is found that equity incentives positively affect the financial performance of new energy enterprises as a whole. In terms of the choice of equity incentive contract elements, the influence is more significant when the granting method is stock options, when the exercise duration is longer, and when the exercise conditions are stricter. As to the degree of influence, the influence of equity incentive method and exercise conditions on the financial performance of new energy enterprises is greater, but the influence of exercise duration is the lowest. Therefore, it is suggested that new energy enterprises can choose more stock options for equity incentives, create stricter exercise conditions and set the duration of the equity incentive scheme between 5 and 10 years with their own characteristics.
1 Introduction
As one of the emerging strategic industries, the new energy industry is gaining more and more national attention for its ecological, environmental protection and energy-saving advantages, and the importance of the new energy industry has been mentioned in the 14th Five-Year Plan for National Economic and Social Development and the Long-Range Objectives Through the Year 2035. With the innovation and development of science and technology, the new energy industry has made great achievements and reached a certain scale, and new energy enterprises are also getting more and more attention. However, new energy enterprises have encountered some obstacles in their development, such as low technology levels, high resource consumption, and not-standardized internal management. At present, there are relatively few studies on the financial performance of listed new energy enterprises at home and abroad, and the impact of corporate equity incentives on their financial performance has not been comprehensively explored. The current domestic research on equity incentives mostly takes A-share enterprises, state-owned enterprises, non-state-owned enterprises and other broad categories as research samples, but there are few studies focusing on a particular area. Due to the existence of a principal-agent relationship within each new energy enterprise, the issue of equity incentives should be paid attention to, and this paper will conduct an empirical study on the relationship between equity incentives and the financial performance of new energy enterprises, which is of certain significance to solve the principal-agent problem and thus promote the further development of new energy enterprises.
This paper takes listed enterprises of new energy as the research sample, and distinguishes between equity incentive or not, equity incentive method, exercise duration and exercise conditions based on incentive theory and residual claim theory, and tests the hypotheses by fixed effects regression model. Then, this paper conducts one-way causation analysis on the impact of equity incentives on the financial performance of new energy enterprises on basis of Granger causality analysis approach, and also further investigates the degree of impact of equity incentive contract elements on the financial performance of new energy enterprises by Grey Relational Analysis. Based on the above analysis, this paper proposes feasible suggestions for the future equity incentive schemes of new energy enterprises.
The contributions of this paper include the following: First, in terms of research method, this paper uses fixed-effect regression analysis, Granger causality analysis and gray correlation analysis, the combination of the three research methods increases the breadth and depth of this paper and enhances the credibility of the conclusion. Secondly, in terms of the research aims, most of the existing researches focus on A-shares, and few focus on equity incentives of new energy enterprises. New energy enterprises are significant to the strategic emerging industries, therefore, the importance of research on the equity incentives of new energy enterprises is self-evident.
This paper is structured as follows: Part I is the introduction, Part II is the literature review and hypothesis development, Part III is the research design, Part IV is the empirical results, Part V is the research conclusion and recommendations.
2 Literature review and hypothesis development
2.1 Literature review
Foreign scholars started to study the financial performance evaluation of enterprises earlier than Chinese scholars, and the early evaluation methods were the Balanced Score Card, DuPont Analysis, Economic Value Added Approach, etc. With further research, more and more scholars have integrated multiple factors in their studies to evaluate enterprise financial performance, such as Flynn (Flynn, 2010) and Miller and Breton (Miller and Breton, 2011) who integrated multiple financial performance indicators to assess financial performance comprehensively. Domestic scholars mainly focus on various ratios after relevant calculation processing by using accounting data, Zhou Yunbo and Zhang Jingwen (Zhou and Zhang, 2020) selected ROA and ROE adjusted by annual industry mean value as a measure of financial performance indicators. Wang Tao and Hu Minjie (Wang and Hu, 2015) selected six indicators of financial performance such as ROA, ROE and TAG. However, there are also many people who believe that financial performance indicators are complex, and that is not very accurate to judge financial performance with a few simple indicators alone. Therefore, a number of scholars have established financial performance indicator models through factor analysis (Yu et al., 2022a). For example, Cheng Longyun and Yue Chunmiao (Cheng and Yue, 2008) used factor analysis to calculate the comprehensive evaluation value of financial performance of enterprises each year. Hou Xiangding (Hou, 2021), Tong Yuanke and Wei Yunjie (Tong and Wei, 2021) all used factor analysis to extract the financial performance characteristic factors to construct the index system.
There is no unified view on the impact of equity incentives on financial performance, and the common views are divided into four categories: positive, negative, non-significant and curvilinear relationship between equity incentives and financial performance. The majority of scholars agree that equity incentives are positively related to the enterprise financial performance (Yu et al., 2022b). Early foreign scholars, represented by Jensen and Meckling (Jensen Michael and Meckling William, 1976), put forward the convergence of interests hypothesis, which deems that equity incentives provide executives with residual claims on corporate assets, which leads to the formation of a community of shared interests between executives and shareholders and can improve corporate performance. Domestic scholars Shen Xiaoyan and Wang Yuetang (Shen and Wang, 2015) studied 577 listed companies that implemented equity incentives between 2006 and 2010 and found that the financial performance of the companies improved after the implementation of equity incentives. Ma Lianfu and Ding Zhensong (Ma and Ding, 2017) empirically studied the impact of equity incentives on the financial performance of state-owned enterprises and found that executive shareholding could significantly contribute to the improvement of return on total assets. Chen Wenqiang (Chen, 2018) and Zhang Jinsong (Zhang and Zhang, 2021) both found that equity incentives can improve the financial performance of enterprises at growth stage.
At present, domestic and foreign researches on the equity incentive contract elements mainly contains three key elements: equity incentive method, exercise duration and exercise conditions. Regarding the research on equity incentive method, scholars have different views. For example, Sheikh (Sheikh, 2012), Liu Guangsheng and Ma Yue (Liu and Ma, 2013) found that the incentive effects of stock options on R&D investment is better than that of restricted stock. Xiao Shufang et al. (Xiao et al., 2016) concluded that listed companies should develop different equity incentive schemes by combining the characteristics of incentive objects. As to the research on the exercise duration, most scholars believe that equity incentive schemes with longer exercise duration tend to have better financial performance. Chang et al. (Chang et al., 2015) and Wang Shuxun et al. (Wang et al., 2017) discovered that equity incentive schemes with exercise duration longer than 5 years can bring more significant implementation effects to listed companies. Shi Qi et al. (Shi et al., 2020) maintained that the design of stock option contract elements with longer incentive duration can better exploit the stock option’s risk-taking effect and affect corporate performance. There is no unified view on the study of exercise conditions, but some scholars believe that strict exercise conditions should be set, Chen Shengjun et al. (Chen et al., 2016) argued that enterprises can set stricter performance conditions in order to achieve better results, but some scholars do not think so. Bettis et al. (Bettis et al., 2010) suggested that less strict conditions for the use of equity incentive schemes can make the impact of equity incentives more effective, and He Yan et al. (He et al., 2019) argued that a reasonable exercise price can produce optimal incentive effects by selecting panel data for almost a decade.
In general, scholars have conducted a detailed study on equity incentives, but few scholars have further studied the degree of influence of equity incentive contract elements on enterprises, and there is still a lack of in-depth research on new energy enterprises in terms of sample selection. Based on the existing literature, this paper takes the listed enterprises of new energy as the research object, adopts factor analysis to design financial performance indicators, studies the influence of equity incentives on financial performance, conducts one-way causation analysis based on Granger causality analysis, and further studies the degree of influence of equity incentive contract elements, in order to enhance the effect of equity incentives and improve the financial performance of new energy enterprises.
2.2 Hypothesis development
2.2.1 The impact of equity incentives on the financial performance of new energy enterprises
According to the content of incentive theory, equity incentives as a long-term incentive method, avoid the short-sighted behaviors brought by short-term incentive effect (Cao and Zhan, 2003), and it can mobilize employees’ motivation, manipulate and guide their behaviors, make the owner and operator’s goals consistent, and in order to obtain a generous return of equity incentives, the operator should work in the direction of enterprise value enhancement and improve the performance of the enterprise, and thus maximize their own interests and achieve a win-win situation for both shareholders and operators (Lin and Liu, 2017). According to the view of residual claim, if executives and core employees do not enjoy residual claim, the compensation they receive will depend on the short-term performance of the enterprise, and the existence of moral hazard and adverse selection leads them to have higher expectations of good short-term performance, then their goals will be different from those of shareholders. The implementation of the equity incentive plan makes the shareholders not the only recipients of the residual income, but the management and employees of the enterprise jointly gain the right to share the corporate income (Ruan and Yang, 2013), and employees also become the beneficiary of the residual income, and in the long run, the goals of the employees and shareholders are aligned and work together to maximize the interests of the enterprise (Shen and Wang, 2015). It is unclear whether the domestic market can get the same impact of equity incentives as the foreign market. However, a large number of scholars have done relevant studies as of today, most of whom believe that equity incentives can have a positive impact on corporate financial performance (Zhang and Zhang, 2021). As an incentive, equity incentives are not only beneficial to the stability of talents in new energy enterprises, but also enable management to look farther, develop advanced technology, strive to improve corporate governance, and pay attention to long-term development, thus enhancing corporate financial performance. Based on the above analysis, Hypothesis 1 was put forward.
H1. In listed enterprises of new energy, equity incentives positively affect the financial performance of new energy enterprises.
2.2.2 The impact of the equity incentive methods on the financial performance of new energy enterprises
In China, the restricted stock incentive method and stock option incentive method are more favored by China’s listed new energy enterprises, and the sample size of enterprises choosing other equity incentive methods is small, so this paper only studies the effect of these two incentive methods on corporate performance.
The existing literature generally agrees that the two types of incentives can positively affect the financial performance of enterprises. However, there is no unanimous conclusion as to which of the two types of methods is more effective, but most scholars believe that stock option is more effective than restricted stock (Sheikh, 2012; Liu and Ma, 2013; Xiao et al., 2016). The grantees of stock options must ensure that the corporate performance can grow after meeting the exercise conditions in order to obtain potential gains, and the basic characteristics of stock options determine that they are more motivating than restricted stock. The grantees of restricted stock usually purchased the company’s restricted stock at a discount and they are only allowed to dispose of these stock if their performance goals and years of service meet the contractual requirements. Unlike the valuation of restricted stock, stock options are call options. For call option holders, an increase in the stock price can be profitable and the maximum loss is limited if the stock price falls, while an increase in stock price volatility increases the value of the call option. In other words, an increase in the company’s stock price and an increase in stock volatility can add the value of the call option, so its incentive effect may be more effective. Therefore, Hypothesis 2 was proposed in this paper.
H2. In listed new energy enterprises, the incentive effect of equity incentives on financial performance is more significant when the granted method is stock options.
2.2.3 The impact of exercise duration on the financial performance of new energy enterprises
The longer the duration of the equity incentives is, the higher the requirements for the ultimate exercise by the incentive recipients is. This is because that each business cycle is linked to the performance conditions for the incentive recipients, and the performance targets set in the performance conditions may be achieved by means of manipulating revenue or costs in the short term, but in the long term, it is difficult to realize continuous manipulation due to the restrictions of supervision and disclosure. The new energy industry is at the early stage of development, and its demand for technology research and development is relatively higher and requires a certain level of innovation capability. An innovation project often takes a long time from the initial investment to the final return, which is particularly evident in the energy sector. Longer incentive schemes allow employees to share the long-term benefits of innovative activities more effectively and encourage the incentive recipients to focus more on the long-term performance of the new energy enterprises, rather than just try to achieve better short-term results. From the human capital perspective, a longer operating period is beneficial for enterprises to retain valuable human capital because innovative activities are usually not achieved overnight and require a long-term track to realize. Shuxun Wang et al. (Wang et al., 2017) found through their study that longer exercise duration of equity incentives can promote the increase in innovation output and thus improve corporate performance. Equity incentives usually have a long waiting period, and the incentive recipients must work for the company long enough for the waiting period to take effect (Chang et al., 2015). Theoretically, the longer the exercise duration of the equity incentives, the longer the time the equity incentives are used to promote innovation, and the more consistent the incentive recipients’ personal interests are with the long-term value of new energy enterprises, and therefore the better the financial performance of the enterprises. Based on the above analysis, Hypothesis 3 was put forward.
H3. In listed new energy enterprises, the longer the exercise duration of the equity incentive scheme, the more beneficial it is to improve the financial performance of the enterprises.
2.2.4 The impact of exercise conditions on the financial performance of new energy enterprises
Exercise conditions are the performance targets that the incentive recipients of the equity incentive scheme must achieve within the performance period, which can be divided into strict and loose targets, and the incentive effects of equity incentives vary under different exercise conditions (Lv et al., 2009). Shengbao Zhai and Ziwei Chen (Zhai and Chen, 2016) argued that the incentive recipients are likely to use their power to influence the board of directors to design a scheme that is favorable to them in the process of designing an equity incentive scheme. According to the existing literature, most scholars believe that equity incentive schemes with strict exercise conditions are more effective, because strict exercise conditions bind the incentive recipients to a certain extent, and incentive recipients who wish to earn more residual income will try to maintain the company’s performance and ensure the growth of financial performance, therefore bringing greater and long-term benefits to the enterprise (Lu et al., 2013). Meanwhile, many scholars have proposed a combination of multiple indicators for assessment as to how to set strict exercise conditions, and the indicators should preferably include multiple types (Dechow and Sloan, 1991; Sautner and Weber, 2006; Lu et al., 2013). According to the above views, this paper argues that if the equity incentive exercise conditions are too loose, it is equivalent to giving welfare to the incentive recipients, so enterprises will find it difficult to curb the self-interest of the management. In order to avoid the fraudulent behavior of managers and to achieve a better effect of equity incentive implementation, enterprises should establish more strict performance conditions. Therefore, Hypothesis 4 was proposed in this paper.
H4. In listed new energy enterprises, setting relatively strict exercise conditions for equity incentive schemes is more conducive to improving the financial performance of enterprises.
3 Study design
3.1 Sample selection and data sources
In 2016, the State Council released the “Thirteenth Five-Year Plan for the Development of National Strategic Emerging Industries”, emphasizing the importance of strategic emerging industries, of which the new energy industry is a member, and its importance cannot be overstated. With the global emphasis on energy transformation and China’s “double carbon” goal, developing new enterprises and increasing the proportion of new energy in energy discipline has been the key goal. To develop new energy, technical talents are indispensable. For enterprises, they need to inves in R&D and keep core talents through equity incentives. Therefore, this paper takes the listed new energy enterprises as the research object to study the equity incentive and its contractual elements, so as to make a more reasonable equity incentive plan for new energy enterprises and improve the efficiency of equity incentive of new energy enterprises.
The research sample selected in this paper is the data of 253 new energy enterprises listed on A-share in China from 2010 to 2021. New energy enterprises refer to all enterprises involved in the complete new energy industry chain, including research and development, equipment manufacturing, production and supply, comprehensive utilization, etc. Considering that some new energy enterprises are still at the initial stage, their data is not informative, so a total of six industries are selected: photovoltaic, wind power, nuclear energy, energy saving, geothermal energy and new energy vehicles. As a variety of sample data is required to measure the financial performance of enterprises, this paper removes a-year sample when a variable of sample enterprise is missing. In addition, some samples with abnormal and missing data are deleted to ensure the validity of the data. The specific data treatment is as follows: 1) The research sample of this paper only includes A-share listed enterprises. 2) Enterprises that receive special treatment from China Securities Regulatory Commission are removed from sample data. 3) Enterprises that have implemented equity incentives in forms other than restricted stock and stock options are also removed. Finally, a total of 2,258 valid observations are obtained.
The financial data involved in this paper are mostly derived from Wind database, and some of the missing financial data are manually compiled from CSMAR database, and the relevant analysis and empirical process uses Excel and StataSE15 software.
3.2 Research methodology
3.2.1 Construction of a factor analysis model for financial performance of new energy enterprises
In this paper, we use factor analysis to determine the final financial performance indicators, and through factor analysis, these multiple indicators are formed into a comprehensive indicator FP for subsequent analysis. Let
3.2.2 Constructing a fixed-effects model of the impact of equity incentives on the financial performance of new energy companies
In this paper, we use the composite financial performance indicator FP as the dependent variable and select equity incentive, equity incentive method, exercise period and exercise condition as the independent variables to study their effects on financial performance.
In order to test the four hypotheses proposed in the previous paper, the following four fixed-effects models are constructed to analyze the relationship between the dependent and independent variables.
Eq. (2) is used to test hypothesis 1, whether equity incentives positively affect financial performance in listed new energy companies.
Eq. (3) is used to test hypothesis 2, whether the incentive effect of equity incentive on financial performance is more significant when the granting method is stock options in listed new energy enterprises.
Eq. (4) is used to test hypothesis 3, whether the longer the validity period of the equity incentive program is, the more beneficial it is to improve the financial performance of the enterprise in listed new energy enterprises.
Eq. (5) is used to test hypothesis 4, whether the longer the exercise period of the equity incentive program is, the better the financial performance of the listed new energy companies.
3.2.3 A causal analysis model of the impact of equity incentives on the financial performance of new energy companies
The causal analysis model used in this paper is the Granger causal analysis model. Granger (2003) indicates that the purpose of testing causality between panel data is to verify that the causal relationship between all cross-sections corresponding to each other holds. This hypothesis has a high intensity. In this regard, in this study, the panel Granger causality test proposed by Dumitrescu and Hurlin (2012) is chosen, and this method is based on the cross-sectional Wald statistic, which provides a comprehensive analysis of the link between cross-sections and panels, and provides a reasonable explanation of whether the causal relationship between the panel data holds.
In the Granger causality test, two panel data sets,
In the above model, the number of lag orders is K and all cross-sectional fixed effects intercept terms are
3.2.4 A model of the degree of influence of equity incentive contract elements on the financial performance of new energy companies
In this paper, the gray correlation analysis method (Deng, 1990), pioneered by Professor Deng Julong in 1982, is used to study the degree of influence of the equity incentive method, exercise period and exercise conditions on the financial performance of new energy companies.
The analysis steps are as follows.
First, determine the evaluation objects and evaluation criteria. Let there are
Next, the reference and comparison series are dimensionlessized. Let the dimensionless reference series be
Where
Again, the gray correlation coefficients are calculated as follows.
To compare the correlation coefficients of the series
Then, the gray weighted correlation is calculated, and the gray enhanced correlation is calculated as:
where
Finally, the analysis is evaluated based on the magnitude of the gray weighted correlation.
3.3 Variable categories and metrics
3.3.1 Measures of explained variables
The explanatory variable in this paper is corporate financial performance, and factor analysis is used in this paper to determine the final financial performance indicators. In recent years, domestic and foreign research literature has also applied factor analysis extensively to establish the financial evaluation system (Cheng and Yue, 2008; Xu and Shi, 2010; Hou, 2021; Tong and Wei, 2021), taking into account Shu Xiaohui’s “Research on the Evaluation Methodology and Visualization of Financial Performance of Listed Companies” (Shu, 2013) and the revised “Operating Rules for Enterprise Performance Evaluation” by the Ministry of Finance in 2002, and statistics on the frequency of use of each indicator, as well as the characteristics of new energy enterprises that are in the transition from the start-up period to the growth period, this paper selects a total of 13 indicators in the categories of profitability, Operating capacity, solvency and development capacity, a total of 13 indicators are selected in this paper, as shown in Table 1.
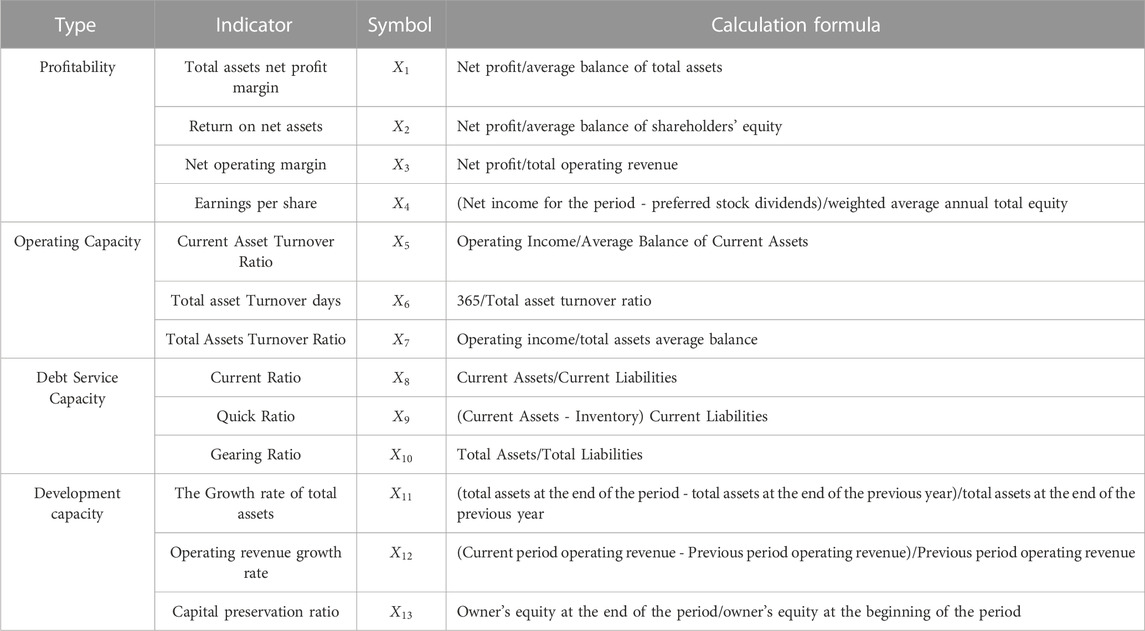
TABLE 1. Composition of comprehensive financial index system.
3.3.2 Metrics of other variables
(1) Explanatory variables
POST: equity incentive indicators. The research subjects in this paper are all annual indicators, and considering the lag of equity incentive, the time dummy variable here takes the value of 0 before the implementation of the equity incentive plan, and takes the value of 1 in the year of the implementation of the equity incentive plan and the next 3 years.
SO: Equity incentive method indicator. Classification according to the Company Law of the People’s Republic of China, It takes 1 for companies using stock options as the incentive method and 0 for companies using restricted stock as the incentive method.
Duration: the indicator of exercise period. According to the Company Law of the People’s Republic of China, the exercise period refers to the period from the date of announcement of the equity incentive plan to the final expiration date.
Condition: Exercise condition indicator. Therefore, in this paper, referring to Lv Changjiang (Ruan and Yang, 2013), all the enterprises with exercise conditions higher than the first 3 years are defined as enterprises with strict exercise conditions and denoted by dummy variable 1; other companies are defined as enterprises with loose exercise conditions and denoted by dummy variable 0. When the equity incentive plan has multiple performance conditions, all performance conditions with financial ratios no lower than the average of the previous 3 years are defined as strict exercise conditions and denoted by dummy variable 1, while all exercise conditions with financial ratios lower than the average of the previous 3 years are defined as loose exercise conditions and denoted by dummy variable 0.
(2) Control variables
ES: firm size, which is expressed as the natural logarithm of the firm’s total assets. The size of the company has an impact on the financing ability and R&D capability of new energy companies.
CPS: Capital structure, expressed as the gearing ratio. The capital structure of a company is one of the most important indicators for corporate assessment and one of the common control variables for regression analysis. New energy companies need to raise capital to obtain development, so they need to weigh the financing risk against the profit output.
OC: Equity concentration, expressed as the percentage of shares held by the 10 largest shareholders of the company. China’s capital market is not yet perfect, and many managers of enterprises are shareholders, and this part may interfere with the formulation of specific conditions of equity incentives, from which they seek benefits for themselves and harm the interests of small and medium shareholders.
IBR: Enterprise growth, using the growth rate of operating income to express the growth of the company. The growth of the company will affect the future judgment of the incentive recipients. The incentive recipients of companies with good growth are more willing to accept the equity incentive because of the higher possibility of gaining benefits in the future, while the incentive recipients of companies with low growth may have lower confidence in the equity incentive plan.
The specific variable categories and variable explanations in this paper are shown in Table 2.
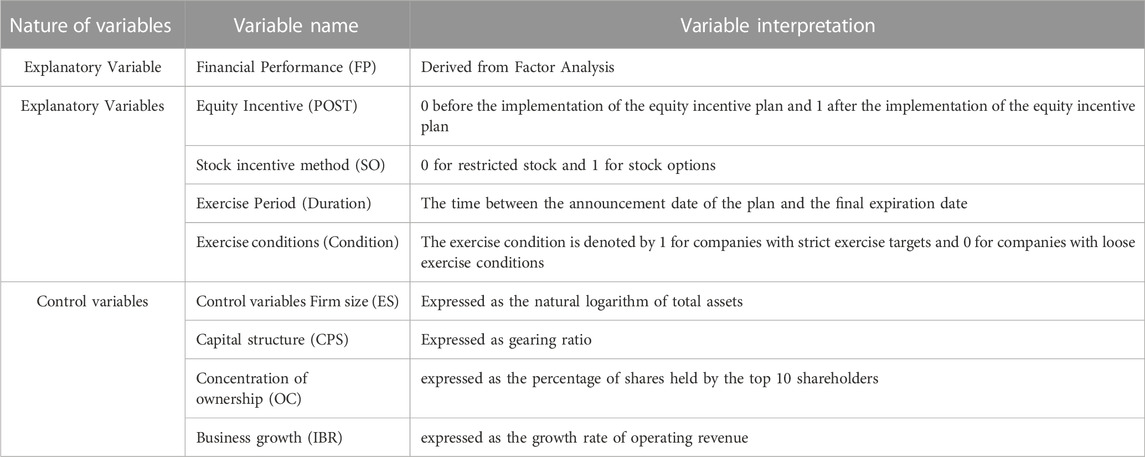
TABLE 2. Categories of variables and methods of definition.
4 Empirical results
4.1 Financial performance evaluation indicators
According to the experimental design, the financial indicators were selected in total as return on net assets (
Using stata software, the eigenvalues and variance contribution rates of each factor were derived, and the model extracted four common factors as
The scores of each factor were calculated and the composite score was calculated as shown in Table 3.
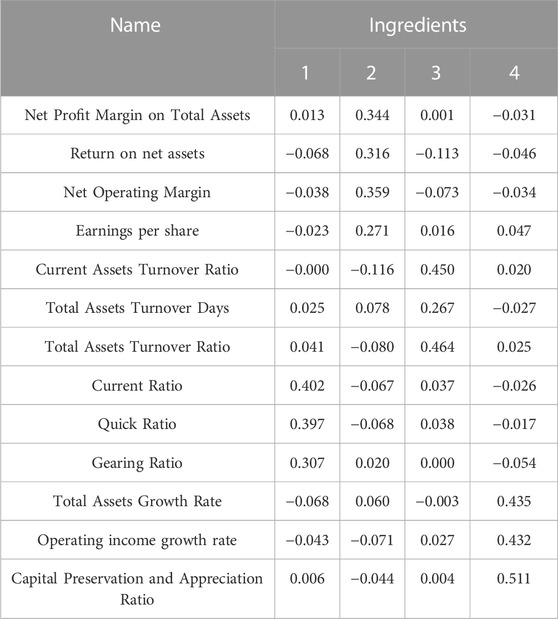
TABLE 3. Component score coefficient matrix.
Finally, after obtaining the formulae for the four common factors, the composite financial performance index (FP) of new energy enterprises is calculated based on the principal component coefficients to obtain Eq. (9).
4.2 Descriptive statistics and correlation analysis
Table 4 shows the descriptive statistical analysis results of the main variables. In this paper, a total of 2258 valid observations are obtained for the A-share listed new energy enterprises from 2010–2021. Among them, the mean value of equity incentives (POST) is 0.241, so enterprises choose more restricted stock for equity incentives than stock options. The mean value of exercise duration (Duration) is 3.147, and the standard deviation is 2.528, so most enterprises have exercise duration below 5 years. The mean value of exercise conditions (Condition) is 0.472, and the standard deviation is 0.5. In general, there are more enterprises with loose exercise conditions than those with strict exercise conditions. The standard deviation of enterprise size (ES) is 1.296 after taking the logarithm, and the gap between the distribution of assets before the enterprises is obvious. The standard deviation of capital structure (CPS) is 0.187, and in general, the capital structure of the sample is relatively similar. The ownership concentration (OC) of most enterprises is below 50%, so their concentration is relatively low. The average value of corporate growth (IBR) is 20.974, and the difference between the maximum and the minimum is large. The mean value of enterprise growth (IBR) is 20.974, with a large difference between the maximum and minimum values, indicating a larger gap in growth between different enterprises. Financial performance (FP) has a maximum value of 4.966 and a minimum value of −4.875, with a large difference. This is because the factor analysis method synthesizes 13 indicators, and the data itself has large differences, and the synthesized indicators are also affected by these differences, but the data analysis is more comprehensive and is not biased.

TABLE 4. Descriptive statistics of main variables.
The correlations of the main variables can be reached from Table 5, and specific analysis shows that.
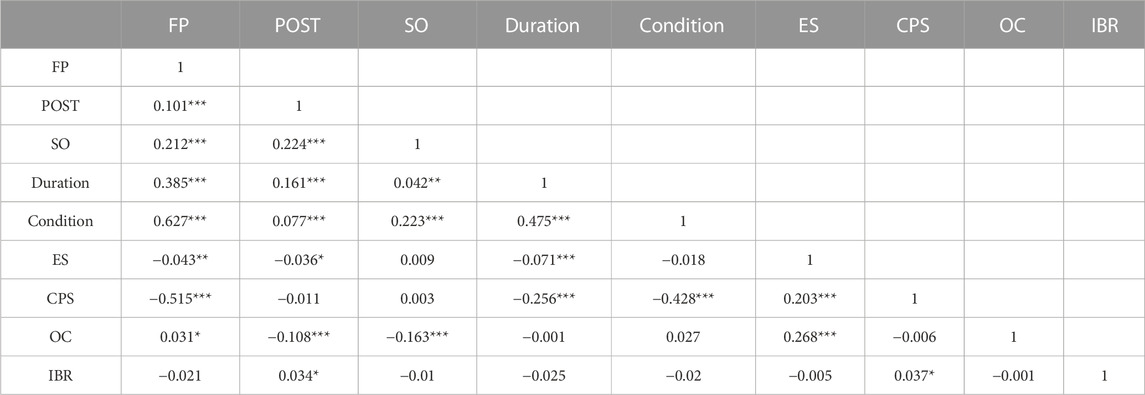
TABLE 5. The pearson correlation coefficient between the main variables.
Equity incentive and financial performance and three equity incentive contract elements equity incentive, equity incentive method and exercise period are significantly correlated at the 1% level, indicating that equity incentive has an impact on corporate financial performance, which initially verifies the four hypotheses content of this paper. In addition, the correlation coefficient values between equity incentives and a total of three control variables, namely, firm size, capital structure and equity concentration, show significance. However, the correlation analysis of variables can only get the preliminary relationship between variables and cannot draw accurate conclusions, and more precise relationships are to be further developed in the regression analysis.
4.3 Analysis of regression results
Hypothesis 1 is first tested and regression analysis is performed on Eq. (2). Since the model data studied in this part of the regression are panel data, the hausman test is performed first to judge the model. According to the hausman test, a p-value of 0.0001 is obtained, so the original hypothesis is strongly rejected and therefore a fixed effects model should be used.
In this section, overall equity incentive (POST) is used as the explanatory variable in Eq. 2 and the composite indicator of corporate financial performance (FP) is used as the explanatory variable in Eq. 2. The regression results are shown in Table 6.
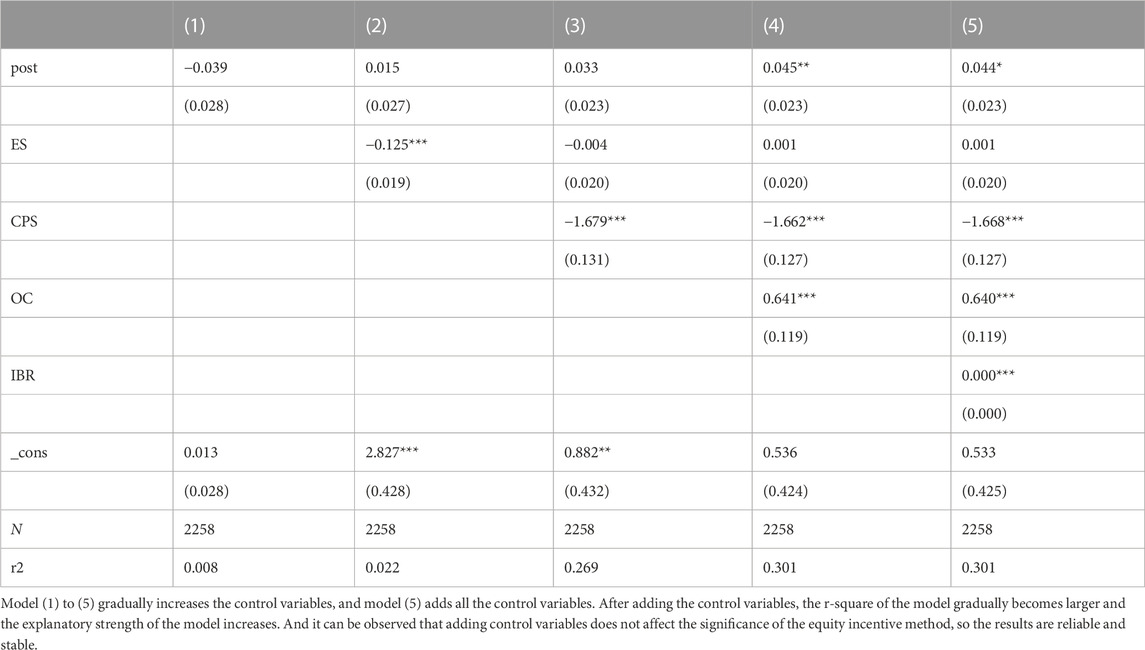
TABLE 6. Regression analysis of equity incentives and financial performance of new energy companies.
The coefficient of equity incentives and corporate financial performance is 0.044, and the two are significantly positively correlated at the level of 0.1, indicating that there is a positive correlation between equity incentives and corporate financial performance for the sample enterprises, and the Hypothesis 1 is initially valid. The regression results show that corporate size has a negative impact on financial performance, which may be related to the characteristics that most of the new energy enterprises are in the growth period. During the growth period, the smaller the size of the enterprise is, the more the equity incentives can cover the management and even the technological employees, and the greater the impact on the overall financial performance is. Capital structure and financial performance are negatively correlated. New energy enterprises are different from traditional enterprises with strong foundation, and if they carry too much debt, it may have a negative impact on the enterprises by putting great pressures. Ownership concentration is positively correlated with financial performance. A high degree of ownership concentration can play a better role in monitoring the behaviors of management and reducing agency costs. Enterprise growth is positively correlated with financial performance and is significant at the level of 0.01, which is consistent with the basic hypothesis that the higher the enterprise growth, the higher the incentive recipient’s expectations of high future income and the motivation to work will increase, and at the same time such enterprises also face less capital pressures and can have better financial performance.
To test hypothesis 2, this section uses the equity incentive approach (SO) as the explanatory variable in Eq. 3 and the composite indicator of corporate financial performance (FP) as the explanatory variable in Eq. 3, and the regression results are shown in Table 7.
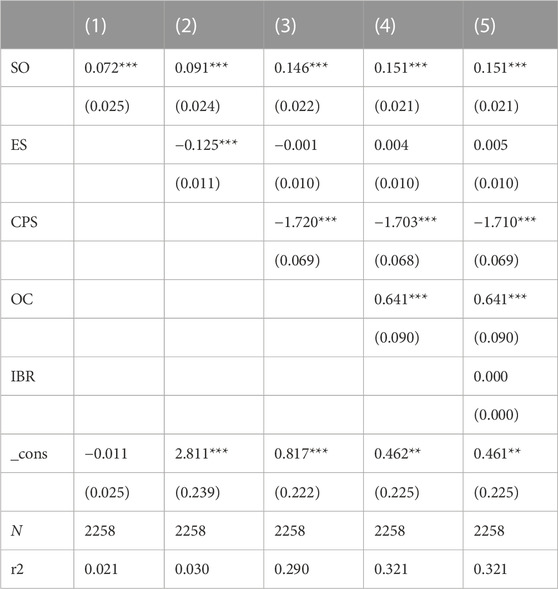
TABLE 7. Regression analysis of equity incentive method and financial performance of new energy companies.
Table 7 shows the regression results of the effect of equity incentive method on corporate financial performance, after controlling for other factors, the SO coefficient is 0.151, which is significantly correlated at the 0.01 level, which means that companies that choose stock options will have better financial performance compared to restricted stock, and also company size and capital structure are significant, and hypothesis 2 is initially valid.
In order to test hypothesis 3, this section uses the exercise validity period (Duration) as the explanatory variable of Formula (4) and the explanatory variable of the composite indicator of corporate financial performance (FP) Formula (4), and the regression results are shown in Table 8.

TABLE 8. Regression analysis of exercise period and financial performance of new energy companies.
Table 8 shows the regression results of the effect of exercise validity period on the financial performance of new energy enterprises, after controlling for other factors, the Duration coefficient is 0.045, which is significantly correlated at the level of 0.01, while the four control variables capital structure and equity concentration are significant, and these regression results initially verify that hypothesis 3 holds, indicating that in listed new energy enterprises, the equity incentive program The longer the effective period, the more beneficial to improve the financial performance of the enterprise. This may be because the improvement of financial performance brought by equity incentives often requires companies to carry out technological innovation, investment projects, etc., and their impact on their financial performance is time-bound, and the R&D process is longer, plus it still takes time to convert how the research results are converted into profits, so this is an important reason why the longer the validity period of equity incentive programs is more beneficial to the improvement of corporate financial performance.
In order to test hypothesis 4, this section uses the exercise condition (Condition) as the explanatory variable of Eq. 5 and the composite indicator of corporate financial performance (FP) as the explanatory variable of Eq. 5, and the regression results are shown in Table 9.
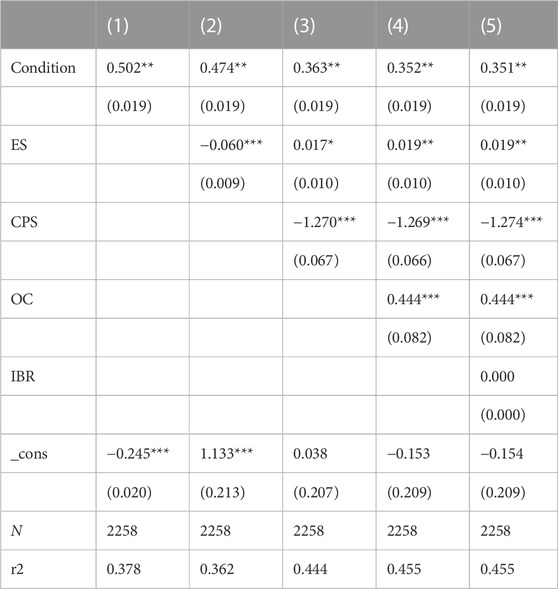
TABLE 9. Regression analysis of exercise conditions and financial performance of new energy companies.
Table 9 shows the regression results of the effect of exercise conditions on the financial performance of new energy enterprises. After controlling other factors, the coefficient of Condition is 0.351, and the independent variable exercise conditions is statistically significant with the financial performance of enterprises, and hypothesis 4 is initially valid, that is, in listed new energy enterprises, setting relatively strict exercise conditions for equity incentive programs is more conducive to improving the financial performance of enterprises. For the equity incentive, the exercise conditions are difficult to achieve, which can make the employees more motivated and really make the incentive targets operate the enterprise according to the principle of maximizing shareholders’ value. If the exercise conditions are set too simple, it may become an opportunistic way to seek benefits for the incentive recipients.
4.4 Robustness test
To further confirm the effect of equity incentive and equity incentive covenant elements on corporate financial performance, a robust type test was conducted by changing the corporate financial performance variable (FP) to return on net assets (ROE) and return on assets (ROA) to re-run the regressions, and the regressions of equity incentive (POST), equity incentive method (SO), exercise period (Duration), and exercise condition (Condition) and return on net assets (ROE) are regressed in Tables 10, 11, and all three contractual elements of equity incentive and equity incentive are significantly correlated at the level of 0.1 and above.
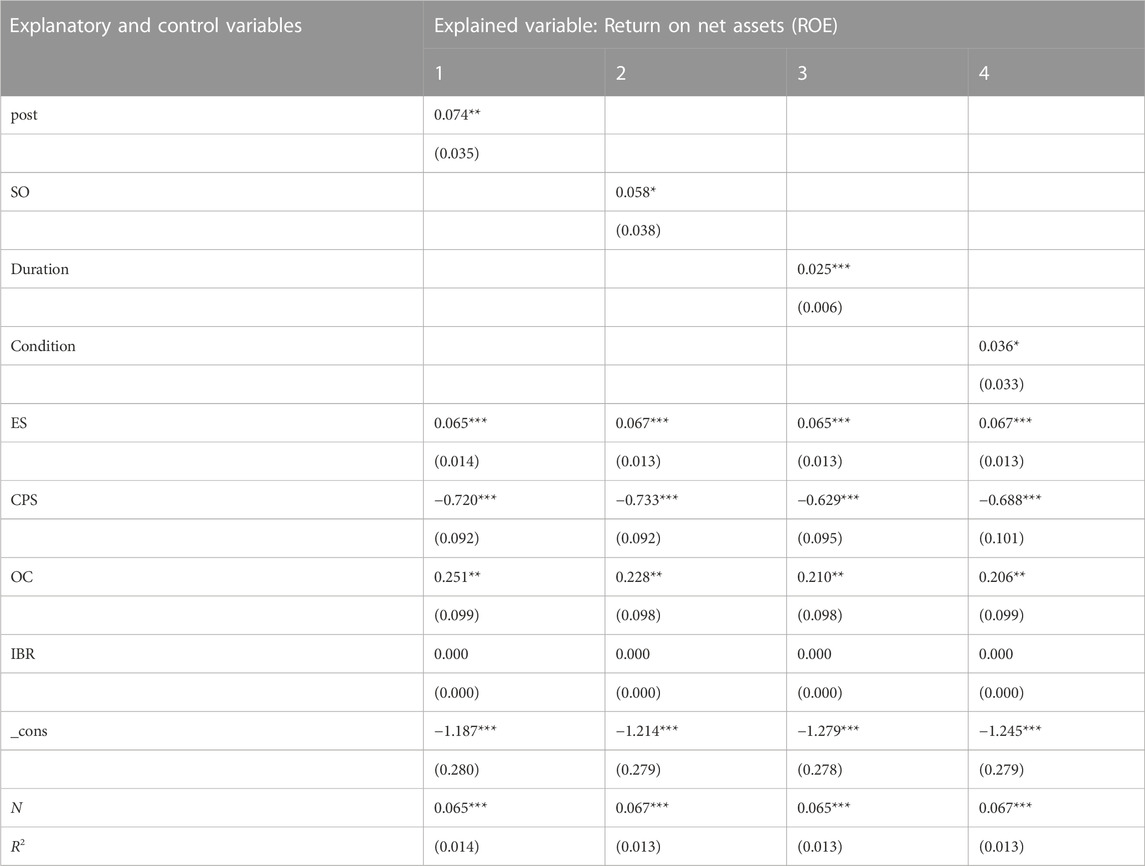
TABLE 10. Robustness test results1.
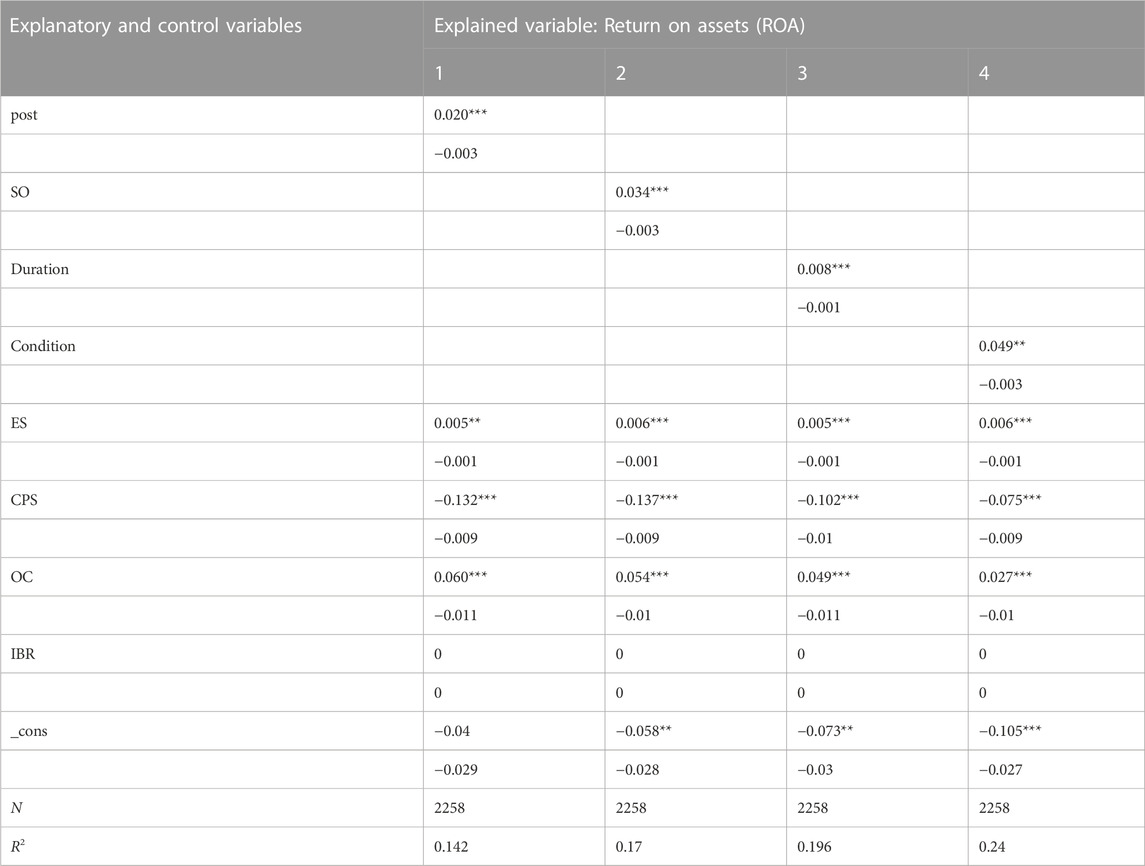
TABLE 11. Robustness test results2.
Regression analysis with tobit regression instead of fixed effects, the regression results can be obtained in Table 12, which shows that the results are still significant and the sign is as expected, hypothesis 1, hypothesis 2, hypothesis 3 and hypothesis 4 are verified, and this paper passes the robustness test.

TABLE 12. Robustness test results3.
4.5 Causal analysis of equity incentives on financial performance of new energy enterprises
Despite of the significant results of the above regression analysis, it does not directly prove that it is indeed the equity incentives that affect the financial performance of enterprises, which is mainly due to the endogeneity of equity incentives. First of all, the relationship between equity incentives and financial performance may supplement each other, which means that equity incentives can improve financial performance and that only enterprises with good financial performance are more likely to choose equity incentives to reward employees. Second, some of the key variables may not be considered in the model. Finally, the selection of the sample may be biased. In view of this, Granger causality analysis is next conducted to address the possible problems.
In the analysis, if the fixed panel data is not used, the spurious regression situation is easy to occur. Therefore, before analyzing the data, the original data of equity incentives, equity incentive contract elements and financial performance were validated in order to test the stability of the data. The results are shown in Table 13.
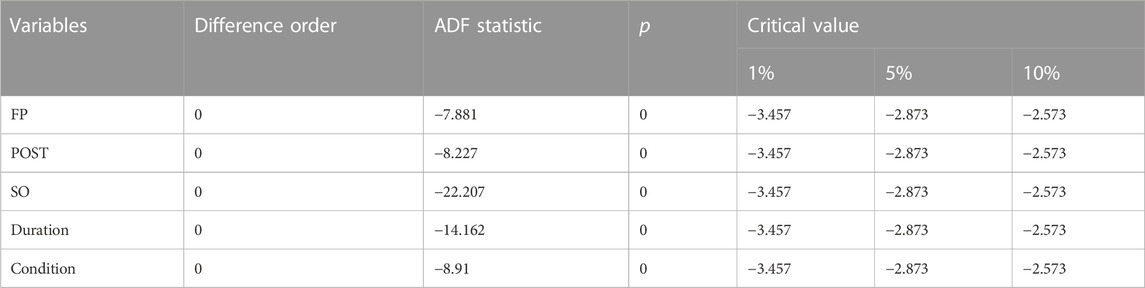
TABLE 13. Unit root test.
As shown in Table 13, the original data panel of equity incentives, equity incentive contract elements, and financial performance is stable and allows for subsequent empirical analysis. This chapter conducts Granger causality analysis for short-run (one lag), medium-run (two lags), and long-run (three lags) respectively.
First, a causal test of equity incentives on the financial performance of the firm is conducted. The results are presented in Table 14.
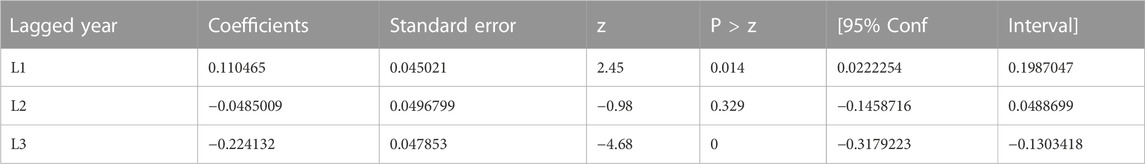
TABLE 14. Granger test of equity incentives on the financial performance of firms.
The test results in Table 14 show that the p-value is 0.014 for one lag, 0.329 for two lags, and 0 for three lags, which indicates that equity incentives and corporate financial performance, selected in this paper, exhibit the following causal relationship in terms of statistical significance: at one and three lags, for corporate financial performance, equity incentives are its Granger at 1% confidence level cause, while corporate financial performance is not the cause of equity incentives.
Next, the causality test of equity incentive approach on corporate financial performance is conducted. The results are presented in Table 15.
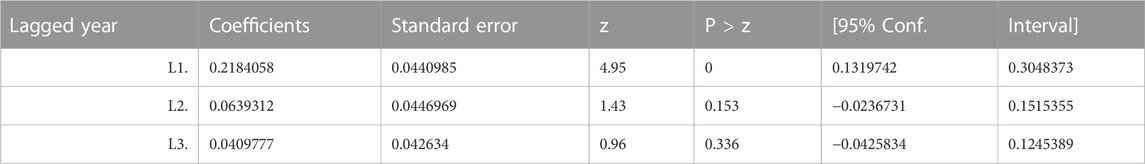
TABLE 15. Granger test of equity incentive approach on corporate financial performance.
From the test results in Table 15, we can see that the p-value is 0 for one lag, 0.153 for two lags, and 0.336 for three lags, which indicates that the equity incentive approach and corporate financial performance selected in this paper exhibit the following causal relationship in statistical significance: at one lag, for corporate financial performance, the equity incentive approach is its Granger at 1% confidence level cause, while corporate financial performance is not a cause of equity incentive method.
Again, the causality test of exercise validity on corporate financial performance is conducted. The results are presented in Table 16.
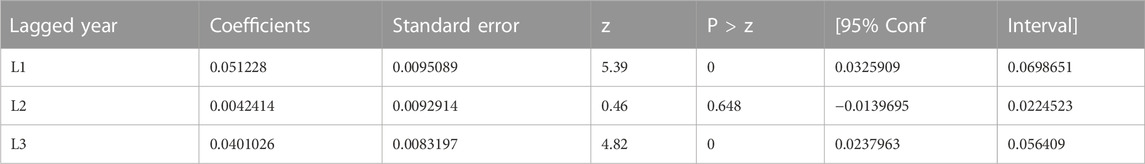
TABLE 16. Granger test of equity incentive approach on the financial performance of the firm.
The results of the test in Table 16 show that the p-value is 0 for one lag, 0.648 for two lags, and 0 for three lags, which indicates that the exercise validity period and corporate financial performance, selected in this paper, exhibit the following causal relationship in terms of statistical significance: for corporate financial performance at one and three lags, the exercise validity period is its Granger cause at the 1% confidence level, while corporate financial performance is not a cause of exercise expiration date.
Finally, causality tests of exercise conditions on corporate financial performance are conducted. The results are presented in Table 17.
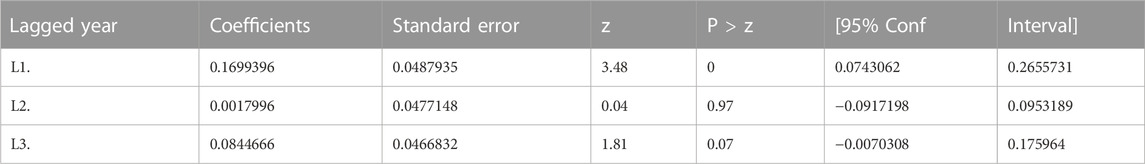
TABLE 17. Granger test of exercise conditions on firm’s financial performance.
The test results in Table 17 show that the p-value is 0 for one lag, 0.97 for two lags, and 0.07 for three lags, which indicates that the exercise condition and corporate financial performance selected in this paper exhibit the following causal relationship in terms of statistical significance: for corporate financial performance at one and three lags, the exercise condition is its Granger cause at the 1% confidence level, while corporate financial performance is not a cause of the exercise condition.
4.6 Analysis of the degree of influence of equity incentive contract elements on the financial performance of new energy enterprises
In order to further determine the degree of influence of the equity incentive contract elements on the financial performance of new energy enterprises, this section conducts gray correlation analysis on 2258 data items, uses the financial performance of enterprises as the reference value, that is, the parent series, to study the correlation between the three evaluation items and the financial performance of enterprises, and provides a reference for the degree of influence of the equity incentive contract elements based on the correlation degree. When using the gray correlation analysis, the identification coefficient is 0.5, and the correlation coefficient is calculated by combining with the formula of correlation coefficient, and then the correlation coefficient is calculated based on the correlation coefficient value for the evaluation judgment. The smaller the ρ value is, the greater the identification power is, and the general value range of ρ is (0, 1), and the specific value is dependent on the situation. When ρ ≤ 0.5463, the identification power is the best, and ρ = 0.5 is usually taken, as shown in Table 18.
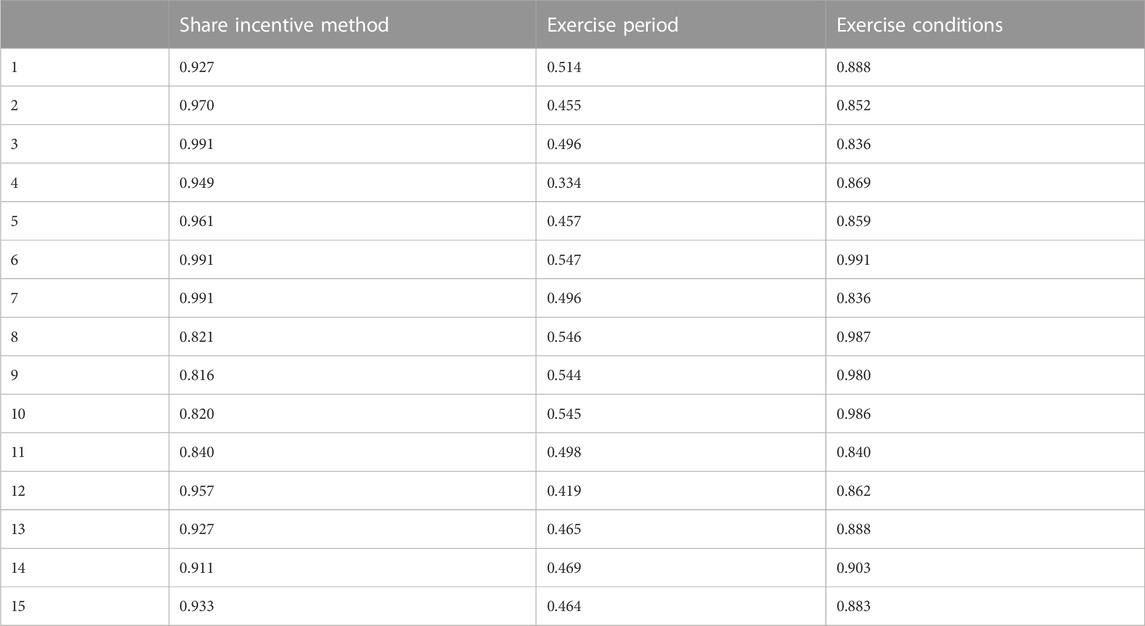
TABLE 18. Results of gray correlation coefficients.
Table 18 shows the results of the gray correlation coefficients. The correlation coefficient represents the value of the degree of correlation between the sub-series and the parent series in the corresponding dimensions, and the larger the number, the stronger the correlation. The preliminary results are that the gray correlation coefficient is the largest for the equity incentive approach, followed by the exercise conditions and the smallest exercise duration.
Figure 1 shows the graph of the results of the gray correlation coefficients, in which the values of the degree of correlation can be observed. The vertical dimension of the equity incentive method is significantly greater than the exercise conditions and the exercise period.
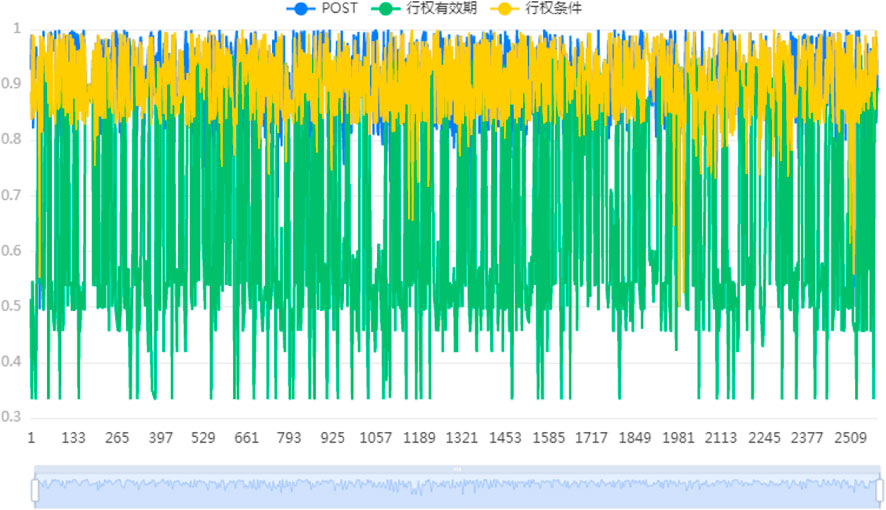
FIGURE 1. Correlation coefficient chart.
Table 19 shows the specifically calculated gray correlations. After further processing the data, the final correlation values are obtained and ranked for the three equity incentive contract elements including equity incentive method, exercise duration, and exercise conditions, it can be obtained that the equity incentive method has the highest degree of influence on financial performance with a correlation of 0.913, followed by exercise conditions with a correlation of 0.907, and the exercise duration with a correlation of only 0.649, which has the lowest degree of impact on financial performance.
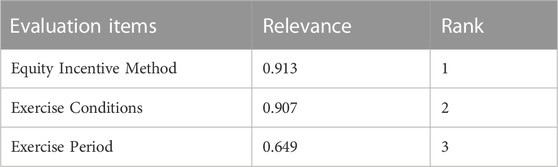
TABLE 19. Gray correlation.
Table 20 shows the degree of influence of gray correlations. Based on the comparison, the two elements of the equity incentive contract, namely, equity incentive method and exercise conditions, are very well correlated, while the exercise duration is an average correlated element. The reasonableness of the equity incentive scheme depends on the reasonableness of the equity incentive elements. The listed enterprises often need to consider many factors when formulating the equity incentive schemes, and this study finds that the two key elements, the equity incentive method and the exercise conditions, have a greater influence on the financial performance of the new energy enterprises, in other words, they have a greater impact on the whole equity incentive scheme. Therefore, when the listed enterprises formulate the equity incentive schemes, they can preferentially consider the selection of the equity incentive method and the formulation of the strict exercise conditions or not, followed by the consideration of the exercise duration, and finally ensure the feasibility of the scheme as a whole.

TABLE 20. Table of grey correlation impact degree.
5 Conclusion and recommendations
This paper mainly studies whether equity incentives can improve the financial performance of A-share listed new energy enterprises in China, and further studies whether all the three contract elements of equity incentives will have the implementation effect, and whether there is a difference in the effect of the three different contract elements of equity incentives on the financial performance of enterprises, and obtains the following results:
(1) In the listed new energy enterprises, equity incentives can positively affect the financial performance of new energy enterprises as a whole.
(2) The incentive effect of equity incentives on financial performance of listed new energy enterprises is more significant when the granting method is stock options. Restricted stock is less risky, and the recipients can get restricted stock without paying cost or only need to pay a little cost, and in order to prevent the loss of interest, the recipients may avoid some high-risk and high-return projects and choose smooth transition to prevent the downward trend of the stock. And stock option is actually a kind of call option, the incentive recipients must find a way to improve the enterprise market value if they want to get a higher return.
(3) The longer the duration of the equity incentive scheme of listed new energy enterprises, the better it is to improve the financial performance of the enterprises. China stipulates that the duration of the equity incentive is generally set within 10 years, but according to the sample data, most of the enterprises choose a shorter duration, and the average duration of the sample enterprises is only 3.147, which means that the duration set by the new energy enterprises in China is relatively short, which may not be conducive to the equity incentives to play its incentive role.
(4) In the listed new energy enterprises, it is more beneficial to improve the financial performance of the enterprises by setting relatively strict exercise conditions for the equity incentive scheme. At present, China’s equity incentive exercise conditions are set relatively loose, and the relevant regulatory departments do not specify the incentive conditions in the equity incentive contract elements, so that enterprises that set stricter conditions can make the incentive recipients work harder to achieve their goals.
New energy industry is one of the strategic emerging industries in the 12th Five-Year Plan for National Economic and Social Development, and its development has been paid more and more attention. New energy enterprises have encountered a lot of obstacles in the development process, such as a principal-agent relationship within the new energy enterprises and the problem of equity incentives. Therefore, it is crucial to establish an effective and reasonable equity incentive mechanism based on past data. This is not only a review and reflection on the implementation effect of equity incentives in the past, but also provides opinions and references for the formulation of equity incentives in the future.
Combined with the above findings, this paper proposes the following suggestions: Firstly, stock options are more significant to improve the financial performance of enterprises, so it is suggested that new energy enterprises can choose more stock options or combine the restricted stock and stock options in a certain proportion to jointly carry out equity incentives. Secondly, the longer the duration of the equity incentive scheme, the better it is for improving the financial performance of the enterprises. It is suggested that the new energy enterprises should set the duration of the equity incentive scheme between 5 and 10 years, but considering the degree of influence, the enterprises can finally think about the length of the exercise duration. Finally, the relatively strict exercise conditions for equity incentives are more conducive to improving the financial performance of the enterprise. It is suggested that when setting the conditions of equity incentives, new energy enterprises should set more strict conditions, and can introduce a combination of multiple indicators to fully reflect the different aspects of the enterprise. While designing the incentive conditions, the enterprise should preferably choose some benchmarks, such as industry standard horizontal comparison or vertical comparison of past years’ performance, and also set some non-financial indicators as incentive conditions, such as the degree of achievement of strategic goals, innovation ability, market share, etc., in conjunction with the characteristics of new energy itself.
Data availability statement
Publicly available datasets were analyzed in this study. This data can be found here: https://www.gtarsc.com/.
Author contributions
KC: Conceptualization, Visualization, Writing—review and editing. YY: Writing—review and editing. PJ: Methodology, Data curation, Software, Writing—original draft, Writing—review and editing. HB: Visualization, Supervision, Validation, Writing—review. TN: Writing—review, Project administration.
Funding
Ningbo Soft Science Project “Research on Mechanism and Path of Green Innovation in Manufacturing Industry under Double Carbon Strategy”, under Grant number 2022R020; Zhejiang Philosophy and Social Science Planning Pro-ject “Research on construction mechanism and path of Ecological Civilization Highland in Zhejiang”; Advanced Humanities and Social Sciences Cultivation Project in Ningbo University in 2022 (Pro-phase Project of Cultivation) “Research on Synergistic Effect of Reducing Pollution and Carbon” and Ningbo Philosophical and Social Science Planning “Research on Green Innovation Path of Ningbo Specialized Small Giant Enterprises under Double Carbon Strategy” under Grant number G2022-2-70.
Conflict of interest
The authors declare that the research was conducted in the absence of any commercial or financial relationships that could be construed as a potential conflict of interest.
The reviewer QZ declared a shared affiliation with the authors KC, YY, PJ, TN to the handling editor at the time of review.
Publisher’s note
All claims expressed in this article are solely those of the authors and do not necessarily represent those of their affiliated organizations, or those of the publisher, the editors and the reviewers. Any product that may be evaluated in this article, or claim that may be made by its manufacturer, is not guaranteed or endorsed by the publisher.
References
Bettis, C. S., Bizjak, J., Coles, J., and Kalpathy, S. (2010). Stock and option grants with performance based vesting provisions [J]. Rev. Financial Stud. 15 (23), 3850–3888. doi:10.2139/ssrn.972424
Cao, Y., and Zhan, X. (2003). Current status and development of incentive theory research[J]. Contemp. Finance Econ. 2003, 57–61.
Chang, X., Fu, K., and Low, A. (2015). Non-executive employee stock options and corporate innovation. J. Financial Econ. 115 (1), 168–188. doi:10.1016/j.jfineco.2014.09.002
Chen, S., Lv, S., and Bai, G. (2016). Research on the factors influencing the implementation effect of equity incentive programs of A-share listed companies[J]. J. Central Univ. Finance Econ. 2016, 121–128.
Chen, W. (2018). Equity incentives, contractual heterogeneity and the dynamic growth of firm performance [J]. Econ. Manag. 40 (5), 175–192. doi:10.19616/j.cnki.bmj.2018.05.011
Cheng, L., and Yue, C. (2008). An empirical analysis of equity incentive performance of listed companies' senior management[J]. Econ. Manag. Res. 2008, 17–22.
Dechow, P. M., and Sloan, R. G. (1991). Executive incentives and the horizon problem [J]. J. Account. Econ. 1991, 51–89. doi:10.1016/0167-7187(91)90058-s
Flynn, B. (2010). B.,Huo B.,Zhao X. The impact of supply chain integration on performance: A contingency and configuration ap-proach[J]. J. Operations Manag. 22 (3), 67–88.
He, Y., Zhao, X., and Li, Q. (2019). An empirical analysis of the impact of stock incentive exercise price on firm performance[J]. Statistics Decis. Mak. 35 (05), 167–170. doi:10.13546/j.cnki.tjyjc.2019.05.037
Hou, X. (2021). Evaluation of financial performance of A-share listed logistics supply chain enterprises based on factor analysis [J]. J. Shanxi Univ. Finance Econ. 43 (S2), 53–57.
Jensen Michael, C., and Meckling William, H. (1976). Theory of the firm: Managerial behavior, agency costs and ownership structure[J]. North- Holl. 3 (4), 26–35.
Lin, P., and Liu, Y. (2017). The impact of equity incentives on firm performance-an empirical study based on software and information technology service industry[J]. Sci. Res. Manag. 38 (12), 99–105. doi:10.19571/j.cnki.1000-2995.2017.12.011
Liu, G., and Ma, Y. (2013). The effect of implementing equity incentives in Chinese listed companies[J]. China Soft Sci. 2013, 110–121.
Lu, X., Gong, Q., and Zheng, Y. (2013). Research on the elements of equity incentive contract and its influencing factors[J]. J. Shanxi Univ. Finance Econ. 35 (04), 49–59. doi:10.13781/j.cnki.1007-9556.2013.04.007
Lv, C., Zheng, H., Yan, M., and Xu, J. (2009). Design of equity incentive system in listed companies:incentive or welfare? J. Manag. World 2009, 133–147. doi:10.19744/j.cnki.11-1235/f.2009.09.015
Ma, L., and Ding, Z. (2017). Classified governance, government control and executive compensation incentives of state-owned enterprises - an empirical study based on Chinese listed companies [J]. Manag. Rev. 29 (03), 147–156. doi:10.14120/j.cnki.cn11-5057/f.2017.03.012
Miller, D., and Breton, M. (2011). Governance, social identity, and entrepreneurial orientation in closely held public companies. Preneursh. Theory Pract. 35 (5), 1051–1076. doi:10.1111/j.1540-6520.2011.00447.x
Ruan, S., and Yang, S. (2013). Managerial incentives, capital structure and performance of listed companies[J]. Audit Econ. Res. 28 (06), 64–70.
Sautner, Z., and Weber, M. (2006). Corporate governance and the design of stock option programs[R]. Working Paper.
Sheikh, S. (2012). Do CEO compensation incentives affect firm innovation? [j]. Rev. Account. Finance 11 (1), 4–39. doi:10.1108/14757701211201803
Shen, X., and Wang, Y. (2015). Equity incentives, nature of property rights and firm performance[J]. J. Southeast Univ. 17 (01), 71–79. doi:10.13916/j.cnki.issn1671-511x.2015.01.010
Shi, Q., Xiao, S., and Wu, J. (2020). Stock options and their elemental design and firms' innovation output - a study based on risk-taking and performance incentive effects[J]. Nankai Manag. Rev. 23 (02), 27–38.
Shu, X. (2013). Research on the evaluation method and visualization of financial performance of listed companies [M]. Beijing: Intellectual Property Press.
Tong, Y., and Wei, Y. (2021). A study on the correlation between financial performance, business diversification and stock liquidity of GEM listed companies[J]. Manag. Rev. 33 (04), 283–294. doi:10.14120/j.cnki.cn11-5057/f.2021.04.024
Wang, S., Fang, H., and Rong, Z. (2017). Do option incentives promote firm innovation–Evidence based on patent output of Chinese listed companies[J]. Financial Res. 3, 180–195.
Wang, T., and Hu, M. (2015). Research on the impact of equity incentives on financial performance[J]. Statistics Decis. Mak. 2015, 168–171. doi:10.13546/j.cnki.tjyjc.2015.04.045
Xiao, S., Shi, Q., Wang, T., and Yi, S. (2016). Preference of equity incentive method selection in listed companies–a study based on the perspective of incentive recipients[J]. Account. Res. 2016, 55–62.
Xu, Y., and Shi, S. (2010). Do equity incentives really improve corporate performance: Empirical evidence from listed companies in China[J]. J. Shanxi Univ. Finance Econ. 32 (04), 53–59. doi:10.13781/j.cnki.1007-9556.2010.04.008
Yu, Y., Xu, Z., and Li, Y. (2022). Spatial differentiation and dynamic evolution of environmental efficiency in wheat planting in China [J]. Sustainability 2022, 14. doi:10.3390/su14095241
Yu, Y., Yan, Y., Shen, P., Li, Y., Ni, T., and Green Financing EfficiencyInfluencing Factors, (2022). Of Chinese listed construction companies against the background of carbon neutralization: A study based on three-stage dea and system gmm. J. Axioms 10, 11. doi:10.1186/s40337-022-00531-y
Zhai, S., and Chen, Z. (2016). Executive equity incentives and corporate innovation [J]. J. Beijing Univ. Technol. Bus. Soc. Sci. Ed. 31 (01), 85–93. doi:10.16299/j.1009-6116.2016.01.010
Zhang, J., and Zhang, H. (2021). Equity incentives, core competitiveness and financial performance of growth period firms-an empirical study based on data of listed companies in China[J]. Learn. Explor. 2021, 120–127.
Keywords: equity incentives, financial performance, new energy companies, contractual elements, new energy
Citation: Chen K, Yu Y, Jiang P, Bao H and Ni T (2023) Research on the impact of equity incentives on the financial performance of new energy enterprises. Front. Environ. Sci. 11:1116665. doi: 10.3389/fenvs.2023.1116665
Received: 05 December 2022; Accepted: 20 February 2023;
Published: 03 March 2023.
Edited by:
Solomon Prince Nathaniel, University of Lagos, NigeriaReviewed by:
Qin Zhang, Ningbo University, ChinaTinggui Chen, Shanghai Ocean University, China
Gangfei Luo, Zhejiang Gongshang University, China
Copyright © 2023 Chen, Yu, Jiang, Bao and Ni. This is an open-access article distributed under the terms of the Creative Commons Attribution License (CC BY). The use, distribution or reproduction in other forums is permitted, provided the original author(s) and the copyright owner(s) are credited and that the original publication in this journal is cited, in accordance with accepted academic practice. No use, distribution or reproduction is permitted which does not comply with these terms.
*Correspondence: Yaguai Yu, eXV5YWd1YWlAbmJ1LmVkdS5jbg==