 Ghani Rahman
 Noor Hussain Chandio
 Muhammad Farhan Ul Moazzam
 Nadhir Al Ansari
- 1Department of Geography, University of Gujrat, Gujrat, Pakistan
- 2Department of Geography, Shah Abdul Latif University, Khairpur, Pakistan
- 3Department of Civil Engineering, College of Ocean Science, Jeju National University, Jeju-si, Republic of Korea
- 4Department of Civil, Environmental and Natural Resources Engineering, Lulea University of Technology, Lulea, Sweden
Urban area expansion and the increase in the built-up area are major threats to agriculture, the natural environment, and ecology throughout the world. The population of the city of Larkana is rapidly increasing due to natural growth and uncontrolled migration from the surrounding areas, which have resulted in a haphazard increase in the built-up area over the fertile agricultural land and affected the city’s thermal environment. This research aims to evaluate the impacts of urban area expansion on agricultural land and the thermal environment of the study area by assessing the change in land use/ land cover (LULC) from 1990 to 2020 and land surface temperature (LST). For this purpose, the Random Forest (RF) algorithm was applied, and LST was calculated in Google Earth Engine (GEE) using Landsat imageries for the years 1990, 2000, 2010, and 2020. For the RF classifier algorithm, 3500 reference random points were generated for each year, which were then randomly divided into two datasets, i.e., a training sample consisting of 70% of the points and a validation dataset (30% of the points). After LULC classification, the results were validated for 1990, 2000, 2010, and 2020, and the accuracy was 88.3%, 89%, 90.01%, and 90.8%, respectively. The study results showed that the built-up area increased from 12.31 to 43.83 km2 while the barren land in the study region decreased from 56.51 km2 to 11.62 km2. The agricultural land was 66.66 km2 in 1990, expanded to 101.38 km2, and then decreased to 79.49 km2 in 2020. The results also revealed that most of the urban expansion in the last decade (2010-2020) took place on agricultural land. The urban thermal environment also showed a gradual increase in surface temperatur,e as recorded by the LST results. The LST results revealed that the maximum LST was 33.4°C in 1990, which increased to 36.1°C in 2020, and similarly, the minimum LST was 25.1°C, which also increased to 26.6°C in 2020. This study provides useful results for stakeholders to devise better policies and plans to control further haphazard urban expansion on fertile agricultural land in the study area.
1 Introduction
Globally, the agriculture sector is facing several threats like water scarcity, rising temperatures, drought, and urban expansion. Urbanization is a major cause of the conversion of agricultural land into the built-up area due to rapid economic growth, new industrial zones, and migration from rural areas toward towns and cities around the world. The global population is continuously increasing, from 2.5 billion people in 1950 (Al-Thawwad, 2008; Chandio and Shirazi, 2022) to 8 billion today, according to United Nations reports. The unprecedented global population growth is the result of improvements in the health sector, including medication, personal hygiene, and nutrition, which resulted in an increase in human life expectancy. Global data on urbanization also show an increase in population, particularly in the last two decades (Chandio and Shirazi, 2022). Asia is home to 4.7 billion (60%) of the world’s population. In North America, 82% of the population, in the Caribbean region 81%, in Europe 74% and in Oceania 68% are settled in urban areas due to the availability of basic human facilities (UN-DESA, 2018; Chandio and Shirazi, 2022). Developing countries have been facing rapid population growth and urban sprawl for the past few decades, and the trend is expected to continue in the future, which is also the case in Pakistan (Ashraf et al., 2022). High population growth and a lack of basic amenities in rural areas have caused rural-urban migration and land use/ land cover change (LULC) from one form to another, such as from agricultural to the built-up area (Moazzam et al., 2022; Yousafzai et al., 2022). Globally, it is estimated that by 2030, 60% of people will be living in urbanized localities (Ashraf et al., 2022; Ashraf et al., 2023). Urbanization is not only the increase in population but also the expansion of residential and commercial areas, boosting the demand for basic amenities like transportation, education, water supply, and sanitation, and ultimately converting agricultural land and areas covered by natural vegetation into a built-up area (Aliyu and Amadu, 2017; Yousafzai et al., 2022). The increase in the built-up area results in a number of environmental issues, such as affecting local and regional temperatures and aggravating the problem of food security (Sun et al., 2018; Farid et al., 2022).
Urban expansion triggers the expansion of the built-up area, recreational parks, and public infrastructure, encroaching on the vast agricultural and open areas surrounding a city. The increase in the built-up environment due to these human interruptions raises the urban temperature, decreases soil infiltration due to the increase in impervious areas, and thus leads to water runoff, resulting in disasters like urban heat waves and urban flooding (Rahman et al., 2019; Zou et al., 2021). Surface energy balance and urban flooding have risen because of urbanization, which has led to naturally high permeable surfaces being replaced by artificial, low-permeable surfaces (Rizwan et al., 2008; Wang et al., 2019; Zou et al., 2021). Among other impacts of urban expansion, it has taken over fertile agricultural land and intensified the issue of food security (Khan, 2019). The target of zero hunger in the Sustainable Development Goals has become a challenge to achieve by the year 2030 (Gandharum et al., 2022).
Remote sensing imagery is an important tool for monitoring changes in LULC and urban expansion (Mehdi et al., 2021). In particular, their high temporal resolution helps to monitor the rate of change and identify the possible causative factors (Gul et al., 2022; Tariq et al., 2022). The long-term temporal availability of Landsat images makes it easier to identify past LULC and detect temporal changes (Butt et al., 2015). No one can deny the role of remote sensing in mapping and monitoring LULC changes over short timescales with greater accuracy at a low or no cost (Gul et al., 2022). Working with the Google Earth Engine (GEE) since 2010, the use of remote sensing images has become more attractive as this online platform provides global scale analysis capabilities and access to multiple catalogs of satellite images, i.e., Landsat, Sentinel, MODIS, and so on (Gandharum et al., 2022). Machine learning algorithms such as the Random Forest algorithm (RF) can be used for the classification of satellite images using GEE, and these algorithms provide high accuracy of more than 90% (Gandharum et al., 2022; E. Nyland et al., 2018; Thanh Noi and Kappas, 2017).
Like other developing countries in the world, Pakistan is also facing the problem of rapid population growth and urban expansion, and it is reported that this trend will continue in the future (Gul et al., 2022). The proportion of the urban population in Pakistan was 17.8% in 1951, which increased to 36% in 2017 (GOP, 2017). This abrupt increase in urban population has led to the expansion of urban areas, which has had negative consequences such as the degradation of drinking water quality, the lowering of groundwater levels, food security issues, poor water supply, and poor sanitation, often creating other related problems such as urban flooding and urban heat island phenomena. Sindh is the most urbanized province as compared to other provinces of Pakistan (Ul Din and Mak, 2021). Due to the high level of urbanization, the land resources of Sindh province have been degraded, including the saline and waterlogged fertile soil, and its freshwater resources depleted, while the infrastructure facilities are in shambles (Panhwar, 2020). Larkana is the fourth most populous city in Sindh province. This study focuses on urban expansion in the city of Larkana and its impact on agricultural land. The impact of urban expansion on the thermal environment of the city is also evaluated. To date, no such study has been conducted in Larkana. This research analyzes the spatial and temporal changes in LULC, linking the changes in LULC with the changes in agricultural land and the urban thermal environment between 1990 and 2020.
2 Study area
Larkana, situated on the right bank of the Indus, is the fourth most populous city in Sindh province after Karachi, Hyderabad, and Sukkur and the fifteenth largest in Pakistan in terms of population. Larkana is one of Pakistan’s historic and intermediate cities. In 1951, its population was only 34,000, which increased to 490,508 in 2017 (GOP, 2017). The city extends from 27°48' to 27°61' north latitude and 68°16' to 68°24' east longitude (Figure 1). Geographically, the district has an even topography and is rich in agriculture, and it is known as the “Paris of Pakistan” (Britannica, 2013). During the British era, Larkana was known as the “Garden of Sindh”, but lost this status due to rapid urbanization. Larkana’s history may be traced back to the Moen-Jo Daro Indus Valley Civilization, which was founded around 2500 BC. Generally, the population has migrated three times from rural areas toward Larkana in the last three decades. First, when Zulfiqar Ali Bhutto was Prime Minister and declared the city the Paris of Pakistan, he established the Chandka Medical College in 1973. Secondly, when Benazir Bhutto was Prime Minister, she redesigned the city, establishing new educational institutions. In 1988, Larkana was given the status of a division and gained more significance as the administrative and service hub of northern Sindh. Thirdly, during the superfloods of 2010, when a large number of people migrated from the different areas of Kamber-Shahdadkot, Dadu, and Shikarpur districts to settle near the Larkana city area. On all these three occasions, human migration was attracted, which changed the territorial boundaries of Larkana: significant changes in land use and land cover were observed.

FIGURE 1. Map of the city of Larkana.
3 Materials and methods
In the current research, the Landsat satellite images from the years 1990, 2000, 2010, and 2020 from the United States Geological Survey (USGS) have been used. The Landsat imageries for the years 1990, 2000, and 2010 were sourced from the Landsat 5 Thematic Mapper (TM) satellite, whereas the image for 2020 was from the Landsat 8 Operational Land Image (OLI) satellite (Table 1).
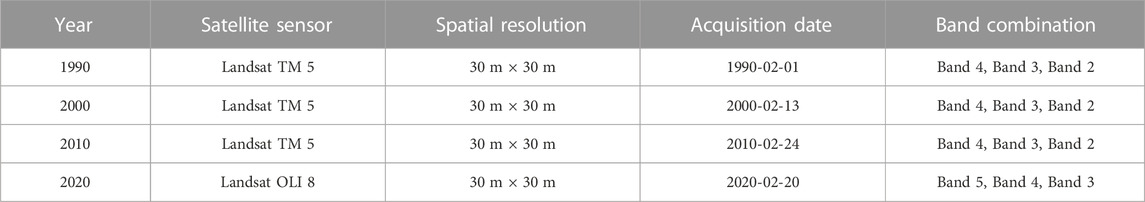
TABLE 1. Satellite data information and color composite band combinations
3.1 Image classification using a random forest algorithm
The surface reflectance products of Landsat images from each year were used for land use/ land cover classification in Google Earth Engine (GEE). The cloud mask function was applied to get cloud-free pixels. The normalized difference built-up index (NDBI), the normalized difference water index (NDWI), and the normalized difference vegetation index (NDVI) were calculated for each Landsat image. The NDBI was calculated using the NIR and SWIR bands (for Landsat 5, the formula is (Band 5Band 4) / (Band 5 + Band 4); for Landsat 8, the formula is (Band 6 – Band 5) / (Band 6 + Band 5). Gao. (1996) developed the Normalized Difference Water index in order to enhance water bodies. This index uses the NIR and SWIR bands [for Landsat 5, NDWI = (Band 4 – Band 5) / (Band 4 + Band 5), while for Landsat 8 the formula is (Band 5 – Band 6) / (Band 5 + Band 6)]. Similarly, the NDVI uses the NIR and red bands [for Landsat 5, NDVI = (Band 4 – Band 3) / (Band 4 + Band 3), while for Landsat 8 the formula is NDVI = (Band 5 – Band 4) / .(Band 5 + Band 4)].
To classify the Landsat images for the years 1990, 2000, 2010, and 2020, the random reference points were generated for four major land use categories, i.e., barren, built-up, water bodies, and agricultural land. Nearly 3500 reference points were generated for each year, of which 70% were used as training samples to create land use maps using the RF algorithm, and the remaining 30% was used for validation purposes. After obtaining LULC maps for each year, an accuracy assessment was performed for each LULC map using validation reference points, and an error matrix was employed to produce overall accuracy for each LULC map.
For the assessment of change in LULC, the classification results were used to observe the trend of land use change in Larkana and analyzed in ArcGIS 10.8. The LULC maps were categorized into four classes: built-up areas, water bodies, agricultural land, and barren land. The built-up area includes residential, commercial, and other urban areas like roads, etc., while the agricultural land includes natural vegetation, cropland, and orchards. The results were then further assessed to calculate the temporal land use change using the following equation:
where t1 is the initial time, t2 is the final time, A1 is the land use class cover at the initial time, and A2 is the class cover at the final time.
Furthermore, the land surface temperature (LST) for each temporal image was calculated using Google Earth Engine. The LST data were then downloaded, and the map was prepared in ArcGIS 10.8. The LST minimum and maximum were acquired from each temporal image for further interpretation. The LST was also analyzed with respect to each land use class in this study. The LST was extracted from the thermal bands of Landsat satellite imagery using the following procedure:
3.1.1 Digital number (DN) to spectral radiance conversion
The data received by thermal sensors were converted to radiance using the following equation:
where Lλ is the TOA spectral radiance (Watts/ (m2 * srad * μm); and ML is the band-specific multiplicative rescaling factor; AL is the band-specific additive rescaling factor; and Q is the quantized and calibrated standard product pixel values (DN).
3.1.2 Conversion to at-satellite brightness temperature
Band data can then be converted from spectral radiance to top-of-atmosphere brightness temperature using the thermal constants provided in the metadata file by Eq. 3.
In the above equation, T or Tb is the top-of-atmosphere brightness temperature (K); Lλ is the TOA spectral radiance (Watts/ (m2 * srad * μm); K1is the band-specific thermal conversion constant available in the metadata; and K2 is the band-specific thermal conversion constant available in the metadata file.
3.1.3 Land surface temperature
The LST was retrieved using a single-channel algorithm, using a single thermal band of the imagery. For this purpose, band 6 was used for Landsat 5 while band 10 was used for Landsat 8 LST calculations. The annual mean LST has been derived using Google Earth Engine. There is a 15 minutes time lag between Landsat 8 and Landsat 5 satellite equatorial crossing time (Mumtaz et al., 2023) but the mean annual value of LST is not that much affected by this time lag. The emissivity-corrected LST was derived using the Arties and Carnahan (1982) procedure.
In Eq. 4, BT = at satellite temperature, where w is the wavelength of the emitted radiance; p = h * c / s (1.438 * 10−2m K); h is the Planck constant (6.626 * 10−34 J s); s is the Boltzmann constant; c is the speed of light (2.998 × 10⁸ m/s); e is the emissivity.
LSE, or Land Surface Emissivity, can be defined as the ratio of the energy radiated from the surface of a material to that radiated by a black body at the same temperature and wavelength, under the same viewing conditions. It is calculated based on Eq. 5.
where
The normalized difference vegetation index (NDVI) in this study was calculated using red and near-infrared bands using the following equation:
Conversion of LST from Kelvin to Celsius
The retrieved LST is in Kelvin and was converted to Celsius using Eq. 8.
All these formulae were set in GEE for both Landsat 5 and Landsat 8 imagery, and the mean annual LST was derived for each study period. The maximum, minimum, and mean LST for each LULC class were calculated using zonal statistics in ArcGIS.
3.2 Validation
The results of LULC maps derived through the RF algorithm in GEE were validated using the 30% sample points. For this purpose, the kappa coefficient technique was used in this study. The 30% validation dataset points were used to compare the original land use type to the classified image. For this purpose, the value of the classified image assigned to each point was extracted using ArcGIS, and then the original image and Google Earth imagery were used as reference data. An error matrix table was generated to quantify and summarize the total accuracy of the classified images. The results showed good performance of the RF algorithm for LULC classification. The overall accuracy in 1990 was 88.3%, 89% in 2000, 90.01% in 2010, and 90.8% in 2020.
4 Results
4.1 Land use/ land cover analysis
The multi-temporal satellite-based LULC mapping for the years 1990, 2000, 2010, and 2020 was categorized into barren land, built-up area, water bodies, and agricultural land. Agricultural land includes orchards and cropland. For each respective year, the Landsat satellite images were converted to color composite with bands 4,3, and 2 RGB for Landsat 5 and 5,4, and 3 for Landsat 8 satellite, using the standard false color composite band combination (Figures 2, 3). The land use for the multi-temporal years was generated from the Landsat 5 and Landsat 8 images using the RF algorithm classification method in GEE. The multi-temporal satellite-based LULC mapping results exhibited a high increase in the built-up area, which was 12.31 km2 in 1990 and rose to 19.87 km2 in 2000, 23.38 km2 in 2010, and 43.83 km2 in 2020 (Figures 2, 3, 4). In 1990, the built-up area was only 8.62%, which grew to 13.99% in 2000, 16.68% in 2010, and 30.70% of the total study area in the year 2020 (Figure 5B). During the period 1990-2010, it took two decades to double the built-up area, while during the period 2010-2020, it doubled again in just one decade. This surge in the built-up area was the result of a number of factors, including the special attention given to the city of Larkana during the People’s Party government in 1988-1990, 1993-1996, and 2008-2013. During 1988-1990, Larkana was upgraded to a division, a number of educational and health institutions were built, and housing colonies like OPF and Sindh Green Housing Society were initiated, which boosted the expansion of the city. During the 1993-1996 government, the city was given further attention, and the Board of Intermediate and Secondary Education Larkana was established in 1995. The city continued to grow to the southwest and northeast with the construction of new roads, a bus terminal, new hospitals, some new educational institutions, planned housing settlements, and small industrial areas. In the LULC map of 1990, most of the barren land is actually the land that has been cleared for different development projects in the city area. The expansion of the built-up area in 1990-2010 was almost all around the city center with a few patches in the surrounding areas, but in 2020 the city expanded along the main canal and to the west. The other factors contributing to the increased built-up area of Larkana include the natural growth of the population and people’s migration from the suburbs seeking a safe place and jobs after the massive 2010 floods. The results showed that during 1990-2010, the built-up area and agricultural land expanded over the barren land (Figures 2, 3), and the same was confirmed by the local inhabitants, who said that there was a massive amount of waterlogged and saline land up until 1990, which was later converted to agricultural land. In 1990 and 2000, barren land was the second largest LULC category, while from 1990 to 2020, agricultural land remained dominant in the study area, which substantially decreased in the last two decades, i.e., between 2010 and 2020 (Figures 4, 5).
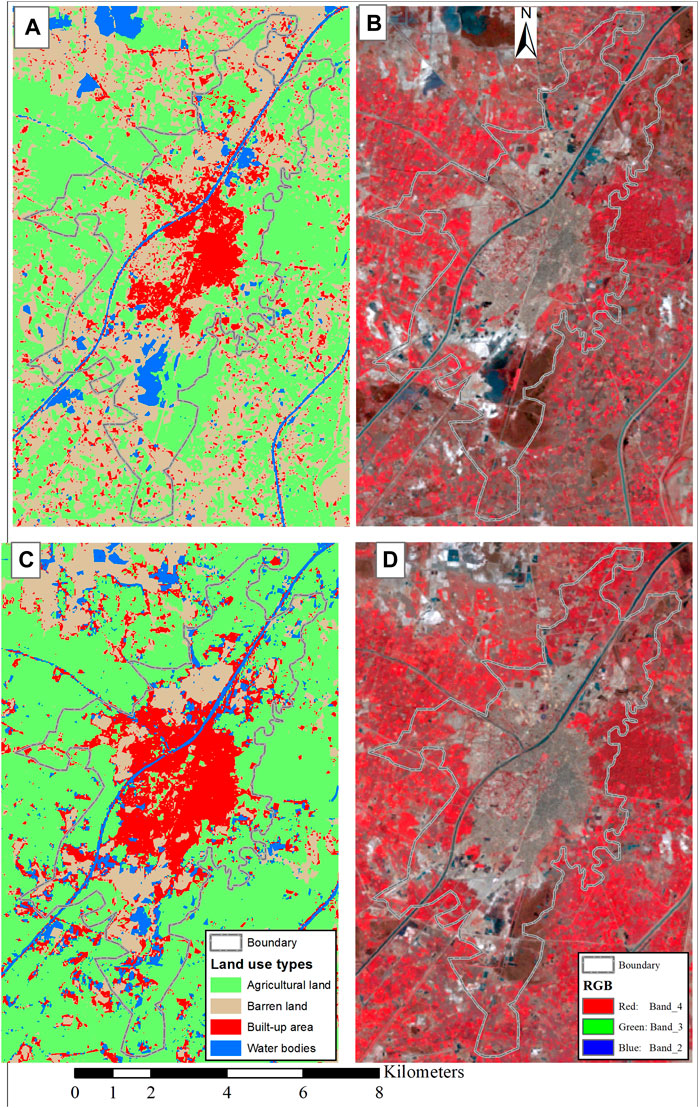
FIGURE 2. LULC maps of Larkana City for the years 1990 and 2000 (A) LULC map for the year 1990 (B) Landsat 5 color composite image for the year 1990 with FCC bands combination (C) LULC for the year 2000 (D) Landsat 5 color composite image for the year 2000 with FCC bands combination.
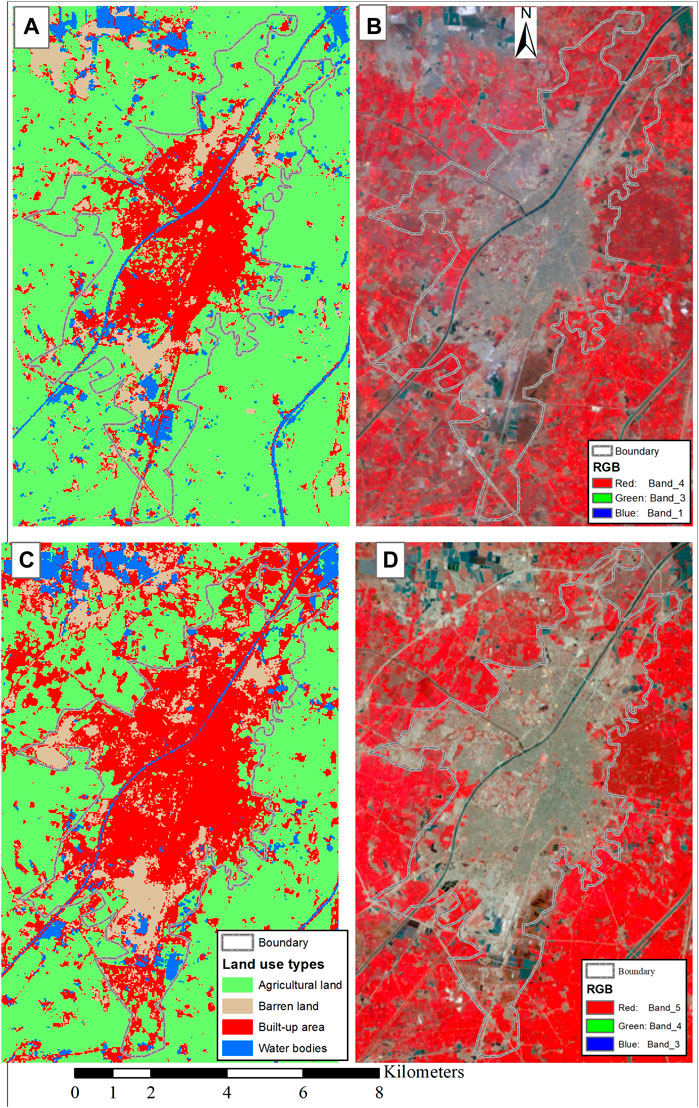
FIGURE 3. LULC maps of Larkana for the years 2010 and 2020 (A) LULC for the year 2010 (B) Landsat 5 color composite image for the year 2010 with FCC bands combination (C) LULC for the year 2020 (D) Landsat 8 color composite image for the year 2020 with FCC bands combination.
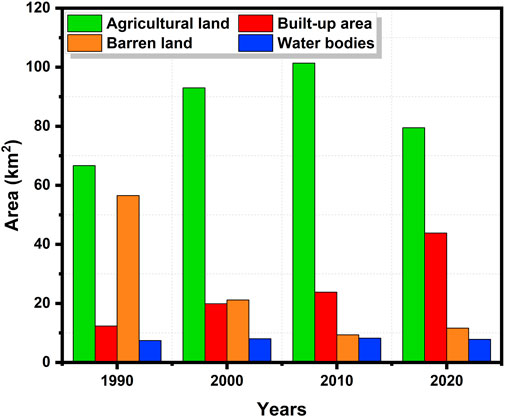
FIGURE 4. Larkana LULC areas for the years 1990, 2000, 2010, and 2020.
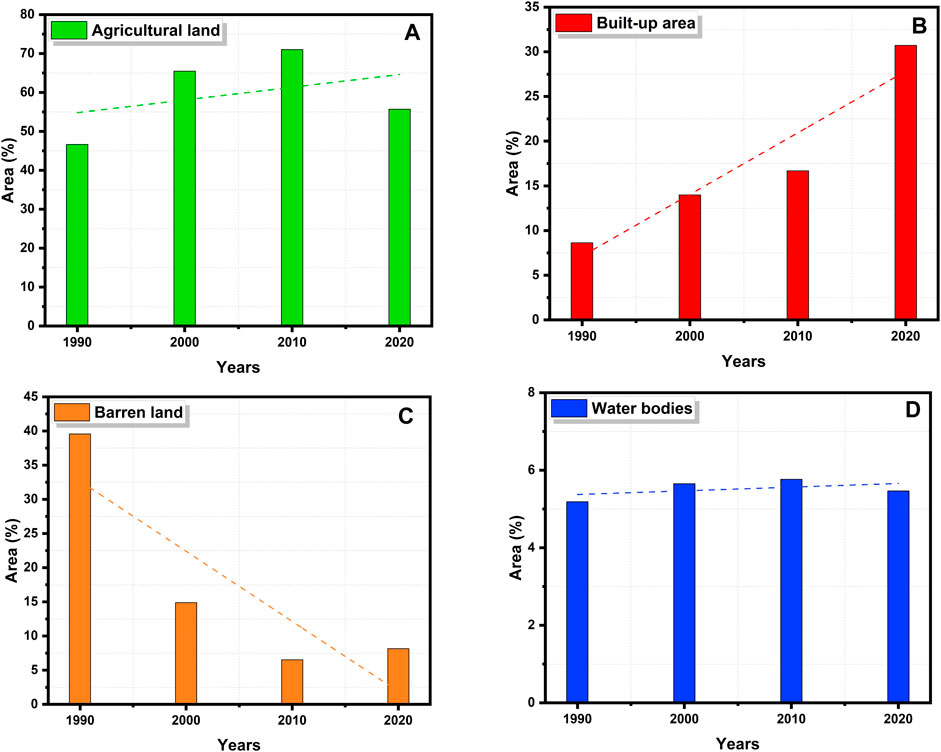
FIGURE 5. Trends in LULC change over the last three decades (A) Agricultural land, (B) Built-up area (C) Barren land (D) Water bodies.
Agricultural land accounted for 45.65% of all land in 1990, gradually increasing to 71.02 % by 2010 and decreasing again to 55% by 2020 (Figure 5A). From 1990 to 2010, barren land was the second largest LULC category in terms of area occupied, which was overtaken by built-up area in 2010, thus becoming the second largest LULC category with 16.68% of the total area in 2010 and 30.70% of the total area in 2020. The built-up area in the study area expanded in all directions during the period 2010-2020, mainly along the major communication routes (Figure 2). A huge change was observed in the built-up area between 2010 and 2020, where it increased from 16.68 % in 2010 to 30.70 % in 2020 at the expense of agricultural and barren land in the study area. The major reason for this was the mass migration from nearby areas affected by the 2010 floods, especially from Kamber-Shahdadkot, Dadu, and Shikarpur districts and other rural areas. The population spread to the western side after the 2010 floods, mainly because the area is safer from floods than the eastern side. The new expansion on the western side also included government development such as the extension of the industrial area and the building of warehouses for rice sellers. Some new housing projects were also launched and developed on the western side of the city after 2010. The barren land in the study region decreased from 39.55% in 1990 to 8.14% in 2020. This is due to the conversion of the built-up area into agricultural land. The fourth category of LULC is water bodies in Larkana city. From the analysis, an increase in water bodies was observed in the study area. This increase is due to the intensification of inland fish farming (Figure 4D).
The results revealed that the agricultural land in the study area increased from 1990 until 2010 (Figures 4, 5A). In 1990, the total area covered by agricultural land amounted to 46.65% and it increased to 65.48% in 2010, to 71.02% in 2010, and it decreased again to 55.69% in 2020. According to the field observation and discussion with the local elders, the increase in agricultural land in Larkana and its surrounding areas is the result of clearing and converting the waterlogged and saline areas into agricultural land. Most of the surrounding areas in the northern and southern parts of the city neighboring were once waterlogged and saline, and were later converted to agricultural land with support from the local community and the government. After 2010, the agricultural land decreased and the major reason is the continuous increase in the built-up area; the current study also found that the majority of agricultural land was used to expand the urban area. Therefore, we can observe that the built-up area has an incrementing trend. The relative change in the built-up area between 1990 and 2000 was 5.4%, which increased to 14% between 2010 and 2020 (Figures 4, 5B).
The overall LULC area in 1990 and 2020 and their respective changes in percentage have been shown in Table 2 and Figure 7. The results indicate that agricultural land increased by 19.24% during the study period, while the increase in the built-up area was 256.00%. The barren land in the study area decreased by almost 79.44% during the study period (Figure 7). The increase in the built-up area has grabbed the barren land and agricultural land, in the study area. Most of the changes in the built-up area were observed between 2010 and 2020 and the main reason was a mass migration from the surrounding areas after the 2010 floods. A slight increase in water bodies was observed from the study results, amounting to 5.23% (Table 2). The increase in water bodies is due to an increase in fish farming in the study region.
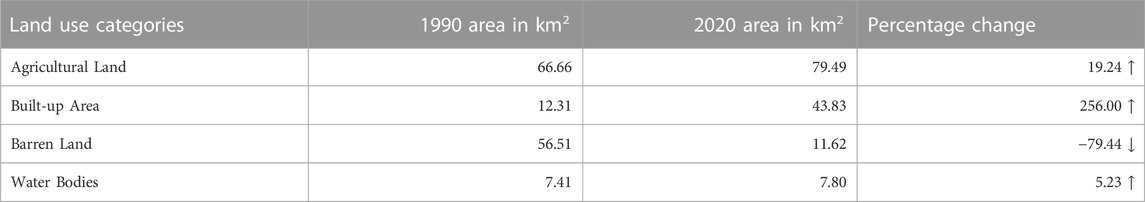
TABLE 2. Percentage change in land cover from 1990 to 2020.
In this study, the change from one land use category to another was calculated (Figure 8). For this purpose, the post-classification change detection technique was applied to quantify the change in each land use category between 1990 and 2020. The change matrix technique was adopted for this purpose to analyze the LULC changes. The LULC conversion from one category to another is represented by a two-way cross-matrix, and its corresponding value was calculated from 1990 to 2020. The largest LULC change, measuring 28.71 km2, went from barren land to agricultural land, followed by barren land to a built-up area (18.13 km2). Similarly, a 12.63 km2 area of agricultural land was converted into a built-up area during the last three decades (Figure 8). During the same period, 3.15 km2 of agricultural land was converted into barren land.
4.2 LULC and land surface temperature
In this study, we also used the Landsat thermal band to calculate the land surface temperature (LST) of the study area. The LST map was arranged into five different classes (Figure 9A). It can be observed that in 1990, the temperature of the study area was generally under 28°C. There were only a few patches of temperature class ≥ 32.1°C because most of Larkana was covered with agricultural/open land and the built-up area was smaller (Figures 6, 8A). As the agricultural land decreased and the built-up area increased, the surface temperature started to rise and continued to do so until 2020. In the year 2020, more than 80% of the area within the city boundary experienced high surface temperatures because impervious surfaces absorb more heat, which is the main reason for high temperatures in cities (Moazzam et al., 2022). It can be observed that in 2000 and 2010, the patches of high surface temperatures grew, but in 2020, the high surface temperature expanded over the city border zone and the surrounding temperature also remained high (Figure 9A).
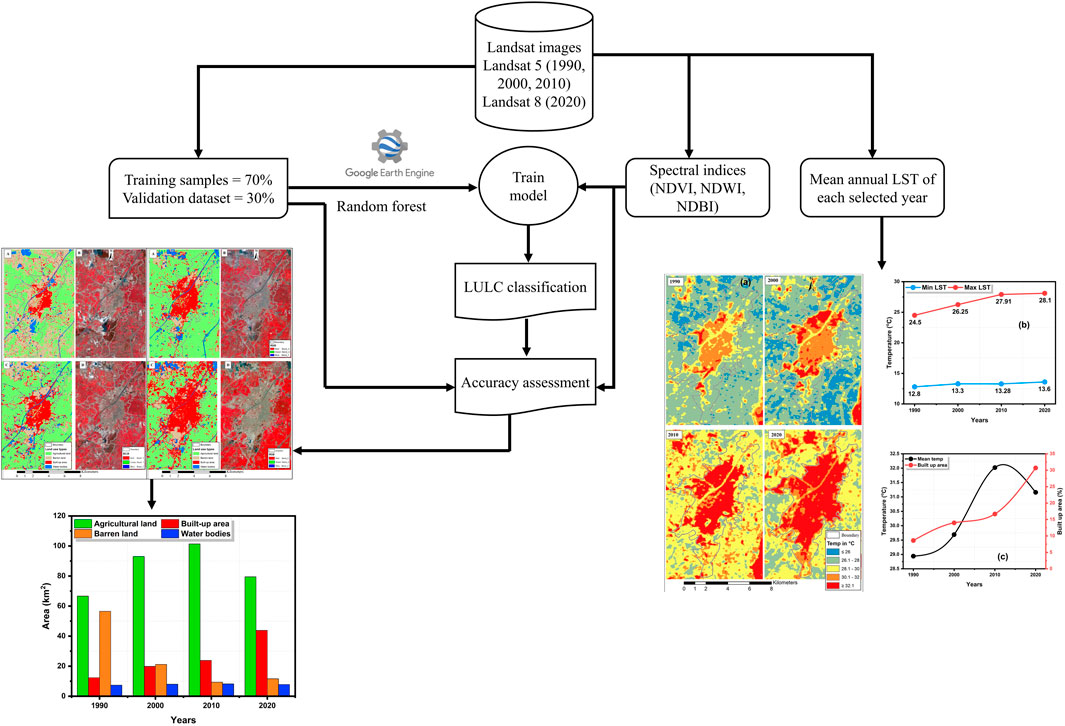
FIGURE 6. Study flowchart.
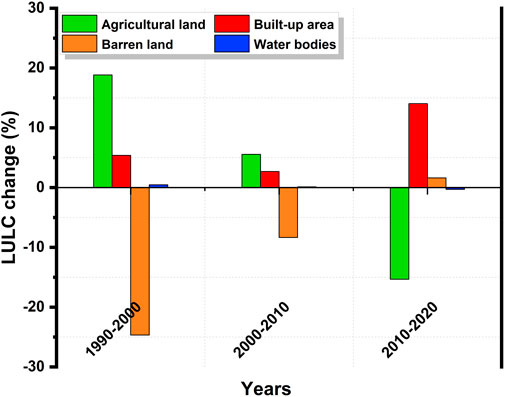
FIGURE 7. LULC change from 1990 to 2020.
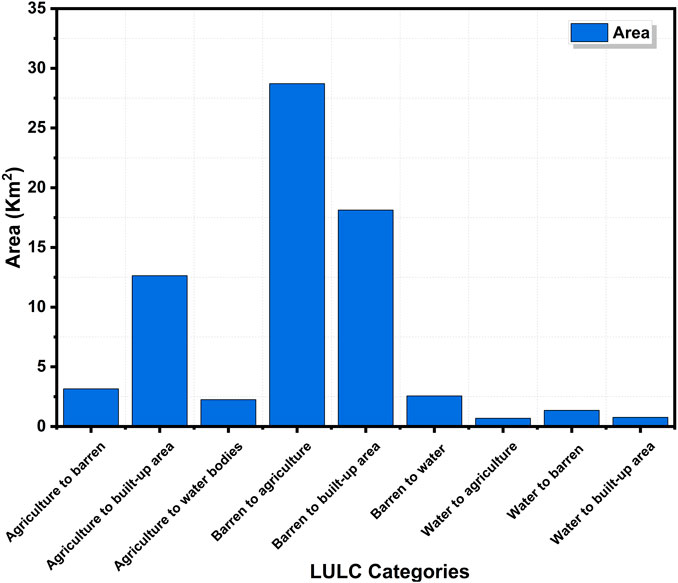
FIGURE 8. LULC category conversion between 1990 and 2020.
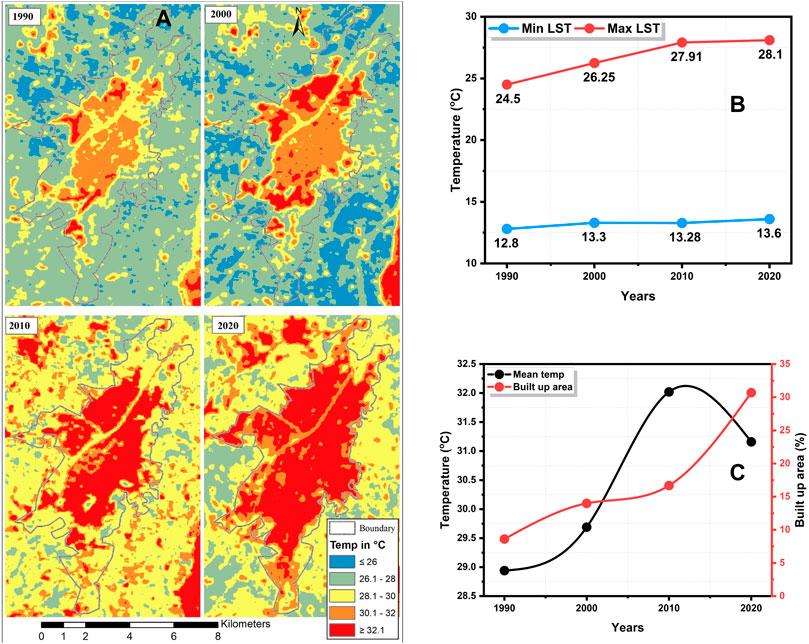
FIGURE 9. (A) LST in Larkana; (B) Minimum and maximum LSTs, and (C) Mean urban LST and urban area in 1990, 2000, 2010, and 2020.
The Figure 9B revealed that the research area’s mean minimum and mean maximum temperatures grew steadily over the course of the investigation. In 1990, the minimum temperature was 25.1°C, while the maximum temperature was 33.4°C. By 2020, those numbers eventually grew to 26.6°C and 36.1°C, respectively (Figure 9B). Therefore, we further evaluated and compared the built-up area with the mean temperature of the urban area, and we found that as the urban area increased, so did the mean surface temperature of the urban land (Figure 8C). The mean temperature in 1990, when urban land was only 8.62% of the total area, was 29.25°C; however, as the urban area expanded, so did Larkana and the surrounding areas’ mean surface temperature, reaching a maximum of 36.1°C, and 31.35°C when the urban area increased to 30.70% in 2020 (Figure 9C).
We have extended our analysis and tried to find out the difference in the mean LST of the built-up area with barren land, agricultural land, and water bodies. It was observed that barren land has a higher surface temperature than the built-up area (Figure 10). However, the surface temperature of built-up land was higher than that of agricultural land and water bodies, and it increased consistently with time (Figure 10). In Table 3, the minimum, maximum, and mean LST and their respective standard deviations were compared for each LULC category in each year. The results of LST show a continuous rise in minimum, maximum, and mean LST for each LULC category from 1990 to 2020.
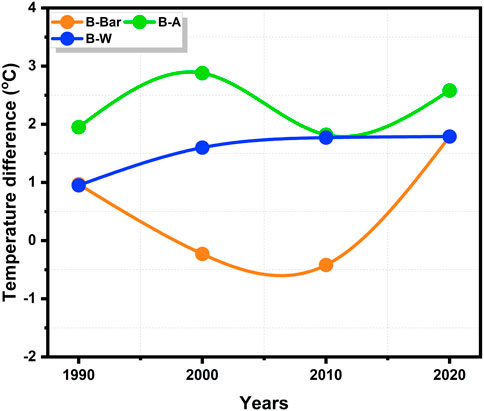
FIGURE 10. Mean built-up land (B) LST difference with Barren land (Bar), Agricultural land (A), and Water bodies (W) for the years 1990, 2000, 2010, and 2020.
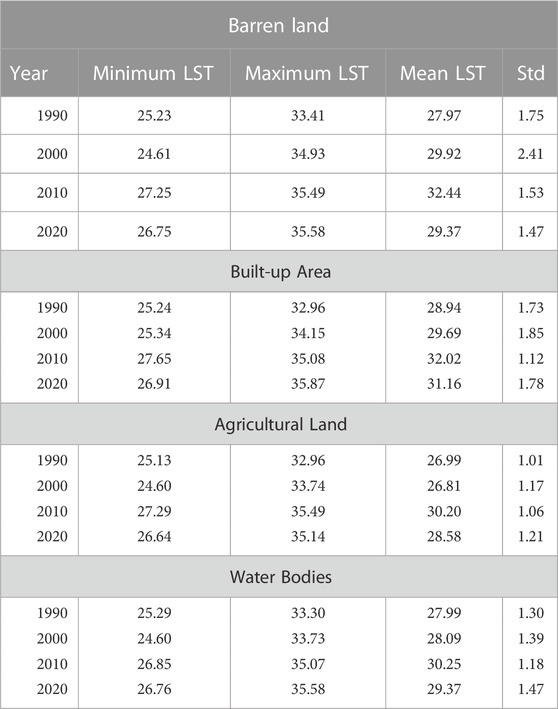
TABLE 3. Minimum, maximum, mean LST, and standard deviation for different land use classes during 1990, 2000, 2010, and 2020.
The lowest recorded mean average temperature in Larkana was 15°C in January, with a maximum temperature of 22.7°C and a minimum temperature of 7.6°C in the same month (Figure 10). It gradually started to increase and reached its highest level in May and June. The highest minimum, maximum, and mean temperatures in the study area were observed during May and June, while they started to decrease in July and August. The monsoon rains occur in the study area during July and August, which decrease the temperature to an optimal level. The annual range of mean temperature in the study area is almost 21o C (Figure 11).
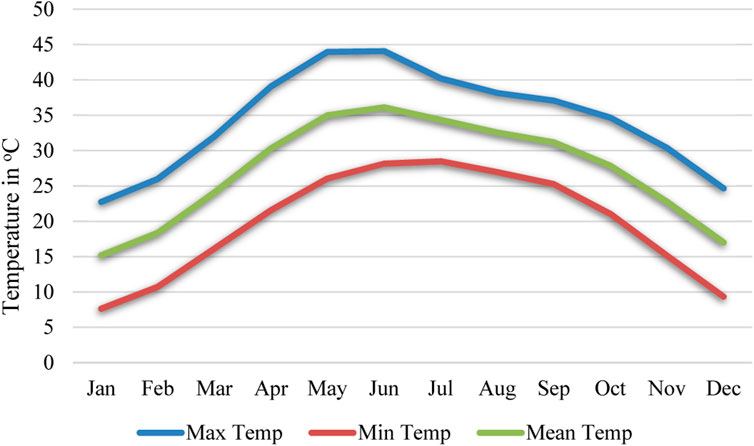
FIGURE 11. Monthly mean, maximum, and minimum temperatures in Larkana.
The change in LST during the study period in different land use categories was calculated as shown in Table 4. The results showed an increase in LST in all land use categories from 1990 to 2020. The highest growth in mean and maximum LST was observed in the built-up area category, while the lowest increase in mean LST was observed in the water bodies category, and the lowest increment in maximum LST was observed in the barren land category (Table 4). Similarly, the lowest increase in minimum LST was observed in the water bodies category, and the highest was in the built-up area category. The highest increase in minimum LST in the barren land category was observed between 2000 and 2010, as was the highest increase in mean LST. Similar results were revealed for other land use categories, and the highest minimum and mean LST were observed between 2000 and 2010. The main reason behind this high LST might be the highest temperature in the year 2010 during May and June in Sindh, which caused a severe heat wave in different cities of Pakistan and also created an unusually low-pressure area that attracted the monsoonal winds and became the cause of massive flooding (Rahman and Khan, 2013). In 2010, the highest temperature ever recorded in South Asia was 53.5 o C on 26 May at Mohenju-Daro, near the city of Larkana (Rahman and Khan, 2013). Agricultural land also showed the highest LST during 2000-2010, indicating that crops were also under high stress during this period. Similar results were observed for water bodies.
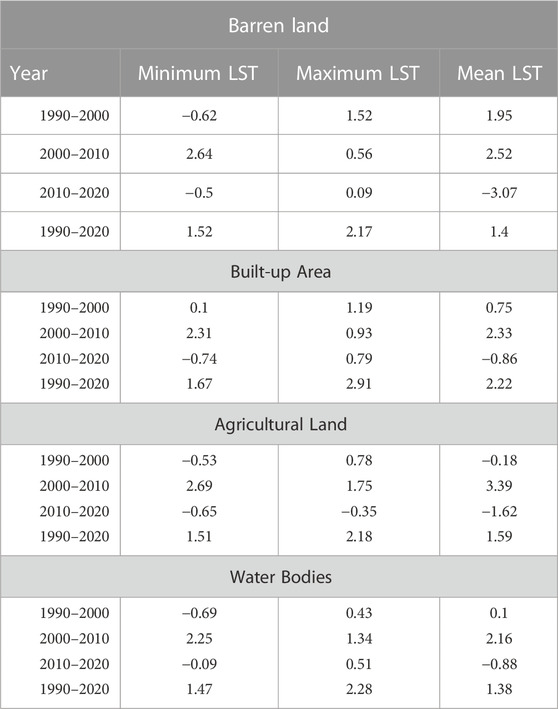
TABLE 4. Change in minimum, maximum, and mean LST of different land use classes during 1990, 2000, 2010, and 2020.
The annual mean air temperature obtained from the Larkana meteorological station for each particular year was compared with the annual mean land surface temperature derived from Landsat imagery. Both the annual mean air temperature and the mean annual LST show a gradual increase in temperature in the study area (Figure 12). In 1990, the mean annual air temperature was 26.87°C, which increased to 28.05°C in 2020, while the mean annual LST was 29.25°C in 1990, which rose to 31.35°C in 2020 (Figure 12).
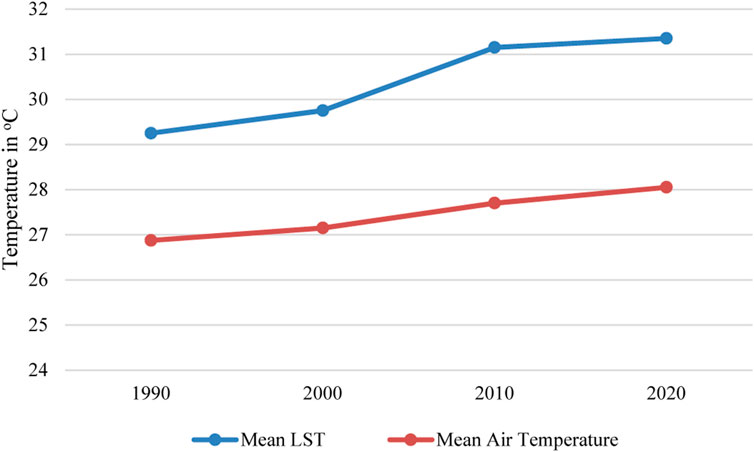
FIGURE 12. Comparison of mean air temperature and land surface temperature in Larkana.
5 Discussion
The current study analyzed the impacts of urban expansion on agricultural land and the urban thermal environment in Larkana. Larkana is the fourth largest city in Sindh after Karachi, Hyderbad, and Sukkur. For LULC classification, the Random Forest algorithm was applied in the Google Earth Engine online platform for the years 1990, 2000, 2010, and 2020, while the land surface temperature was also calculated in GEE using a single channel algorithm. In this study, the most pronounced change was the abrupt increase in the built-up area and the drastic decline in the open barren land area, and to some extent, a decrease in agricultural land. In the last three decades, such abrupt changes have been more likely due to population growth in Larkana. According to government records, in 1951, the Larkana city population was merely 34,000 persons, which increased to 490,508 persons as of the 2017 census (GOP, 2017). Such abrupt changes in the built-up area created a number of environmental issues and replaced other LULC categories like agricultural and open spaces (barren land) (Aburas et al., 2021; Yousafzai et al., 2022). No such study has been conducted in Larkana or even other intermediate cities in the Sindh province to date; therefore, the results of this study have been discussed in light of other studies conducted worldwide and in other cities of Pakistan. From the analysis, it was observed that an increase in the built-up area caused a decrease in the proportion of barren land or open areas in addition to agricultural land, and the same results are consistent with other studies conducted in different parts of the world and different cities of Pakistan, such as the Nile delta in Egypt (Radwan et al., 2019), the Tarai region in Nepal (Rimal et al., 2018), Kansas City, USA (Zubair et al., 2019), Torres Vedras, Portugal (Gomes et al., 2019), Kolkata, India (Sahana et al., 2018), Karachi (Arshad et al., 2020), Peshawar (Khan et al., 2019; Yousafzai et al., 2022), Faisalabad (Tariq and Shu, 2020), Islamabad (Sohail et al., 2019), Hyderabad (Peerzado et al., 2019), Quetta (Khan et al., 2020), and Lahore (Fahad et al., 2021). The change in the built-up area was more pronounced between 2010 and 2020, and according to the local community, this abrupt increase in the built-up area is due to large migration after the 2010 floods in the Kamber-Shahdadkot, Dadu, and Shikarpur districts. This migration not only increased the built-up area but also caused a sharp decline in the agricultural land between 2010 and 2020 (Figures 3–5). The increase in urban population and urban expansion in Larkana and its surroundings was further discussed with local elders, as no satisfactory literature was available from which we could determine the possible causes. According to the elders of the area, Larkana is the home of versatile politicians like the late Zulfiqar Ali Bhutto and Benazir Bhutto, and during their time of government they improved the city’s infrastructure in many areas, including health, education, and housing. As a result, people from the districts moved in search of better education, health, quality of life, and jobs. This overwhelming migration resulted in an unplanned expansion of the built-up area over agricultural land and encroached on open areas. The inner-city areas became congested due to the low availability of land for new development, resulting in other environmental and social issues. The LST for each category of LULC was also evaluated in this study, and it was observed that barren land and built-up area have the highest LST and similar results have been observed in other six urban centers in Pakistan (Dilawar et al., 2021). The mean, maximum, and minimum LST of all categories of LULC recorded a consistent increase, and a similar increase was also observed in other studies (Ibrahim and Rasul, 2017; Dilawar et al., 2021; Moazzam et al., 2022). The results revealed that between 1990 and 2020, the minimum LST increased by 1.52oC, the maximum LST by 2.17oC and the mean LST increased by 1.4oC in the barren land category, while in the built-up area the minimum LST increase was 1.67°C, the maximum LST was 2.91oC, and the mean LST increase was 2.22oC. Similarly, during the study period, the increase in minimum LST in agricultural land was 1.51°C, in maximum LST it was 2.18oC and in mean LST was 1.59°C. A comparable increase was observed in the land surface temperature of water bodies during the study period. The land surface temperature of the inner city and its surroundings rose due to increase in the impervious surfaces.
6 Conclusion
This study assessed the urban expansion impacts on agricultural land and the urban thermal environment in Larkana by performing a Random Forest algorithm for land use/ land cover classification in Google Earth Engine and calculating land surface temperature using Landsat images. The Random Forest algorithm is a useful and highly accurate technique for assessing temporal LULC change. The results revealed that the urban area expanded over barren land and agricultural land in Larkana. In the last three decades (1990-2020), the built-up area of the city increased from 12.31 km2 to 43.83 km2, which is more than a threefold increase. This surge in the built-up area took over the surrounding open land, which was either barren land or agricultural land. This haphazard expansion in the urban built environment not only displaced agricultural land but also caused different environmental hazards like increasing land surface temperature and affecting the urban thermal environment. Barren land in the study area decreased from 56.51 km2 to 11.62 km2, representing a decrease of 79.44% over three decades. The water bodies increased in the study region due to the increasing importance of inland fish farming. The LULC classification results were validated using 30% sample points data, and for all selected years, the accuracy was close to 90%, which indicates the importance and accuracy of the RF algorithm for temporal LULC classification. The LST maps were prepared for 1990, 2000, 2010, and 2020 using GEE in order to check the status of the urban thermal environment, and the results indicated a gradual increase in surface temperature in all land use categories. The cause of this gradual increase in surface temperature is the increase in built-up area over barren, agricultural land, and open green vegetation. This study’s results endorse prior planning and policy implementation to control the haphazard urban expansion over fertile agricultural land.
Data availability statement
The raw data supporting the conclusion of this article will be made available by the authors, without undue reservation.
Author contributions
GR and NC conceptualization, GR acquired the data, data curation, formal analysis, investigation, methodology, GR, MM, and NC validation, visualization, writing original draft, NA acquire funding, supervision, project administration, resources, writing, review, and editing.
Acknowledgments
The authors acknowledge the United States Geological Survey (USGS) and the National Aeronautics and Space Administration (NASA) for providing Landsat data free of charge.
Conflict of interest
The authors declare that the research was conducted in the absence of any commercial or financial relationships that could be construed as a potential conflict of interest.
Publisher’s note
All claims expressed in this article are solely those of the authors and do not necessarily represent those of their affiliated organizations, or those of the publisher, the editors and the reviewers. Any product that may be evaluated in this article, or claim that may be made by its manufacturer, is not guaranteed or endorsed by the publisher.
References
Aburas, M. M., Ho, Y. M., Pradhan, B., Salleh, A. H., and Alazaiza, M. Y. (2021). Spatio-temporal simulation of future urban growth trends using an integrated CA-Markov model. Arabian J. Geosciences 14, 131–212. doi:10.1007/s12517-021-06487-8
Al-Thawwad, R. M. (2008). “Technology transfer and sustainability-Adapting factors: Culture, physical environment, and geographical location,” in Proceedings of the 2008 IAJC-IJME international conference (Sheraton Music City, USA: Citeseer).
Aliyu, A. A., and Amadu, L. (2017). Urbanization, cities, and health: The challenges to Nigeria–a review. Ann. Afr. Med. 16, 149–158. doi:10.4103/aam.aam_1_17
Arshad, A., Ashraf, M., Sundari, R. S., Qamar, H., Wajid, M., and Hasan, M. U. (2020). Vulnerability assessment of urban expansion and modelling green spaces to build heat waves risk resiliency in Karachi. Int. J. disaster risk Reduct. 46, 101468. doi:10.1016/j.ijdrr.2019.101468
Ashraf, H., Mobeen, M., Miandad, M., Khan, M. A., Rahman, G., and Munawar, S. (2022). Assessment of urban sprawl in sargodha city using remotely sense data. Ecol. Quest. 33, 1–16. doi:10.12775/eq.2022.030
Ashraf, H., Rahman, G., Khan, M. A., Moazzam, M. F. U., and Miandad, M. (2023). “Spatio-temporal urban sprawl of sargodha city, Punjab, Pakistan,” in Urban environment and smart cities in asian countries. Editor U. C. E. AL (Cham, Switzerland: Springer).
Butt, A., Shabbir, R., Ahmad, S. S., and Aziz, N. (2015). Land use change mapping and analysis using remote sensing and gis: A case study of simly watershed, Islamabad, Pakistan. Egypt. J. Remote Sens. Space Sci. 18, 251–259. doi:10.1016/j.ejrs.2015.07.003
Chandio, N. H., and Shirazi, S. A. (2022). Implications of urbanization on agricultural land: A case study of khairpur district, Pakistan. Pak. Soc. Sci. Rev. 6, 232–240. doi:10.35484/pssr.2022(6-ii)21
Dilawar, A., Chen, B., Trisurat, Y., Tuankrua, V., Arshad, A., Hussain, Y., et al. (2021). Spatiotemporal shifts in thermal climate in responses to urban cover changes: A-Case analysis of major cities in Punjab, Pakistan. Geomatics, Nat. Hazards Risk 12, 763–793. doi:10.1080/19475705.2021.1890235
Fahad, S., Li, W., Lashari, A. H., Islam, A., Khattak, L. H., and Rasool, U. (2021). Evaluation of land use and land cover Spatio-temporal change during rapid Urban sprawl from Lahore, Pakistan. Urban Clim. 39, 100931. doi:10.1016/j.uclim.2021.100931
Farid, N., Moazzam, M., Ahmad, S., Coluzzi, R., and Lanfredi, M. (2022). Monitoring the impact of rapid urbanization on land surface temperature and assessment of surface urban heat island using landsat in megacity (Lahore) of Pakistan. Front. Remote Sens. 3, 897397. doi:10.3389/frsen.2022.897397
Gandharum, L., Hartono, D. M., Karsidi, A., and Ahmad, M. (2022). Monitoring urban expansion and loss of agriculture on the north coast of west java province, Indonesia, using Google Earth engine and intensity analysis. Sci. World J. 2022, 1–16. doi:10.1155/2022/3123788
Gao, B. C. (1996). NDWI—a normalized difference water index for remote sensing of vegetation liquid water from space. Remote Sens. Environ. 58, 257–266. doi:10.1016/s0034-4257(96)00067-3
Gomes, E., Abrantes, P., Banos, A., Rocha, J., and Buxton, M. (2019). Farming under urban pressure: Farmers' land use and land cover change intentions. Appl. Geogr. 102, 58–70. doi:10.1016/j.apgeog.2018.12.009
GOP (2017). “Larkana district census report-2017,” in Pakistan bureau of statistics (Islamabad: Pakistan Bureau of Statistics, Government of Pakistan).
Gul, S., Bibi, T., Rahim, S., Gul, Y., Niaz, A., Mumtaz, S., et al. (2022). Spatio-temporal change detection of land use and land cover in Malakand Division Khyber Pakhtunkhwa, Pakistan, using remote sensing and geographic information system. Environ. Sci. Pollut. Res. 30, 10982–10994. doi:10.1007/s11356-022-22960-7
Ibrahim, F., and Rasul, G. (2017). Urban land use land cover changes and their effect on land surface temperature: Case study using Dohuk City in the Kurdistan Region of Iraq. Climate 5, 1–18. doi:10.3390/cli5010013
Khan, I., Javed, T., Khan, A., Lei, H., Muhammad, I., Ali, I., et al. (2019). Impact assessment of land use change on surface temperature and agricultural productivity in Peshawar-Pakistan. Environ. Sci. Pollut. Res. 26, 33076–33085. doi:10.1007/s11356-019-06448-5
Khan, S. (2019). The impact of urban expansion on agricultural land use changes in Aligarh, Uttar Pradesh, India. Int. Archives Photogrammetry, Remote Sens. Spatial Inf. Sci. 42, 381–384. doi:10.5194/isprs-archives-xlii-3-w6-381-2019
Khan, Z., Saeed, A., and Bazai, M. H. (2020). Land use/land cover change detection and prediction using the CA-markov model: A case study of Quetta city, Pakistan. J. Geogr. Soc. Sci. 2, 164–182.
Mehdi, S. S., Miandad, M., Anwar, M., Rahman, G., and Ashraf, H. (2021). Temporal variation in land use and land cover in gujrat (Pakistan) from 1985 to 2015. Geogr. Nat. Resour. 42, 151–161. doi:10.15372/gipr20210416
Moazzam, M. F. U., Doh, Y. H., and Lee, B. G. (2022). Impact of urbanization on land surface temperature and surface urban heat island using optical remote sensing data: A case study of jeju island, republic of Korea. Build. Environ. 222, 109368. doi:10.1016/j.buildenv.2022.109368
Mumtaz, F., Li, J., Liu, Q., Tariq, A., Arshad, A., Dong, Y., et al. (2023). Impacts of green farbon emissions: Comparison under forestation and urbanization reshaping scenarios. Remote Sens. 15 (3), 1–24. doi:10.3390/rs15030859
Nyland, E., Gunn, K. E., Shiklomanov, G., I., Engstrom, N., N., and Streletskiy, A. (2018). Land cover change in the lower Yenisei River using dense stacking of landsat imagery in Google Earth Engine. Remote Sens. 10, 1–20. doi:10.3390/rs10081226
Peerzado, M. B., Magsi, H., and Sheikh, M. J. (2019). Land use conflicts and urban sprawl: Conversion of agriculture lands into urbanization in Hyderabad, Pakistan. J. Saudi Soc. Agric. Sci. 18, 423–428. doi:10.1016/j.jssas.2018.02.002
Radwan, T. M., Blackburn, G. A., Whyatt, J. D., and Atkinson, P. M. (2019). Dramatic loss of agricultural land due to urban expansion threatens food security in the Nile Delta, Egypt. Remote Sens. 11, 332. doi:10.3390/rs11030332
Rahman, A. U., Khan, A., Haq, N., and Shaw, R. (2019). Soil sealing and depletion of groundwater in rapidly growing Peshawar City District, Pakistan. Urban Drought. Pakistan: Springer.
Rahman, A., and Khan, A. N. (2013). Analysis of 2010-flood causes, nature and magnitude in the Khyber Pakhtunkhwa, Pakistan. Nat. Hazards 66, 887–904. doi:10.1007/s11069-012-0528-3
Rimal, B., Zhang, L., Stork, N., Sloan, S., and Rijal, S. (2018). Urban expansion occurred at the expense of agricultural lands in the Tarai region of Nepal from 1989 to 2016. Sustainability 10, 1341–1419. doi:10.3390/su10051341
Rizwan, A. M., Dennis, L. Y., and Chunho, L. (2008). A review on the generation, determination and mitigation of Urban Heat Island. J. Environ. Sci. 20, 120–128. doi:10.1016/s1001-0742(08)60019-4
Sahana, M., Hong, H., and Sajjad, H. (2018). Analyzing urban spatial patterns and trend of urban growth using urban sprawl matrix: A study on Kolkata urban agglomeration, India. Sci. Total Environ. 628, 1557–1566. doi:10.1016/j.scitotenv.2018.02.170
Sohail, M. T., Mahfooz, Y., Azam, K., Yen, Y., Genfu, L., and Fahad, S. (2019). Impacts of urbanization and land cover dynamics on underground water in Islamabad, Pakistan. Desalin Water Treat. 159, 402–411. doi:10.5004/dwt.2019.24156
Sun, X., Crittenden, J. C., Li, F., Lu, Z., and Dou, X. (2018). Urban expansion simulation and the spatio-temporal changes of ecosystem services, a case study in Atlanta Metropolitan area, USA. Sci. Total Environ. 622, 974–987. doi:10.1016/j.scitotenv.2017.12.062
Tariq, A., Mumtaz, F., Zeng, X., Baloch, M. Y. J., and Moazzam, M. F. U. (2022). “Spatio-temporal variation of seasonal heat islands mapping of Pakistan during 2000–2019, using day-time and night-time land surface temperatures MODIS and meteorological stations data,” in Remote sensing applications: Society and Environment 27, 100779. doi:10.1016/j.rsase.2022.100779
Tariq, A., and Shu, H. (2020). CA-Markov chain analysis of seasonal land surface temperature and land use land cover change using optical multi-temporal satellite data of Faisalabad, Pakistan. Remote Sens. 12, 3402. doi:10.3390/rs12203402
Thanh Noi, P., and Kappas, M. (2017). Comparison of Random forest, k-nearest neighbor, and support vector machine classifiers for land cover classification using Sentinel-2 imagery. Sensors 18, 18–20. doi:10.3390/s18010018
Ul Din, S., and Mak, H. W. L. (2021). Retrieval of land-use/land cover change (LUCC) maps and urban expansion dynamics of Hyderabad, Pakistan via landsat datasets and support vector machine framework. Remote Sens. 13, 3337–3425. doi:10.3390/rs13163337
UN-DESA (2018). 2018 revision of world urbanization prospects. New York, NY, USA: United Nations Department of Economic and Social.
Wang, J., Zhou, W., Pickett, S. T., Yu, W., and Li, W. (2019). A multiscale analysis of urbanization effects on ecosystem services supply in an urban megaregion. Sci. total Environ. 662, 824–833. doi:10.1016/j.scitotenv.2019.01.260
Yousafzai, S., Saeed, R., Rahman, G., and Farish, S. (2022). Spatio-temporal assessment of land use dynamics and urbanization: Linking with environmental aspects and DPSIR framework approach. Environ. Sci. Pollut. Res. 29, 81337–81350. doi:10.1007/s11356-022-21393-6
Zou, Z., Yan, C., Yu, L., Jiang, X., Ding, J., Qin, L., et al. (2021). Impacts of land use/land cover types on interactions between urban heat island effects and heat waves. Build. Environ. 204, 108138–108211. doi:10.1016/j.buildenv.2021.108138
Keywords: urban expansion, land use land cover change, thermal environment, agriculture, Larkana
Citation: Rahman G, Chandio NH, Moazzam MFU and Al Ansari N (2023) Urban expansion impacts on agricultural land and thermal environment in Larkana, Pakistan. Front. Environ. Sci. 11:1115553. doi: 10.3389/fenvs.2023.1115553
Received: 04 December 2022; Accepted: 06 March 2023;
Published: 21 March 2023.
Edited by:
Faisal Mumtaz, Aerospace Information Research Institute (CAS), ChinaReviewed by:
Amit Kumar, Central University of Jharkhand, IndiaJamil Hasan Kazmi, University of Karachi, Pakistan
Copyright © 2023 Rahman, Chandio, Moazzam and Al Ansari. This is an open-access article distributed under the terms of the Creative Commons Attribution License (CC BY). The use, distribution or reproduction in other forums is permitted, provided the original author(s) and the copyright owner(s) are credited and that the original publication in this journal is cited, in accordance with accepted academic practice. No use, distribution or reproduction is permitted which does not comply with these terms.
*Correspondence: Nadhir Al Ansari, bmFkaGlyLmFsYW5zYXJpQGx0dS5zZQ==