- 1School of Finance, Shandong University of Finance and Economics, Jinan, China
- 2School of Economics, Shandong University, Jinan, China
We explore the dynamics and determinants of volatility connectedness between cryptocurrencies and energy. We employed a block dynamic equicorrelation model and a group volatility connectedness measurement to measure the cross-equicorrelation and volatility connectedness between cryptocurrencies and energy. We also adopted dynamic model averaging to identify the time-varying drivers. The results suggest that changes in cross-equicorrelation between the two groups were affected by influential global events and increased after the COVID-19 pandemic. Volatilities were transmitted in both directions between cryptocurrencies and energy, but the transmission from energy to cryptocurrencies is by far the strongest. The driver identification implies that the factors related to cryptocurrencies and global financial markets had important roles in explaining the volatility connectedness from cryptocurrencies to energy in some periods after the COVID-19 pandemic, but the effects were marginal. In contrast, factors such as electricity consumption, cryptocurrency turnovers, and VIX were important in affecting the volatility connectedness from energy to cryptocurrencies, and the effects depended on factors and changed over time.
1 Introduction
The global economy has been trapped in a downward spiral in recent years. In addition, a sequence of influential events has shocked the global financial markets, such as the US-China trade war, the COVID-19 pandemic, and the Russia-Ukraine war. Against the increasing risks in the financial markets, investors are looking for safe-haven assets that can provide a hedge during turmoil.
One of the safe-haven assets investors have considered is cryptocurrencies (El Montasser et al., 2022; Sarkodie et al., 2022). Blockchain technology ensures the safety of cryptocurrencies. Cryptocurrencies are technically immune to government manipulation and should provide a good hedge to traditional financial assets during times of crisis.
Cryptocurrencies are obtained via a mining process, which consumes electricity (Hayes, 2017; Li et al., 2019). In many countries, electricity is generated by burning fossil energy. Thus, the fluctuations in energy costs can affect the cryptocurrency market through several channels. For example, the change in energy costs can affect the cost of mining cryptocurrencies and hence affect their supply. Moreover, the changes in fossil energy prices reflect the changes in supply and demand in the global energy market, which further affect global investors’ sentiments. Changing risk appetites in global financial markets can affect investors’ opinions of the cryptocurrency market, thus affecting demand for cryptocurrencies.
Studies conducted in 2018 and 2019 reported that the cryptocurrency market was isolated from global financial markets and not closely related to the energy market (Cobert et al., 2018; Ji et al., 2019). However, the latest evidence suggests that the correlation between cryptocurrencies and traditional financial markets increased after the COVID-19 pandemic (Corbet et al., 2020; Yen and Cheng, 2021; Wang H et al., 2022). Several events made many investors interested in cryptocurrencies: The COVID-19 pandemic dramatically increased concerns in global financial markets; the great uncertainties due to the United States election reduced investors’ confidence in traditional financial markets; the Russia-Ukraine war in 2022 increased global geopolitical risks. Thus, it is worth re-examining the correlation between cryptocurrencies and energy and testing the volatility spillovers between these two markets against the background of the changing global economic and financial environment.1
Many studies focused on the relationship between energy and cryptocurrencies. Krause and Tolaymat (2018) and Li et al. (2019) quantified the cost of energy in cryptocurrency mining work. Inspired by the energy cost of cryptocurrency mining work and integration of global financial market, Afjal and Clanganthuruthil Sajeev (2022) and Ji et al. (2019) explored the interconnection between the cryptocurrency market and energy market, and they found that the cryptocurrency became more closely related to energy after the COVID-19 pandemic. Li and Meng (2022) further indicated that the spillovers from energy dominated the total connectedness of energy and cryptocurrencies. By contrast, Corbet et al. (2021) documented that the energy usage of cryptocurrency mining make cryptocurrencies affected energy market. Meanwhile, some studies illustrate that uncertainties and risk factors have the potential to affect the connectedness of financial products (Adekoya et al., 2021; Nguyen and Lambe, 2021; Wu et al., 2022).
Diebold and Yılmaz’s (2014) connectedness measure estimates the spillovers across a series of variables based on the generalized variance decomposition. Gabauer (2020) further applied the idea of connectedness to the DCC-GARCH model and proposed a measurement of volatility connectedness. The volatility connectedness can measure how the volatilities are transmitted across different variables. However, the DCC-GARCH model suffers the so-called “curse of the dimension”: it becomes increasingly difficult to estimate the model as the dimensions increase. Engle and Kelly (2012) proposed a dynamic equicorrelation (DECO-GARCH) model to deal with the dimensional issues encountered in the DCC-GARCH model.
To explore how cryptocurrencies and energy are connected, we adopt the DECO-GARCH model to address the potential dimensional problem and employ Gabauer’s (2020) volatility connectedness to measure the risk contagion between the cryptocurrency market and energy market. Specifically, we collected data on eight cryptocurrencies with the largest market capitalizations and eight energy prices that are representative of fossil energy.2 As the price series are naturally grouped, we modify the canonical DECO-GARCH and utilize a block DECO-GARCH model. Furthermore, we construct the group volatility connectedness using Gabauer’s (2020) pairwise volatility connectedness.
Considering that the risks could be transmitted across markets through several channels, we further investigate the drivers of the volatility connectedness. We consider two sets of potential drivers. The first set is related to the cryptocurrency market. We collect the cryptocurrency policy uncertainty index (UCRY) proposed by Lucey et al. (2022), the cryptocurrency environmental attention index (ICEA) proposed by Wang Y et al., 2022 (forthcoming), the Cambridge Bitcoin Electricity Consumption index (CBECI), and the market aggregated turnovers (Turnover). The second set is related to uncertainties and factors in global financial markets. We collect data on the Twitter-based economic uncertainty index (TEU), global geopolitical risk index (GPR), economic policy uncertainty (EPU), the VIX, and the United States dollar (USD). To identify the role of these potential drivers, we employ the dynamic model averaging (DMA) approach proposed by Raftery et al. (2010). The estimation of DMA is based on Bayes’ theorem. We identify the importance of potential factors using their posterior inclusion probability (PIP) and identify their effect using expected coefficients.
The block DECO-GARCH model’s estimation indicates that the cross-equicorrelation between cryptocurrencies and energy was generally weak, with a value lower than 0.15 most of the time. However, the cross-equicorrelation changed dramatically over time, and the spikes and troughs were related to influential events. The analysis of the volatility connectedness suggests that risks were transmitted between the cryptocurrency and energy markets, and the spillovers increased after the COVID-19 pandemic. Furthermore, the directional connectedness shows that the volatility spillovers mainly occurred from energy to cryptocurrencies and cryptocurrencies’ volatility spillovers were extremely small. The identification of the drivers of two directional volatility connectedness suggests that the role of the drivers and the effects vary over time. Generally speaking, the potential drivers were less important in affecting the volatility connectedness from cryptocurrencies than the connectedness from energies. Regarding the drivers of risk spillovers from cryptocurrencies, the UCRY, CBECI, TEU, GBP, and USD acted as important factors in some specific periods after the COVID-19 pandemic, but their effects were minor and dependent. Regarding the drivers of risk spillovers from energy, the CBECI, Turnover, and the VIX consistently acted as important drivers, and the former four displayed positive effects; the importance of GPR dramatically increased after the Russia-Ukraine war and displayed a negative effect; the roles of UCRY, ICEA, and EPU were slightly less pronounced, and their effects switched between positive and negative several times.
This study can contribute to the literature in the following ways. First, our findings update the knowledge about how risks were transmitted between the cryptocurrency market and the energy market. They also show that the direction of transmission mainly went from the energy market to the cryptocurrency market. Second, our results provide insights into the drivers of risk sharing between cryptocurrencies and energy, and the changing effects of these drivers help to understand the channels through which the markets were connected. Lastly, we incorporate the block DECO-GARCH model into the volatility connectedness measurement and propose a new measurement of group volatility connectedness that could be used to explore the volatility spillovers across financial markets.
The paper is organized as follows. Section 2 lists the methodologies we employed; the data and variables are described in Section 3; Section 4, and Section 5 present the empirical results and robustness check; Section 6 briefly concludes the findings.
2 Hypothesis development
Considering that influential risky events such as the COVID-19 pandemic and the Russian-Ukraine war raised the uncertainties in commodity market and financial markets, the connection between cryptocurrencies and energy would largely be affected by these events. For instance, the Russian-Ukraine war dramatically shocked the global energy market and hiked the volatility of energy products. Meanwhile, the cryptocurrencies were affected by changed sentiments in the global financial markets. Accordingly, we develop the first hypothesis as follows.
H1: The cross-equicorrelation and volatility connectedness between cryptocurrencies and energy changed largely due to the shocks by external events.
As many studies argued, cryptocurrencies were typically considered as candidates of safe-haven assets. Additionally, the debate on whether the cryptocurrency market has been integrated into the global financial market still exists. It is necessary to examine the interdependence between cryptocurrencies and energy. Considering that energy has a long history of a great outward impact on other financial markets, we expect the spillovers between cryptocurrencies and energy were asymmetric, and the volatilities of cryptocurrencies were affected by the shocks in the energy market. Therefore, the second hypothesis is developed as.
H2: The volatility connectedness between cryptocurrencies and energy is asymmetric, and the spillovers from energy to cryptocurrencies dominated the two-way spillovers.
Lastly, the market sentiments affected both the cryptocurrency and energy markets, and the uncertainties could reveal the market sentiments. Therefore, we anticipate that the uncertainties in financial markets affected the connectedness between cryptocurrencies and energy, and the last hypothesis is developed as.
H3: Uncertainties could affect the volatility connectedness between cryptocurrency and energy markets.
3 Methodology
We aim to explore the relationship between cryptocurrencies and energy and identify the drivers of risk spillovers between the two markets. We adopt a DECO-GARCH model proposed by Engle and Kelly (2012) and the volatility connectedness measurement proposed by Gabauer (2020) to construct the group volatility connectedness between two groups of assets. Then, we employ the DMA proposed by Raftery et al. (2010) to estimate the time-varying effects and the importance of potential explanatory factors on the volatility connectedness.
3.1 Equicorrelation model for high-dimensional data
The block DECO-GARCH model can be treated as a feasible dynamic conditional correlation (DCC) estimator. The block DECO-GARCH assumes that the correlation matrix can be split into blocks and that the parameters in each block are the same.3 The block DECO-GARCH model fits the situation better than the DCC-GARCH model when the variables can be naturally grouped. The model framework consists of three components: the mean equations, volatility equations, and correlation dynamics.
In terms of the mean equations and volatility equations, we assume the dynamics of cryptocurrencies and energy follow an ARX(5)-GARCH(1,1) model and an AR(5)-GARCH(1,1) model, respectively, which can be written as
and
where
The variance matrix in the block DECO is assumed as
where
We derive the equicorrelation
and
where
3.2 Block volatility connectedness
We can measure the pairwise volatility connectedness of variables following Gabauer’s (2020) procedure based on the estimation of the block DECO-GARCH model. We construct block volatility connectedness by aggregating pairwise volatility connectedness of variables within the same group.
According to Gabauer (2020), the volatility impulse response function (VIRF) is the following:
where 1 and 0 denote the vectors of one and zero. The VIRF illustrates the volatility responses of a variable to a shock from another variable. The p-step-ahead forecast on the volatility can be estimated recursively based on Eqs. 3–6.
The generalized forecast error variance decomposition (GFEVD) is based on the VIRF. The normalized GFEVD entries are the following:
where
As the variables are naturally divided into two groups, we further construct the block volatility connectedness of the two groups. The volatility connectedness from cryptocurrencies to energy is
The volatility connectedness from energy to cryptocurrencies is
In addition, according to Diebold and Yılmaz (2014), the total volatility connectedness can be expressed as follows:
3.3 Dynamic model averaging
To explore the determinants of connectedness, we employ the DMA approach, which allows the model parameters to be time-varying and identifies the relative importance of potential explanatory variables. The basic idea of DMA is to assign a model probability to each possible model specification. We construct the model set by taking all the combinations of the potential explanatory variables. The representative model specification is as follows:
and
where u indexes the specification in the model set, k denotes
Following Raftery et al. (2010), we estimate the model probability based on Bayes’ theorem. Denoting the representative model probability as
The expected effects of a variable are measured by the expected coefficient:
where
4 Data
4.1 Cryptocurrencies and energy
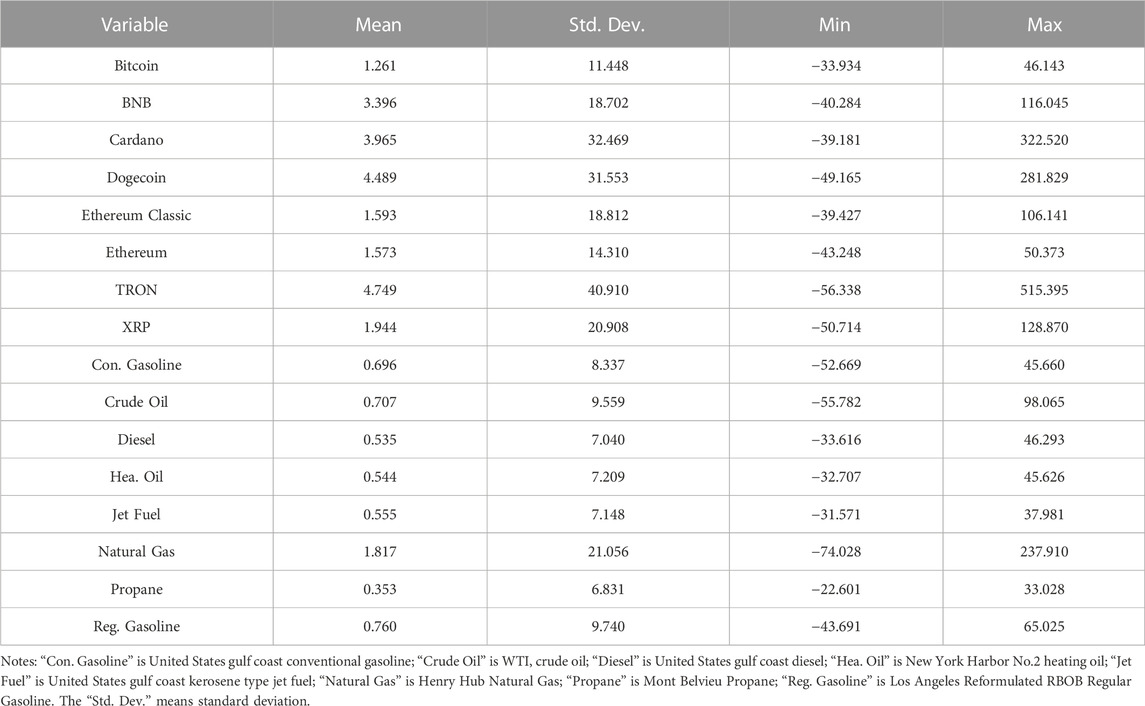
We collect weekly prices of cryptocurrencies and energy types from the CoinMarketCap and the United States Energy Information Administration, respectively. The sample period ranges from October 3, 2017 to October 4, 2022.5 The sample includes 262 consecutive weeks.6 The selected cryptocurrencies were created before October 2017 and are the top eight tokens in terms of their market capitalizations.7 For energy types, we focused on crude oil, petroleum products, and natural gas because they are traded commodities. We have eight price series for energy. Table A1 lists the selected cryptocurrencies and energy types.
Table 1 displays the summary statistics on cryptocurrencies and energy. The averages of returns are all positive, indicating that the cryptocurrency and energy prices increased during the sample period. Furthermore, cryptocurrency prices increased faster than energy. However, cryptocurrencies were much more volatile than energy, suggesting they incurred higher risks than energy during the sample period. Similar findings are evidenced by the maximum weekly returns in Table 1.
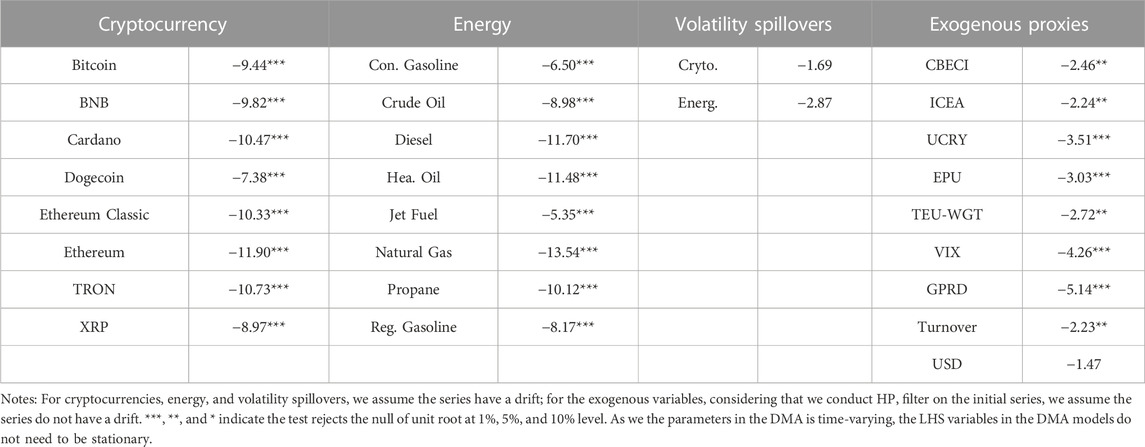
To exhibit the dynamics of the series, we further plotted the returns of cryptocurrencies and energy in Figure 1 and Figure 2. The volatilities of cryptocurrencies were higher than those of energy. Figure 1 shows that the return patterns of cryptocurrencies were similar. For example, the volatilities of all the cryptocurrencies we selected increased in early 2018 and 2021. The energy returns also had similar patterns. For instance, energy prices were highly volatile when the COVID-19 pandemic first erupted in Mar. 2020. However, the correlations between cryptocurrencies and energy changed over time. Additionally, we conduct the unit root test on these return series, and the test suggests these series are stationary.8
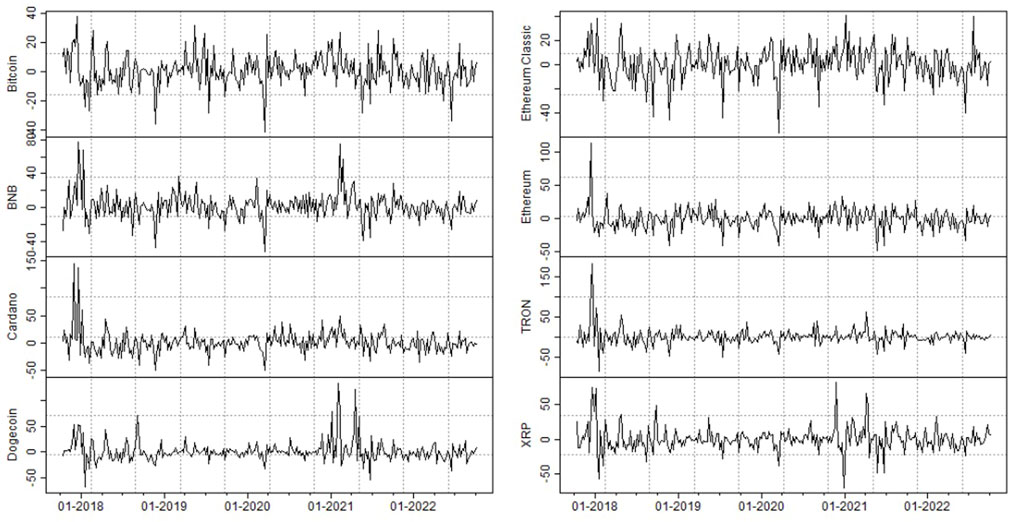
FIGURE 1. Change rates of cryptocurrencies (%). The plots are labeled using the name of the cryptocurrencies.
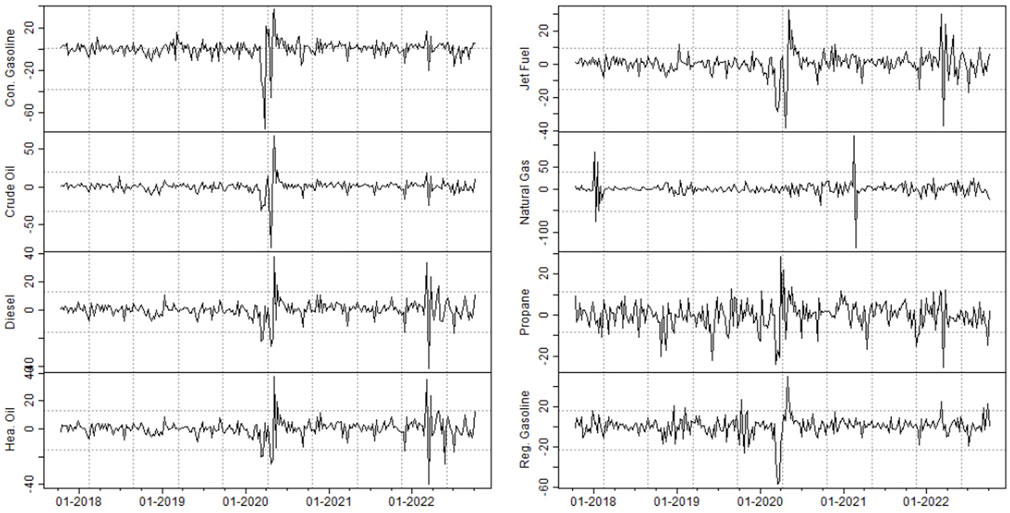
FIGURE 2. Change rates of energycommodities (%). The lable are the same as noted in Table 1.
4.2 Potential drivers of connectedness
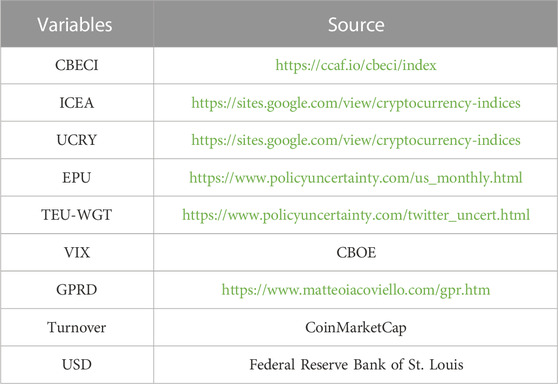
We chose the potential drivers of connectedness by considering a few aspects. First, the policy uncertainty on trading cryptocurrencies directly affects the sentiments about the cryptocurrency market and the mining of cryptocurrencies. Therefore, we consider the UCRY as the potential driver. Second, due to the increasing concerns about the externalities of mining progress, we consider the ICEA. This index captures the intensity of media discussions on the environmental impact of cryptocurrencies. Third, cryptocurrencies are created through mining, which relies on computer calculations of a complex math problem. Accordingly, we consider the CBECI, which estimates the Bitcoin network power used in the mining work. Fourth, in classical financial theory, turnover is one of the factors that could affect asset price. Considering this, we calculate the overall turnovers in cryptocurrency markets. Fifth, many studies have shown that cryptocurrencies and energy are sensitive to different uncertainties in the global financial markets.9 Thus, we further incorporate the TEU, the GPR, the EPU, and the VIX as drivers of connectedness. Lastly, as the USD is the settlement currency for energy products, we also include the nominal effective exchange rate of the USD index. Table A2 shows the detailed sources of these exogenous variables.
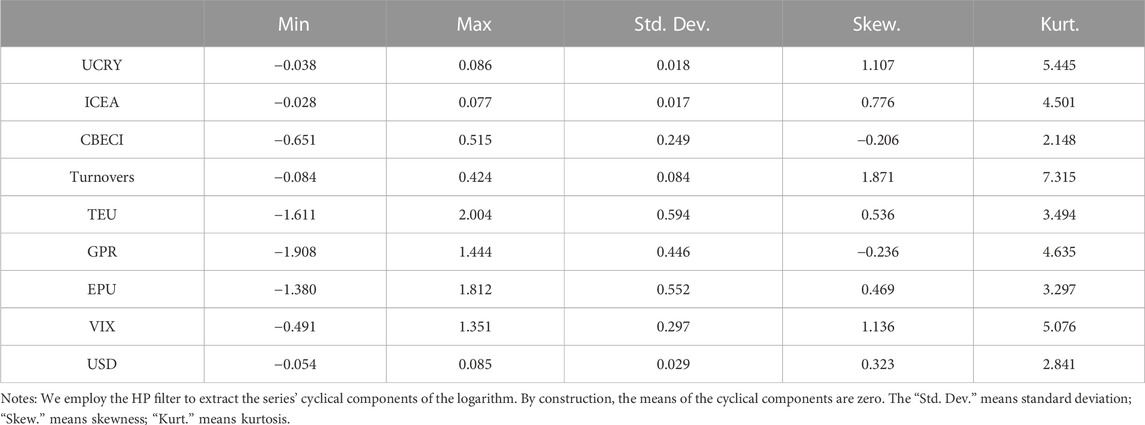
For these potential explanatory factors, we first take the logarithm transform to reduce the magnitude effect. Then, we adopt the Hodrick-Prescott filter to extract the cyclical component of the series.10 These cyclical components can be treated as the gaps between the values of the realized and expected variables. A positive value of the variables indicates that the realized value of the corresponding factor is higher than the expected value. Table 2 shows the summary statistics. The skewness suggests most of the factors are positively skewed, indicating the fat right tails of the series. Most of the kurtosis is around 3, implying it is not common to have extreme values of the series.
5 Empirical results
5.1 Dynamics of cross-equicorrelation and volatility connectedness
Figure 3 plots the cross-equicorrelation between cryptocurrencies and energy. As shown, the cross-equicorrelation was consistently positive, indicating the cryptocurrency and energy returns were comoved during the sample period. This finding is in line with Ji et al. (2019) and Rehman and Kang (2021) who showed that cryptocurrency gradually integrated into the global commodity market. Even though the absolute values of cross-equicorrelation were low, the figure shows there were many spikes and troughs during the period. The greatest trough occurred in the second half of 2018, during which a sequence of bad news shocked the cryptocurrency market. Successive hacking attempts on cryptocurrencies in June and July 2018 generated fears and led to a collapse in the cryptocurrency market. Furthermore, the COVID-19 pandemic increased the cross-equicorrelation dramatically: in March 2020, equicorrelation increased from around 0.07 to a peak of over 0.20.
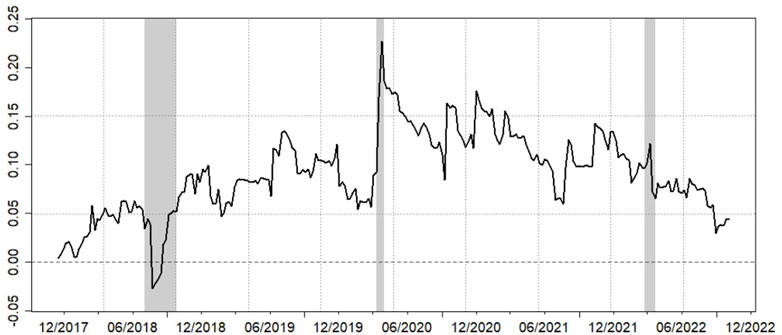
FIGURE 3. Cross-equicorrelations between cryptocurrencies and energy.We highlight three points (using a gray background). The first period from July 3, 2018 to September 25, 2018, when a series of hacker attacks heavily shocked the cryptocurrency market. The second period from March 10, 2020 to March 31, 2020, when the WHO announced the COVID-19 as a pandamic, and the global financial markets felt the turmoil; the third period is from February 22, 2022 to March 22, 2022, which is the first month of the Russia-Ukraine war.
Additionally, the cross-equicorrelation increased definitively from around 0.05–0.10 in the pre-COVID period to 0.10–0.15 in the post-COVID period. This finding aligns with Bouri et al. (2018) and Ji et al. (2018), who suggested that the correlation between cryptocurrencies and energy before the COVID-19 pandemic was weak. The Russia-Ukraine war also affected the cross-equicorrelation between cryptocurrencies and energy: The cross-equicorrelation increased sharply and then decreased rapidly at the beginning of the Russia-Ukraine war. This echoes the findings in Yousaf et al. (2022). This probably occurred because the breakout of the war increased global uncertainties, but the announcement of the sanctions from Western countries reduced the uncertainties, and these changes significantly shocked energy prices.
The cross-equicorrelation calculations do not indicate anything about the volatility spillovers and cannot differentiate the asymmetric spillovers from cryptocurrencies and energy. However, the volatility connectedness measures further provide evidence about how shocks are transmitted across the cryptocurrency and energy markets.
As in Figure 4, the total volatility connectedness shows how tight the system was in the sample period. The total volatility connectedness was low at the beginning of the sample period and then increased dramatically. In July 2018, the total volatility connectedness reduced sharply from around 40% to less than 5%. Afterward, it began to fluctuate in the range of 20%–40%. Similar to the cross-equicorrelation, the volatility connectedness increased quickly in Mar. 2020, when the WHO classified COVID-19 as a pandemic. The total connectedness stayed relatively high in 2020 and 2021 but gradually decreased in 2022. In general, the overall trend of total connectedness followed the cross-equicorrelation trends quite closely.
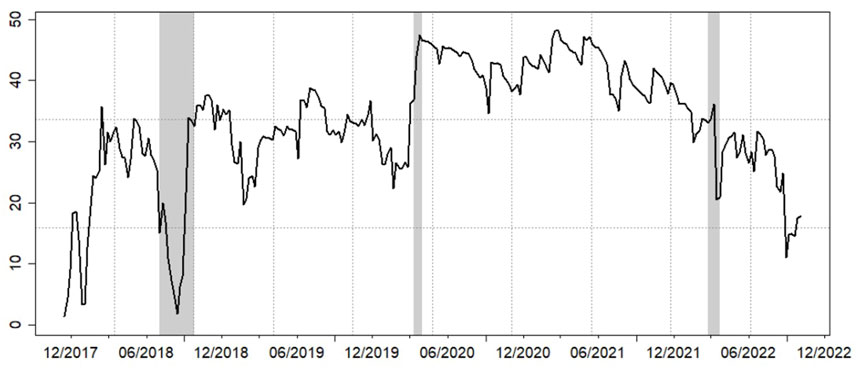
FIGURE 4. Total volatility connectedness. See notes to Figure 3.
We plotted the volatility connectedness from cryptocurrencies to energy and from energy to cryptocurrencies in the upper and lower panels in Figure 5. This shows that the volatility spillovers were asymmetric across the two markets. The connectedness from energy to cryptocurrencies was much larger than from cryptocurrencies to energy: the volatility spillovers from energy to cryptocurrencies were typically larger than 50%; by contrast, the volatility spillovers from cryptocurrencies to energy were lower than 2.5%. This indicates that the risks in the cryptocurrency market were likely affected by risks in the energy market, but spillovers in the reversed direction were less pronounced. This finding confirms the results in Symitsi and Chalvatzis (2018).
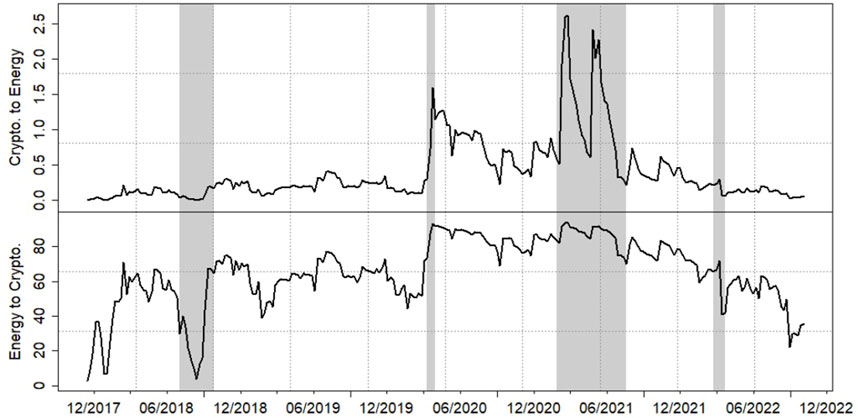
FIGURE 5. Directional volatility connectedness. We highlight four points (using a gray background). In addition to the three points mentioned in the Figures 3, 4, the figure also highlights the period from January 26, 20201 to July 20, 2021. Two influential occured in this period. The first is the inaguration of the Joe Biden in late January 2021, and the second is a series of Elon Musk’s announcements on investing in Bitcoin.
Even though the magnitudes of the two directional volatility connectedness were significantly different, the changes of the two connectedness follow a similar pattern. Both directional connectedness decreased dramatically in July 2018 when there was significant fear in the cryptocurrency market. Moreover, both directional volatility and connectedness increased during the COVID-19 pandemic. The Russia-Ukraine war also decreased the connectedness sharply. In addition, there were two large spikes in February and May 2021, when the cryptocurrency market was affected by the inauguration of Joe Biden and a series of announcements by Elon Musk. The association between the remarkable changes in connectedness and influential events suggests that the volatility connectedness between cryptocurrencies and energy may be driven by factors related to the cryptocurrency market and risks in global financial markets.
5.2 Identification of drivers and effects
5.2.1 Drivers of connectedness from cryptocurrencies to energy
We first conducted DMA on the volatility connectedness from cryptocurrencies to energy. The time-varying importance of the potential drivers, which is indicated by the PIP, is plotted in Figure 6. We follow Cheung and He (2022) and treat the variables with a PIP larger than 0.5 or 0.75 as acceptably or substantially important variables.
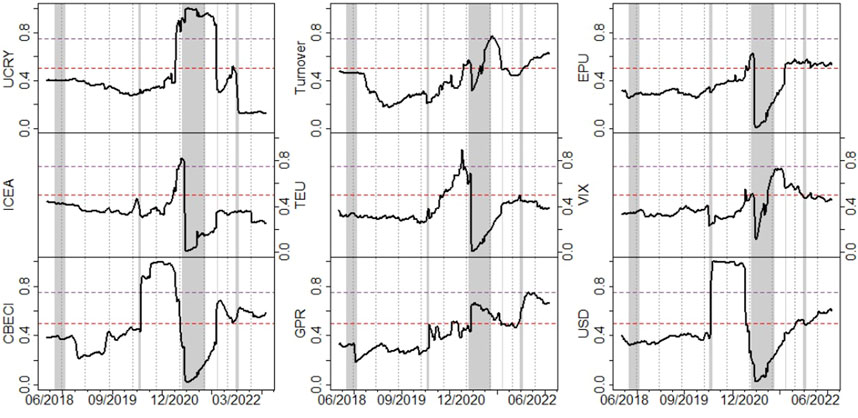
FIGURE 6. PIPs of the potential drivers (cryptocurrencies to energy). See notes to Figure 5.
As Figure 6 shows, all the variables are important in specific periods. However, all the variables were unimportant before the COVID-19 pandemic, showing that the factors related to cryptocurrencies and global financial markets cannot explain the volatility spillovers from cryptocurrencies to energy. This finding is in line with Bouri et al. (2018) and Ji et al. (2019), who reported that the cryptocurrency market was isolated from the global financial markets. Additionally, Yousaf et al. (2022) reported that the EPU, TWU and other kinds of uncertainties had great impacts on the total connectedness between energy and cryptocurrencies. However, the COVID-19 pandemic dramatically increased the importance of CBECI and the USD in explaining cryptocurrency volatility spillovers. Furthermore, the great political uncertainty caused by the United States presidential election changed the importance of the factors. When Joe Biden was inaugurated as United States president in January 2021, the PIP of the UCRY increased from less than 0.5 to more than 0.8, while the PIPs of ICEA, CBECI, TEU, EPU, the VIX, and the USD decreased significantly. By contrast, the establishment of the United States future-based exchange-traded fund boosted the importance of the energy consumed in cryptocurrency mining while simultaneously reducing policy uncertainty.
Figure 7 shows the expected effects of the factors. The effects were generally positive, suggesting the increase of uncertainties in the cryptocurrency and global financial markets increased the volatility spillovers from cryptocurrencies to energy. However, the magnitudes of the effects were associated with the PIPs in Figure 6. In terms of the factors related to the cryptocurrency market, the UCRY has a relatively large and positive coefficient in 2021, which is also associated with its large PIP in the same period. This suggests that the policy uncertainties concerning cryptocurrencies increased the volatility spillovers from cryptocurrencies. By contrast, the ICEA and CBECI coefficients were negative when their PIPs were higher than 0.5. This implies that when the social attention paid to the environmental effects of cryptocurrencies displayed importantly, it reduced the volatility spillovers of cryptocurrencies. Furthermore, the energy consumption of cryptocurrency mining also reduced the volatility spillovers from cryptocurrencies. Regarding the effects of uncertainties in global financial markets, the increase of uncertainties typically increased the volatility spillovers from cryptocurrencies, especially in recent years. This finding implies that the cryptocurrency market has gradually been integrated into global financial markets over the years. The exception is the negative effects of the GPR since 2021, implying that the rising geopolitical risk reduces the spillover of cryptocurrencies.
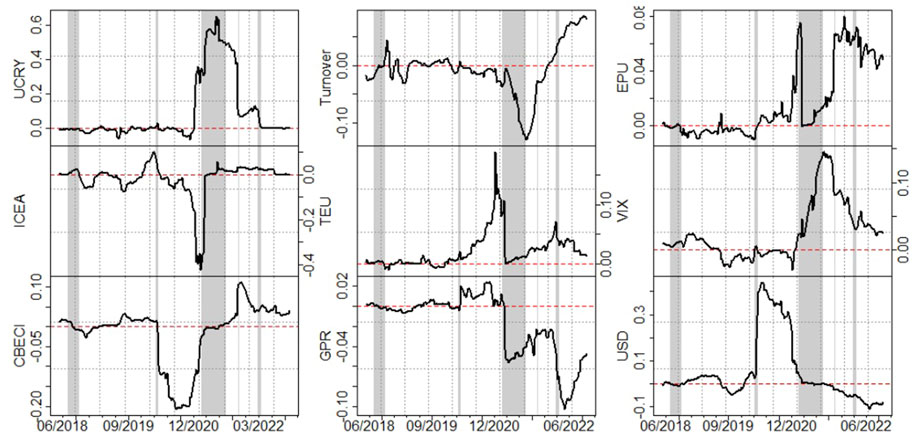
FIGURE 7. Expected coefficients of the potential drivers (cryptocurrencies to energy). See notes to Figure 5.
In Figures 6, 7, we also observe that some exogenous factors display a similar pattern of effects on volatility connectedness. For example, the effects of UCRY, TEU, EPU, and VIX share a similar pattern. This observation implies that macro risks are critical in affecting risk transmission from cryptocurrencies to energy. This further documents that the cryptocurrencies are sensitive to expectations, which is similar to products in the conventional financial market. The risks of cryptocurrencies increase due to the unpredictable expectations for the future economic situation.
In general, in line with the low volatility spillovers from cryptocurrencies to energies, the potential explanatory variables had marginal explanatory powers for the volatility connectedness. All the factors were identified as unimportant in 2018 and 2019. The CBECI and the USD were important factors in 2020, while the UCRY became important in 2021. However, the estimated effects of the factors were small, indicating the potential factors had minor impacts on the volatility connectedness from cryptocurrencies to energy.
5.2.2 Drivers of connectedness from energy to cryptocurrencies
Next, DMA was employed to identify the drivers of volatility connectedness from energy to cryptocurrencies. Figures 8, 9 plot the PIPs of the factors and the expected coefficients, respectively.
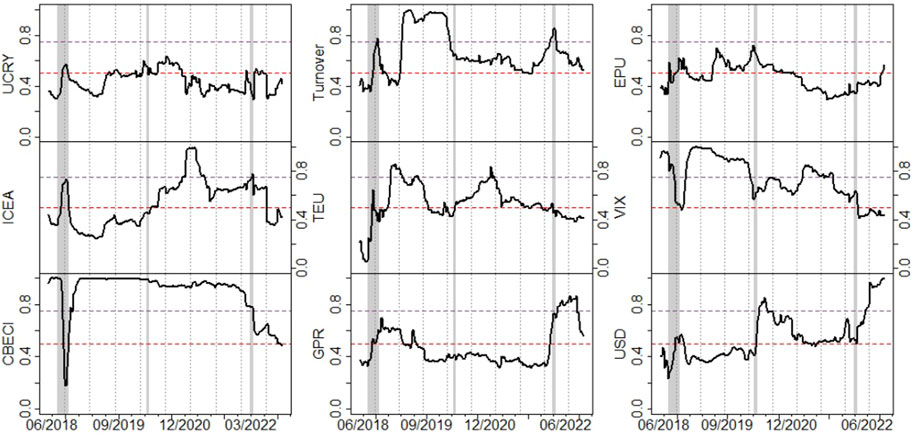
FIGURE 8. PIPs of the potential drivers (energy to cryptocurrencies). See notes to Figure 3.
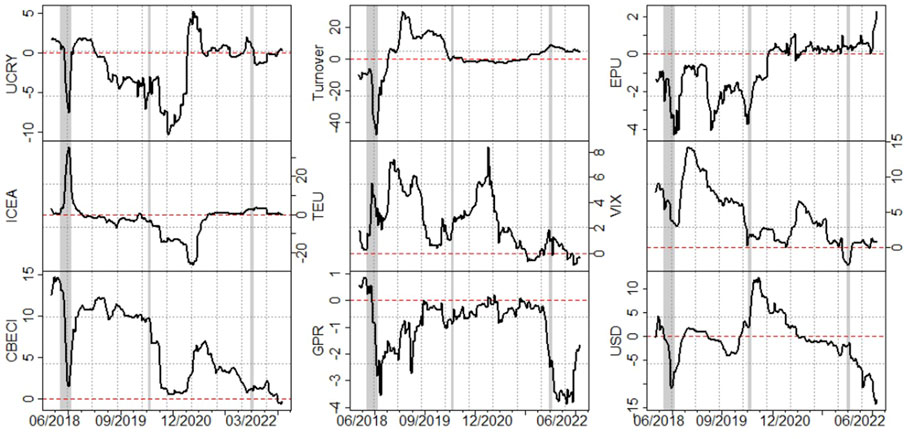
FIGURE 9. Expected coefficients of the potential drivers (energy to cryptocurrencies). See notes to Figure 3.
We find evidence that the factors were important in more periods than those identified in Figure 6, indicating that the selected factors were more likely to affect the volatility spillovers from energies rather than from cryptocurrencies. Among the nine factors, the CBECI had the most pronounced effects: The PIP of CBECI was consistently larger than 0.9, with very few exceptions. This implies that the energy consumption of mining for cryptocurrencies is a major driver of the risk contagion from energies to cryptocurrencies. Moreover, the ICEA became important after 2021, suggesting that social attention to the environmental externalities of cryptocurrencies affected the spillovers from energy in the past 2 years. The transactions indicated by the turnovers also acted consistently important. In terms of the uncertainties of global financial markets, the PIP of VIX was always higher than 0.5 and was even higher than 0.75 before 2022, showing that the fears in the conventional market affected the risk of transmissions from energy to cryptocurrencies. The EPU displayed important effects in 2019, while the TEU, GPR, and the USD were important in very few periods, suggesting they were less likely to affect spillovers from energy to cryptocurrencies.
The expected coefficients further demonstrate the effects of these factors on connectedness. As Figure 9 shows, the magnitudes of the coefficients were larger than those in Figure 7. This indicates that the effects of the factors on the volatility connectedness from energy were dramatically larger than those on the volatility connectedness from cryptocurrencies. Specifically, the CBECI, Turnovers, and VIX coefficients were generally positive, suggesting these factors had positive effects on the energy spillovers. However, remarkably, the coefficients of these factors declined after 2020. By contrast, the coefficients of GPR were consistently negative, and its negative effect was enlarged in 2022. This finding implies that the Russia-Ukraine war weakened the connection between the energy market and cryptocurrency market. Our findings are consistent with the evidence shown in Wu et al. (2022), and the varying effects also echo the arguments in Giannellis (2022).
Additionally, the effect of EPU was consistently negative, and the effect of UCRY was also negative when its PIP was larger than 0.5. This implies that policy uncertainties weakened the spillovers from energies to cryptocurrencies. However, the effects of the ICEA, TEU, and USD switched between positive and negative, further showing that the effects changed over time.
In Figure 9, the effects of TEU and VIX on the volatility connectedness from energies to cryptocurrencies shared a similar pattern, which was consistently positive. By comparison, the effects of EPU and GPR were negative in the first half of the sample period. These opposite effects are in accordance with the characteristics of the TEU, VIX, EPU, and GPR. The TEU and VIX trace the market uncertainties, while the EPU and GPR measure the uncertainties due to macro policies and geopolitical events. These characteristics imply the risks related to financial markets raised the volatility spillovers from energy but the macro risks decreased the impacts of energy.
In sum, the estimated PIPs indicated that the CBECI, turnovers of cryptocurrencies, and VIX were important in explaining the connectedness from energy, and the effects of these three factors were positive. The UCRY and EPU were negatively related to the connectedness from energy when they had important effects. The importance of the other factors changed over time, and these factors varied between having positive and negative effects several times.
6 Robustness checks
To confirm the robustness of our findings and results, we further re-estimated a block DECO-GARCH model using a smaller sample. Specifically, we chose the top six tokens in terms of market capitalization, which are Bitcoin, BNB, Cardano, Dogecoin, Ethereum, and XRP; we also selected four representative energies.11
We compare the cross-equicorrelation, total volatility connectedness, and directional volatility connectedness for the smaller sample with those for the main sample (the baseline estimation); these are plotted in Figures 10–12. In these figures, the solid lines are the estimators based on the smaller sample, and the dotted lines are the estimators for the baseline estimation. In Figure 10, the solid line was under the dotted line before July 2019, and changed to be over the dotted line after that. However, the differences between the two lines were not large, suggesting the two samples had similar results. This confirms the robustness of the block cross-equicorrelation estimated in the baseline estimation.
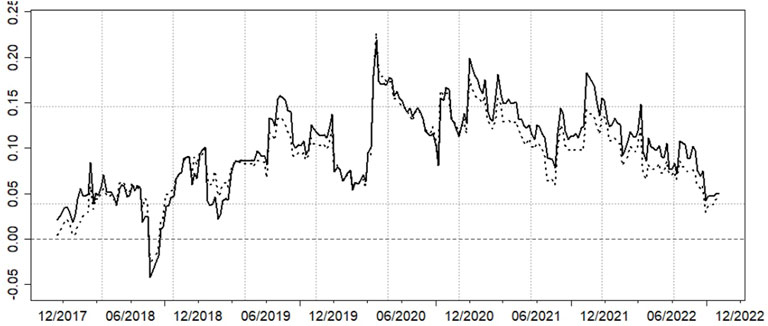
FIGURE 10. Comparison between cross-equicorrelations of baseline estimation and estimation with a smaller sample.
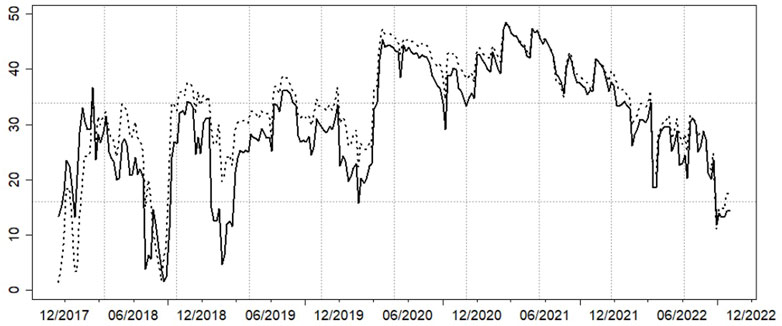
FIGURE 11. Comparison between total volatility connectedness of baseline estimation and estimation with a smaller sample.
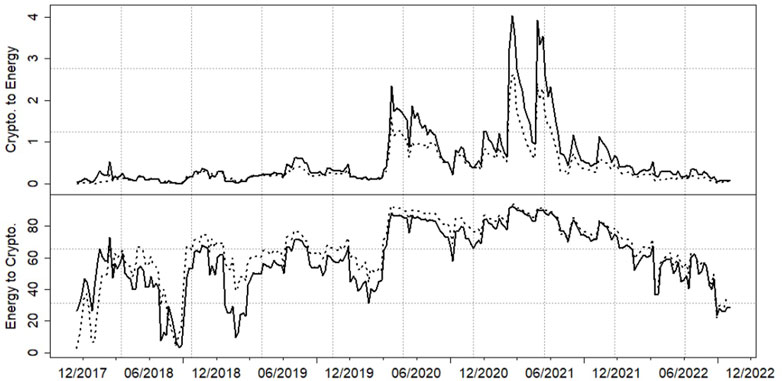
FIGURE 12. Comparison between directional volatility connectedness of baseline estimation and estimation with a smaller sample. The solid line is the volatility connectedness between cryptocurrencies and energy based on the smaller samples and the dotted line is the directional volatility connectedness between cryptocurrencies and energy in a baseline estimation.
In Figure 11, the total connectedness of the smaller sample was lower than the corresponding one for the baseline estimations in 2018 and 2019. This is in line with the fact that the number of cryptocurrencies and energy types in the robustness check was smaller than those in the baseline estimation. However, the two lines were not too far away. Figure 12 also confirms the robustness of the estimates on the directional connectedness. The solid line and the dotted line in the upper panel of Figure 12 were almost the same, and the two lines in the lower panel were very similar to the pattern shown in Figure 11.
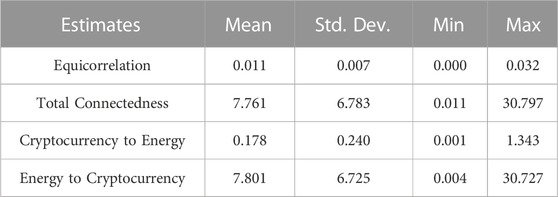
Table 3 summarizes the absolute differences between the baseline and estimation using a smaller sample. The mean of absolute differences of cross-equicorrelations is only 0.011, confirming that the differences between the two estimations are small. Furthermore, the statistics on the differences in the total connectedness and the directional connectedness from energy to cryptocurrencies show that the deviations of the baseline estimation and the estimation based on a smaller sample are small relative to the magnitude of the connectedness estimates. These findings thus provide evidence that the study estimates are robust.
7 Conclusion and policy implications
In this paper, we investigated the interactions between cryptocurrency and energy markets. We collected price data for eight cryptocurrencies and eight energy types. We employed the block DECO-GARCH model and group volatility connectedness to estimate the cross-equicorrelation and volatility connectedness between cryptocurrencies and energy. Furthermore, we identified nine potential explanatory variables related to the cryptocurrency market and global financial markets and adopted DMA to identify the roles and effects of these factors. Lastly, we conducted robustness checks using a smaller sample which consisted of seven cryptocurrencies and four representative energy types.
Our results show that the cross-equicorrelation between cryptocurrencies and energy was relatively low but changed dramatically over time, and the spikes and troughs were related to some influential events. The connectedness estimates show that the volatility spillovers between cryptocurrencies and energy increased after the COVID-19 pandemic, and the volatility connectedness from energy to cryptocurrencies dominated the total volatility connectedness. The DMA estimations imply that the factors played important roles in explaining volatility connectedness from cryptocurrencies in some periods after the COVID-19 pandemic, but the effects were minor. In explaining the volatility connectedness from energy to cryptocurrencies, the CBECI, cryptocurrency turnovers, and the VIX consistently had important and positive effects. The GPR displayed important and negative effects after the breakout of the Russia-Ukraine war, the importance of the UCRY, ICEA, EPU, and USD changed over time, and the effects switched between positive and negative.
Our findings suggest that the cryptocurrency market is gradually becoming integrated into the global financial markets. While its outward spillovers have remained minor, it has absorbed volatility shocks from the energy market. Additionally, the findings that the changes in cross-equicorrelation and volatility connectedness were related to influential events suggest that the risk contagion channels change due to the variation in the global economic environment. From a policy perspective, the government should propose regulations on cryptocurrency transactions that monitor the potential risks in the cryptocurrency market. The mechanism of the asymmetric connectedness of cryptocurrencies and energy implies that cryptocurrency market investors may suffer significant losses due to the rising risks in the energy market. Moreover, the increasing risk aversion indicated by the increasing VIX would also raise the sensitivity of cryptocurrency investors, and hurt the financial market. For cryptocurrency investors, information about the electricity cost of mining and cryptocurrency transactions is crucial since it affects the risk transmission from energy to cryptocurrencies. Therefore, investors and policymakers should pay more attention to the risks in the cryptocurrency market when making investment and policymaking decisions.
Data availability statement
The original contributions presented in the study are included in the article/Supplementary Material, further inquiries can be directed to the corresponding author.
Author contributions
YW: Conceptualization, Formal analysis, and Methodology YS: Formal analysis, Data Curation and Writing-Original draft XZ: Validation, Editing and Formatting ZY: Conceptualization, Writing-Reviewing and Editing.
Funding
Shandong Provincial Natural Science Foundation (ZR2022QG069).
Conflict of interest
The authors declare that the research was conducted in the absence of any commercial or financial relationships that could be construed as a potential conflict of interest.
Publisher’s note
All claims expressed in this article are solely those of the authors and do not necessarily represent those of their affiliated organizations, or those of the publisher, the editors and the reviewers. Any product that may be evaluated in this article, or claim that may be made by its manufacturer, is not guaranteed or endorsed by the publisher.
Footnotes
1We use “volatility connectedness,” “risk spillovers,” and “volatility spillovers” interchangeably.
2The cryptocurrencies we focused on are tokens. Stablecoins are excluded because they are pegged to the USD.
3The assumption of equicorrelation is reasonable for both the cryptocurrency market and the energy market. Bouri et al. (2021) conducted an analysis of equicorrelation in the cryptocurrency market and found that the return equicorrelation remained at high levels after 2017. Furthermore, Vacha and Barunik (2012) reported strong dynamics in the co-movement of energy pairs between crude oil, gasoline, heating oil, and natural gas.
4Even though our model does not include too many cryptocurrencies and energy types compared with the number of observations, the dimension is still large, say, 16 variables against 262 observations. A more detailed discussion on this approach can be found in Engle et al. (2019) and Ledoit and Wolf (2017).
5We chose October 3, 2017, as the start of our sample by considering the trade-off between the sample length and sample width. Most cryptocurrencies were not established in the early 2010s, which is why we did not use data from that time. However, the sample length would be limited if we included more newly established cryptocurrencies, so we analysed cryptocurrencies established before October 2017.
6Both the CoinMarketCap and the United States Energy Information Administration provide daily data on cryptocurrencies and energy prices. Although cryptocurrencies are traded 7 days a week, energy types are not traded on weekends and holidays. Thus, there would be a mismatch if we insisted on using daily data. We finally decided to use Tuesday data to construct the weekly sample because Tuesday was the day with the least number of holidays during the sample period. We used observations relevant to the preceding Monday to formulate the data for a holiday Tuesday.
7We collected data on market capitalization on October 10, 2022. These top eight tokens are the top 20 cryptocurrencies regarding market capitalizations.
8See the results shown in Table A3.
9To calculate the turnovers, we sum the weekly trading volumes and market capitalizations of the selected eight cryptocurrencies and calculate the overall turnovers of these eight cryptocurrencies.
10The smooth parameter is 1,600 × 124, which is based on Ravn and Uhlig (2002).
11These top six tokens are the top ten cryptocurrencies regarding market capitalizations.
References
Adekoya, O. B., Oliyide, J. A., and Noman, A. (2021). The volatility connectedness of the EU carbon market with commodity and financial markets in time-and frequency-domain: The role of the US economic policy uncertainty. Resour. Policy 74, 102252. doi:10.1016/j.resourpol.2021.102252
Afjal, M., and Clanganthuruthil Sajeev, K. (2022). Interconnection between cryptocurrencies and energy markets: An analysis of volatility spillover. OPEC Energy Rev. 46, 287–309. doi:10.1111/opec.12227
Bouri, E., Gupta, R., Lahiani, A., and Shahbaz, M. (2018). Testing for asymmetric nonlinear short– and long–run relationships between bitcoin, aggregate commodity and gold prices. Resour. Policy 57, 224–235. doi:10.1016/j.resourpol.2018.03.008
Bouri, E., Vo, X. V., and Saeed, T. (2021). Return equicorrelation in the cryptocurrency market: Analysis and determinants. Finance Res. Lett. 38, 101497. doi:10.1016/j.frl.2020.101497
Cheung, Y. W., and He, S. (2022). RMB misalignment: What does a meta-analysis tell us? Rev. Int. Econ. 30, 1038–1086. doi:10.1111/roie.12593
Corbet, S., Hou, Y. G., Hu, Y., Larkin, C., and Oxley, L. (2020). Any port in a storm: Cryptocurrency safe–havens during the COVID–19 pandemic. Econ. Lett. 194, 109377. doi:10.1016/j.econlet.2020.109377
Corbet, S., Lucey, B., and Yarovaya, L. (2021). Bitcoin-energy markets interrelationships-New evidence. Resour. Policy 70, 101916. doi:10.1016/j.resourpol.2020.101916
Corbet, S., Meegan, A., Larkin, C., Lucey, B., and Yarovaya, L. (2018). Exploring the dynamic relationships between cryptocurrencies and other financial assets. Econ. Lett. 165, 28–34. doi:10.1016/j.econlet.2018.01.004
Diebold, F. X., and Yılmaz, K. (2014). On the network topology of variance decompositions: Measuring the connectedness of financial firms. J. Econ. 182 (1), 119–134. doi:10.1016/j.jeconom.2014.04.012
El Montasser, G., Charfeddine, L., and Benhamed, A. (2022). COVID-19, cryptocurrencies bubbles and digital market efficiency: Sensitivity and similarity analysis. Finance Res. Lett. 46 (A), 102362. doi:10.1016/j.frl.2021.102362
Engle, R., and Kelly, B. (2012). Dynamic equicorrelation. J. Bus. Econ. Statistics 30 (2), 212–228. doi:10.1080/07350015.2011.652048
Engle, R., Robert, F., Olivier, L., and Wolf, M. (2019). Large dynamic covariance matrices. J. Bus. Econ. Statistics 37 (2), 363–375. doi:10.1080/07350015.2017.1345683
Gabauer, D. (2020). Volatility impulse response analysis for DCC–GARCH models: The role of volatility transmission mechanisms. J. Forecast. 39 (5), 788–796. doi:10.1002/for.2648
Giannellis, N. (2022). Cryptocurrency market connectedness in Covid-19 days and the role of Twitter: Evidence from a smooth transition regression model. Res. Int. Bus. Finance 63, 101801. doi:10.1016/j.ribaf.2022.101801
Hayes, A. S. (2017). Cryptocurrency value formation: An empirical study leading to a cost of production model for valuing bitcoin. Telematics Inf. 34 (7), 1308–1321. doi:10.1016/j.tele.2016.05.005
Ji, Q., Bouri, E., Lau, C. K. M., and Roubaud, D. (2018). Dynamic connectedness and integration in cryptocurrency markets. Int. Rev. Financial Analysis 63, 257–272. doi:10.1016/j.irfa.2018.12.002
Ji, Q., Bouri, E., Roubaud, D., and Kristoufek, L. (2019). Information interdependence among energy, cryptocurrency and major commodity markets. Energy Econ. 81, 1042–1055. doi:10.1016/j.eneco.2019.06.005
Krause, M. J., and Tolaymat, T. (2018). Quantification of energy and carbon costs for mining cryptocurrencies. Nat. Sustain. 1 (11), 711–718. doi:10.1038/s41893-018-0152-7
Ledoit, O., and Wolf, M. (2017). Nonlinear shrinkage of the covariance matrix for portfolio selection: Markowitz meets Goldilocks. Rev. Financial Stud. 30 (12), 4349–4388. doi:10.1093/rfs/hhx052
Li, J., Li, N., Peng, J., Cui, H., and Wu, Z. (2019). Energy consumption of cryptocurrency mining: A study of electricity consumption in mining cryptocurrencies. Energy 168, 160–168. doi:10.1016/j.energy.2018.11.046
Li, Z., and Meng, Q. (2022). Time and frequency connectedness and portfolio diversification between cryptocurrencies and renewable energy stock markets during COVID-19. North Am. J. Econ. Finance 59, 101565. doi:10.1016/j.najef.2021.101565
Lucey, B. M., Vigne, S. A., Yarovaya, L., and Wang, Y. (2022). The cryptocurrency uncertainty index. Finance Res. Lett. 45, 102147. doi:10.1016/j.frl.2021.102147
Nguyen, L. H., and Lambe, B. J. (2021). International tail risk connectedness: Network and determinants. J. Int. Financial Mark. Institutions Money 72, 101332. doi:10.1016/j.intfin.2021.101332
Raftery, A. E., Ettler, P., and Kárný, M. (2010). Online prediction under model uncertainty via dynamic model averaging: Application to a cold rolling mill. Technometrics 52 (1), 52–66. doi:10.1198/tech.2009.08104
Ravn, M. O., and Uhlig, H. (2002). On adjusting the Hodrick-Prescott filter for the frequency of observations. Rev. Econ. statistics 84 (2), 371–376. doi:10.1162/003465302317411604
Rehman, M. U., and Kang, S. H. (2021). A time–frequency comovement and causality relationship between Bitcoin hashrate and energy commodity markets. Glob. Finance J. 49, 100576. doi:10.1016/j.gfj.2020.100576
Sarkodie, S. A., Ahmed, M. Y., and Owusu, P. A. (2022). COVID-19 pandemic improves market signals of cryptocurrencies-evidence from Bitcoin, Bitcoin Cash, Ethereum, and Litecoin. Finance Res. Lett. 44, 102049. doi:10.1016/j.frl.2021.102049
Symitsi, E., and Chalvatzis, K. J. (2018). Return, volatility and shock spillovers of Bitcoin with energy and technology companies. Econ. Lett. 170, 127–130. doi:10.1016/j.econlet.2018.06.012
Vacha, L., and Barunik, J. (2012). Co-movement of energy commodities revisited: Evidence from wavelet coherence analysis. Energy Econ. 34 (1), 241–247. doi:10.1016/j.eneco.2011.10.007
Wang, H., Wang, X., Yin, S., and Ji, H. (2022). The asymmetric contagion effect between stock market and cryptocurrency market. Finance Res. Lett. 46, 102345. doi:10.1016/j.frl.2021.102345
Wang, Y., Lucey, B., Vigne, S. A., and Yarovaya, L. (2022). An index of cryptocurrency environmental attention (ICEA). China Finance Rev. Int. 12, 378–414. doi:10.1108/cfri-09-2021-0191
Wu, H., Zhu, H., Huang, F., and Mao, W. (2022). How does economic policy uncertainty drive time-frequency connectedness across commodity and financial markets? North Am. J. Econ. Finance 64, 101865. doi:10.1016/j.najef.2022.101865
Yen, K. C., and Cheng, H. P. (2021). Economic policy uncertainty and cryptocurrency volatility. Finance Res. Lett. 38, 101428. doi:10.1016/j.frl.2020.101428
Appendix
Keywords: cryptocurrency, energy, dynamic equicorrelation, volatility connectedness, dynamic model averaging
Citation: Wan Y, Song Y, Zhang X and Yin Z (2023) Asymmetric volatility connectedness between cryptocurrencies and energy: Dynamics and determinants. Front. Environ. Sci. 11:1115200. doi: 10.3389/fenvs.2023.1115200
Received: 03 December 2022; Accepted: 18 January 2023;
Published: 30 January 2023.
Edited by:
Zhenling Zhao, University of Science and Technology of China, ChinaReviewed by:
Zhitao Lin, Jinan University, ChinaShi He, Zhongnan University of Economics and Law, China
Copyright © 2023 Wan, Song, Zhang and Yin. This is an open-access article distributed under the terms of the Creative Commons Attribution License (CC BY). The use, distribution or reproduction in other forums is permitted, provided the original author(s) and the copyright owner(s) are credited and that the original publication in this journal is cited, in accordance with accepted academic practice. No use, distribution or reproduction is permitted which does not comply with these terms.
*Correspondence: Yuncheng Song, c29uZ3l1bmNoZW5nQG1haWwuc2R1LmVkdS5jbg==
 Yang Wan
 Yuncheng Song
 Xinqian Zhang
 Zhichao Yin