 Xiaodi Ma
 Fengyan Fan
 Qunyi Liu1,3,4
- 1Institute of Mineral Resources, Chinese Academy of Geological Sciences, Beijing, China
- 2School of Earth Sciences and Resources, China University of Geosciences, Beijing, China
- 3Research Center for Strategy of Global Mineral Resources, Chinese Academy of Geological Science, Beijing, China
- 4MNR Key Laboratory of Saline Lake Resources and Environments, Institute of Mineral Resources, Chinese Academy of Geological Sciences, Beijing, China
Electricity is an essential factor of production. The trade of goods and services between different industrial sectors in different regions may lead to the transfer of embodied carbon emissions in the power sector, which makes the problem of “carbon leakage” widespread. As the world’s largest CO2 emitter, China’s systematic identification of the patterns and structural characteristics of embodied carbon transfer in its power sector is essential for reasonably defining emission reduction responsibilities and scientifically formulating emission reduction policies. Few studies have focused on interprovincial transfer characteristics of embodied carbon emissions in the power sector. Based on the multi-regional input-output tables of China in 2010, 2012, 2015, and 2017, this paper combined the complex network theory to construct the interprovincial power embodied carbon transfer networks (PECTNs1) of China, analyzed the topological nature, community structure and identified the key provinces in the networks with the help of complex network indicators. The results indicate that both direct and embodied carbon emissions from China’s power sector present an increasing trend during the study period. The scale and scope of power carbon emission transfer between provinces have been expanding, showing an transfer trend from west to east and north to south. China’s PECTNs have small-world characteristics. From 2010 to 2017, the sub-regional phenomenon in China’s PECTNs gradually decreased. In the network community, the provinces with stable relationships are close to each other and have closer carbon correlation. Coal resource-based and large economic provinces with high power demand tend to be the core of the networks. The position of Xinjiang in the networks is gradually prominent. According to the results of the study, differentiated carbon emission reduction schemes are formulated based on the roles played by different provinces to provide ideas for embodied carbon reduction among provinces in China’s power sector.
1 Introduction
Global warming is one of the significant challenges facing mankind in the 21st century, and the issue of CO2 emissions has attracted more attention (Miao et al., 2023). By May 2022, 127 countries around the world have proposed or are preparing to introduce carbon neutral targets, which cover 88% of global CO2 emissions, 90% of GDP and 85% of the population (CIKD, 2022), but these efforts are still insufficient. The newly released Sixth Assessment Report (AR6) of the Intergovernmental Panel on Climate Change (IPCC) reveals that the average annual global greenhouse gas emissions from 2010 to 2019 are at the highest level in human history. To limit the temperature rise to about 2°C, global greenhouse gas emissions still need to peak by 2025 at the latest (IPCC, 2022). As the world’s largest carbon emitter, under the background of international pressure and energy transformation1, China has proposed to achieve carbon peaking by 2030 and carbon neutrality by 2060 at the 75th United Nations General Assembly (Xi, 2020). From the perspective of emission sources, electricity and heat production are the main global carbon emission sources. The coal-dominated power supply structure is the main driving force for increasing carbon emissions from the power sector in developing countries. How to quickly shut down coal-fired power generation has become one of the most important steps to achieve carbon neutrality in the world (China.org.cn, 2023). China relies heavily on coal-dominated power generation in its power supply structure (Wang J. et al., 2022). According to the calculation from the data of British Petroleum (BP) and China Electricity Council, China’s total CO2 emissions in 2021 are 10.52 billion tons, and the power sector generated 4.53 billion tons of CO2 emissions, accounting for 43.02% of the total emissions. Thermal power accounts for about 68.03% of the total power generation (NBS, 2022a). Undoubtedly, emission reduction in the power sector is a key link of energy conservation and emission reduction in China and even the world. Electricity is a secondary energy. The separation of power production and consumption not only triggers the direct transfer of carbon emissions between regions, but also the transfer of carbon emissions embodied in goods and services with the interprovincial trade in goods and services of different industrial sectors between different regions. This total amount of direct and indirect emissions in the production of goods or services is called “embodied carbon” (Costanza, 1980; Dong et al., 2023). Embodied carbon analysis not only helps to grasp the whole process of carbon emission transfer more accurately and comprehensively, but also reveals the environmental impact of cross-regional trade, providing a powerful tool for quantitative assessment of interprovincial carbon emission transfer from the perspective of final demand (e.g., private consumption, exports).
In the analysis of tracking carbon emission flow, the input-output model is a useful tool. It was first introduced by Leontief (1974, 1970) and used to predict the impact of industrial changes on the whole economic system. With the intensification of environmental problems, scholars began to focus on its application in the field of embodied carbon emissions. In early studies, the single-regional input-output models (SRIO) was often used to measure the carbon emission flows of a country or group of countries due to foreign trade. For example, Italy (Mongelli et al., 2006), Spain (Sánchez-Chóliz and Duarte, 2004), India (Sun et al., 2017) and the six OECD countries (Wyckoff and Roop, 1994). To compensate for the shortcomings of SRIO in assuming “no differences in domestic and foreign production technologies” and “no distinction in the distribution of imports between end-use and intermediate use”, researchers developed a multi-regional input-output model (MRIO) to track the direct and indirect factors in different economies, and analyze the impact of trade on the use of factors in economies (Li et al., 2017). Currently, input-output analysis is not only used to study individual countries (Zhou et al., 2018; Ning et al., 2019; Xing et al., 2022), bilateral relationships (Dai et al., 2021; Zhang and Chen, 2022), cross-national studies on a regional scale (Chen and Chen, 2011), and cross-national embodied carbon transfers on a global scale (Davis and Caldeira, 2010; Wang Y. et al., 2022; Zhi, 2023), but also used in the analysis of carbon emissions related to different industries in different regions. Such as: Assess carbon pressure of service sectors in 41 countries and regions (Zhang, 2015), in four world regions (Ali, 2017) and in Tokyo, Japan (Long and Yoshida, 2018); calculate CO2 emissions of China’s construction industry (Liu L. et al., 2022); and idetify the key sectors driving China’s CO2 emissions (Guo et al., 2018). These studies provide reference for studying each country’s resource use and pollutant emissions. China’s power resources flow in the whole economic system through trade in goods and services, constituting a complex network of embodied carbon flows. Complex network theory can provide ideas for analyzing the structure and function of complex material flows and energy flows in economic systems. Complex network theory is a practical analytical framework for studying the characteristics of nodes, structures, and interactions between two nodes (Watts and Strogatz, 1998; Newman, 2003; Zhang and Li, 2022). It is widely used in quantitative assessment of direct and indirect effects (structural analysis, utility analysis, control analysis, etc.) in social networks (Zareie and Sheikhahmadi, 2018; Ishfaq et al., 2022), economic networks (Gao et al., 2014; Wang et al., 2018), transport networks (Tanuja et al., 2018; Wen et al., 2022), international trade networks (Pacini et al., 2021; Liu Y. et al., 2022), financial crisis diffusion networks (Acemoglu et al., 2017), in input-output networks (Grazzini and Spelta, 2022; Sun et al., 2023). After the rise of complex network theory, literature describing the structural characteristics of input-output networks by introducing complex network structure terms such as degree distribution, path length, and agglomeration coefficient also started to appear (Wang et al., 2017; Wang et al., 2019a; Cheng et al., 2023), which prompting the study of input-output networks to a new stage and bringing people new insights (Tang, 2014). Such studies have revealed that complex networks have great potential in analyzing system structures. In the complex network of embodied carbon flows in electricity, there are direct or indirect economic linkages between different regions and industries. A network-based carbon flow analysis can provide additional insights into carbon reduction strategies. However, the application of complex networks in the field of carbon emissions is limited, and only a few scholars have tried. For example, Jiang et al.(2019a, 2019b) combined multi-regional input-output analysis and complex network theory to quantify the roles of countries or sectors in the global carbon emissions embodied in trade transfer networks. Wang et al. (2021) used complex network theory to identify media sectors in China’s inter-provincial multi-sectoral embodied carbon net transfer networks. Although some scholars (Zhang et al., 2017; Fang and Chen, 2019; Zheng et al., 2021) used ecological networks to analyze the laws of carbon emission flows, none well reveal the structural characteristics of networks due to the different analysis focus. In view of this, this paper combines multi-regional environmental input-output analysis with complex network theory to construct input-output networks, and systematically analyzes the characteristics of carbon emission transfer embodied in China’s power sector from both temporal and spatial aspects. This paper expands the work of previous studies, particularly to: 1) The total embodied carbon emissions of China’s power sector are calculated from the demand side. 2) The rules and characteristics of embodied carbon emission transfer in China’s power sector are systematically described. 3) From the perspective of complex networks, the laws and structural characteristics of embodied carbon flows caused by electricity consumption in China are systematically analyzed, and the provinces that playing the key role in the embodied carbon transfer network are identified. To our knowledge, this may be the first attempt in the field. The work of this paper explores some details to provide references for the detailed formulation of interregional synergistic emission reduction policies in the power sector.
2 Methodology
2.1 Accounting of direct carbon emissions from the power sector
Direct monitoring data on carbon emissions from electricity are not available. In this paper, the method provided by IPCC was used to measure the direct carbon emissions from the power sector in 30 provinces. The calculation formula is as follows:
Where
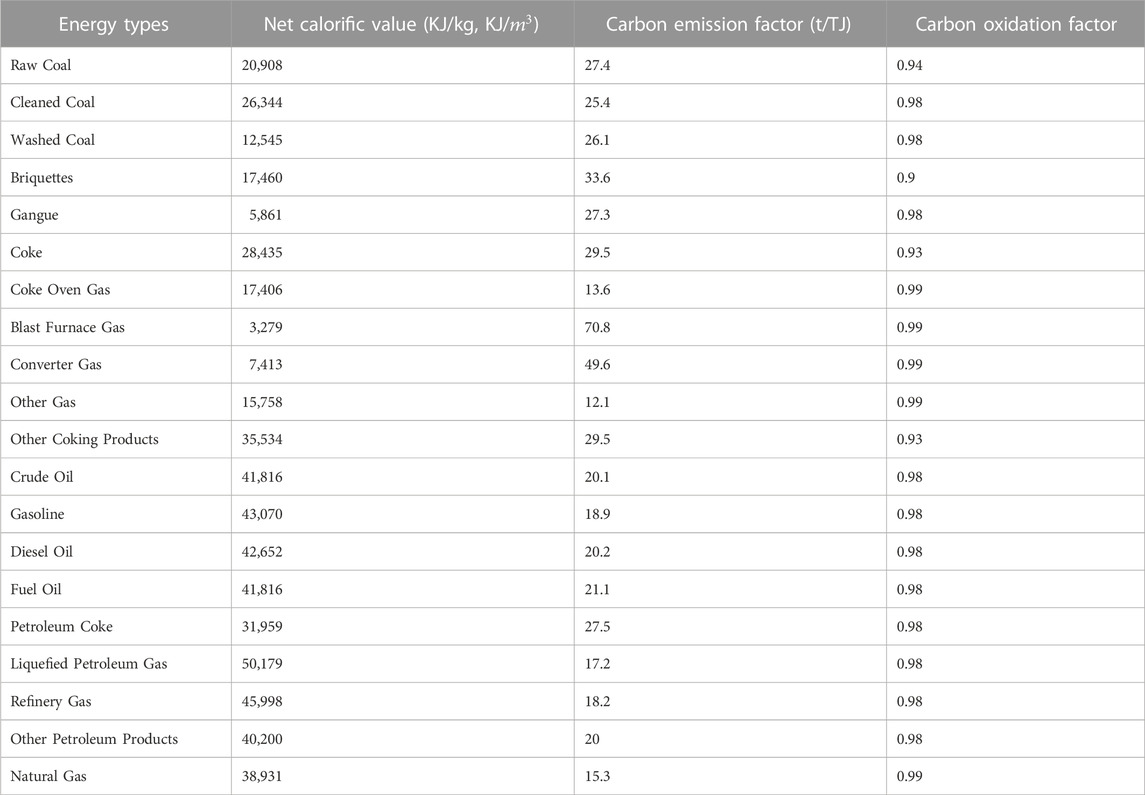
TABLE 1. Energy types and coefficients.
2.2 Construction of environmental input-output model
This paper focuses on the carbon transfer triggered by the geographical separation of commodity production and consumption due to the interprovincial commodity inflows and outflows between the power sector of any province and various sectors of other provinces. Under the framework of MRIO model, the following equilibrium relationship exists:
Where X denotes the total output; F denotes final demand. A is the direct consumption coefficient matrix, A =
By solving X in Eq. 2, the following equation can be obtained:
The total economic output of each sector in each province pulled by the final demand of each province can be calculated by Eq. 3.
Based on the general input-output model, this paper adds carbon emission data to establish an environmental input-output model. Among them, carbon emission data are expressed in physical quantities.
First, the direct carbon emission coefficient matrix is established.
Where
where ED is the direct carbon emission coefficient vector of the power sector;
Thus, the environmental input-output model can be obtained:
Where, P denotes the embodied carbon emissions pulled by the final demand of each province;
2.3 Embodied carbon transfer network model of the power sector
With the help of complex network tools and construction principles, a directional weighted embodied carbon transfer network is constructed, as shown in Eq. 7. The network takes each province as the network node, takes the embodied carbon emission transfer amount of the power sector as the edge, the direction of the edge points to the direction of the embodied carbon emission transfer, and assigns a value to each edge with the amount as the weight.
where
In order to better reveal the essential features of PECTNs, this paper carries out edge weight analysis on the network model by referring to the approach of An et al. (2014). The idea is as follows: First, the weights of the edges are arranged from the largest to the smallest, and the proportion of the weight of each edge in the total weight is calculated. Then, the cumulative distribution graph of edge weights is constructed with the number of edges as the horizontal coordinate and the cumulative probability of edge weights as the vertical coordinate. At last, according to the observation and analysis of the distribution graph, appropriate thresholds are selected to eliminate the unimportant edges in the network.
2.3.1 Small-world characteristics
Small-world characteristics indicate that most nodes in the network are not directly connected, but they can reach each other in a small number of steps through other nodes (Wang et al., 2017). The network with small-world characteristics has good connectivity, and the control effect of one key node may quickly affect other nodes in the whole network. When analyzing a small world network, the measurement is generally the average path length and the clustering coefficient (Sun et al., 2017).
The average path length is the average of the distance between any two nodes in the network, and the smaller its value, the higher efficiency of information transmission between network nodes. It is calculated as (Watts and Strogatz, 1998):
where N is the number of nodes of PETCN;
The clustering coefficient is used to quantitatively portray the probability that any two nodes adjacent to a certain node in the network are also adjacent to each other, the clustering coefficient C of the PETCN can be defined as
Where
2.3.2 Community structure
In a complex network, there is a mutual clustering of nodes, which means that these nodes are more closely connected. Tightly connected nodes form small groups in the network, which is called community structure. Modularity is a commonly used standard to measure the quality of community division. The formula (Newman, 2003) is:
Where, W is the total embodied carbon emission transfer;
2.3.3 Importance of nodes
The value of a node in the network depends on the position of the node in the network. The more central the node is, the greater its value is, which involves the analysis of node centrality index.
2.3.3.1 Degree centrality
Degree centrality is the most direct indicator to measure the importance of nodes in a network. The formula is as follows.
Where N is the total number of nodes in the network.
2.3.3.2 Strength centrality
Strength centrality is the extension of degree centrality. According to the relationship between degree and weighted degree in network indices, this paper defines strength centrality of province i as the share of node i’s weighted degree in the total weighted degree of all nodes. The formula is as follows:
Where N is the total number of nodes in the network and
2.3.3.3 Closeness centrality
Closeness centrality considers the proximity of a particular node to other nodes in the network using the distance method. The node with the largest closeness centrality tends to have the best view of the power embodied carbon flow. The closeness centrality of node i is given by
where N is the total number of nodes in the network, and
2.3.3.4 Betweenness centrality
Betweenness centrality reflects the ability of a node to act as a medium to control other nodes by the number of shortest paths that passthrough the node. The betweenness centrality of node k is defined as (Freeman, 1977):
where
2.3.3.5 Eigenvector centrality
Eigenvector centrality assumes that the importance of a node depends not only on the number of its neighbors, but also on the importance of its neighbors (Bonacich and Lloyd, 2001). Specifically, the eigenvector centrality of node i is formulated as
Where
3 Data sources and processing
The China multi-regional input-output tables in 2012, 2015 and 2017 used in this paper are from CEADs (China Emission Accounts and Datasets). “The 2010 China Multi-Regional Input-Output Table of 30 Provincial Units” is from Liu et al. (2014). The data of various energy consumption required to calculate the carbon emissions of electricity are from the energy balance tables (physical quantity) of each province in “China Energy Statistics Yearbook” of the corresponding year. The net calorific values of all kinds of energy mainly come from Appendix 4 Conversion Factors from Physical Units to Coal Equivalent of China Energy Statistical Yearbook 2018, and the missing data refer to Fan (2016). The carbon content per unit calorific value and carbon oxidation factor of each energy type are obtained from the Guidelines for the Preparation of Provincial Greenhouse Gas Inventories.
The research objects of this paper include 30 provincial regions except Tibet, Hong Kong, Macao and Taiwan. The abbreviations of the provinces are shown in Table 2.

TABLE 2. Abbreviations of provinces.
4 Results and discussion
4.1 Overview of carbon emissions from the power sector
With the development of China’s power sector, the total direct carbon emissions caused by thermal power generation have increased from 3,301.78 Mt in 2010–4,152.84 Mt in 2017, an increase of 25.78%. This is consistent with the conclusions obtained by Gao et al. (2021) on carbon emissions of China’s industry sectors, who points out that the power sector contributes the largest increase in direct carbon emissions. As the “factory of the world”, China has produced one-third of the world’s industrial products. Its rapid economic growth has driven an explosion growth of energy over the past 3 decades. Developed countries such as the United States and Europe have been able to cut emissions more easily because their slow economic growth. China needs to make breakthroughs in generating more electricity while reducing carbon emissions.
The characteristics of carbon emissions from electricity in different provinces in China varied significantly during the study period. Provinces such as Hebei, Shanxi, Inner Mongolia, Shandong, Henan and Xinjiang have higher coal resource endowments, a higher share of coal power, and relatively higher carbon emissions from the power sector. Provinces with lower carbon emissions are mainly divided into three categories: the first category is Hubei, Hunan, Yunnan, Sichuan and Guangxi, which are primarily located in the southwestern regions with abundant water resources and a high proportion of hydropower. China’s six mega-water projects on the Jinsha River and Yangtze River in the region together constitute the world’s largest clean energy corridor. The second category is the less developed provinces such as Hainan and Gansu. Due to the small scale of their power sector and backward grid construction, the provinces have less demand for electricity, and the power carbon emissions are also less. The last category is the economically developed municipalities such as Shanghai, Tianjin, Beijing and Chongqing, which pay attention to environmental protection, generate less electricity, continuously optimize and adjust their industrial structure, and implement the concept of green and sustainable power development well.
As can be seen from Figure 1, during the study period, the rankings of power carbon emissions in Yunnan, Ningxia and Xinjiang changed greatly. Among them, Xinjiang and Ningxia rose from 24th and 20th in 2010 to 8th and 13th in 2017, respectively. Xinjiang’s carbon emissions from electricity increased 3.33 times from 52.11 Mt in 2010 to 225.89 Mt in 2017. This is related to the continuous growth of thermal power generation in Xinjiang, which increased by 3.30 times from 2010 to 2017 (NBS, 2022b). With the development of economy, the development mode of power in Xinjiang is extensive, the high coal consumption has not been improved, and the energy utilization efficiency is relatively low, resulting in high carbon emissions. The same situation also exists in Ningxia, but the magnitude of change is smaller than that in Xinjiang, mainly because of the smaller geographical area and relatively fewer resources. Yunnan’s ranking dropped from 17th in 2010 to 27th in 2017, mainly because with the improvement of water resources development and utilization, the proportion of hydropower exceeded that of thermal power, which highlights the vital role of renewable energy in carbon emission reduction of power.
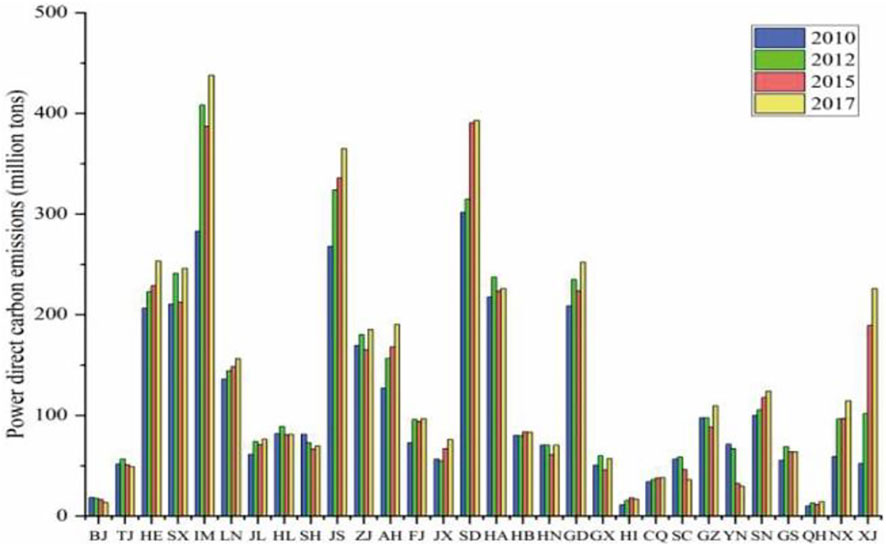
FIGURE 1. Direct carbon emissions from power sector in provinces of China.
4.2 Description of embodied carbon emissions in the power sector
Similar to direct carbon emissions, the total embodied carbon emissions from electricity between provinces in China are increasing from 2,661.97 Mt in 2010–3,475.86 Mt in 2017, with a total increase of 30.57%. In fact, China’s interprovincial electricity transmission has increased significantly, nearly doubling from 587.90 billion kWh in 2010 to 1,129.90 billion kWh in 2017. The increase of electricity trading volume also increases interprovincial embodied carbon emissions.
As can be seen from Figure 2, the provinces with higher power embodied carbon emissions mainly include Guangdong, Shandong, Jiangsu, Henan, Hebei and Zhejiang. These provinces, as major power producers, mainly rely on coal power. Among them, Guangdong, Shandong and Jiangsu have a higher level of economic development and broader economic radiation, resulting in a large amount of power embodied carbon transfer. Provinces with lower emissions are mainly in the central and western regions, such as Hainan, Qinghai, Ningxia, Gansu, Guizhou, Sichuan and Yunnan. Among them, Sichuan, Guizhou and Yunnan are dominated by hydropower and have a good power structure. Qinghai, Gansu and Ningxia have a lower level of economic development and less economic radiation; Hainan generates less electricity and is mainly self-sufficient.
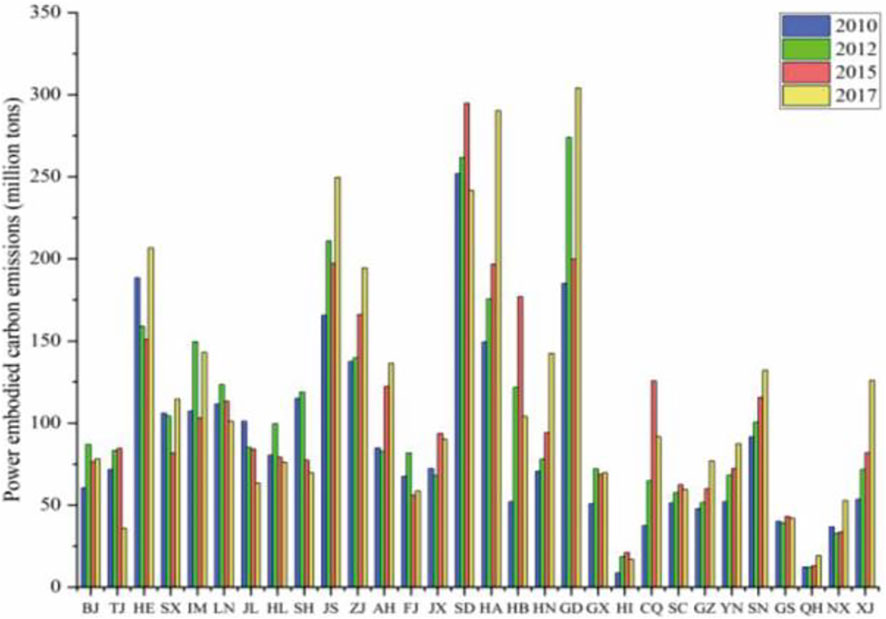
FIGURE 2. Embodied carbon emissions from power sector in provinces of China.
Considering only the interprovincial carbon transfer, it can be seen from Figure 3 that China’s power embodied carbon emission transfer is mainly concentrated in the central and northern regions. In the north, the transfer route is from coal-rich regions such as Inner Mongolia and Shanxi to provinces such as Beijing, Hebei and Shandong, which is consistent with the “north line” of China’s West-East power transmission project. In the central part, the transfer route is from Jiangsu and Henan to provinces such as Shandong, Guangdong and Zhejiang, which reflects the large demand for electricity in East China. From 2010 to 2017, the scale and scope of power carbon emission transfer among provinces have been expanded, from 2010 mainly distributed in the central and northern regions to 2017, the regional characteristics were broken, but on the whole, the transfer trend from west to east and north to south was shown. This also demonstrates the existence of inter-regional “carbon leakage” in China’s power sector. It is consistent with the conclusions of Ma (2021), which pointed out that “West-East Power Transmission” leads to carbon leakage of the coastal provinces and carbon overload of the hinterland provinces. The expansion of the scope of power embodied carbon transfer reflects the expansion of the scope of electricity market players and the deep economic integration. It can be predicted that with the deepening power reform, the transfer of power services between provinces will be more flexible, and the power embodied carbon transfer will be further expanded.
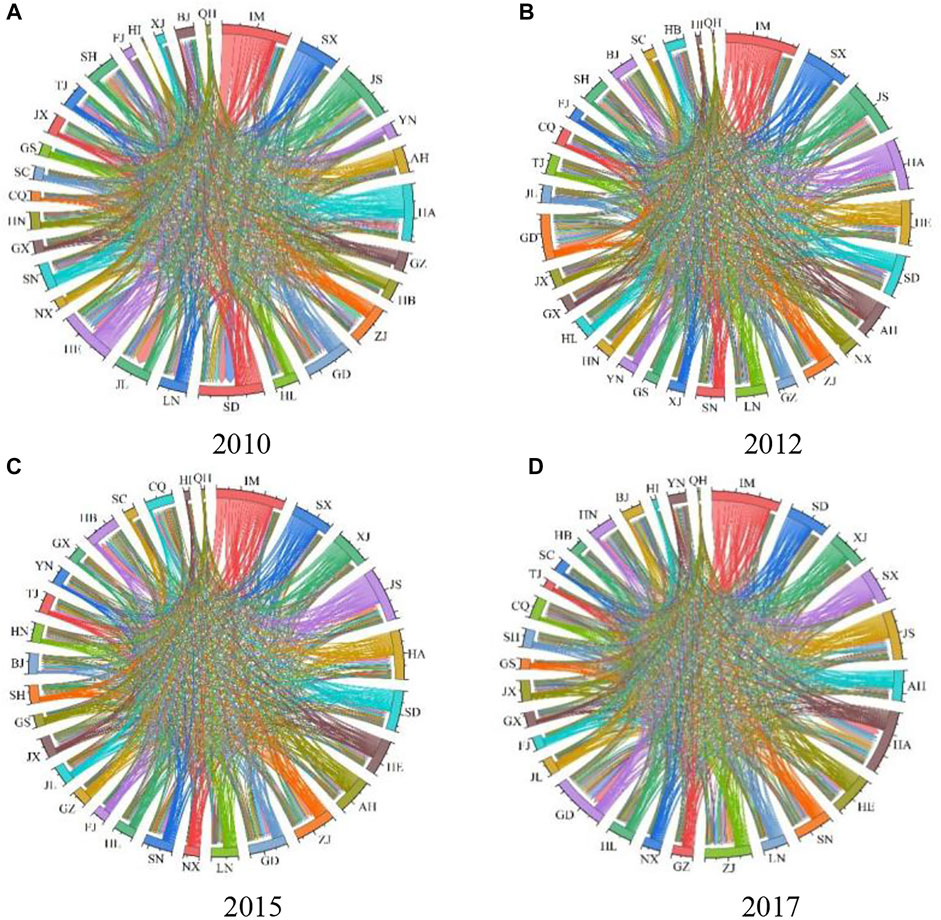
FIGURE 3. Embodied carbon emission transfer of China’s power sector in 2010 (A), 2012 (B), 2015 (C) and 2017 (D).
During the study period, the embodied carbon transfer has been inactive in the northwest regions where Ningxia, Qinghai and Gansu are located. These regions have good resource endowment and power production can meet their own development needs. At the same time, the economic development of these regions is relatively backward, and there is no need for a large amount of electricity, goods and services to be transferred in. The interregional embodied carbon emissions that meet the needs of economic and social development are less.
4.3 Characteristics of embodied carbon emission transfer networks in the power sector
Based on the analysis idea of edge weight mentioned above, the cumulative probability distribution of edge weight is constructed as shown in Figure 4. It can be seen that the cumulative probability of each year increases rapidly with the increase of the number of edges until the cumulative probability is greater than about 95%. Therefore, 75% of the edges covering 95% of the embodied carbon transfer volume are selected as the basis for constructing the networks, and the remaining edges are removed.
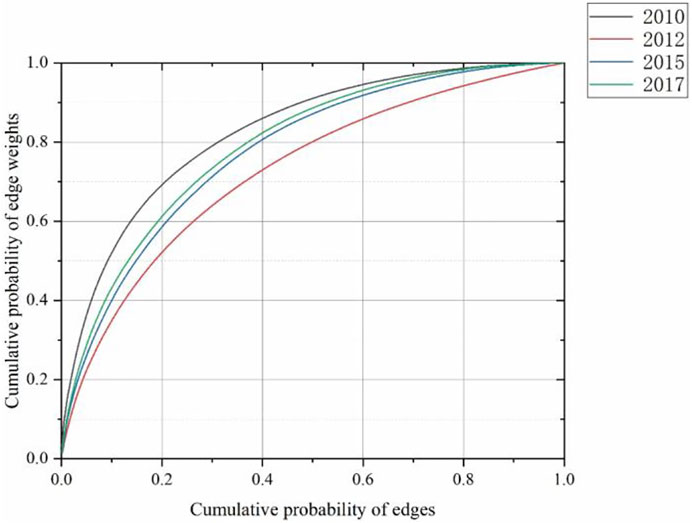
FIGURE 4. Cumulative probability distribution of edge weights.
The directed weighted networks of China’s interprovincial power embodied carbon emission transfer in 2010, 2012, 2015 and 2017 are shown in Figure 5. The circle indicates the province. The size of the circle represents the weight; The lager the circle, the greater the weight. The directed edge represents the direction of the embodied carbon emission transfer. The thickness of the edge represents the weight of the embodied carbon emissions from power sector. The thicker the edge, the greater the embodied carbon emission transfer.
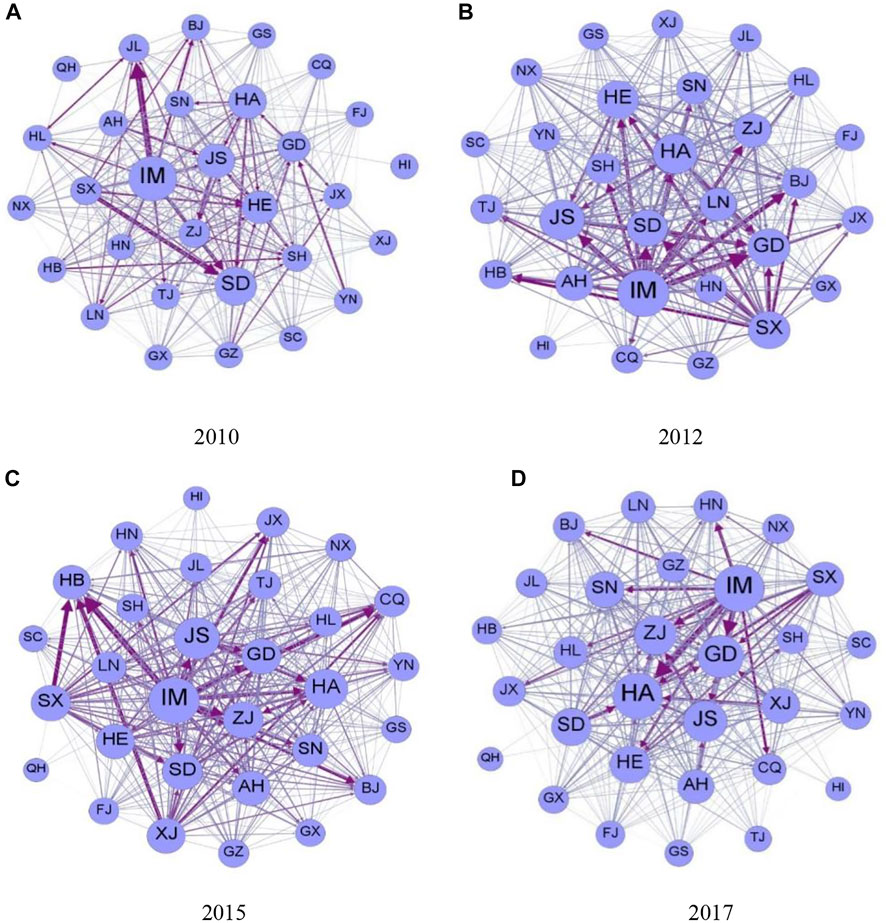
FIGURE 5. Embodied carbon emission transfer networks of China’s power sector in 2010 (A), 2012 (B), 2015 (C) and 2017 (D).
4.3.1 Small-world characteristics
The key indicators of the small-world characteristics of PECTNs of China are shown in Table 3. It can be seen that the average aggregation coefficients in 2010, 2012, 2015 and 2017 are 0.742, 0.786, 0.768, and 0.777, respectively, with values between 0.7 and 0.8 (range: 0–1) and a small fluctuation range. This indicates that more than 70% of the trading partners of one province in the PECTNs may be trading partner of other provinces, and the network as a whole shows a strong aggregation state. Compared with the clustering coefficient of 0.511 mentioned by Ge et al. (2016) in their study of rare earth trading networks, the PECTNs studied in this paper is more compact.
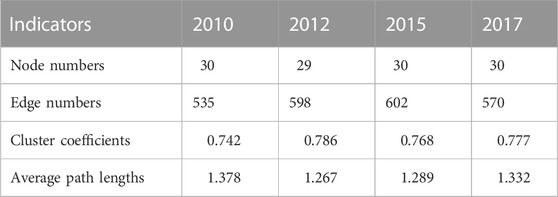
TABLE 3. Characteristics of the PECTNs.
The average path length has a range of values greater than 1, with smaller numbers indicating tighter connections between nodes in the network. The average shortest path lengths in 2010, 2012, 2015, and 2017 were 1.378, 1.267, 1.289, and 1.332, respectively, and the values were between 1.2 and 1.4, indicating that any two provinces in the network could achieve the transfer of power embodied carbon through 1.2 to 1.4 provinces on average. Compared with the average shortest path of 1.4 in the graphite trade network studied by Wang et al. (2019b), the shortest paths of the PECTNs in this paper is smaller.
China’s interprovincial PECTNs have large aggregation coefficients and short average path lengths. The networks as a whole have small-world characteristics. Therefore, any impact on key provinces would quickly spread to other provinces and may significantly impact the entire economic system. From an international perspective, the accelerated development of the global energy Internet proposed by China will also promote the large-scale transfer of the power embodied carbon emissions aronud the world. Controlling carbon emissions in key areas according to local conditions will significantly improve the level of carbon emission reduction.
4.3.2 Community structure
Based on the principle of modularity maximization, the communities of the PECTNs in 2010, 2012, 2015 and 2017 have been classified, as shown in Figure 6. Different colors represent different communities, which we define as yellow community C1, pink community C2, blue community C3 and green community C4.
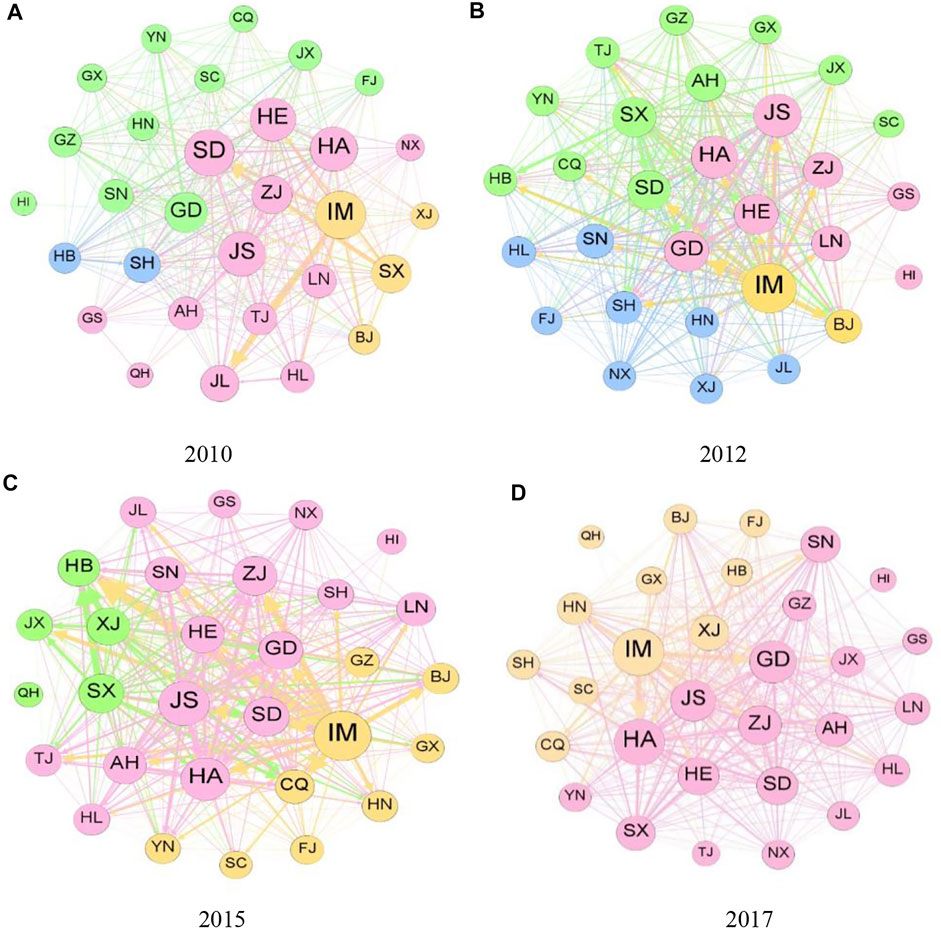
FIGURE 6. Communities of PECTNs in 2010 (A), 2012 (B), 2015 (C) and 2017 (D).
The size of modularity is intended to reflect the closeness among community members. The connections among nodes within the community are denser, the connections of nodes among groups are relatively sparse (Newman, 2003). It can be seen that the number of communities decreased from four to two from 2010 to 2017, which reflects the gradual weakening of the sub-regional phenomenon in China’s PECTNs. It further confirms that constantly developing power market has brought more opportunities for the free flow and optimal allocation of electricity commodities and production factors in a wider range, and power resources have achieved a larger-scale sharing, which is consistent with the goal of China’s power market reform.
Through our analysis, the network communities of embodied carbon emission transfer in China’s power sector show some characteristics: First, the PECTNs as a whole are tightly linked, and any two communities are closely linked, and no one is isolated. Second, the pink community C2 is the largest community with the largest amount of internal embodied carbon emission transfer, and its proportion in the total embodied carbon emission in the network increased from 69.4% in 2010 to 85.6% in 2017. Third, some geographically close provinces have stable relationships and are always located in the same communities, e.g., Inner Mongolia and Beijing in C1, Hebei, Henan, Jiangsu, Zhejiang, Liaoning and Tianjin in C2, Heilongjiang and Jilin in C2 (2010, 2015 and 2017) or C3 (2012), Guangdong and Hainan in C4 (2010) or C2 (2012, 2015 and 2017), Sichuan, Guangxi and Chongqing in C4 (2010 and 2012) or C1 (2015 and 2017). Fourth, there is gradual among the community member. Northern resource provinces such as Inner Mongolia, Shanxi and Xinjiang belong to one community in 2010, but they belong to different communities from 2012 to 2017, along with the supply of electricity to the east and south.
4.3.3 Role of the nodes-identification of key provinces
Due to the difference of resource endowments, economic levels and power structures, provinces play different roles in the PECTNs. The centrality theory of complex network is used to analyze the role of provinces in the network.
4.3.3.1 Analysis based on degree centrality
In the PECTNs, the more provinces have a transfer relationship with a certain province, the more important the province is in the network.
As can be seen from Figure 7, the degree centrality values of Hebei, Inner Mongolia, Jiangsu, Shandong, Henan and Guangdong in each year are above 0.9, indicating that these six provinces have had power embodied carbon transfer with more than 90% of the provinces, and the transfer relationship is relatively stable. Among them, Inner Mongolia, Hebei and Henan are provinces with relatively abundant coal resources, and they have undertaken the responsibility of delivering electricity to provinces with scarce resources and power shortages. Shandong, Jiangsu and Guangdong, as economically developed provinces with large demand for electricity, need to purchase electricity from other provinces to relieve their own power pressure. It can be inferred that with the economic globalization and deep integration of international industrial chain, the transfer of power carbon emissions embodied in the trade of goods and services is more likely to occur in major trading countries such as China and the USA, and their importance is self-evident.
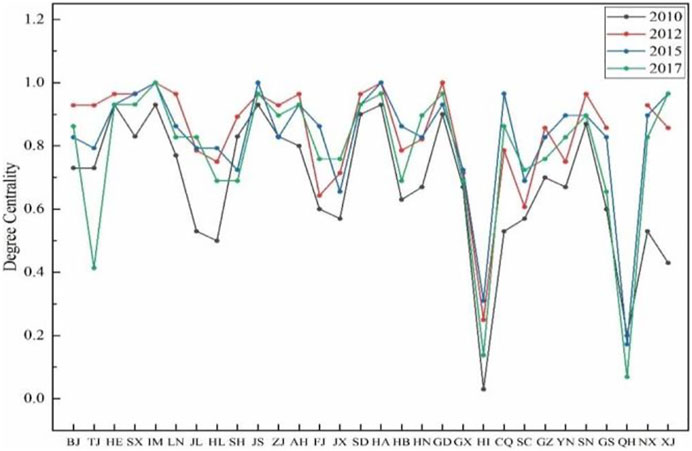
FIGURE 7. Degree centrality.
During the study period, the degree centrality value of Xinjiang increased the most, from 0.43 in 2010 to 0.97 in 2017, which is inseparable from the continuous strengthening of power grid construction in Xinjiang and the rich trading modes. Over the past decade, four Xinjiang power transmission channels has been built, which not only provides strong support for the efficient development and utilization of energy sources in Xinjiang, but also makes it possible for the rich energy resources to be converted into electricity to support the increasing power supply of other provinces. Next is Chongqing, the degree centrality value increased from 0.53 in 2010 to 0.96 in 2015 and then decreased to 0.86 in 2017. Chongqing’s resource endowment is not high, and there is a power shortage with the growth of power demand, thus resulting in the increasing number of interprovincial power trading objects. The small decrease in 2017 maybe due to the increase of clean energy supply to Chongqing’s power demand with the improvement of the utilization level of hydropower in Southwest China.
4.3.3.2 Analysis based on strength centrality
Unlike degree and degree centrality, strength centrality focuses on the quality of the transfer relationship compared to the number of transfer partners.
The strength centrality values of Inner Mongolia, Shandong, Henan, Jiangsu, Hebei, Guangdong, Zhejiang and Shanxi have always ranked among the top 10, and their cumulative strength centrality is around 0.5 in each year. It can seen that provinces with higher strength centrality values also tend to have higher degree centrality values. These provinces play a vital role in the power trading market, with a high proportion of power embodied carbon transfer in the network. Among them, the intensity centrality value of Inner Mongolia has always ranked the first. With its rich coal resources, Inner Mongolia is an important force in interprovincial power supply.
As seen in Figure 8, the strength centrality of Xinjiang has the largest change, increasing from 0.00843 in 2010 to 0.04491 in 2017, ranking at the forefront. Xinjiang has the largest coal reserves and the second largest reserves of wind and solar energy in China. No matter the number of transfer partners or the quality of transfer relationships, the power trading between Xinjiang and other provinces has become increasing close. According to State Grid Xinjiang Electric Power Co., Ltd. Xinjiang’s power transmission has increased from three billion kWh in 2010 to 43.5 billion kWh in 2017, gradually becoming one of the essential components of the interprovincial power trading market.

FIGURE 8. Strength centrality.
4.3.3.3 Analysis based on closeness centrality
The provinces with higher closeness centrality in the networks have the shortest total distance from all other provinces, and they have the closest connections to other provinces, so they have the location advantage in the process of power embodied carbon transfer.
As can be seen from Figure 9, Inner Mongolia, Henan, Jiangsu, Shandong, Hebei, Shanxi and Anhui have higher closeness centrality values, ranking top 10 all the time, which indicates that these provinces are in the core position of the networks and are more likely to have power embodied carbon emission transfer with other provinces, and their carbon emission transmission efficiency is higher. These provinces are located in the hinterland of North, Central and East China. Most of them are rich in coal resources, and they are conducting close power transactions with other provinces with their carbon resource endowment and geographical location advantages. If more efforts are made to control these nodal provinces in the formulation of energy conservation and emission reduction policies, better carbon emission reduction effects may be achieved.

FIGURE 9. Closeness centrality.
Qinghai ranks consistently low in closeness centrality value, which is due to its location in northwest inland of China and its greater average distance from other nodes in the networks. During the study period, the closeness centrality value of Qinghai decreased significantly, from 0.4377 in 2010 to 0 in 2017, probably due to the high proportion of hydropower and solar power generation in Qinghai’s power structure, and the optimized power structure significantly reduces the embodied carbon transfer amount of power. Unlike Qinghai, Xinjiang’s closeness centrality value increased from 0.6087 in 2010 to 0.9667 in 2017, and its ranking rose from 28th in 2010 to fifth in 2017. It is mainly because Xinjiang is a large coal province, and its power structure is still dominated by thermal power generation. However, with the construction of extra-high voltage and the improvement of power infrastructure in Xinjiang, the radiation range of “power transfer from Xinjiang to outside” is expanding, and the efficiency of carbon transmission is also gradually improving.
4.3.3.4 Analysis based on betweenness centrality
The higher the betweenness centrality value of the nodes in the networks, the stronger the control ability of other nodes in the PECTNs, which play the role of bridges in the networks.
As shown in Figure 10, the betweenness centrality values vary widely among provinces, with only a small number of provinces playing a significant mediating role. The betweenness centrality value of Jiangsu, Guangdong, Henan, Hebei, Inner Mongolia and Shandong is always higher. On the one hand, these provinces are important power production provinces dominated by coal power; on the other hand, among these provinces, Hebei and Inner Mongolia shoulder the task of supplying coal to the whole country, while economically strong provinces like Guangdong, Jiangsu, Shandong and Henan, have a great demand for power. Therefore, these provinces play the bridge role in the networks and have stronger control over the transfer of power embodied carbon emissions of other provinces.
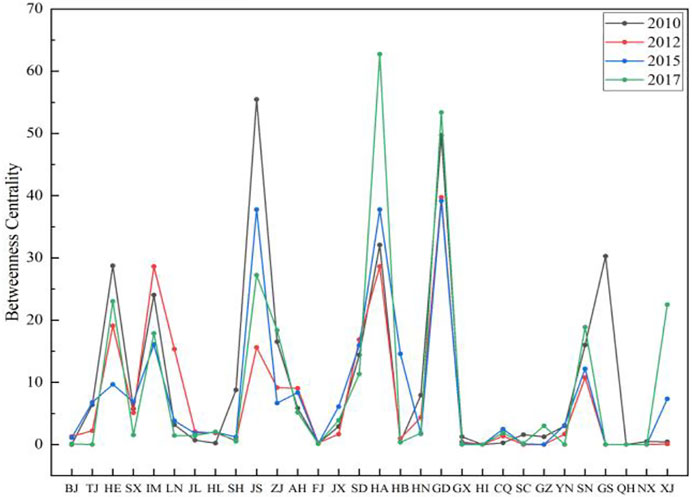
FIGURE 10. Betweenness centrality.
In terms of changes, the betweenness centrality values of Gansu and Jiangsu have decreased greatly. The betweenness centrality value of Gansu was 30.28 in 2010, and has been 0 since 2012, with the largest decrease. Gansu is located in Northwest China, which has less power embodied carbon transfer with other provinces except Xinjiang. With the continuous improvement of Xinjiang’s power grid and the improvement of transmission capacity, it is not necessary to conduct interprovincial power trading through Gansu. The betweenness centrality value of Jiangsu decreased from 55.47 in 2010 to 27.24 in 2017. Jiangsu is located in East China, where the power market is more flexible, the regional characteristics of power trading are gradually weakened, and its control over the power trading in surrounding regions has also diminished. On the contrary, the betweenness centrality value of Henan increased significantly from 32.08 in 2010 to 62.74 in 2017. Located in the Central Plains of China, Henan is adjacent to both resource-based and developed provinces. It plays a solid betweenness role as an essential link of power transmission from the western regions to the eastern and southern regions of China.
4.3.3.5 Analysis based on eigenvector centrality
Eigenvector centrality emphasizes more on the surrounding environment of network nodes. A province is considered important if it has more linked provinces and the provinces linked to it are in important positions, the province is also considered an important province. The eigenvector centrality can be used to describe this indirect influence.
As shown in Figure 11, the eigenvector centrality values of Jiangsu, Guangdong, Henan, Shaanxi, Beijing, Hebei and Zhejiang were always high during the study period, among which Jiangsu, Guangdong, Henan, Shaanxi and Beijing ranked in the top 10. It indicates that these provinces have strong association with the key provinces in the networks and their indirect influence is strong. Shaanxi and Hebei are close to Inner Mongolia and Shanxi, which have a high amount of power embodied carbon transfer. Beijing is located in the Beijing-Tianjin-Hebei Economic Zone, adjacent to Hebei and close to Inner Mongolia, so its indirect influence is strong. Jiangsu, Henan and Zhejiang are geographically close to each other and located in the central and eastern regions, where the power embodied carbon transfer is active, so they influence each other. Guangdong, as a strong economic province, has a large demand for power, and there are a large number of power transactions with coal-rich provinces such as Hebei, Shanxi, Inner Mongolia and Jiangsu, so its eigenvector centrality value is also high.

FIGURE 11. Eigenvector centrality.
The eigenvector centrality values of Qinghai and Hainan are always low. This is because the small difference between power generation and consumption of the two provinces (basically the same), and the power production is mainly used to meet the needs of their economic development, with limited traded power.
5 Conclusion and policy recommendations
5.1 Conclusion
This paper combined the input-output analysis with the complex network theory to establish a directed weighted network of embodied carbon emission transfer in China’s power sector in four different years. The complex network analysis indicators are used to analyze the evolution characteristics of the networks and identify the key provinces. The main findings are as follows.
(1) From 2010 to 2017, the total direct carbon emissions from China’s power sector showed an increasing trend. Carbon emissions from the power sector are also relatively high in regions with high coal resource endowments, such as Hebei, Shanxi and Inner Mongolia. The carbon emission level of power sector is relatively low in regions with a high proportion of hydropower in the southwest, province-level municipalities with high economic development level, as well as less developed regions with less demand for power, such as Hainan and Gansu.
(2) The provinces in China with higher power embodied carbon emissions are mainly concentrated in the provinces with large coal-based power production, while the provinces with lower rankings are mainly concentrated in the central and western regions. The transfer of power embodied carbon emissions is mainly concentrated in the central and northern regions, showing a transfer trend of “west to east and north to south”. From 2010 to 2017, the scale and scope of power carbon emission transfer among provinces have been expanding.
(3) On the whole, China’s power embodied carbon emission transfer networks have small-world characteristics, which is not only reflected in the large aggregation coefficients of the networks, showing a strong aggregation state, but also in the short average path lengths of the networks, taking only 1.2–1.4 intermediate provinces for the transfer of embodied carbon emissions from one province to any other province, and the relationship between provinces is close.
(4) From 2010 to 2017, the number of communities divided by the PECTNs decreased, the phenomenon of sub-regions gradually weakened, and the community members became more integrated. In the community division, provinces with stable relationships are geographically close to each other and have closer carbon linkages.
(5) Resource-based provinces such as Inner Mongolia, Hebei and Shanxi, economically strong provinces such as Guangdong, Shandong and Jiangsu, and geographically advantageous central China (such as Henan) are often in an important position in the PECTNs. Benefiting from the improvement of power infrastructure, Xinjiang has gradually gained prominence in the network by supporting the power supply of more and more provinces while transforming its resource advantages into economic advantages.
5.2 Policy recommendations
China is world’s largest generator of electricity, and its considerable volume makes its low-carbon development decisions crucial to mitigating global climate change. According to China Emission Accounts and Datasets (CEADs), in 2020, China’s carbon emissions per kilowatt-hour in the power sectorwas 594g, higher than the world average (487 g), the United States (335 g) and the European Union (269 g). It can be seen that there is a long way to go to reduce carbon emissions in the power industry. To further optimize carbon emission reduction measures, the following targeted suggestions are proposed based on the international background and the findings of this paper.
(1) The development of green power can significantly reduce the level of carbon emissions in the power sector. In recent years, China has led the world in installed wind, solar and nuclear power (IEA et al., 2021), while demonstrating an unparalleled capacity to expand zero-carbon electricity. To promote the clean, green and low-carbon transformation of the power sector, first is to control the scale of coal power construction and promote reasonable growth of coal power generation capacity according to local conditions. Second, the power generation target and utilization rates of new energy in each region should be set reasonably. In the case of limited space for hydropower growth, the central and eastern regions can be encouraged to develop wind power and photovoltaic power generation in a decentralized and distributed manner, and orderly develop nuclear power projects with comparative advantages in cost and power generation efficiency. Third, accelerate the formulation of technical standards for energy conservation and emission reduction to promote relevant technological innovation and promotion. Fourth, establish a compensation mechanism for systematic peak regulation and frequency regulation or auxiliary service market, mobilize the enthusiasm of various plant units to participate in the auxiliary service market, and improve the absorption capacity of the system for non-fossil energy power generation.
(2) The phenomenon of regional agglomeration in PECTNs of China is gradually weakening, and the scale and scope of power carbon emission transfer among provinces are expanding. To better promote the realization of power trading, on the one hand, it is necessary to promote the construction of smart grids, make full use of the existing interregional grids, expand interregional power support deployment, maximize the use of the regional power structure characteristics, and relieve the power tension in each province by staggering the peaks. On the other hand, market trading platform should be actively promoted. All market players can participate in power trading through various means, such as spot, so as to promote the sharing and optimal allocation of power resources in a wider range, promote green energy consumption, and boost regional complementary development.
(3) The interregional PECTNs have small-world characteristics. The power carbon emission reduction policies formulated for any province may soon radiate to other provinces, thus affecting the whole sector. Therefore, emission reduction policies should be formulated carefully, taking into account the overall situation, comprehensively consider the position and role of each province in the networks, and formulate coordinated emission reduction policies according to local conditions. As far as the international community is concerned, more attention should be paid to the important position of international powers (e.g., China and the United States) in the reduction of embodied carbon emissions from power sectors. In the process of promoting the global energy clean transformation, countries with conditions can carry out power interconnection cooperation nearby.
(4) The reverse distribution of energy resources and demand in China has brought about the transfer of embodied carbon emissions from the power sector. Coal-based provinces and large economic provinces with high power demand are often at the core of the networks. Therefore, the development of emission reduction policies in the power sector should balance the relationship between supply and demand and formulate differentiated countermeasures. Power suppliers, such as Inner Mongolia, Shanxi, Hebei, Anhui and Xinjiang, should optimize the power production structure, improve the use of renewable energy and reduce carbon emissions from the production side. The power demand side, such as Guangdong, Beijing, Zhejiang and Shanghai, should actively promote the low carbon concept, save electricity, or provide financial support for energy saving and emission reduction technologies or technological upgrading for the power production area. For areas with a strong intermediary role like Jiangsu and Henan, the level of technology and equipment for power transmission and energy storage should be improved to facilitate the use of renewable energy. Similarly, for the international “carbon leakage” caused by the differences in environmental policies, developed countries should actively invest in capital and technology and formulate corresponding supporting measures to prevent the occurrence of “carbon leakage” while implementing the power emission reduction polices. Developing countries should also do their best to reduce emissions according to their own level of economic development.
Data availability statement
The raw data supporting the conclusions of this article will be made available by the authors, without undue reservation.
Author contributions
FF contributed to conception and design of the study. XM organized the database. FF and XM performed the statistical analysis. XM wrote the first draft of the manuscript. FF and QL wrote sections of the manuscript. FF revised and proofread the manuscript. All authors contributed to manuscript revision, read, and approved the submitted version.
Acknowledgments
The authors express their sincere thanks for the support from the National Natural Science Foundation of China under Grant Nos. 41901252, No.72074199 and No.72088101; and China Geological Survey under Grant Nos. DD20221795.
Conflict of interest
The authors declare that the research was conducted in the absence of any commercial or financial relationships that could be construed as a potential conflict of interest.
Publisher’s note
All claims expressed in this article are solely those of the authors and do not necessarily represent those of their affiliated organizations, or those of the publisher, the editors and the reviewers. Any product that may be evaluated in this article, or claim that may be made by its manufacturer, is not guaranteed or endorsed by the publisher.
Footnotes
1PECTNs: power embodied carbon transfer networks.
References
Acemoglu, D., Ozdaglar, A., and Tahbaz-Salehi, A. (2017). Microeconomic origins of macroeconomic tail risks. Am. Econ. Rev. 107 (1), 54–108. doi:10.1257/aer.20151086
Ali, Y. (2017). Carbon, water and land use accounting: Consumption vs production perspectives. Renew. Sust. Energ. Rev. 67, 921–934. doi:10.1016/j.rser.2016.09.022
An, Q., An, H., and Wang, L. (2014). Analysis of the embodied energy flow network between Chinese industries. J. Sys. Engr. 29 (06), 754–762. doi:10.13383/j.cnki.jse.2014.06.004
Bonacich, P., and Lloyd, P. (2001). Eigenvector-like measures of centrality for asymmetric relations. Soc. Netw. 23 (3), 191–201. doi:10.1016/s0378-8733(01)00038-7
CIKD (2022). Global Development Report. Beijing: Center for International Knowledge on Development, 27.
Chen, Z. M., and Chen, G. Q. (2011). Embodied carbon dioxide emission at supra-national scale: A coalition analysis for G7, bric, and the rest of the world. Energ. Policy 39, 2899–2909. doi:10.1016/j.enpol.2011.02.068
Cheng, M., Wu, J., Li, C., Jia, Y., and Xia, X. (2023). Tele-connection of global agricultural land network: Incorporating complex network approach with multi-regional input-output analysis. Land Use Policy 125, 106464. doi:10.1016/j.landusepol.2022.106464
China.org.cn (2023). China.org.cn. Available at: https://baijiahao.baidu.com/s?id=1698066633643641593&wfr=spider&for=pc (Accessed January 4, 2023).
Costanza, R. (1980). Embodied energy and economic valuation. Sci 210, 1219–1224. doi:10.1126/science.210.4475.1219
Dai, F., Yang, J., Guo, H., and Sun, H. (2021). Tracing CO2 emissions in China-us trade: A global value chain perspective. Sci. Total Environ. 775, 145701. doi:10.1016/j.scitotenv.2021.145701
Davis, S. J., and Caldeira, K. (2010). Consumption-based accounting of CO2 emissions. Proc. Natl. Acad. Sci. 107 (12), 5687–5692. doi:10.1073/pnas.0906974107
Dong, S., Xia, B., Li, F., Cheng, H., Li, Z., Li, Y., et al. (2023). Spatial–temporal pattern, driving mechanism and optimization policies for embodied carbon emissions transfers in multi-regional tourism: Case study of provinces in China. J. Clean. Prod. 382, 135362. doi:10.1016/j.jclepro.2022.135362
Fan, F. (2016). Study on the impact factors of carbon emissions and the emission reduction policy in Beijing. dissertation/doctor’s thesis. Beijing: China University of Geosciences.
Fang, D., and Chen, B. (2019). Information-based ecological network analysis for carbon emissions. Appl. Energ. 238, 45–53. doi:10.1016/j.apenergy.2019.01.066
Freeman, L. C. (1977). A set of measures of centrality based on betweenness. Sociometry 40 (1), 35–41. doi:10.2307/3033543
Gao, P., Yue, S., and Chen, H. (2021). Carbon emission efficiency of China’s industry sectors: From the perspective of embodied carbon emissions. J. Clean. Prod. 283, 124655. doi:10.1016/j.jclepro.2020.124655
Gao, X., An, H., Fang, W., Li, H., and Sun, X. (2014). The transmission of fluctuant patterns of the forex burden based on international crude oil prices. Energy 73, 380–386. doi:10.1016/j.energy.2014.06.028
Ge, J., Wang, X., Guan, Q., Li, W., Zhu, H., and Yao, M. (2016). World rare earths trade network: Patterns, relations and role characteristics. Resour. Policy 50, 119–130. doi:10.1016/j.resourpol.2016.09.002
Grazzini, J., and Spelta, A. (2022). An empirical analysis of the global input–output network and its evolution. Phys. A 594, 126993. doi:10.1016/j.physa.2022.126993
Guo, J., Zhang, Y., and Zhang, K. (2018). The key sectors for energy conservation and carbon emissions reduction in China: Evidence from the input-output method. J. Clean. Prod. 179, 180–190. doi:10.1016/j.jclepro.2018.01.080
IEAIRENAUNSDWorld BankWHO (2021). Tracking SDG7: The energy progress report. World Bank, Washington, DC: Ⓒ World Bank. License: Creative Commons Attribution—NonCommercial 3.0 IGO. (Report No.: CC BY-NC 3.0 IGO).
IPCC (2022). Climate change 2022: Mitigation of climate change. Contribution of working group Ⅲ to the sixth assessment report of the Intergovernmental Panel on Climate Change. Cambridge, United Kingdom: Cambridge University Press.
Ishfaq, U., Khan, H. U., and Iqbal, S. (2022). Identifying the influential nodes in complex social networks using centrality-based approach. J. King Saud. Univ.-Com. 34 (10), 9376–9392. doi:10.1016/j.jksuci.2022.09.016
Jiang, M., An, H., Gao, X., Liu, S., and Xi, X. (2019a). Factors driving global carbon emissions: A complex network perspective. Resour. Cconserv. Recy. 146, 431–440. doi:10.1016/j.resconrec.2019.04.012
Jiang, M., Gao, X., Guan, Q., Hao, X., and An, F. (2019b). The structural roles of sectors and their contributions to global carbon emissions: A complex network perspective. J. Clean. Prod. 208, 426–435. doi:10.1016/j.jclepro.2018.10.127
Leontief, W. (1970). Environmental repercussions and the economic structure: An input-output approach. Rev. Econ. Stat. 52 (3), 262–271. doi:10.2307/1926294
Leontief, W. (1974). Structure of the world economy: Outline of a simple input-output formulation. Swed. J. Econ. 76 (4), 387–401. doi:10.2307/3439247
Li, J., Chen, B., Chen, G., Wei, W., Wang, X., Ge, J., et al. (2017). Tracking mercury emission flows in the global supply chains: A multi-regional input-output analysis. J. Clean. Prod. 140, 1470–1492. doi:10.1016/j.jclepro.2016.10.002
Liu, L., Shen, M., Sun, D., Yan, X., and Hu, S. (2022). Preferential attachment, R&D expenditure and the evolution of international trade networks from the perspective of complex networks. Phys. A 603, 127579. doi:10.1016/j.physa.2022.127579
Liu, W., Tang, Z., Chen, J., and Yang, B. (2014). The 2010 China multi-regional input-output table of 30 provincial units. Beijing: China Statistics Press.
Liu, Y., Wang, J., Wang, X., Wu, H., Guo, F., and Song, Y. (2022). A study of CO2 emissions in China’s domestic construction industry based on non-competitive input-output. Sustain. Prod. Consump. 32, 743–754. doi:10.1016/j.spc.2022.05.024
Long, Y., and Yoshida, Y. (2018). Quantifying city-scale emission responsibility based on input-output analysis – insight from Tokyo, Japan. Appl. Energy 218, 349–360. doi:10.1016/j.apenergy.2018.02.167
Ma, L. (2021). Inter-provincial power transmission and its embodied carbon flow in China: Uneven green energy transition road to east and west. Energies 15, 176. doi:10.3390/en15010176
Miao, L., Tang, S., Li, X., Yu, D., Deng, Y., Hang, T., et al. (2023). Estimating the CO2 emissions of Chinese cities from 2011 to 2020 based on SPNN-GNNWR. Environ. Res. 218, 115060. doi:10.1016/j.envres.2022.115060
Mongelli, I., Tassielli, G., and Notarnicola, B. (2006). Global warming agreements, international trade and energy/carbon embodiments: An input–output approach to the Italian case. Energy Policy 34, 88–100. doi:10.1016/j.enpol.2004.06.004
National Bureau of Statistics (2022a). National bureau of Statistics. Available at: https://data.stats.gov.cn/easyquery.htm?cn=C01 (Accessed November 15, 2022).
National Bureau of Statistics (2022b). National bureau of Statistics. Available at: https://data.stats.gov.cn/easyquery.htm?cn=E0103&zb=A0703®=650000&sj=2017 (Accessed December 30, 2022).
Newman, M. E. J. (2003). The Structure and function of complex networks. SIAM Rev. 45 (2), 167–256. doi:10.1137/s003614450342480
Ning, Y., Miao, L., Ding, T., and Zhang, B. (2019). Carbon emission spillover and feedback effects in China based on a multiregional input-output model. Resour. Conserv. Recycl. 141, 211–218. doi:10.1016/j.resconrec.2018.10.022
Pacini, H., Shi, G., Sanches-Pereira, A., and Filho, A. C. S. (2021). Network analysis of international trade in plastic scrap. Sustain. Prod. Consump. 27, 203–216. doi:10.1016/j.spc.2020.10.027
Sánchez-Chóliz, J., and Duarte, R. (2004). CO2 emissions embodied in international trade: Evidence for Spain. Energ. Policy 32 (18), 1999–2005. doi:10.1016/s0301-4215(03)00199-x
Sun, C., Ding, D., and Yang, M. (2017). Estimating the complete CO2 emissions and the carbon intensity in India: From the carbon transfer perspective. Energy Policy 109, 418–427. doi:10.1016/j.enpol.2017.07.022
Sun, L., Zhou, W., Zhu, X., and Xia, X. (2023). Deforestation embodied in global trade: Integrating environmental extended input-output method and complex network analysis. J. Environ. Manage. 325, 116479. doi:10.1016/j.jenvman.2022.116479
Tang, D. (2014). Research on complex Input-output flow network. dissertation/doctor’s thesis. Hefei: University of Science and Technology of China.
Tanuja, S., Ho, I. W.-H., and Tse, C. K. (2018). Spatial analysis of bus transport networks using network theory. Phys. Stat. Mech. Its Appl. 502, 295–314. doi:10.1016/j.physa.2018.02.111
Wang, J., Li, Z., Wu, T., Wu, S., and Yin, T. (2022). The decoupling analysis of CO2 emissions from power generation in Chinese provincial power sector. Energy 255, 124488. doi:10.1016/j.energy.2022.124488
Wang, M., Zhao, L., Du, R., Wang, C., Chen, L., Tian, L., et al. (2018). A novel hybrid method of forecasting crude oil prices using complex network science and artificial intelligence algorithms. Appl. Energ. 220, 480–495. doi:10.1016/j.apenergy.2018.03.148
Wang, X., Li, H., Yao, H., Chen, Z., and Guan, Q. (2019a). Network feature and influence factors of global nature graphite trade competition. Resour. Policy 60, 153–161. doi:10.1016/j.resourpol.2018.12.012
Wang, X., Wei, W., Ge, J., Wu, B., Bu, W., Li, J., et al. (2017). Embodied rare earths flow between industrial sectors in China: A complex network approach. Resour. Conserv. Recy. 125, 363–374. doi:10.1016/j.resconrec.2017.07.006
Wang, X., Yao, M., Li, J., Ge, J., Wei, W., Wu, B., et al. (2019b). Global embodied rare earths flows and the outflow paths of China’s embodied rare earths: Combining multi-regional input-output analysis with the complex network approach. J. Clean. Prod. 216, 435–445. doi:10.1016/j.jclepro.2018.12.312
Wang, Y., Lei, Y., Fan, F., Li, L., Liu, L., and Wang, H. (2021). Inter-provincial sectoral embodied CO2 net-transfer analysis in China based on hypothetical extraction method and complex network analysis. Sci. Total Environ. 786, 147211. doi:10.1016/j.scitotenv.2021.147211
Wang, Y., Xiong, S., and Ma, X. (2022). Carbon inequality in global trade: Evidence from the mismatch between embodied carbon emissions and value added. Ecol. Econ. 195, 107398. doi:10.1016/j.ecolecon.2022.107398
Watts, D. J., and Strogatz, S. H. (1998). Collective dynamics of ‘small-world’ networks. Nature 393, 440–442. doi:10.1038/30918
Wen, T., Gao, Q., Chen, Y., and Cheong, K. H. (2022). Exploring the vulnerability of transportation networks by entropy: A case study of asia–europe maritime transportation network. Reliab. Eng. Syst. Safe. 226, 108578. doi:10.1016/j.ress.2022.108578
Wyckoff, A. W., and Roop, J. M. (1994). The embodiment of carbon in imports of manufactured products: Implications for international agreements on greenhouse gas emissions. Energ. Policy 22 (3), 187–194. doi:10.1016/0301-4215(94)90158-9
Xi, J. P. (2020). Statement at the general debate of the 75th session of the united Nations general assembly. Available at: http://theory.people.com.cn/GB/n1/2020/0928/c40531-31878071.html (Accessed January 12, 2023).
Xing, Z., Jiao, Z., and Wang, H. (2022). Carbon footprint and embodied carbon transfer at city level: A nested MRIO analysis of central plain urban agglomeration in China. Sustain. Cities Soc. 83, 103977. doi:10.1016/j.scs.2022.103977
Zareie, A., and Sheikhahmadi, A. (2018). A hierarchical approach for influential node ranking in complex social networks. Expert Syst. Appl. 93, 200–211. doi:10.1016/j.eswa.2017.10.018
Zhang, Q., and Li, M. (2022). A betweenness structural entropy of complex networks. Chaos Solit. Fract. 161, 112264. doi:10.1016/j.chaos.2022.112264
Zhang, W., Peng, S., and Sun, C. (2015). CO2 emissions in the global supply chains of services: An analysis based on a multi-regional input–output model. Energ. Policy 86, 93–103. doi:10.1016/j.enpol.2015.06.029
Zhang, Y., Wu, Q., Wang, X., Fath, B. D., Liu, G., Hao, Y., et al. (2017). Analysis of the ecological relationships within the CO2 transfer network created by global trade and its changes from 2001 to 2010. J. Clean. Prod. 168, 1425–1435. doi:10.1016/j.jclepro.2017.09.076
Zhang, Z., and Chen, W. (2022). Embodied carbon transfer between China and the belt and road initiative countries. J. Clean. Prod. 378, 134569. doi:10.1016/j.jclepro.2022.134569
Zheng, H., Li, A., Meng, F., Liu, G., Hu, Y., Zhang, Y., et al. (2021). Ecological network analysis of carbon emissions from four Chinese metropoles in multiscale economies. J. Clean. Prod. 279, 123226. doi:10.1016/j.jclepro.2020.123226
Zhi, Z. (2023). Tracing production carbon emission transfer through global value chains: Towards a top gainer principle. Sci. Total Environ. 866, 161316. In press. doi:10.1016/j.scitotenv.2022.161316
Keywords: power sector, embodied carbon transfer, interprovincial input-output, complex networks, CO2 emission reduction
Citation: Ma X, Fan F and Liu Q (2023) Study on the characteristics of embodied carbon emission transfer in China’s power sector based on input-output networks. Front. Environ. Sci. 11:1114156. doi: 10.3389/fenvs.2023.1114156
Received: 02 December 2022; Accepted: 09 January 2023;
Published: 19 January 2023.
Edited by:
Sikandar Ali Qalati, Jiangsu University, ChinaReviewed by:
Haozhi Pan, Shanghai Jiao Tong University, ChinaZhibo Zhao, Qilu University of Technology, China
Copyright © 2023 Ma, Fan and Liu. This is an open-access article distributed under the terms of the Creative Commons Attribution License (CC BY). The use, distribution or reproduction in other forums is permitted, provided the original author(s) and the copyright owner(s) are credited and that the original publication in this journal is cited, in accordance with accepted academic practice. No use, distribution or reproduction is permitted which does not comply with these terms.
*Correspondence: Fengyan Fan, ZmFuLWZlbmd5YW5AMTYzLmNvbQ==