 Lin Hu
 Zhaosheng Wang
 Mei Huang
 Hongfu Sun2
 Qinyi Wang
95% of researchers rate our articles as excellent or good
Learn more about the work of our research integrity team to safeguard the quality of each article we publish.
Find out more
METHODS article
Front. Environ. Sci. , 26 April 2023
Sec. Atmosphere and Climate
Volume 11 - 2023 | https://doi.org/10.3389/fenvs.2023.1112874
This article is part of the Research Topic Physical and Chemical Processes within the Planetary Boundary Layer and Their Impacts on Air Pollution View all 12 articles
O3 pollution in China has been increasing in recent years, but the process of O3 impact on net primary productivity of terrestrial ecosystems remains unclear. We attempts to explore a remote sensing-based method to assess the impact of O3 on NPP of China’s terrestrial ecosystems by combining MODIS NPP and the latest ground observation data of O3 concentration. By comparing the NPP data of MODIS image pixels with the 6-year average AOT40 data of corresponding pixels, we extracted the signal data that highlighted the effects of O3 on NPP and established the response relationships between AOT40 and NPP. It was found that NPP was significantly negatively correlated with AOT40 in farmland and grassland ecosystems in China (farmland: r = 0.8674, p < 0.003, grassland: r = 0.7181, p < 0.03). Then the response relationships were adopted to evaluate the effect in China in 2014. The results showed that the estimated percentage of O3-induced NPP decline was in the range of 5%–35%. Among them, the most significant declines were found in farmland ecosystems, with the vast majority of declines in 10%–35%. The decrease rate of evergreen coniferous forests ranked second, mostly in the range of 15%–20%. The grassland ecosystems declined at a lower rate, almost between 5% and 15%. And the evergreen broad-leaved forests has the lowest decline rate, most distributed in 0%–5%. The highest percentage decreases were mainly found in the Beijing-Tianjin-Hebei region and Shandong Province. And the decline rate of farmland ecosystems was significantly higher than other ecosystem types.
Net primary productivity (NPP) is the total amount of organic matter fixed by vegetation per unit time and area, which reflects the capacity of vegetation to absorb carbon dioxide and is an important indicator to evaluate plant growth (Ma et al., 2022). Factors affecting NPP include temperature, precipitation, solar radiation, human activities and regional vegetation types (Tu et al., 2023; Xu et al., 2023). Surface O3 is mostly a secondary pollutant generated from nitrogen oxides (NOx) and volatile organic compounds (VOCs) as precursors (Feng et al., 2018). When excessive O3 enters plant cells, it causes damage or death of plant cells, and affects plant photosynthesis and respiration, thus affecting the NPP of terrestrial ecosystems (Feng et al., 2018). With the rapid economic development of China in recent years, the emission of NOx and VOCs from industries has increased, and O3 pollution has become increasingly aggravated. Additionally, China has become one of the most serious countries in the world in terms of O3 pollution (Wang et al., 2008). According to the 2019 China Ecological Environment Bulletin, China’s air quality improved greatly during the 13th Five-Year Plan period, with the concentration of the atmospheric pollutant PM2.5 and other indicators decreasing. However, research (Zeng et al., 2019) showed that O3 concentrations have been on a continuous upward trend from 2013–2017 and have become the primary atmospheric pollutant. It was (Ren and tian., 2007) predicted that 50% of forest ecosystems on land will be exposed to high O3 concentrations (>60 ppb) by 2,100, and forest productivity will be greatly affected. However, there are fewer domestic studies on the long-term effects of O3 on ecosystems due to the difficulty of observations and experiments (Ren and tian., 2007). Among foreign studies, Shimzu et al. (2019) selected the Kanto region of Japan as the study area, constructed AOT40-NPP response relationships for different ecosystems, and assessed the effects of O3 on NPP of vegetation such as evergreen coniferous forests in 2013. However, most domestic studies have focused on the effects of temperature and precipitation on NPP, such as Pan et al. (2015) studied the effects of climate change and extreme climate on global NPP in the first decade of the 21st century. Liu et al. (2018) studied the spatial pattern of grassland NPP and its relationship with hydro-thermal factors in China from 1993 to 2015. Some scholars have also conducted studies on the effects of O3 on NPP (Ren and tian., 2007), who explored the effects of O3 on the main processes of photosynthesis, allocation, growth and yield formation of terrestrial ecosystem productivity and its long-term effects on the whole ecosystem. In summary, it is necessary to study the effects of O3 pollution on terrestrial ecosystem productivity in depth, but there is a lack of quantitative research on the effects of O3 on NPP and a lack of research on O3 pollution at the ecosystem level in China (Feng et al., 2019).
The effects of O3 on plants are usually studied by controlled experiments using Open-Top Chamber (OTC) experiments or Free Air Control Enrichment (FACE) experiments, and the construction of response relationships helps to quantify the effects of O3 on plants and to assess the effects of O3 on plants over a large area. Most of the existing studies in China have constructed response relationships based on OTCS and O3-FACE mainly for major crop yields in China (Feng et al., 2020; Feng and peng, 2021), including winter wheat (Chen et al., 2011; Feng et al., 2011), rice (Pang et al., 2009; Shi et al., 2009; Luo et al., 2012), soybean (Yang et al., 2010), maize, oilseed rape (Bai et al., 2003; Feng et al., 2006), and spinach (Bai et al., 2004). Methods based on OTCS and O3-FACE controlled experiments can study response relationships more precisely, but they can only be based on a limited area, and their observation time is short, which is not conducive to the macroscopic assessments of ecosystems. In addition the quantitative study of the impact of O3 on terrestrial ecosystems NPP is lacking in China. The studies on O3 pollution effects were mostly focused on the more serious O3 pollution regions such as Beijing-Tianjin-Hebei, Yangtze River Delta, and Pearl River Delta (Feng et al., 2020). But the limited number of stations is not conducive to the study at the ecosystem level. In summary, more complete data and new methods are needed to study the effect of O3 on the NPP of ecosystems.
Remote sensing is a detection technology that emerged in the 1960s, which is based on the theory of electromagnetic waves, applying various sensors to collect, process, and finally image the electromagnetic wave information radiated and reflected by distant targets, so as to detect and identify various scenes on the ground. It has the advantage of efficiently collecting data over a large area. Based on the remote sensing information such as temperature, precipitation, and vegetation obtained from the MODIS sensor carried on the satellite, MOD17A3H NPP data were simulated using a productivity model, which has reliable simulation accuracy and can be inverted to obtain a nationwide NPP. The effects of O3 on natural ecosystems have been studied mainly by observing O3 concentrations and O3 fluxes on terrestrial ecosystems and a series of O3 concentration and flux assessment indicators, such as the dose response indicator AOT40, have been proposed. By constructing the response relationships between AOT40 and NPP, the impact assessment can be extended to a large regional scale.
Therefore, based on the latest release of ambient air quality site data, we use a new data processing method to produce a ground-based site observation O3 concentration dataset with increased temporal resolution to hourly and spatial coverage across China. By combining multi-year (2014–2019) MOD17A3H NPP data with the O3 concentration dataset, we aim to explore a method to establish the AOT40-NPP response relationships for evergreen broad-leaved forests, evergreen coniferous forests, grassland, and farmland ecosystems in China. We also apply this response relationships to assess the impact of O3 on the NPP of terrestrial ecosystems in China, thus attempting to quantify the impact. The methods used to construct the AOT40-NPP response relationships in this paper include: 1) using the Mann-Kendall mutation test to test for the presence of change mutation points. 2) Based on the idea of Jarvis multiplicative model, we proposed two constraints so as to isolate the signal data that can highlight the influence as the sample data for calculating the response relationships. 3) We selected the corresponding sample data to calculate the AOT40-NPP response relationships and their normalized slopes for evergreen coniferous forests, evergreen broad-leaved forests, farmland, and grassland ecosystems. 4) We apply the established response relationships to 2014 to assess the impact of O3 on terrestrial ecosystem NPP.
Section 2 introduces the study area, the spatial distribution of the four ecosystem types, small study areas according to climate zones and the spatial distribution of the ground-based observation sites for O3 concentration. The original data and data processing methods used are also introduced, including: O3 ground observation site data, MODI7A3H NPP data, and ecosystem classification data. Among them, the data cleaning methods used are described in detail. In addition, the monthly and annual cumulative values of AOT40 in the whole country and different ecosystem types were calculated. Section 3 presents the specific methods and steps to construct the AOT40-NPP response relationships. Section 4 shows the spatial and temporal distribution characteristics and multi-year change rates of the annual average AOT40 and NPP values for the whole country and different ecosystem types from 2014 to 2019, the correlation between the annual average AOT40 and NPP values, the constructed AOT40-NPP response relationships for the four major ecosystems, and the spatial distribution of the percentage of O3-induced NPP decline. Section 5 discusses the results of this study. Section 6 presents the conclusions.
Remote sensing observation has the advantage of collecting large area data efficiently. Therefore, We combines MODIS data to expand the research area to the whole China, and studies the four ecosystems of evergreen coniferous forests, evergreen broad-leaved forests, farmland and grassland. Differences in temperature and precipitation in different regions will affect the NPP differently. In order to reduce the interference of climatic factors in the study, the whole Chinese region was divided into some small study regions based on climatic zones, namely,: I: North Temperate Zone, II: Middle Temperate Zone, III: South Temperate Zone, IV: North Subtropics, V: Middle Subtropics, VI: South Subtropics, VII: North Subtropics, VIII: Middle Tropics, H: Plateau Climate Zone. Figure 1 shows that farmland ecosystems are found mainly in III, parts of the II and the northernmost parts of IV, grassland ecosystems are found mainly in II and H, evergreen coniferous and evergreen broad-leaved forests are found mainly in V, VI, VII, and deciduous coniferous forests are found mainly in I.
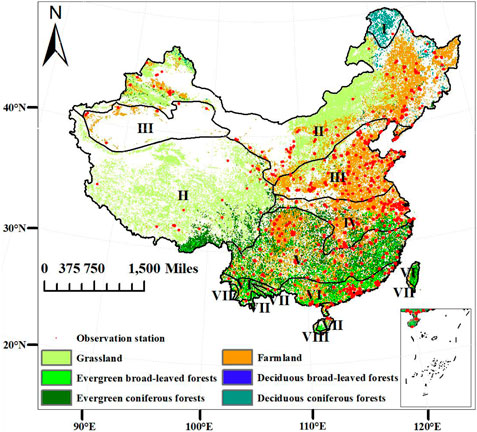
FIGURE 1. Spatial coverage map of six major ecosystem types (from China Cover 2010) and spatial distribution map of O3 ground observation stations in China, 2010 (from the China Air Quality Real-time Publishing Platform of China Environmental Monitoring Station, http://www.cnemc.cn/sssj/), Climate zoning data (from Resource and Enviroment Science and Data Center, https://www.resdc.cn/Datalist1. aspx?FieldTyepID=4,5).
The MODIS NPP data used in this paper is derived from the United States Geological Survey (LP DAAC - MOD17A3H (usgs.gov)). The time series is from 2014 to 2019, the spatial resolution is 500 m, the time resolution is 1 year, and the spatial coordinate system is WGS-1984 coordinate system (Liu et al., 2018). Remote sensing technology has the advantage of collecting large area data efficiently, which is suitable for constructing response relationships.
Based on the original data, we carried out the following processing in turn: extracting China‘s regional data, removing non-vegetation data, adjusting the spatial resolution to 10 km, calculating the true value of NPP and unit conversion. Finally, we get the true value of NPP, whose unit is gC/m2/yr.
The original O3 concentration data used in this paper comes from the China Air Quality Real-time Publishing Platform of China Environmental Monitoring Station (http://www.cnemc.cn/sssj/). There are about 1521 O3 monitoring stations distributed in the whole country. The time series is from 2014 to 2019, the time resolution is 1h, and the unit is ug/m3. The specific information of the data is shown in Table 1.
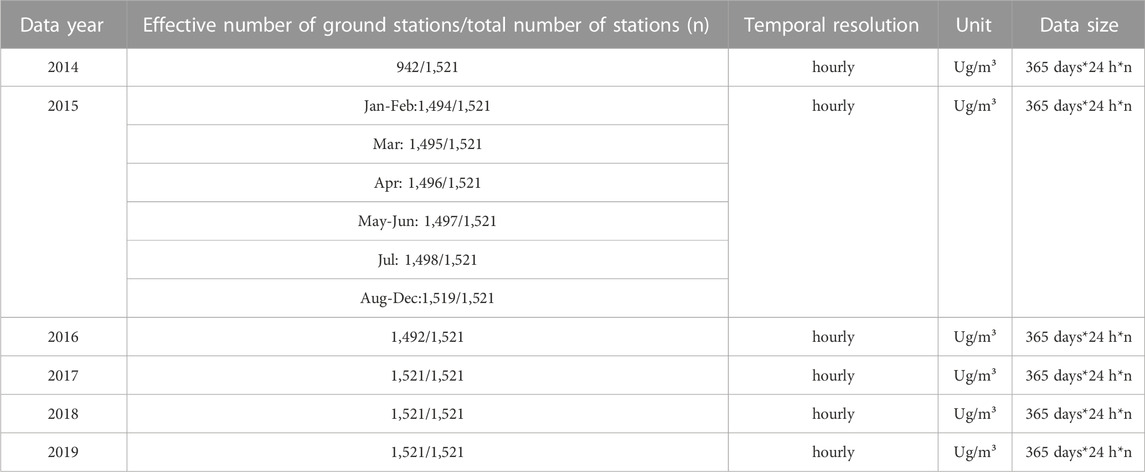
TABLE 1. O3 concentration data of ground observation stations.
The hourly O3 concentration observation data were recorded at 1,521 stations across the country, and the invalid data included two categories: One is that some stations are invalid due to equipment damage and other reasons, and the observed data at all times are invalid values; the other is that some sites have default values in time series due to instrument damage and other reasons in some time periods, including “ _ ”, “ −99”or “ NAN ” values.
O3 concentration data are usually derived from ground observation, remote sensing monitoring, model simulation, etc. With the significant increase in the number of ambient air quality sites in recent years, the new O3 concentration data provides data support for research work. Therefore, based on the newly released O3 ground observation station data, we obtains a data set closer to the real O3 concentration on the surface. It has a spatial resolution of 10 km and a temporal resolution of 1h, and covers the whole China region spatially with a time series of 2014–2019. The data processing method is mainly divided into two parts: O3 concentration data cleaning and China regional spatial interpolation.
The main purpose of data cleaning is to replace the default values. Due to the obvious monthly and daily variation of O3 concentration, O3 pollution is mainly concentrated in June and July in summer, spring and autumn come in second place, and basically no pollution in winter (Zhang et al., 2022). In the diurnal variation, the O3 concentration usually reaches a low value at 6 : 00–7 : 00, then the concentration rises rapidly, the concentration reaches a peak around 14 : 00–15 : 00, and then begins to decline until the next morning. The O3 concentration remained at a low value at night (Wang et al., 2017; Lin et al., 2022; Zhang et al., 2022). Therefore, spatial coordinate matching is first performed on the original input data. Secondly, the original data is cleaned, as shown in Figure 2. The O3 concentration data of each hour are judged as normal value or default value, and the original observation data are retained when judged as normal value; when it is judged to be the default value, the O3 concentration at the site and time of the default value is estimated and replaced. The estimation of the default data is achieved by calculating the monthly scale mean and the weekly scale mean for each hour. The monthly scale mean refers to the arithmetic mean of the daily evaluation concentration in a calendar month, and the weekly scale mean refers to the arithmetic mean of the daily evaluation concentration in a calendar week. If the monthly scale mean is 0, representing that the current site has no valid data in this month‘s measurement, the current invalid site is deleted directly. If the monthly mean is not 0, the weekly mean continues to be calculated. Finally, the monthly and weekly mean values of surface O3 concentration data from 2014 to 2019 were obtained. For the replacement process of the default value, the first step is to determine whether the observation value at the current time of the current site is valid data. If it is a default value, it is replaced in order of priority according to the weekly mean and monthly mean.
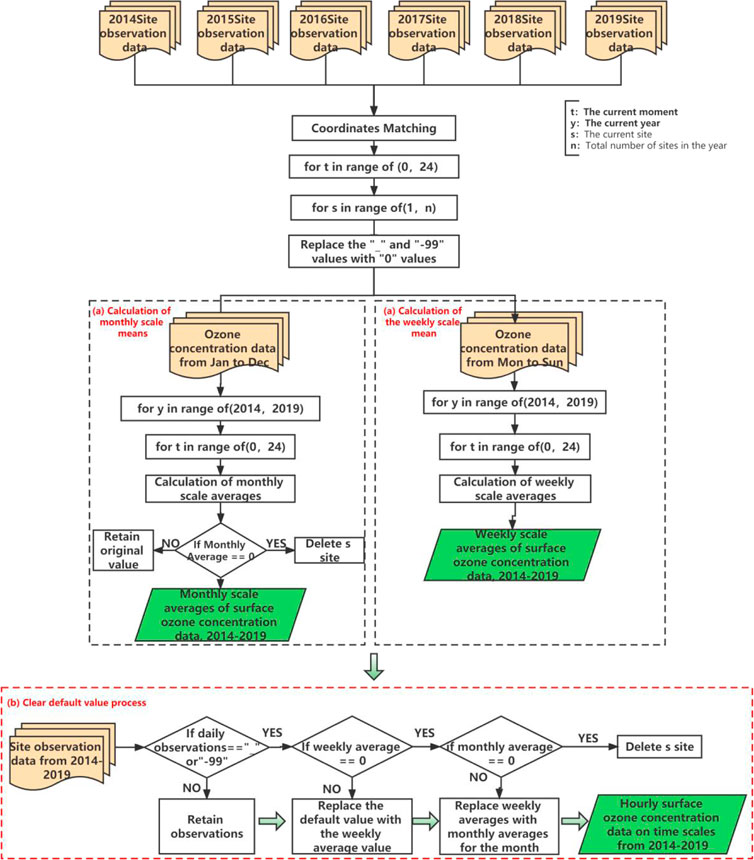
FIGURE 2. Process of surface observation O3 concentration data cleaning algorithm.
ArcGIS 10.6 software was used for spatial interpolation. The inverse distance interpolation method was selected, in which the number of adjacent points was 20 and the power was 2, so as to obtain the hourly O3 concentration data set with full coverage in China.
A series of evaluation indicators of O3 concentration and flux are proposed (Feng et al., 2020). Including evaluation indicators based on O3 concentration, O3 dose and O3 flux. The dose refers to the accumulation of O3 concentration in a plant growth period, which is calculated by assigning different weights to O3 concentration per hour, such as SUM06, W126, AOT40 (Feng and Peng, 2021). Such indicators take into account O3 concentration, exposure time and plant tolerance to O3 concentration, and are relatively simple to calculate. The AOT40 index is widely used, which is the accumulation of the difference between the hourly concentration of O3 above 40 nL L-1 and 40 nL L-1. In this paper, the effect of O3 on NPP of terrestrial ecosystems was studied by AOT40 index. The calculation formula is as follows:
where
The original data of ecological system classification used comes from China Cover 2010 data (https://kns.cnki.net/kcms2/article/abstract?v=3uoqIhG8C44YLTlOAiTRKibYlV5Vjs7ir5D84hng_y4D11vwp0rrta3RDv2Tx3hkXc19TbqMxdjxDMZ09MZGlf8qtkDSEgjR&uniplatform=NZKPT), The spatial resolution was adjusted to 10 km to keep consistent with the annual AOT40, and then the data of evergreen coniferous forests, evergreen broad-leaved forests, farmland and grassland ecosystems were extracted.
In previous studies, the relationship between the factors affecting NPP and the response of NPP was usually assumed to have a linear influence (Peng et al., 2022; Wang et al., 2020; Shimizu et al., 2019). This paper attempts to establish linear response relationships between AOT40 and NPP. The formula is as follows:
where
where
Jarvis (Jarvis et al., 1976) estimated the leaf - level water vapor stomatal conductance using a multiplicative model. Yo Shimizu et al. applied this method of determining the limit function in the Jarvis model to estimate the AOT40-induced NPP decline. They believe that the top point of the scatter plot with annual AOT40 as the X-axis and annual NPP as the Y-axis represents the optimal regional data for all environments such as temperature, humidity, solar light intensity, and soil moisture at the corresponding AOT40 level. Therefore, the change of the top point reflects the relationship between NPP change and AOT40 increase to some extent (Shimizu et al., 2019).
The traditional AOT40 is calculated over a six-month period, which covers the period from April to September when most plants grow. In order to unify with the time resolution of MODIS NPP, we calculated the annual AOT40 value. The scatter plot of AOT40-NPP was drawn for each ecosystem type, where the X-axis is the annual AOT40 value and the Y-axis is the annual NPP value. In order to reduce the impact of interannual variation of O3 pollution, the X-axis was adjusted to the 6-year AOT40 average.
It can be clearly seen from the scatter diagram, whether it is from the overall trend of 6-year data or the trend of every 1-year data, when the AOT40 value of the year increases to a certain extent, the annual NPP value of the top point tends to decrease continuously and stably with the increase of the annual AOT40 value. It is considered that “continuous and stable downward trend ” indicates that the effect of AOT40 on NPP begins to highlight at this time. We attempts to separate the signal data showing “continuous and stable downward trend” by a certain method, and establish response relationships to quantify the relationship between AOT40 and NPP. The AOT40 value corresponding to the onset of a “continuous and stable downward trend” is called the annual AOT40 threshold.
Due to the need to extract the signal data after the annual AOT40 threshold, it is necessary to first obtain the annual AOT40 threshold of different ecosystems. Firstly, all pixel points of evergreen coniferous forests were extracted. Secondly, the scatter points (top points) with NPP value above 80% quantile were extracted as sample data A. For the sample data A, the scatter plot is drawn, the Y-axis is set as the annual NPP value, and the X-axis is adjusted to the annual average of AOT40 of 6 years to reduce the influence of AOT40 interannual variation, and the average is divided into 10 intervals. The average value of the annual NPP value in each interval is calculated to represent the overall data characteristics of the top point NPP in the AOT40 interval, and the midpoint value of the AOT40 interval is taken as the X value to draw 10 scatter points. Mann-Kendall mutation test method was used to test the signal mutation point. This method has no requirement for the distribution of samples and is less disturbed by a few outliers, so the results are reliable. In this paper, the Mann-Kendall mutation test is implemented by Python programming. The calculation formula is as follows:
where,
Specifies
After determining the signal mutation point, this paper proposes two constraints to separate the signal data that can reflect the response relationships between AOT40 and NPP, which are.
1) the annual AOT40 value needs to exceed the annual AOT40 threshold of the corresponding ecosystem type;
2) Scatter from 1) for NPP values greater than 80% of the quantile points.
Firstly, the regional scatter points of annual AOT40 exceeding annual AOT40 threshold are extracted as sample data B, and then the scatter points of NPP value exceeding 80% quantile points in sample data B are extracted as sample data C to solve the slope of response relationship. The scatter plot is drawn for the extracted sample data C, and the X-axis is divided into 10 intervals on average. The average NPP value of each interval is calculated as the y value, and the midpoint value of the AOT40 interval is taken as the x value to obtain 10 scatter points. Then a linear regression fitting is performed to obtain the fitting line slope
The
For each type of ecosystem, the area where the annual AOT40 value reaches the corresponding ecosystem annual AOT40 threshold is selected as the evaluation area. Based on the established response relationships, the percentage of O3-induced NPP decline in this part of the region was calculated. The formula is as follows:
The response relationship was then applied to the 2014 annual AOT40 image to obtain the NPP reduction percentage of each ecosystem type, as shown in Figure 7.
In this paper, the trend analysis method is used to analyze the trend of annual AOT40 mean and annual NPP mean in China from 2014 to 2019, so as to obtain the change rate of AOT40 and NPP. The calculation formula is as follows:
where
The O3 concentration dataset obtained by data cleaning and spatial interpolation in this paper has a spatial resolution of 10 km and a temporal resolution including 1 h, 1 day, 1 month and 1 year. The spatial coverage is the China region and the time series is 2014–2019. This dataset removes and replaces default values to improve data availability and extends point data only located at observation locations to regional data at the Chinese scale. Figure 3 shows the spatial distribution of annual AOT40 (A-G), annual AOT40 trends H) and the climatic zoning map I) within the Chinese region from 2014–2019. As shown in Figure 3, the highest value of national annual AOT40 mainly occurs in Beijing, Tianjin and Hebei, Shanxi, Shandong, Henan and the northern regions of Jiangsu and Anhui in the Southern Temperate Zone, where the annual AOT40 values are higher than 20,000 ppbh/yr. The second highest annual AOT40 values are found in the Inner Mongolian Plateau in the Middle Temperate Zone and in the southern regions of Jiangsu and Anhui in the Southern Temperate Zone, with annual AOT40 values above 14,000 ppbh/yr. The annual AOT40 values in all other regions are relatively low, below 17,500 ppbh/yr.
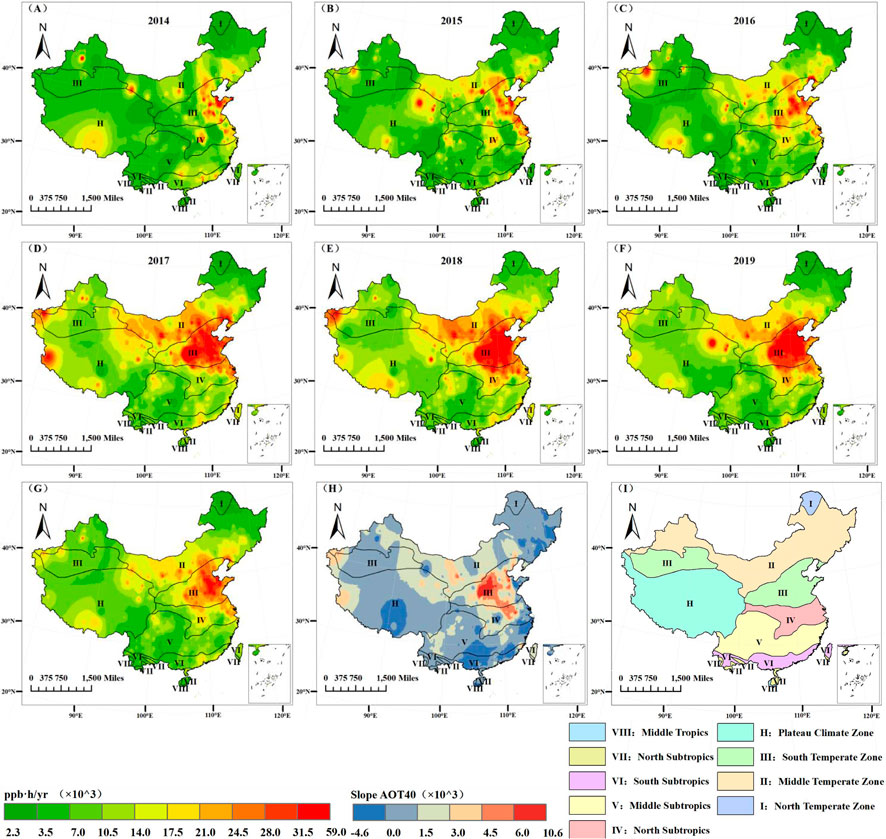
FIGURE 3. Spatial distribution of annual AOT40 (A–G), annual change rate of AOT40 (H) and Climate zone map (I), 2014 to 2019. A slope greater than 0 indicates an upward trend in annual AOT40 values in (H).
The annual AOT40 values during 2017–2019 were generally higher relative to those during 2014–2016, indicating that the O3 pollution became more serious. During 2014–2015, AOT40 in the Inner Mongolia Plateau region had significantly increased. During 2016–2017, AOT40 in the Inner Mongolia Plateau region, the Middle Temperate Zone region, Jiangsu and the southern part of Anhui Province had significantly increased, indicating a significant deterioration of O3 pollution.
From (H), it can be seen that the annual AOT40 value has been on an increasing trend for six years. Among them, the most significant increase was observed in the Southern Temperate Zone, including the south-central Shanxi province (annual growth rate >6,000), southern Hebei, northern Henan, and some parts of Anhui (annual growth rate >3,000). The second most pronounced increase is found in the Middle Temperate Zone, including the Inner Mongolia Autonomous Region, Gansu and a few other areas of the North China Plain, and the Guangxi Zhuang Autonomous Region (annual growth rate >1,500). However, a few areas in Guangdong, Fujian and the Tibet Autonomous Region located in the subtropics show a decreasing trend (slope <0).
The above results indicate that O3 pollution is most serious in the Southern Temperate Zone and the Inner Mongolia Plateau region located in the Middle Temperate Zone nationwide during 2014–2019, and their O3 pollution intensification is most pronounced.
Figure 4 shows the temporal variation of monthly AOT40 for different ecosystems from 2014 to 2019. Farmland and Grassland ecosystems are located in areas with the highest monthly AOT40, largely remaining around 2,000 ppbh/yr. Evergreen coniferous and Evergreen broad-leaved forests have the second highest monthly AOT40, remaining around 1,000–2,000 ppbh/yr. Deciduous coniferous forests had the lowest monthly AOT40, remaining below 1,000 ppbh/yr most of the time. The appeal results indicate that O3 pollution is most severe in areas of Grassland and Farmland ecosystems. Areas where Evergreen coniferous and Evergreen broad-leaved forests are located have the second worst O3 pollution. Areas where deciduous coniferous forests are located have no serious O3 pollution. The inter-month variation in China’s AOT40 values from 2014 to 2019 is very consistent with the inter-month variation in the regions where Farmland and Grassland ecosystems are located. Moreover, O3 pollution has a clear seasonal effect, being most severe in summer and autumn, but less severe in spring and winter. Seasonal effects are most pronounced in Grassland and Farmland, second most pronounced in Evergreen coniferous and Deciduous coniferous forests, and less pronounced in Evergreen broad-leaved forests.
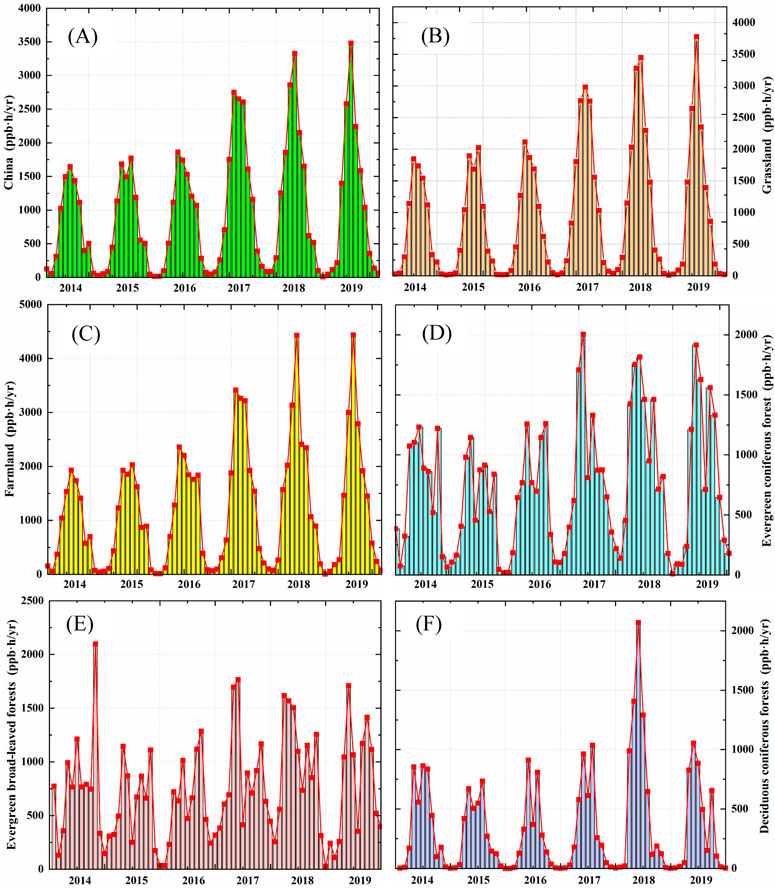
FIGURE 4. Monthly AOT40 spatial distribution, 2014–2019, (A–F) are China, Grassland, Farmland, Evergreen coniferous forests, Evergreen broad-leaved forests, Deciduous coniferous forests.
From Figure 5, we can see that China’s annual NPP values are higher in the east and south than in the west and north. Among them, Evergreen coniferous and Evergreen broad-leaved forests in subtropical regions have the highest annual NPP values, which range from 350–1,500 gC/m2/yr; Farmland, Grassland and Deciduous coniferous forests have lower annual NPP values, which range from 350–700 gC/m2/yr. The annual NPP values of Farmland and Deciduous coniferous forests located in the Southern Temperate Zone showed a clear downward trend during 2014–2015. The annual NPP values of Farmland located in the Subtropical Zone showed a clear downward trend during 2015–2016 and 2018–2019. The annual NPP values of other ecosystems did not change significantly. From H), it can be seen that annual NPP values in some areas of farmland, Deciduous coniferous forests and Grassland show a decreasing trend. The annual NPP of Evergreen coniferous and Evergreen broad-leaved forests showed an increasing trend in most regions and a decreasing trend in a few regions.
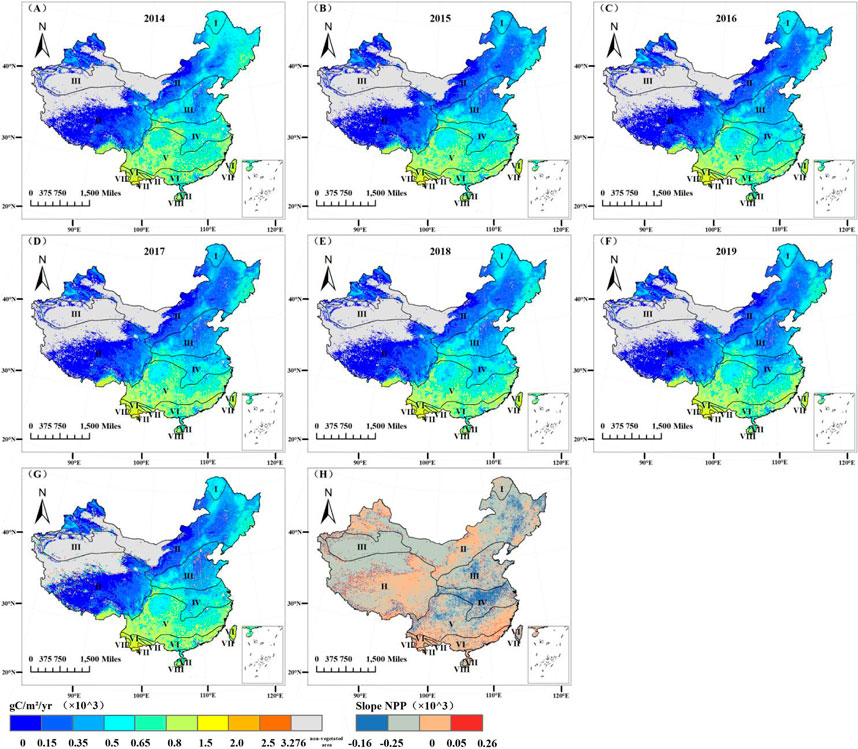
FIGURE 5. Spatial distribution of annual average NPP (A–G) and annual change rate of NPP (H) in China from 2014 to 2019.
The above results indicate that there is a significant downward trend in the annual NPP values of Farmland, Deciduous coniferous forests and some areas of Grassland. However, there is no significant downward trend in either Evergreen coniferous or Evergreen broad-leaved forests during the period 2014–2019.
For the different ecosystem types, correlation coefficients and p-value between AOT40 and NPP were calculated for 2014–2019 using all scatter points within that ecosystem region, as shown in Table 2. The 2014–2019 annual average AOT40 and annual average NPP from the national scale and for each ecosystem other than Evergreen broad-leaved forests showed a non-significant negative correlation. Therefore, we needed to select the signal data to establish the response relationships.
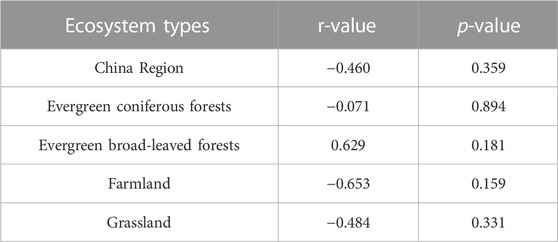
TABLE 2. Correlation between AOT40 and NPP for each ecosystem, 2014–2019.
AOT40 thresholds were obtained for Evergreen coniferous forests, Evergreen broad-leaved forests, Farmland and Grassland ecosystems based on the Mann-Kendall mutation point detection method. As shown in Table 3, the signal data were then extracted according to the constraints and we obtained the a-values, b-values and normalised slopes of the regression lines for each of the four ecosystems. When a<0, it means that NPP is negatively correlated with AOT40.
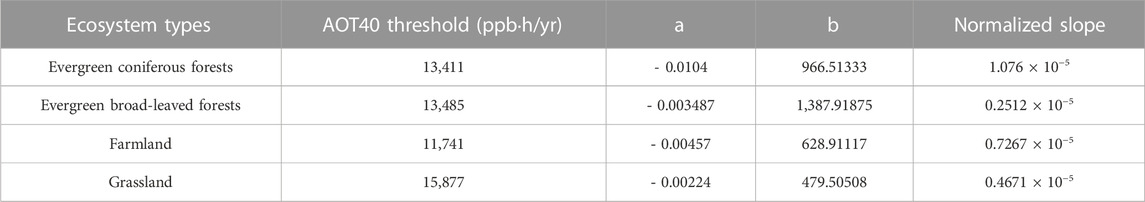
TABLE 3. AOT40 thresholds, a, b and normalized slopes for each ecosystem.
The scatter plots of the signal data separated from the four types of ecosystems are shown in Figure 6, and the response relationships are as follows:
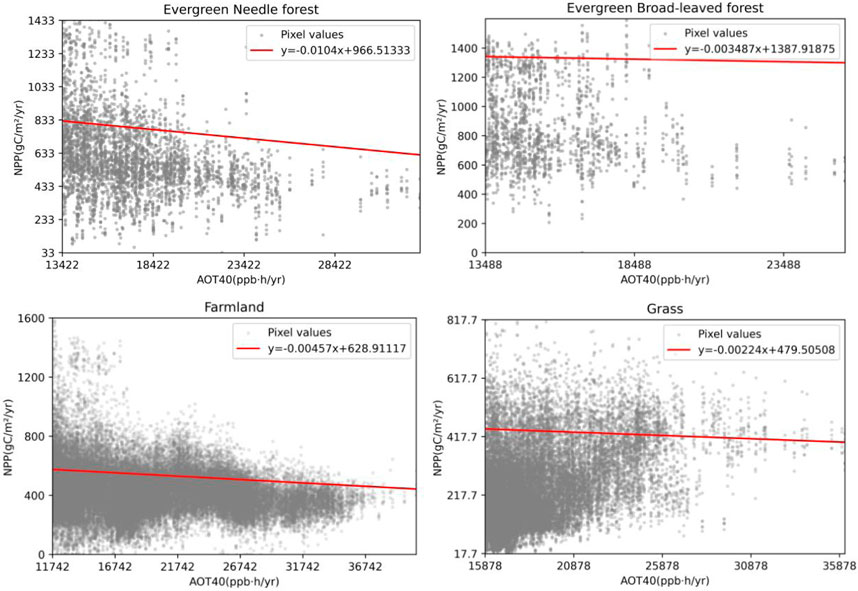
FIGURE 6. 6-year scatter plot and response relationships fitted line of annual NPP and annual AOT40 of four ecosystems.
Figure 7 shows the spatial distribution of NPP decline induced by O3 in 2014. In China, the estimated O3-induced NPP decline ranged from 5% to 35%. Among them, the decline rate of Farmland ecosystem was the most significant (in range of 5%–35%), and most of the decline rate was 10%–25%. The decline rate of Evergreen coniferous forests was the second (in range of 10%–25%), mostly between 15% and 20%. The decline rate of Grassland ecosystem is low (in range of 5%–20%), most of which is between 5% and 15%. The Evergreen broad-leaved forests have the lowest decline rate (in range of 0%–10%), mostly between 0% and 5%. The regions with the highest percentage of NPP decline induced by O3 in various ecosystem types are mainly Beijing-Tianjin-Hebei and Shandong. The decline rate of Farmland ecosystem in the study area was significantly higher than other ecosystem types.
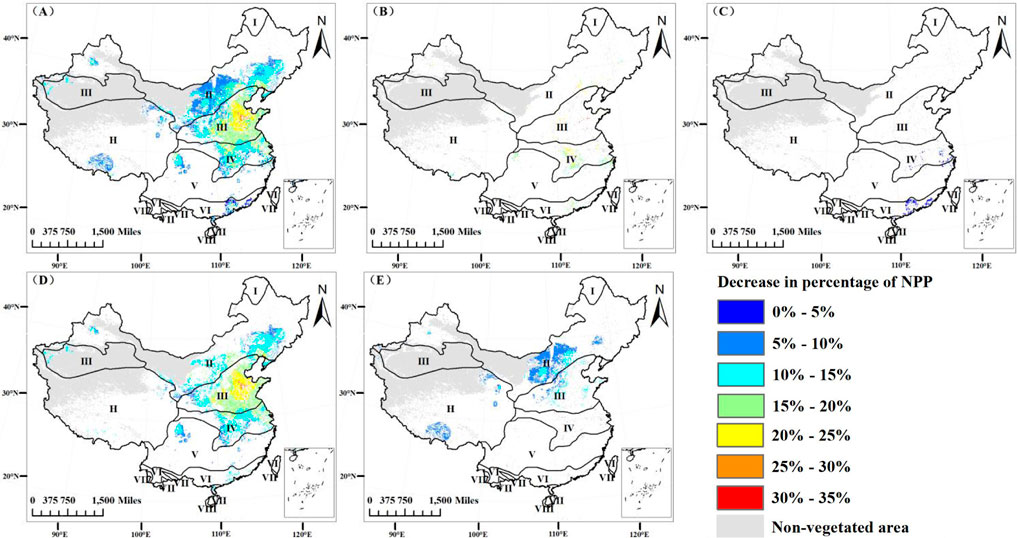
FIGURE 7. Spatial distribution of the percentage of NPP decline induced by O3 in the four major terrestrial ecosystems in China, (A) reflects the overall situation of the percentage of NPP decline induced by O3 in the four major ecosystems, (B–E) reflects the effects of O3 on the NPP of Evergreen coniferous forest, Evergreen broad-leaved forest, Farmland and Grassland.
Remote sensing is a detection technique that emerged in the 1960s and has the advantage of obtaining data with wide coverage and a long time span, which also facilitates the expansion of the spatial and temporal span of O3 impacts on vegetation, thus facilitating the quantification of O3 impacts on vegetation at the ecosystem level. Remote sensing also allows for fast and efficient acquisition of images and corresponding data, thus providing data to support studies at smaller time scales, such as hourly.
The MODIS NPP data used in this paper is derived from the NASA Earth Observing System and is simulated by the Light Energy Utilisation Model. The NDVI data obtained from MODIS for the inversion of NPP is affected by the sensitivity of the satellite sensors, cloud cover, satellite orbit, etc. Therefore, the MODIS data needs to be denoised at first. Although this process can improve the quality of the data, there are inevitable limitations in the denoising algorithm, which affects the accuracy of the inverse NPP data. Secondly, we, like previous researchers, assumed the AOT40-NPP correlation to be a linear response relationship, and thus fitted their response relationship a linear relationship. However, the AOT40-NPP correlation may be better described by a non-linear correlation, which is one of the directions to be further investigated. Finally, the spatial interpolation method used in this paper is ArcGIS’s distance interpolation method, which inevitably has its own corresponding errors.
Based on the idea of Jarvis multiplication model, this paper proposes a method of constructing AOT40-NPP response relationships based on remote sensing technology combined with MOD17A3H NPP data, and applies the response relationship to evaluate the impact rate of O3 on NPP in 2014. The results show that the established response relationship between Farmland and Grassland ecosystems has the highest correlation coefficients and strong significance, so the results are statistically significant. The percentage of NPP reduction induced by O3 in 2014 was in the range of 5%–35%. Among them, the decline rate of Farmland ecosystem is the most significant, mostly between 10% and 35%. The decline rate of evergreen coniferous forest is the second, mostly between 15% and 20%. The decline rate of Grassland ecosystem is low, mostly between 5% and 15%. The decline rate of Evergreen broad-leaved forests is the lowest, mostly between 0% and 5%. In addition, we have produced the O3 concentrations dataset of ground-based observations over the Chinese region.
The prospects of the research work are as follows: 1) The limitation of the spatial resolution (10 km) of the O3 concentration dataset used in this paper leads to the possibility of mixing other types of vegetation within the same image element. Therefore, in the subsequent study, the spatial resolution of AOT40 spatially interpolated images and remote sensing images can be improved to analyze the effect of O3 on NPP of specific species more precisely. 2) Since NPP is greatly influenced by environmental factors such as temperature and precipitation, in the subsequent study, the same ecosystem can be further divided into different regions according to the different climate zones they are located in, and the AOT40-NPP response relationships can be constructed separately for different climate zones to obtain more accurate assessment results.
The original contributions presented in the study are included in the article/supplementary material, further inquiries can be directed to the corresponding author.
ZW and MH conceptualized this study. LH and ZW performed the analysis and wrote the paper. MH, HS, and QW contributed to reviewing and polishing the manuscript. All co-authors commented on and reviewed this manuscript. MH raised funds to support this study.
This research was supported by the National Natural Science Foundation of China (grant 41971135 and 41801082), and the Research program on the flora of Yunnan Province, the Sustainable Utilization of Vegetation Resources in Yunnan.
We thank the reviewers and the senior editor for their comments and suggestions, which helped improve the manuscript.
The authors declare that the research was conducted in the absence of any commercial or financial relationships that could be construed as a potential conflict of interest.
All claims expressed in this article are solely those of the authors and do not necessarily represent those of their affiliated organizations, or those of the publisher, the editors and the reviewers. Any product that may be evaluated in this article, or claim that may be made by its manufacturer, is not guaranteed or endorsed by the publisher.
Bai, Y. M., Wang, C., Guo, J. P., and Wen, M. (2003). Experimental study on Rapeseed yield response to ozone stress. J. Agro-Environment Sci. 3, 279–282.
Bai, Y. M., Wang, C. Y., Wen, M., and Guo, J. P. (2004). Influences of different ozone concentrations and fumigation days on spinach growth and yield. Sci. Agric. Sin. 12, 1971–1975.
Chen, J., Zeng, Q., Zhu, J. G., Liu, G., Cao, J. L., Xie, Z. B., et al. (2011). Nitrogen supply mitigates the effects of elevated [O3] on photosynthesis and yield in wheat. Chin. J. Plant Ecol. 35 (05), 523–530. doi:10.3724/sp.j.1258.2011.00523
Feng, Z., De Marco, A., Anav, A., Gualtieri, M., Sicard, P., Tian, H., et al. (2019). Economic losses due to ozone impacts on human health, forest productivity and crop yield across China. Environ. Int. 131, 104966. doi:10.1016/j.envint.2019.104966
Feng, Z., Pang, J., Kobayashi, K., Zhu, J., and Ort, D. R. (2011). Differential responses in two varieties of winter wheat to elevated ozone concentration under fully open-air field conditions. Glob. Change Biol. 17 (1), 580–591. doi:10.1111/j.1365-2486.2010.02184.x
Feng, Z., and Peng, J. (2021). Relationship between relative crop yield/woody plant biomass and groundlevel ozone pollution in China. Environ. Sci., 42(6): 3084–3090. doi:10.13227/j.hjkx.202009226
Feng, Z., Yuan, X., Li, P., Shang, B., Ping, Q., Hu, Y., et al. (2020). Progress in the effects of elevated ground-level ozone on terrestrial ecosystems. Chin. J. Plant Ecol. 05, 526–542. doi:10.17521/cjpe.2019.0144
Feng, Z. Z., Li, P., Yuan, X. Y., Gao, F., Jiang, L., and Dai, L. (2018). Progress in ecological and environmental effects of ground-level O3 in China. Acta Ecol. Sin. 38 (5), 1530–1541. doi:10.5846/stxb201704100618
Feng, Z. Z., Wang, X. K., Zheng, Q. W., Feng, Z. W., Xie, J. Q., and Chen, Z. (2006). Response of gas exchange of rape to ozone concentration and exposure regime. Acta Ecol. Sin. 26 (03), 823–829. doi:10.1016/s1872-2032(06)60014-0
Jarvis, P. G. (1976). The interpretation of the variations in leaf water potential and stomatal conductance found in canopies in the fieldPhil. Trans. R. Soc. Lond., B273593–610. doi:10.1098/rstb.1976.0035
Lin, W., and Guo, X. (2022). Analysis of the spatial and temporal distribution of ozone in urban clusters in China[J]. China Environ. Sci. 42 (06), 2481–2494. doi:10.19674/j.cnki.issn1000-6923.20220207.002
Liu, X., Zhao, J., Du, Z., and Zhang, H. (2018). Net primary productivity pattern of grassland in China and its relationship with hydrothermal factors during 1993-2015. Bull. Soil Water Conservation 01, 299–305+329. doi:10.13961/j.cnki.stbctb.2018.01.052
Luo, K., Zhu, J., Liu, G., Tang, H., Li, C., and Zeng, Q. (2012). Effects of elevated ozone on leaf photosynthesis of rice (Oryza sativa L.) and mitigation with high nitrogen supply. Ecol. Environ. Sci. 03, 481–488. doi:10.16258/j.cnki.1674-5906.2012.03.021
Ma, Z. X., Cui, H. J., and Ge, Q., S. (2022). Prediction of net primary productivity change pattern in China based on vegetation dynamic models. J. Geogr. 77 (07), 1821–1836. doi:10.11821/dlxb202207017
Pan, S., Tian, H., Dangal, S. R., Ouyang, Z., Lu, C., Yang, J., et al. (2015). Impacts of climate variability and extremes on global net primary production in the first decade of the 21st century. J. Geogr. Sci. 25 (9), 1027–1044. doi:10.1007/s11442-015-1217-4
Pang, J., Kobayashi, K., and Zhu, J. (2009). Yield and photosynthetic characteristics of flag leaves in Chinese rice (Oryza sativa L.) varieties subjected to free-air release of ozone. Agric. Ecosyst. Environ. 132 (3-4), 203–211. doi:10.1016/j.agee.2009.03.012
Ren, W., and Tian, H. Q. (2007). Ozone pollution and terrestrial ecosystem productivity. Chin. J. Plant Ecol. 31 (02), 219–230. doi:10.17521/cjpe.2007.0026
Shi, G., Yang, L., Wang, Y., Kobayashi, K., Zhu, J., et al. (2009). Impact of elevated ozone concentration on yield of four Chinese rice cultivars under fully open-air field conditions. Agric. Ecosyst. Environ. 131 (3-4), 178–184. doi:10.1016/j.agee.2009.01.009
Shimizu, Y., Lu, Y., Aono, M., and Omasa, K. (2019). A novel remote sensing-based method of ozone damage assessment effect on Net Primary Productivity of various vegetation types. Atmos. Environ. 217, 116947. doi:10.1016/j.atmosenv.2019.116947
Tu, H. Y., Jiapaer, G., Yu, T. X., and Chen, B. J. (2023). Analysis ofspatio-temporal variation characteristics and influencing factors of net primary productivity in terrestrial ecosystems of China. Acta Ecol. Sin. 43, 1. doi:10.5846/stxb202201230216
Wang, Q., Huang, M., Wang, Z., Wang, S., and Li, Y. (2008). Impact of ozone pollution on productivity and biomass of subtropical forests: A case study in dinghushan. Acta Ecol. Sin.
Wang, X. L., Zhao, W. J., Li, L. J., Yang, X. C., Jiang, J. F., and Sun, S. (2020). Characteristics of spatiotemporal distribution of O3 in China and impact analysis of socio-economic factors. Earth Environ. 1, 66–75. doi:10.14050/j.cnki.1672-9250.2020.48.006
Wang, Y. H., Shi, X. Z., Wang, M. Y., and Zhao, Y. C. (2017). Spatio-temporal variation of NPP in cropland ecosystem of China during the years from 2001 to 2010. Acta Pedol. Sin. 2, 319–330. doi:10.11766/trxb201604220153
Xu, Y., Huang, W. T., Zheng, Z. W., Dai, Q. Y., and Li, X. Y. (2023). Detecting influencing factor of vegetation NPP in southwest China based on spatial scale effect. Environ. Sci. 44, 900. doi:10.13227/j.hjkx.202203254
Yang, L., Wang, Y., Zhao, Y., Zhu, J., Sun, Y., and Wang, Y. (2010). Responses of soybean to free-air ozone concentration enrichment: A research review. Acta Ecol. Sin. 23, 6635–6645.
Zhang, X., Tao, S., Dong, S., and Xiao, X. (2022). Study on the characteristics and influencing factors of ozone pollution[J]. Environ. Sci. Manag. 47 (02), 47–50+66.
Keywords: ozone pollution, MODIS NPP, AOT40, net primary productivity, China
Citation: Hu L, Wang Z, Huang M, Sun H and Wang Q (2023) A remote sensing based method for assessing the impact of O3 on the net primary productivity of terrestrial ecosystems in China. Front. Environ. Sci. 11:1112874. doi: 10.3389/fenvs.2023.1112874
Received: 30 November 2022; Accepted: 28 March 2023;
Published: 26 April 2023.
Edited by:
Gen Zhang, Chinese Academy of Meteorological Sciences, ChinaReviewed by:
Zang Kunpeng, Zhejiang University of Technology, ChinaCopyright © 2023 Hu, Wang, Huang, Sun and Wang. This is an open-access article distributed under the terms of the Creative Commons Attribution License (CC BY). The use, distribution or reproduction in other forums is permitted, provided the original author(s) and the copyright owner(s) are credited and that the original publication in this journal is cited, in accordance with accepted academic practice. No use, distribution or reproduction is permitted which does not comply with these terms.
*Correspondence: Mei Huang, aHVhbmdtQGlnc25yci5hYy5jbg==
Disclaimer: All claims expressed in this article are solely those of the authors and do not necessarily represent those of their affiliated organizations, or those of the publisher, the editors and the reviewers. Any product that may be evaluated in this article or claim that may be made by its manufacturer is not guaranteed or endorsed by the publisher.
Research integrity at Frontiers
Learn more about the work of our research integrity team to safeguard the quality of each article we publish.