 Yi Li
Yi Li Xiaoli Liu
 Chaoyu Yuan3
94% of researchers rate our articles as excellent or good
Learn more about the work of our research integrity team to safeguard the quality of each article we publish.
Find out more
ORIGINAL RESEARCH article
Front. Environ. Sci., 03 February 2023
Sec. Environmental Informatics and Remote Sensing
Volume 11 - 2023 | https://doi.org/10.3389/fenvs.2023.1112266
This article is part of the Research TopicAdvances in Numerical Model, Data Assimilation, and Observations for Hazardous Weather PredictionView all 10 articles
The auto-conversion from cloud droplet to raindrop is a process whereby rain drops formed by collision-coalescence of cloud droplets. As an essential link connecting aerosol-cloud interaction, it significantly influences the changes in cloud morphology and precipitation. In order to explore the sensitivity of auto-conversion schemes to cloud condensation nuclei (CCN) concentration, using the auto-conversion scheme in the Thompson scheme (TH-AU) and Milbrandt-Yau scheme (MY-AU), we set four groups of CCN concentrations to simulate a strong convection process in Ningxia region of China. The results show that: The sensitivity of different auto-conversion schemes to changes in CCN concentrations varies significantly, and the aerosol-induced changes in precipitation and convection strongly depend on the auto-conversion scheme. With the increase of CCN concentration, the mixing ratio of cloud droplets increases, and the particle size decreases, resulting in a decrease in the auto-conversion intensity for the two schemes, which makes more supercooled water participate in the ice phase process. Compared with the TH-AU, the MY-AU has lower auto-conversion intensity at the same CCN concentration, the proportion of supercooled cloud droplets participating in the ice phase process is higher than that in the TH-AU, which leads to the raindrop mixing ratio of 4000–6000 m in MY-AU is lower than that in TH-AU at the same CCN concentration, and the mixing ratio of ice phase particles in MY-AU scheme is higher in the convective mature stage, especially snow and graupel particles, and the graupel particle generation height of MY-AU is lower than that of TH-AU. In terms of dynamic structure, with the increase of CCN concentration, more cloud droplets are activated and frozen which makes the enhancement of updraft mainly occur in the upper layer in both schemes, but the stronger gravitational drag caused by graupel particles in MY-AU may enhance the downdraft in the middle and lower layers, which makes the convection of MY-AU decay early at higher CCN concentration. In addition, changes in microphysical processes also lead to differences in cumulative precipitation and accumulated ground graupel-fall of the two schemes. The cumulative precipitation and the accumulated ground graupel-fall of the MY-AU decrease strongly with the increase of CCN concentration because the warm rain process of MY-AU is strongly inhibited. Compared with MY-AU, the warm rain process of TH-AU is not significantly inhibited, which leads to the cumulative precipitation and the accumulated ground graupel-fall of the TH-AU scheme increases when the CCN concentration is 50–200 cm−3 and slightly decreases when the CCN concentration is 200–10000 cm−3.
Cloud and precipitation development processes are a critical source of uncertainty in numerical simulations of meteorological and climatic conditions (Houghton, 2001; Li et al., 2016). As cloud condensation nuclei (CCN), aerosols can influence cloud microphysical processes and albedo by activating cloud droplets, which affects the development of cloud structure and lifetime (Rosenfeld, 2000). As social and economic development progresses, the effect of increasing anthropogenic aerosol on the weather becomes more pronounced (Rosenfeld et al., 2014). The increase in CCN concentration triggers an increase in cloud droplet number concentration, accompanied by a decrease in cloud droplet size (Köhler, 1936).
While initial cloud droplet changes due to increasing concentrations of CCN have been elucidated (Reutter et al., 2009; Twomey, 1977), many studies have shown that the subsequent responses of convective clouds to changes in CCN concentrations are complex and even contradictory (Khain et al., 2005; Barthlott and Hoose, 2018; Lim and Hong, 2010; Saleeby et al., 2016). CCN-induced reduction of cloud droplet size makes the cloud droplet collision-coalescence process less efficient, and the cloud to rain auto-conversion process is inhibited (Albrecht, 1989), which weakens the warm rain process and reduces surface precipitation (Wang, 2005; Marinescu et al., 2017; Kovačević, 2018; Lerach and Cotton, 2018).
However, there are contrasting findings of Alizadeh-Choobari and Gharaylou (2017), which found that at high CCN concentrations, a large number of small cloud droplets are more easily transported to the upper layers for freezing. Thus, the precipitation in the weak convective process was inhibited, while the precipitation in the strong convective process was enhanced. Besides, Gryspeerdt et al. (2014) also found, based on satellite observation, that aerosol optical thickness was positively correlated with spatial variability in precipitation or convective cloud formation. This effect’s magnitude varies depending on cloud, aerosol, concentration, and environmental conditions (Khain et al., 2008; Hande et al., 2017).
In addition, changes in microphysical processes caused by aerosols can also lead to changes in cloud convection structure. Seinfeld and Lebo, 2011 showed that the convective intensity of clouds with suppressed precipitation might be enhanced later in the process. Overall, the strength of updrafts in convective clouds appears to increase at higher concentrations of CCN (Khain et al., 2005; Wang, 2005). However, the reason for the enhanced updraft at higher CCN concentrations is also controversial.
Several studies suggest that the increase in updrafts of clouds at relatively high CCN concentrations is primarily due to the enhanced release of latent heat from cloud droplet condensation (Sheffield et al., 2015; Morrison et al., 2018). However, other studies suggest that the additional latent heat from the more substantial freezing process is the primary reason for the increase in updraft velocity (van den Heever, 2018; Andreae and Ronsenfeld, 2008). In contrast, other studies have found that updrafts of some deep convective clouds remain unchanged or weaken at higher concentrations of CCN (Fan et al., 2009; Lebo and Seinfeld 2011; Barthlott and Hoose 2018). This discrepancy has been attributed to differences in cloud types and weather conditions.
For the warm rain process mentioned above, cloud droplets are generated by the activation of aerosols and grow by condensation and collision coalescence. Auto-conversion is a microphysical process in which the collision-coalescence of cloud droplets forms raindrops. As an essential link connecting aerosol-precipitation interaction, cloud to rain auto-conversion significantly influences the changes in cloud morphology and precipitation caused by aerosols (Ghan et al., 2011; Lee et al., 2012; Tao et al., 2012; Xie and Liu, 2015). Rosenfeld, (2000) found that clouds with cloud-top heights higher than 10 km can produce only half as much precipitation as clouds that reach the same cloud-top height if collision-coalescence processes are suppressed. Precipitation is found sensitive to changes in CCN concentration in Xie and Liu (2015) by use of three auto-conversion schemes. Michibata and Takemura’s (2015) simulations reflect that cloud optical thickness and liquid-water path are highly sensitive to the auto-conversion parameterization scheme. In summary, there are significant differences in aerosol-induced changes in clouds and precipitation when using different auto-conversion parameterization schemes (White et al., 2017; Barthlott and Hoose, 2021).
Given the complexity of the dynamic and thermodynamic processes involved in the auto-conversion process, the knowledge of cloud microphysical processes limits the development of the auto-conversion parameterization. There are still many empirical values or assumptions in the model, which renders the simulation results reasonably sensitive to the setting of the microphysics schemes (van den Heever et al., 2021). So, there has been a great deal of interest in this territory over the last few decades (Khain et al., 2015; Morrison et al., 2020).
Kessler pioneered a simple scheme to calculate the auto-conversion rate by cloud water content (Kessler, 1969). However, Hu and Cai, (1979) pointed out that Kessler’s auto-conversion rate was higher than the observed value. The scheme proposed by Manton and Cotton (1977) based on Kessler (1969) considered both liquid water content and cloud droplet concentration. The results of Wang and Xie, 2009 show that the simulation results using this scheme of Manton and Cotton (1977) are consistent with the observed value. A representative scheme was proposed by Berry (1969), which calculated the auto-conversion efficiency as a function of cloud droplet number concentration, cloud water content, cloud droplet size, and spectral shape parameters; Ghosh and Janas, (1998) has proposed an auto-conversion parametrization scheme combining the benefits of Kessler’s (1969) and Berry (1969) schemes, which can be applied to different types of clouds. As a result of more in-depth studies of microphysical processes, others have derived new auto-conversion schemes based on more complicated microphysical models (Seifert et al., 2010; Lei et al., 2020). In recent years, Kogan and Ovchinnikov (2020) and Naegar et al. (2020) have considered the effect of turbulence in auto-conversion parameterization.
In order to explore the sensitivity of different auto-conversion schemes to CCN concentration, this paper uses the Thompson scheme embedded in WRF v 3.7.1 model as a microphysics scheme simulating strong convective processes. One group of simulations uses the original auto-conversion scheme of the Thompson et al. (2008) scheme (TH-AU), and the other group uses the Milbrandt and Yau (2005) (MY) scheme’s auto-conversion scheme (MY-AU). Both auto-conversion schemes follow Berry (1968). However, there are apparent differences in the intensity of the auto-conversion rate due to different conversion thresholds and rain-characteristic particle size calculations. On this basis, four sets of CCN concentrations, 50, 200, 2,000, and 10,000 cm−3, are set as the initial CCN concentrations of the model, which refer to the studies of Xie and Liu (2015) and Liu et al. (2021), and can represent several typical CCN concentrations. Moreover, a strong convective process is simulated in Ningxia, China.
WRFV3.7.1 is used for the numerical simulations in this paper, and the ECMWF reanalysis data is used as the initial field, updated every 6 h with a resolution of 0.75°*0.75°. A two-level nesting is implemented in the simulation area with a central location of 37.3°N, 106°E, and a grid number of 481*481. The Thompson scheme is used as the microphysics scheme, with a topographic resolution of 3 km and 1 km and a simulation duration of 18 h. All the simulation settings are kept consistent except for the auto-conversion scheme.
The Mellor–Yamada–Janjic (MYJ) scheme is the physics scheme of the planetary boundary layer (PBL). The cumulus parameterization options are turned off. We use the Rapid Radiative Transfer Model (RRTM) for the Global Climate Model (GCM) as the Shortwave and Longwave schemes. The Unified Noah Land and Surface Model are chosen as the surface land scheme, and the Eta Similarity Scheme as the surface layer scheme.
The Thompson scheme used in this paper is a modification of Reisner et al. (1998) and produces better simulation results. The scheme has six in-cloud components: water vapor, cloud droplets, rain droplets, ice crystals, snow, and graupel. Predictions for snow and graupel are made only in terms of the mixing ratio. Predictions for clouds, rain, and ice crystals include the number concentration and the mixing ratio.
In the Thompson scheme, raindrop particles originate from the auto-conversion on the one hand and the melting of ice phase particles on the other. The size of raindrops can vary significantly depending on whether they originate from the ice phase or warm rain process, and the auto-conversion process in the Thompson scheme is set as follows:
The TH-AU follows Berry (1969) scheme except for the droplet spectrum, which uses a gamma distribution, and the characteristic diameter is derived by calculation rather than assumption. The conversion rate of cloud water to rainwater is expressed as:
The raindrop number concentration of TH-AU is consistent with the MY-AU scheme, which will be described later.
The conversed water content of cloud droplets into rain droplets in the MY-AU follows that of Cohard and Pinty (2000):
and,
The raindrop number concentration of the MY-AU:
In addition, the MY-AU scheme has special settings for particle size. For the newly generated particles with number concentration of
The mass-weighted average diameter of existing raindrop particles
If
Three characteristic particle sizes are considered in the TH-AU scheme.
The observed precipitation used in this article combines the hourly precipitation of the China automatic station and CMORPH (Climate Prediction Center Morphing technique) integrated precipitation data. The simulated hourly precipitation intensities are analyzed using the Root Mean Squared Error (RMSE), calculated as follows:
n represents the number of data groups,
It measures the deviation between the simulated value and the observed value. In general, the RMSE value of less than 2 proves that the simulated value is more reliable.
Since the forecast output of the Thompson scheme does not include the particle size, a gamma function for the particle size distribution is introduced, and the mean particle size is calculated using the mixing ratio and the number concentration of the hydrometeor particles.
The particle size distribution of hydrometeor particles is represented by the gamma function as:
Figure 1 shows that the strong convective process in this paper occurred on 7 June 2017, in the southern region of Ningxia Hui Autonomous Region, China. Ningxia Hui Autonomous Region is located on the Loess Plateau, near the upper reaches of the Yellow River, and has a semiarid temperate continental climate. The precipitation process is accompanied by hail, with the maximum hail diameter reaching 1.5 cm and the accumulated hail reaching 2–3 cm.
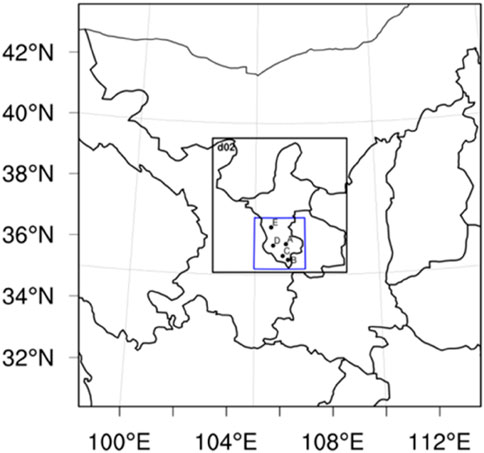
FIGURE 1. Simulation setting (A) Guyuan City (B) Jingyuan County (C) Longde County (D) Xiji County (E) Haiyuan County (F) Zhongwei City, the blue area is the area affected by the convection.
The earliest precipitation in Ningxia appeared at 03:00 UTC on 7 June, mainly concentrated in the southern region. At 10:00 UTC, the maximum intensity of the precipitation appeared with a precipitation intensity of 10–20 mm. The precipitation process began weakening after 10:00 UTC and gradually moved southward. At 14:00 UTC on the 07th day, the precipitation process finally moved out of Ningxia territory.
The composite radar reflectivity is shown in Figure 2, and the detection data are from the C band radar. At 04UTC, an intense radar echo center began to appear in the south-central region of Ningxia as the echo range developed and gradually moved southeastward. At 07UTC, the strongest radar echo appeared with a reflectivity intensity of approximately 54dBZ. During the southward motion of the echo, several strong echo centers merged. At 0730UTC, three strong radar echo centers emerged to the northwest of Guyuan city. At 09UTC, the earliest radar echo center moved out of Ningxia territory and gradually dissipated.
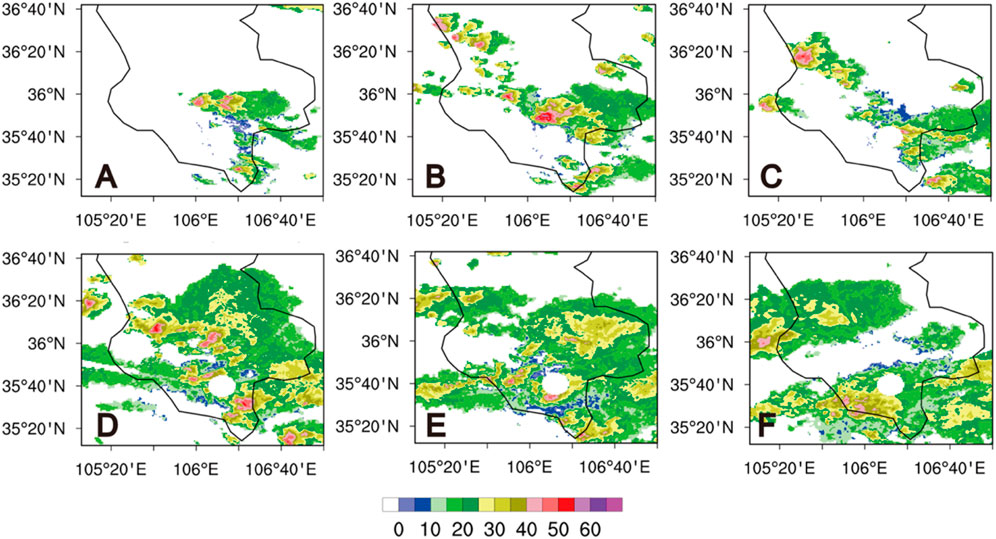
FIGURE 2. Observed composite radar reflectivities (Unist: dBZ) at (A) 0600 UTC (B) 0700 UTC (C) 0800 UTC (D) 0900 UTC (E) 1000 UTC (F) 1100 UTC.
Figures 3, 4 shows that the simulated convective development is close to the real case, and the center of the radar echo corresponds to the convective center. Concerning radar echo distribution, the simulation results are more southerly than real. As the concentration of CCN increases, the distribution of strong radar echoes beyond 40 dBZ is more concentrated in both schemes, and the reflectivity of the echo center is lessened. Compared with TH-AU, the intensity of the radar reflectivity center of MY-AU attenuates more with the increase of CCN concentration. In addition, at the CCN concentration of 10,000 cm−3, the convection of MY-AU entered the decay stage earlier. This is related to the early dissipation of convection in the MY-AU scheme at high CCN concentration.
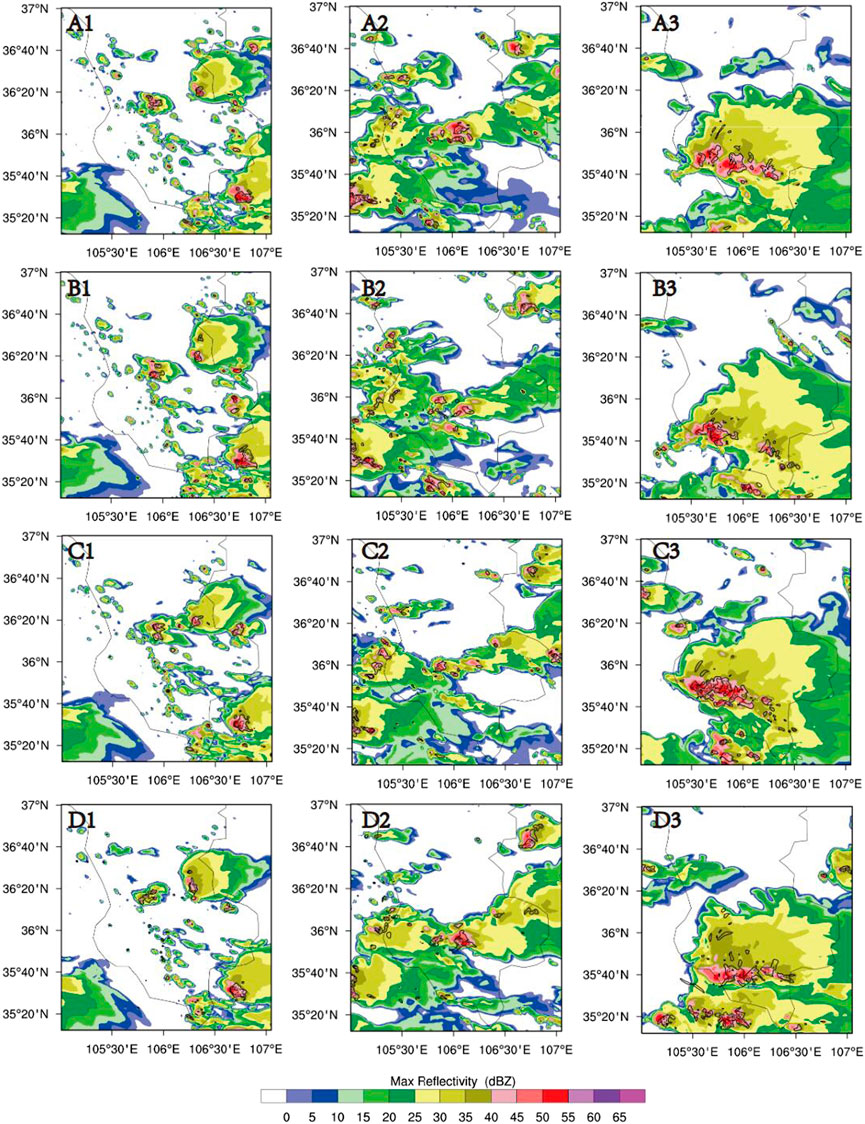
FIGURE 3. Composite radar reflectivity (Unit: dBZ) simulated with TH-AU scheme, with the solid line as the area where the updraft is greater than 5 m/s: (A) NCCN 50 (B) NCCN 200 (C) NCCN 2000 (D) NCCN 10000; (1) 0600 (2) 0800 (3) 1000 UTC.
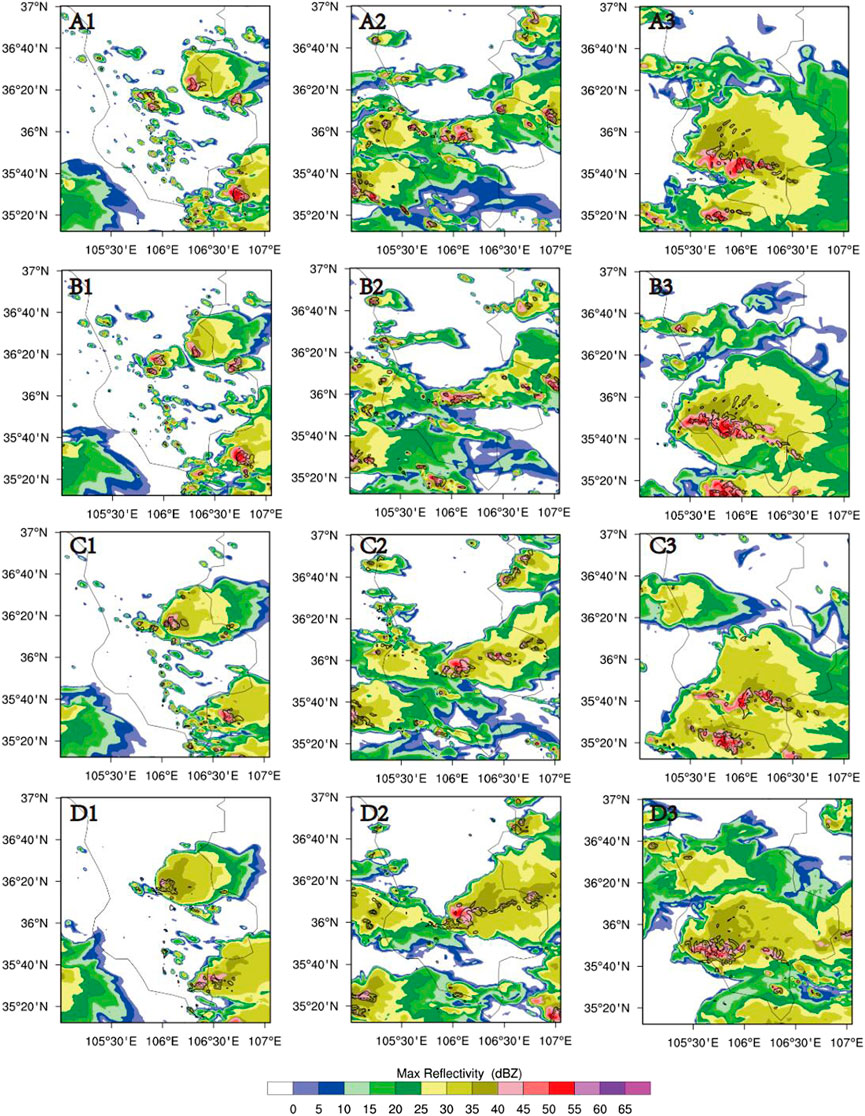
FIGURE 4. Composite radar reflectivity (Unit: dBZ) simulated with MY-AU scheme, with the solid line as the area where the updraft is greater than 5 m/s: (A) NCCN 50 (B) NCCN 200 (C) NCCN 2000 (D) NCCN 10000; (1) 0600UTC (2) 0800UTC (3) 10000 UTC.
There are significant differences between the two schemes concerning cumulative precipitation with changes in CCN which can be found in Figure 5. The precipitation distribution is more consistent with the location of the convective centers. For the simulation results of the two schemes, the cumulative precipitation of TH-AU does not change monotonically with increasing concentrations of CCN, which increases gradually as the CCN concentration increases from 50 to 200 cm−3, and reduces from 200 to 10,000 cm−3. This is related to the fact that the warm rain process of the TH-AU scheme is not significantly inhibited when the CCN concentration is 50–200 cm−3 but is inhibited when the CCN concentration is 200–10,000 cm−3, which is consistent with the research results of Khain et al. (2005) and van den Heever et al. (2006). Compared to MY-AU, there is a merging trend in precipitation centers in TH-AU. On the contrary, as the CCN concentration increases, the cumulative precipitation of MY-AU decreases. This is consistent with the trend that the increase of CCN concentration continuously strongly inhibits the warm rain process of the MY-AU scheme.
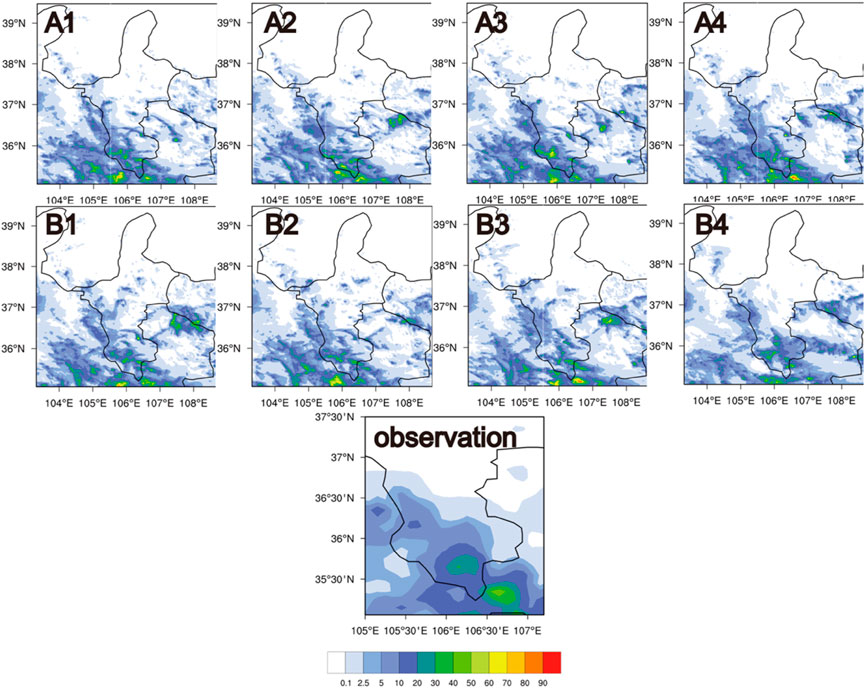
FIGURE 5. Simulated and observed precipitation accumulation (Unit: mm) at 1600 UTC: (A) TH-AU; (B) MY-AU; (1) NCCN 50 (2) NCCN200 (3) NCCN 2000 (4) NCCN10000.
We also use observed precipitation to assess hourly rainfall intensity and assessed it by calculating RMSE, which is shown in Figure 6. The RMSE for both schemes is less than 2, providing that the simulated hourly rainfall intensity is credible. The RMSE of the TH-AU scheme was similar except for the CCN concentration of 50 cm−3, indicating that hourly precipitation in the TH-AU scheme was not sensitive to CCN concentration changes. On the contrary, the RMSE of the four groups in the MY-AU scheme is significantly different, which proves that hourly precipitation in the MY-AU scheme is more sensitive to CCN concentration changes.
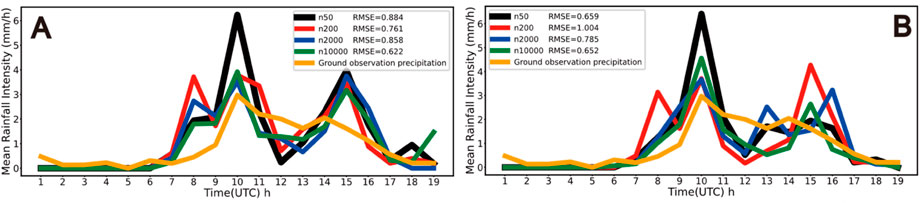
FIGURE 6. Hourly rainfall intensity (Unit: mm s−1): (A) TH-AU; (B) MY-AU.
Figure 7 shows the accumulated ground graupel-fall from simulations at 1600UTC. With the increase of CCN concentration, the maximum value of accumulated ground graupel-fall in the TH-AU scheme gradually increases. On the contrary, accumulated ground graupel-fall in the MY-AU scheme decrease with the increase of CCN concentration. The maximum accumulated ground graupel-fall quantity is at the CCN concentration of 50 cm−3.
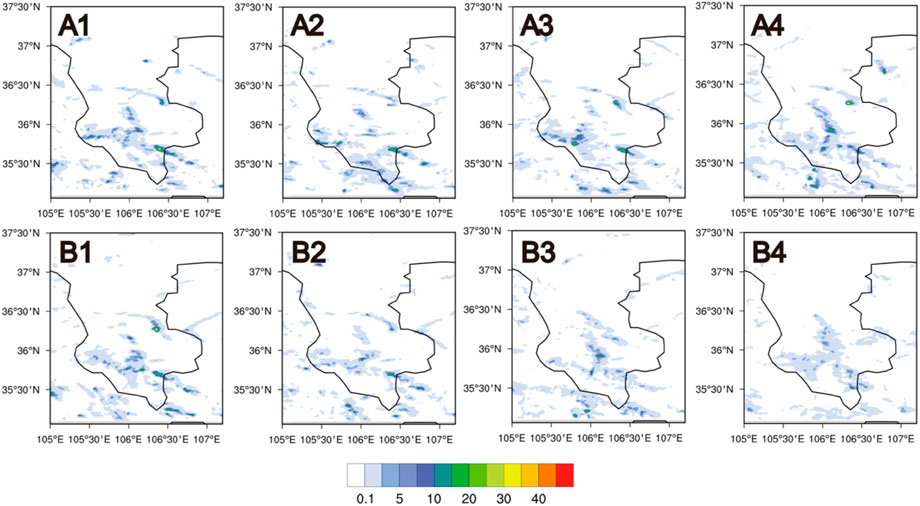
FIGURE 7. Accumulated ground graupel-fall from simulations (Unit: mm) at 1600 UTC: (A) TH-AU; (B) MY-AU, (1) NCCN 50 (2) NCCN200 (3) NCCN2000 (4) NCCN10000.
Figure 8 shows the distribution of maximum updraft and average downdraft with height with time. The process of convective development can be roughly divided into three stages based on changes in hourly precipitation and updraft intensity: stage of development (3-6UTC), stage of maturity (6-10UTC), and stage of dissipation (10-16UTC).

FIGURE 8. Time variation of height distribution of maximum updraft (Unit: m s−1) with the contour of height distribution of hourly mean downdraft (Unit: m s−1), and the solid white line is the height of 0°C: (A) TH-AU. (B) MY-AU; (1) NCCN50 (2) NCCN200 (3) NCCN 2000 (4) NCCN10000.
First, with the increased CCN concentration, more latent heating releases, resulting in more buoyant updrafts due to higher concentrations of cloud droplets that form. In addition, the cloud to rain auto-conversion process is inhibited at higher CCN concentrations (details are discussed in Section 5), suppressing the collision rate of rain to cloud. Because of that, more supercooled cloud water participates in freezing and riming, releasing more latent heat and promoting updraft development. This phenomenon is similar to the study of Khain et al. (2005), Seifert and Beheng (2005a) and Seifert and Beheng (2005b).
Therefore, as can be seen from Figures 8, 9, with the increase of CCN concentration and the weakening of cloud to rain auto-conversion intensity, the effect that cloud droplets are transported to the upper level to freeze, causing the upper-level updraft to strengthen has increased in the development and maturity stage, which also appears in the study of Fan (2007) and Fan et al. (2018), Lebo and Morrison (2014). On this basis, the simulation results show that in the process of increasing CCN concentration, the enhancement of updraft mainly occurs in the upper layer, while the increase of graupel particles in this height layer may enhance the downdraft in the middle and lower layers.
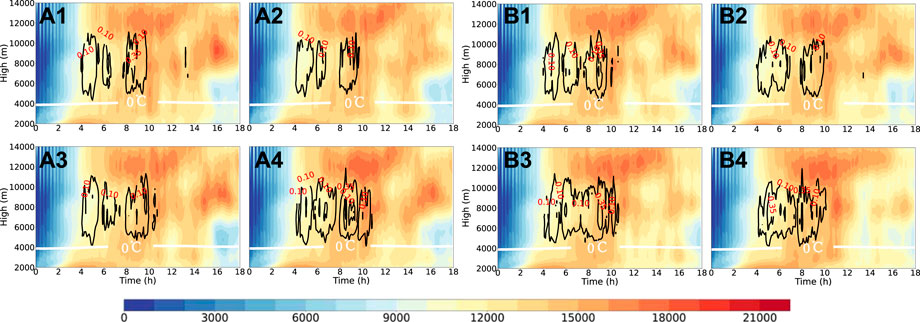
FIGURE 9. Time variation of height distribution of the number of updraft grids (w > 0.1 m s−1) with the contour of the proportion of updraft greater than 15 m s−1 in the total updraft, and the solid white line is the height of 0 degrees Celsius: (A) TH-AU. (B) MY-AU; (1) NCCN50 (2) NCCN200 (3) NCCN2000 (4) NCCN10000.
However, there is a clear difference in the stage of maturity and the stage of dissipation for the two schemes. At first, the updraft of 8,000–10,000 m in the MY-AU scheme has much higher growth than TH-AU in the mature stage, which is most significant with a CCN concentration of 10,000 cm−3. Moreover, compared with the TH-AU scheme, the decay of convection in the MY-AU is earlier when the CCN concentration is 10,000 cm−3. In addition, there are differences in the range of strong convection (w > 15 m/s) grids. When the concentration of CCN is the same, the range of strong convection grids above 8,000 m for MY-AU is more extensive than that for TH-AU, which indicates that the strong convection scale of the MY-AU scheme is larger than that of the TH-AU scheme.
As the CCN concentration increases, the mixing ratio of cloud droplets is significantly increased in both schemes (Figure 10). This phenomenon indicates that increasing the number of hygroscopic aerosols will produce more cloud droplets generated by aerosol activation, consistent with numerical studies (Khain et al., 2005; Lee et al., 2012). As a result of increased cloud droplet activation and water vapor competition, condensation growth of cloud droplet become complicated, resulting in a decrease in the particle size of cloud droplets. More and smaller cloud droplets induced by aerosols can hinder the auto-conversion process of clouds from raining (Xie et al., 2013). The auto-conversion intensities of both schemes decades with increasing concentrations of CCN, as shown in Figure 11. Because of that, it is shown in Figure 12 that more cloud droplets can be transported and enhance the ice phase processes, thus forming more ice hydrometeors, which is the same as Woodley et al. (2003).
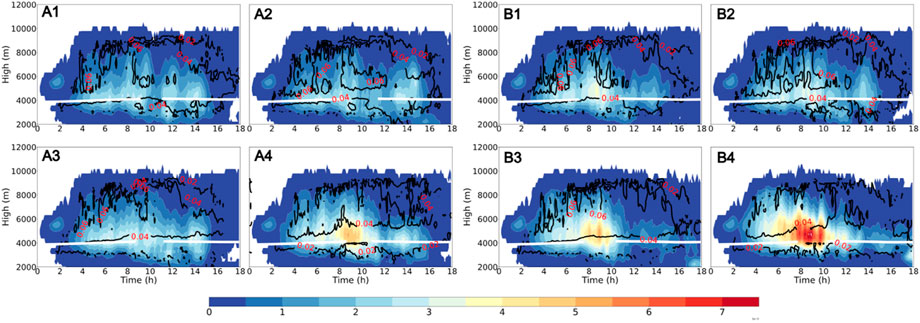
FIGURE 10. Time variation of the height distribution of cloud droplet mixing ratio (Unit:10–5 g kg−1) with the contour of the mass-weighted average diameter (Unit: mm), and the solid white line is the height of 0°C (A).TH-AU (B).MY-AU; (1) NCCN50 (2) NCCN200 (3) NCCN 2000 (4) NCCN10000.
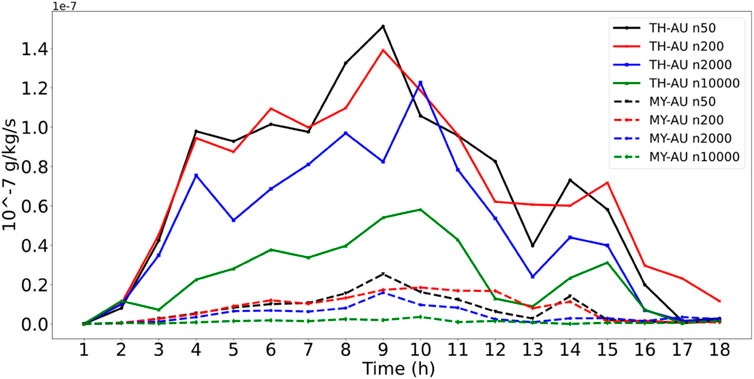
FIGURE 11. Time variation of auto-conversion rate from cloud water to rainwater (Unit: 10–7 g kg−1 s−1).
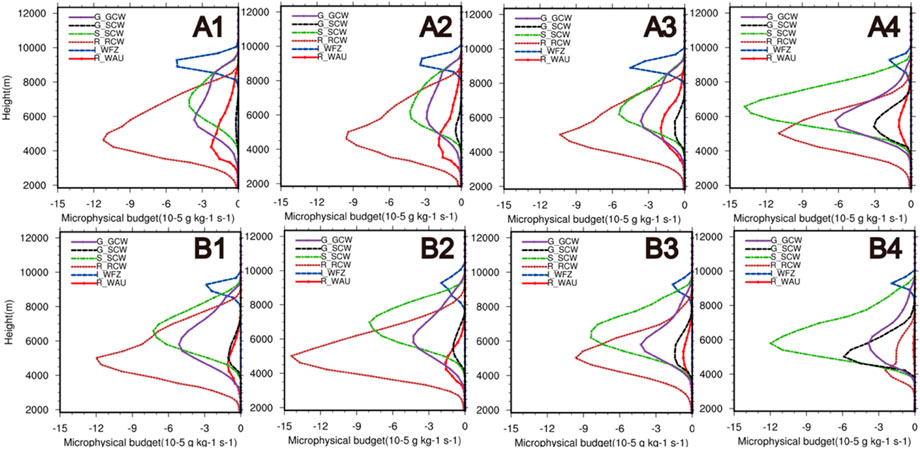
FIGURE 12. Height distribution of microphysical budget of cloud particles at 0930 UTC (Unit: 10–−5 g kg−1 s−1): (A) TH-AU (B) MY-AU; (1) NCCN50 (2) NCCN200 (3) NCCN 2000 (4) NCCN10000; G_GCW is the riming of graupel particles to cloud drops, G_SCW is the snow crystal s rime cloud droplets to generate graupel particles, S_SCW is the snow crystals rime cloud droplets to generate snow particles, R_RCW is the collision-coalescence of rain to cloud, I_WRF is the cloud droplets freeze into ice crystals, R_WAU is the cloud to rain auto-conversion.
However, in Figure 12, it can be found that the distribution of supercooled cloud water of the two schemes at the same CCN concentration is significantly different. At the same CCN concentration, a more significant proportion of supercooled clouds in the MY-AU scheme are frozen into ice crystals and involved in riming of snow crystals and graupel particles. Considering that the two schemes adopt the same cloud droplet activation calculation, this phenomenon comes from the different distribution of supercooled cloud water caused by the different sensitivity of the two auto-conversion schemes to the CCN concentration. In Figure 11, we can see that the auto-conversion intensity of MY-AU is more strongly inhibited as the concentration of CCN increases. Compared with the TH-AU scheme, the warm rain process is more strongly inhibited in the MY-AU scheme at the same CCN concentration, resulting in more supercooled cloud water participating in the ice phase process in the MY-AU scheme than in the TH-AU scheme.
Because the cloud water involved in ice crystal freezing increases slightly with the increase of CCN concentration in the TH-AU scheme, the ice-crystal mixing ratio does not change significantly with increasing CCN concentration. In contrast, with the rise of CCN concentration, the number of ice crystals generated by cloud water freezing in the MY-AU scheme increases significantly, the intensity of auto-conversion of ice to snow also increases significantly with the increase of CCN concentration (Figure Omitted), the ice-crystal mixing ratio in Figure 13 does not obviously increase with increasing CCN concentration. In addition, the downdraft of 4,000–6,000 m in the MY-AU scheme is enhanced when the CCN concentration is 2,000–10,000 cm−3 at dissipating stage, which weakens the transport of supercooled cloud droplets to the upper level and leads to the decrease of ice-crystal mixing ratio above 8,000 m.
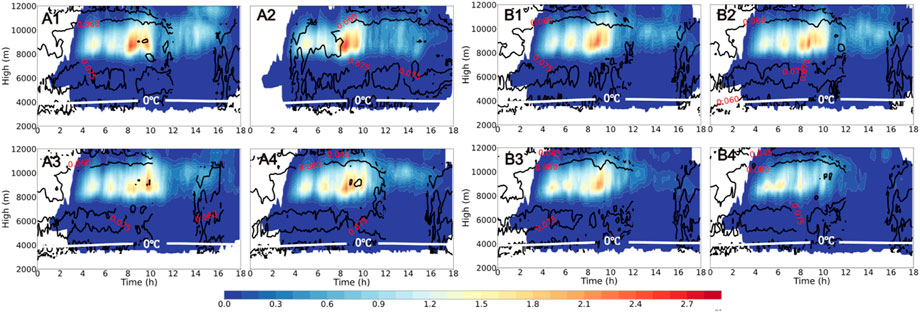
FIGURE 13. Time variation of the height distribution of ice particle mixing ratio (Unit:10–6 g kg−1) with the contour of the mass-weighted average diameter (Unit: mm), and the solid white line is the height of 0°C (A) TH-AU. (B) MY-AU; (1) NCCN50 (2) NCCN200 (3) NCCN 2000 (4) NCCN10000.
In terms of dynamics, more cloud droplet freezing above 8,000 m also brings additional latent heat release. With the increase of CCN concentration, the updraft above 8,000 m of the two schemes is enhanced. In particular, more cloud droplets freeze above 8,000 m in the MY-AU scheme, resulting in stronger updraft above 8,000 m at the same CCN concentration than in the TH-AU scheme.
In addition to cloud and ice particles, the auto-conversion process has more complex effects on snow and graupel particles. From the development stage to the maturity stage, with the increase of CCN concentration, the riming of cloud droplets to snow crystals increases obviously at 6,000–10,000 m (Figure Omitted), and more ice crystals also result in a greater auto-conversion of ice to snow crystals, which leads to the mixing ratio of snow particles increases at 6,000–8,000 m (Figure 14). At the same concentration of CCN, more supercooled cloud droplets participate in the ice phase process, causing the mixing ratio of snow crystals in MY-AU is significantly higher than that of TH-AU at the mature stage. In addition, when the convection enters the dissipative stage from the mature stage, the intensity of downdraft increases obviously with the increase of CCN concentration at 4,000–6,000 m. Along with the strengthening of the downdraft, the snow mixing ratio in both schemes above 6,000 m decreases because the strong downdraft makes it challenging to transport supercooled water to the upper-level in the dissipative stage. When the CCN concentration is 2,000–10,000 cm−3, the stronger downdraft in the MY-AU scheme makes the mixing ratio of the snow crystals lower than that in TH-AU at the same CCN concentration.

FIGURE 14. Time variation of the height distribution of snow particle mixing ratio (Unit: g kg−1) with the contour of the mass-weighted average diameter (Unit: mm), and the solid white line is the height of 0°C (A) TH-AU. (B) MY-AU; (1) NCCN50 (2) NCC N200 (3) NCCN 2000 (4) NCCN10000.
In fact, from the change in the mixing ratio of ice and snow crystals, we can see that the effect of increasing CCN number concentration on the ice phase process and vertical airflow in the cloud has different effects at different stages of convection. In the convective development stage, with the increase of CCN concentration and the weakening of the auto-conversion intensity of cloud to rain, the mixing ratio of ice and snow crystals in the upper layer increases, and the updraft also increases. However, in the dissipation stage of convection, the increase of CCN concentration and the weakening of the auto-conversion intensity of cloud to rain may strengthen the downdraft in the middle of the cloud, resulting in a weakening of the upward transport of supercooled water, which is not conducive to the increase of ice and snow grains in the upper part of the convection.
In addition, for ice particles, the differences between the two schemes due to auto-conversion are more significant for graupel particles. The microphysical scheme of Thompson assumes that graupel particles are primarily produced by the freezing of raindrops and the riming of snow particles, and grow by riming supercooled water. Because the intensity of auto-conversion is not significantly inhibited, TH-AU still has a large number of tiny raindrops generated by the warm rain process. These raindrops can be transported to more than 8,000 m by the updraft and frozen into graupel particles. In addition, with the increase of CCN concentration, snow crystals can rime more cloud water. Because of this, as the concentration of CCN increases, the mixing ratio of graupel increases significantly.
On the contrary, for the MY-AU, the warm rain process is strongly suppressed at the CCN concentration of 50–10,000 cm−3 (Figure 15), resulting in the almost raindrops being from the melting of snow crystals and graupel particles. Only sporadic tiny raindrops can freeze into graupel particles above 8,000 m. Therefore, graupel particles in MY-AU are mainly concentrated below 6,000 m, which are generated by the riming of the snow crystal to cloud droplets. Because of that, the mixing ratio of graupel particles in MY-AU decreases with the increase in CCN concentration. At the same time, the particle size of the graupel decreases due to limited growing space, which makes graupel particles more likely to melt completely in the falling process. In addition, a large number of graupel particles fall below 6,000 m, enhancing the downdraft in MY-AU when the CCN concentration is 2,000–10,000 cm−3.
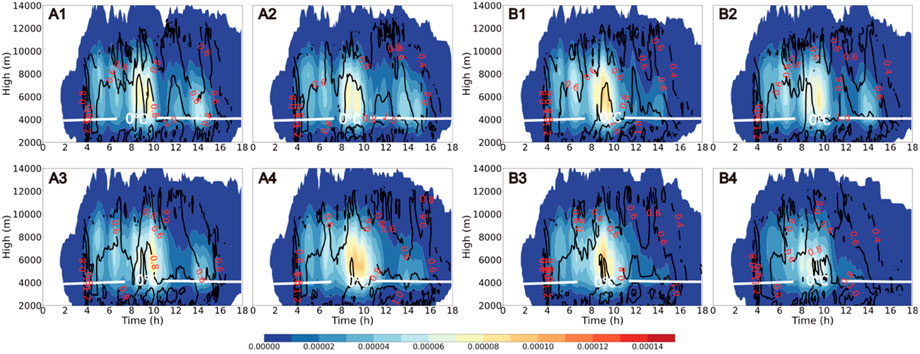
FIGURE 15. Time variation of the height distribution of graupel particle mixing ratio (Unit: g kg−1) with the contour of the mass-weighted average diameter (Unit: mm), and the solid white line is the height of 0°C (A) TH-AU. (B) MY-AU; (1) NCCN50 (2) NCCN200 (3) NCCN 2000 (4) NCCN10000.
At last, there are a series of changes in the microphysical processes that lead to a significant difference in precipitation between the two schemes. It is shown in Figure 16 that the mixing ratio of raindrops at the height of 4,000–8,000 m in the MY-AU scheme decreases with the increase of CCN concentration, but the raindrop mixing ratio at 4,000–8,000 m in the TH-AU scheme does not monotonically change with CCN concentration. Besides, the raindrop mixing ratio of the MY-AU scheme with the same CCN concentration is higher than TH-AU. In fact, raindrops at 4,000–8,000 m mainly come from warm rain processes, including cloud to rain auto-conversion and the collisional-coalescence process of cloud to rain. When the concentration of CCN is 50–200 cm−3, the auto-conversion intensity of the TH-AU scheme changes little. Simultaneously, with the increase of CCN concentration, the activation of cloud droplets increases, which accelerates the warm rain process. Therefore, when the CCN concentration of the TH-AU scheme is 200 cm-3, the raindrop mixing ratio increases at 4,000–8,000 m. However, when the CCN concentration is 200–10,000 cm−3, the auto-conversion intensity in the TH-AU scheme begins to decrease, resulting in a decrease in the raindrop mixing ratio at the height of 4,000–8,000 m. On the contrary, the auto-conversion intensity of the MY-AU scheme is significantly inhibited with the increase of CCN concentration, and the warm rain process is continuously weakened.
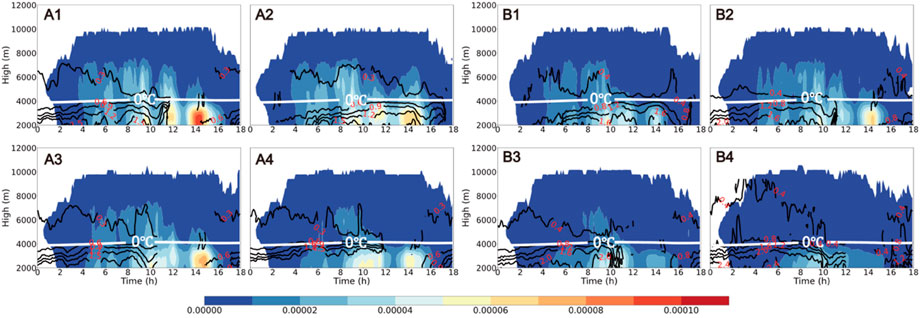
FIGURE 16. Time variation of the height distribution of rain particle mixing ratio (Unit: g kg−1) with the contour of the mass-weighted average diameter (Unit: mm), and the solid white line is the height of 0°C (A) TH-AU. (B) MY-AU; (1) NCCN50 (2) NCC N200 (3) NCCN 2000 (4) NCCN10000.
The difference in the raindrop transformation process also affects the macroscopic convection process, manifested as the difference of ground accumulated precipitation between the two schemes. Due to the non-monotonic response of the warm rain process with CCN concentration in the TH-AU scheme, the cumulative precipitation increases with the increase of the warm rain process when the CCN concentration is 50–200 cm−3. However, when the CCN concentration is 2,000–10,000 cm−3, the melting precipitation of the TH-AU scheme does not increase significantly, and the attenuation of the warm rain process leads to a decrease in cumulative precipitation. On the contrary, in the MY-AU scheme, accumulative precipitation decreases with the increase in CCN concentration.
Due to the limited knowledge of microphysical processes in clouds and the complexity of aerosol-cloud interactions, there are still some controversial findings on the sensitivity of clouds to rain auto-conversion schemes with CCN concentrations in strong convective simulations.
In terms of dynamic structure, with the increased CCN concentration, more supercooled water participates in freezing and riming, which releases more latent heat. The updraft in the two schemes increases with the increase of CCN concentration between 6,000 and 12,000 m. This is most likely to the simulation results of Rosenfeld et al. (2014) and Stevens and Feingold (2009). However, in this paper, the increase in CCN concentration does not lead to the extension of a convective lifetime, as Rosenfeld et al. (2014) mentioned. Moreover, the convective lifetime decreases with the increase of CCN concentration in both schemes, and this phenomenon is more evident in the MY-AU scheme. In fact, it is because the simulation of Rosenfeld et al. (2014) does not consider the buoyancy consumption caused by hydrometeor particles’ fall. In the simulation results of MY-AU, with the increase of CCN concentration, the fall of more graupel particles and large raindrops enhances the development of downdraft in the mature stage at 4,000–6,000 m, which leads to the early dissipation of convection.
In addition, the influence of CCN on precipitation has also been controversial in previous studies. Khain and Pokrovsky (2004) and Teller and Levin (2006) changed the number of concentrations of CCN and found decreases in cumulative precipitation for higher concentrations of CCN. However, this is contrary to the study by Wang (2005) and Khain et al. (2005). In this work, with the increase of CCN concentration, the mixing ratio of ice particles increases, and the proportion of melting precipitation in total precipitation increases in both schemes. Because the auto-conversion intensity of the TH-AU scheme is less inhibited with CCN concentration, the melting precipitation has little difference. When the CCN concentration is low, the accumulated precipitation increases due to the strengthening of the warm rain process. However, when the CCN concentration is high, the accumulated precipitation decreases with the inhibition of the warm rain process.
On the contrary, for the MY-AU scheme, the proportion of supercooled water participating in the ice phase process is higher than in the TH-AU scheme when the concentration of CCN increases. Due to the decrease in the particle size of ice phase particles, especially when the concentration of CCN is 10,000 cm−3, the melting process of snow crystals and graupel particles increases with the increase of CCN concentration, which is similar to the study of Khain et al. (2008) and Khain et al. (2015). Accompanied by the more suppressed warm rain processes, cumulative precipitation decreases.
In summary, the sensitivity of different auto-conversion schemes to changes in CCN concentrations varies significantly, and the aerosol-induced changes in precipitation and convection are strongly dependent on the auto-conversion scheme, with the following conclusions:
(1) Different auto-conversion scheme has a different sensitivity to changes in CCN concentrations, hence differences in the distribution of supercooled water in clouds. As the concentration of CCN increases, the particle size of cloud droplets decreases, resulting in the inhabitation of the auto-conversion process, which leads to more supercooled cloud water participate in the ice phase process. The MY-AU scheme is more sensitive to variation in CCN concentration, as the auto-conversion intensity decays more with the increase of CCN concentration, and auto-conversion intensity is only one-tenth of the TH-AU scheme. In the MY-AU scheme, more supercooled water participates in the ice-phase process at the same concentration of CCN.
(2) As the concentration of CCN increases, more cloud droplets freeze and release latent heat, which strengthens the updraft above 8,000 m for both schemes, and the proportion of updraft greater than 15m/s increases. The MY-AU has more cloud droplets freezing at the same CCN concentration than the TH-AU. Above 8,000 m, the updraft intensity is significantly greater than that of the TH-AU scheme in the mature phase, leading to a higher freezing height of supercooled water in the MY-TH scheme. In addition, at the same CCN concentration, the MY-AU scheme’s graupel particles are produced at a lower height, which leads to more graupel particles falling at 4,000–6,000 m. The dragging effect makes the downdraft enhanced and convective decay advanced.
(3) Effects of CCN concentration on precipitation and ground graupel-fall show a significant dependence on the auto-conversion process. The cumulative precipitation and the accumulated ground graupel-fall of the TH-AU scheme increases when the CCN concentration is 50–200 cm−3 and slightly decreases when the CCN concentration is 200–10000 cm−3. In contrast, as the CCN concentration increases, the cumulative precipitation with accumulated ground graupel-fall of the MY-AU scheme decreases, and the hourly rainfall intensity fluctuates wildly.
In this paper, the auto-conversion schemes are derived from the Thompson microphysics scheme, and in the other case, from Milbrandt-Yau. In addition, many auto-conversion schemes describe the cloud to rain auto-conversion process differently, and their conversion efficiency differs. More in-depth studies on other microphysical schemes are expected in future work. Moreover, it has been pointed out that meteorological elements such as vertical wind shear, atmospheric radiation, and turbulence strength can also affect the aerosol-cloud-precipitation interaction (Fan et al., 2009; Morrison et al., 2011; Tao et al., 2012). The interaction is not limited to the auto-conversion process. In this paper, we focus on the direction of microphysical parameterization and consider the response of different auto-conversion schemes to CCN concentration changes, hoping that the research can be helpful for future numerical simulation work in the field of aerosol-cloud interactions.
The raw data supporting the conclusions of this article will be made available by the authors, without undue reservation.
Under the supervision by XL, YL conducted data analysis and article writing, and CY performed numerical simulation and data preparation. XL did further investigation and revises. All authors read and contributed to the manuscript.
This work was supported by the National Natural Science Foundation of China (Grant Nos. 42061134009 and 41975176).
In addition, we acknowledge the High Performance Computing Center of Nanjing University of Information Science and Technology for their support of this work.
Author CY was employed by Changzhou Benniu International Airport.
The remaining authors declare that the research was conducted in the absence of any commercial or financial relationships that could be construed as a potential conflict of interest.
All claims expressed in this article are solely those of the authors and do not necessarily represent those of their affiliated organizations, or those of the publisher, the editors and the reviewers. Any product that may be evaluated in this article, or claim that may be made by its manufacturer, is not guaranteed or endorsed by the publisher.
Albrecht, B. A. (1989). Aerosols, cloud microphysics, and fractional cloudiness. Science 245 (4923), 1227–1230. doi:10.1126/science.245.4923.1227
Alizadeh-Choobari, O., and Gharaylou, M. (2017). Aerosol impacts on radiative and microphysical properties of clouds and precipitation formation. Atmos. Res. 185, 53–64. doi:10.1016/j.atmosres.2016.10.021
Andreae, M. O., and Rosenfeld, D. (2008). Aerosol–cloud–precipitation interactions. part 1. the nature and sources of cloud-active aerosols. Earth-Science Rev. 89 (1-2), 13–41. doi:10.1016/j.earscirev.2008.03.001
Barthlott, C., and Hoose, C. (2018). Aerosol effects on clouds and precipitation over Central Europe in different weather regimes. J. Atmos. Sci. 75 (12), 4247–4264. doi:10.1175/jas-d-18-0110.1
Berry, E. X. (1969). A mathematical framework for cloud models. J. Atmos. Sci. 26 (1), 109–111. doi:10.1175/1520-0469(1969)026<0109:amffcm>2.0.co;2
Cohard, J.-M., and Pinty, J.-P. (2000). A comprehensive two-moment warm microphysical bulk scheme. I: Description and tests. Q. J. R. Meteorological Soc. 126 (566), 1815–1842. doi:10.1256/.56613
Fan, J., Yuan, T., Comstock, J. M., Ghan, S., Khain, A., Leung, L. R., et al. (2009). Dominant role by vertical wind shear in regulating aerosol effects on deep convective clouds. J. Geophys. Res. 114 (D22), D22206. doi:10.1029/2009jd012352
Fan, X., Xia, X., and Chen, H. (2018). Can Modis detect trends in aerosol optical depth over land? Adv. Atmos. Sci. 35 (2), 135–145. doi:10.1007/s00376-017-7017-2
Fan, Y. (2007) “The interaction between cloud, radiation and convection self-aggregation.” institutional Repos. 46. doi:10.14711/thesis-991012980216303412
Ghan, S. J., Abdul-Razzak, H., Nenes, A., Ming, Y., Liu, X., Ovchinnikov, M., et al. (2011). Droplet nucleation: Physically-based parameterizations and comparative evaluation. J. Adv. Model. Earth Syst. 3 (4). doi:10.1029/2011ms000074
Ghosh, S., and Jonas, P. R. (1998). On the application of the classic Kessler and Berry Schemes in large eddy simulation models with a particular emphasis on cloud autoconversion, the onset time of precipitation and droplet evaporation. Ann. Geophys. 16 (5), 628–637. doi:10.1007/s00585-998-0628-2
Gryspeerdt, E., Stier, P., and Partridge, D. G. (2014). Links between satellite-retrieved aerosol and precipitation. Atmos. Chem. Phys. 14 (18), 9677–9694. doi:10.5194/acp-14-9677-2014
Hande, L. B., Hoose, C., and Barthlott, C. (2017). Aerosol- and droplet-dependent contact freezing: Parameterization development and case study. J. Atmos. Sci. 74 (7), 2229–2245. doi:10.1175/jas-d-16-0313.1
Houghton, J. (2001). “Climate change,” measuring environmental degradation [Preprint]. doi:10.4337/9781781950715.00018
Hu, Z., and Cai, L. (1979). Cumulus warm rain process and its salt powder catalyzed parameterized numerical simulation (in China). Chin. J. Atmos. Sci. 3 (4), 334–342.
Kessler, E. (1969) On the distribution and continuity of water substance in atmospheric circulations, pp. 1–84. doi:10.1007/978-1-935704-36-2_1
Khain, A. P., Beheng, K. D., Heymsfield, A., Korolev, A., Krichak, S. O., Levin, Z., et al. (2015). Representation of microphysical processes in cloud-resolving models: Spectral (bin) microphysics versus bulk parameterization. Rev. Geophys. 53 (2), 247–322. doi:10.1002/2014rg000468
Khain, A. P., BenMoshe, N., and Pokrovsky, A. (2008). Factors determining the impact of aerosols on surface precipitation from clouds: An attempt at classification. J. Atmos. Sci. 65 (6), 1721–1748. doi:10.1175/2007jas2515.1
Khain, A., and Pokrovsky, A. (2004). Simulation of effects of atmospheric aerosols on deep turbulent convective clouds using a spectral microphysics mixed-phase cumulus cloud model. part II: Sensitivity study. J. Atmos. Sci. 61 (24), 2983–3001. doi:10.1175/jas-3281.1
Khain, A., Rosenfeld, D., and Pokrovsky, A. (2005). Aerosol impact on the dynamics and microphysics of deep convective clouds. Q. J. R. Meteorological Soc. 131 (611), 2639–2663. doi:10.1256/qj.04.62
Kogan, Y., and Ovchinnikov, M. (2020). Formulation of autoconversion and drop spectra shape in shallow cumulus clouds. J. Atmos. Sci. 77 (2), 711–722. doi:10.1175/jas-d-19-0134.1
Köhler, H. (1936). The nucleus in and the growth of hygroscopic droplets. Trans. Faraday Soc. 32, 1152–1161. doi:10.1039/tf9363201152
Kovačević, N. (2018). Hail suppression effectiveness for varying solubility of natural aerosols in water. Meteorology Atmos. Phys. 131 (3), 585–599. doi:10.1007/s00703-018-0587-4
Lebo, Z. J., and Morrison, H. (2014). Dynamical effects of aerosol perturbations on simulated idealized squall lines. Mon. Weather Rev. 142 (3), 991–1009. doi:10.1175/mwr-d-13-00156.1
Lebo, Z. J., and Seinfeld, J. H. (2011). Theoretical basis for convective invigoration due to increased aerosol concentration. Atmos. Chem. Phys. 11 (11), 5407–5429. doi:10.5194/acp-11-5407-2011
Lee, S.-S., Feingold, G., and Chuang, P. Y. (2012). Effect of aerosol on cloud–environment interactions in trade cumulus. J. Atmos. Sci. 69 (12), 3607–3632. doi:10.1175/jas-d-12-026.1
Lei, H., Guo, J., Chen, D., and Yang, J. (2020). Systematic bias in the prediction of warm-Rain Hydrometeors in the WDM6 microphysics scheme and modifications. J. Geophys. Res. Atmos. 125 (4). doi:10.1029/2019jd030756
Lerach, D. G., and Cotton, W. R. (2018). Simulating southwestern U.S. desert dust influences on supercell thunderstorms. Atmos. Res. 204, 78–93. doi:10.1016/j.atmosres.2017.12.005
Lim, K.-S. S., and Hong, S.-Y. (2010). Development of an effective double-moment cloud microphysics scheme with prognostic cloud condensation nuclei (CCN) for weather and climate models. Mon. Weather Rev. 138 (5), 1587–1612. doi:10.1175/2009mwr2968.1
Liu, X., Yuan, C., Sang, J., and Ma, S. (2021). Effect of cloud condensation nuclei concentration on a hail event with weak warm rain process in a semi-arid region of China. Atmos. Res. 261, 105726. doi:10.1016/j.atmosres.2021.105726
Li, Z., Lau, W., Ramanathan, V., Wu, G., Ding, Y., Manoj, M., et al. (2016). Aerosol and monsoon climate interactions over Asia. Reviews of Geophysics 54 (4), 866–929. doi:10.1002/2015rg000500
Manton, M. J., and Cotton, W. R. (1977). Formulation of approximate equations for modeling moist deep convection on the mesoscale. Fort Collins, CO: Department of Atmospheric Science, Colorado State University.
Marinescu, P. J., van den Heever, S. C., Saleeby, S. M., Kreidenweis, S. M., and DeMott, P. J. (2017). The microphysical roles of lower-tropospheric versus midtropospheric aerosol particles in mature-stage MCS precipitation. J. Atmos. Sci 74 (11), 3657–3678. doi:10.1175/jas-d-16-0361.1
Michibata, T., and Takemura, T. (2015). Evaluation of autoconversion schemes in a single model framework with satellite observations. J. Geophys. Res. Atmos. 9570–9590. Preprint. doi:10.1002/2015jd023818-t
Milbrandt, J. A., and Yau, M. K. (2005). A multimoment bulk microphysics parameterization. part I: Analysis of the role of the spectral shape parameter. J. Atmos. Sci. 62 (9), 3051–3064. doi:10.1175/jas3534.1
Morrison, H., de Boer, G., Feingold, G., Harrington, J., Shupe, M. D., and Sulia, K. (2011). Resilience of persistent arctic mixed-phase clouds. Nat. Geosci. 5 (1), 11–17. doi:10.1038/ngeo1332
Morrison, H., van Lier-Walqui, M., Fridlind, A. M., Grabowski, W. W., Harrington, J. Y., Hoose, C., et al. (2020). Confronting the challenge of Modeling Cloud and precipitation microphysics. J. Adv. Model. Earth Syst. 12 (8), e2019MS001689. doi:10.1029/2019ms001689
Morrison, H., Witte, M., Bryan, G. H., Harrington, J. Y., and Lebo, Z. J. (2018). Broadening of modeled cloud droplet spectra using bin microphysics in an Eulerian spatial domain. J. Atmos. Sci. 75 (11), 4005–4030. doi:10.1175/jas-d-18-0055.1
Naeger, A. R., Colle, B. A., Zhou, N., and Molthan, A. (2020). Evaluating warm and cold rain processes in cloud microphysical schemes using Olympex Field Measurements. Mon. Weather Rev. 148 (5), 2163–2190. doi:10.1175/mwr-d-19-0092.1
Reisner, J., Rasmussen, R. M., and Bruintjes, R. T. (1998). Explicit forecasting of supercooled liquid water in winter storms using the MM5 mesoscale model. Q. J. R. Meteorological Soc. 124 (548), 1071–1107. doi:10.1002/qj.49712454804
Reutter, P., Su, H., Trentmann, J., Simmel, M., Rose, D., Gunthe, S. S., et al. (2009). Aerosol- and updraft-limited regimes of cloud droplet formation: Influence of particle number, size and hygroscopicity on the activation of cloud condensation nuclei (CCN). Atmos. Chem. Phys. 9 (18), 7067–7080. doi:10.5194/acp-9-7067-2009
Rosenfeld, D., Sherwood, S., Wood, R., and Donner, L. (2014). Climate effects of aerosol-cloud interactions. Science 343 (6169), 379–380. doi:10.1126/science.1247490
Rosenfeld, D. (2000). Suppression of rain and snow by urban and industrial air pollution. Science 287 (5459), 1793–1796. doi:10.1126/science.287.5459.1793
Saleeby, S. M., Heever, S. C., Marinescu, P. J., Kreidenweis, S. M., and DeMott, P. J. (2016). Aerosol effects on the anvil characteristics of mesoscale convective systems. Journal of Geophysical Research: Atmospheres 121 (18). doi:10.1002/2016jd025082
Seifert, A., and Beheng, K. D. (2005a). A two-moment cloud microphysics parameterization for mixed-phase clouds. part 2: Maritime vs. Continental Deep convective storms. Meteorology Atmos. Phys. 92 (1-2), 67–82. doi:10.1007/s00703-005-0113-3
Seifert, A., and Beheng, K. D. (2005b). A two-moment cloud microphysics parameterization for mixed-phase clouds. part 1: Model description. Meteorology and Atmospheric Physics 92 (1-2), 45–66. doi:10.1007/s00703-005-0112-4
Seifert, A., Nuijens, L., and Stevens, B. (2010). Turbulence effects on warm-rain autoconversion in precipitating shallow convection. Q. J. R. Meteorological Soc. 136 (652), 1753–1762. doi:10.1002/qj.684
Seinfeld, J. H., and Lebo, Z. J. (2011). Theoretical basis for convective invigoration due to increased aerosol concentration. Atmospheric Chemistry and Physics 11 (11), 5407–5429. doi:10.5194/acp-11-5407-2011
Sheffield, A. M., Saleeby, S. M., and van den Heever, S. C. (2015). Aerosol-induced mechanisms for Cumulus Congestus growth. J. Geophys. Res. Atmos. 120 (17), 8941–8952. doi:10.1002/2015jd023743
Stevens, B., and Feingold, G. (2009). Untangling aerosol effects on clouds and precipitation in a buffered system. Nature 461 (7264), 607–613. doi:10.1038/nature08281
Tao, W.-K., Chen, J. P., Li, Z., Wang, C., and Zhang, C. (2012). Impact of aerosols on convective clouds and precipitation. Rev. Geophys. 50 (2). doi:10.1029/2011rg000369
Teller, A., and Levin, Z. (2006). The effects of aerosols on precipitation and dimensions of subtropical clouds: A sensitivity study using a numerical cloud model. Atmos. Chem. Phys. 6 (1), 67–80. doi:10.5194/acp-6-67-2006
Thompson, G., Field, P. R., Rasmussen, R. M., and Hall, W. D. (2008). Explicit forecasts of winter precipitation using an improved bulk microphysics scheme. part II: Implementation of a new snow parameterization. Mon. Weather Rev. 136 (12), 5095–5115. doi:10.1175/2008mwr2387.1
van den Heever, S. (2018) “Aerosol effects on the anvil characteristics, cold pool forcing and stratiform-convective precipitation partitioning and latent heating of mesoscale convective systems.” doi:10.2172/1482383
van den Heever, S. C., Carrio, G. G., Cotton, W. R., DeMott, P. J., and Prenni, A. J. (2006). Impacts of nucleating aerosol on Florida storms. part I: Mesoscale simulations. J. Atmos. Sci. 63 (7), 1752–1775. doi:10.1175/jas3713.1
van den Heever, S. C., Grant, L. D., Freeman, S. W., Marinescu, P. J., Barnum, J., Bukowski, J., et al. (2021). The Colorado state university convective cloud outflows and updrafts experiment (C3LOUD-EX). Bull. Am. Meteorological Soc. 102 (7), E1283–E1305. doi:10.1175/bams-d-19-0013.1
Wang, C., and Xie, Y. (2009). Study on cloud micro-physical processes and precipition formative mechanisms of a mesoscale convective system in Meiyu Front in June 2004 (in China). J. Meteorological Sci. 29 (4), 434–446.
Wang, C. (2005). A modeling study of the response of tropical deep convection to the increase of cloud condensation nuclei concentration: 1. Dynamics and microphysics. J. Geophys. Res. 110 (D21), D21211. doi:10.1029/2004jd005720
White, B., Gryspeerdt, E., Stier, P., Morrison, H., Thompson, G., and Kipling, Z. (2017). Uncertainty from the choice of microphysics scheme in convection-permitting models significantly exceeds aerosol effects. Atmos. Chem. Phys. 17 (19), 12145–12175. doi:10.5194/acp-17-12145-2017
Woodley, W. L., Rosenfeld, D., and Silverman, B. A. (2003). Results of on-top glaciogenic cloud seeding in Thailand. part I: The demonstration experiment. J. Appl. Meteorology 42 (7), 920–938. doi:10.1175/1520-0450(2003)042<0920:roogcs>2.0.co;2
Xie, X., and Liu, X. (2015). Aerosol-cloud-precipitation interactions in WRF model: Sensitivity to autoconversion parameterization. J. Meteorological Res. 29 (1), 72–81. doi:10.1007/s13351-014-4065-8
Keywords: auto-conversion parameterization, CCN concentration, numerical simulation, convection, microphysical process
Citation: Li Y, Liu X and Yuan C (2023) The numerical study on the sensitivity of different auto-conversion parameterization to CCN concentration. Front. Environ. Sci. 11:1112266. doi: 10.3389/fenvs.2023.1112266
Received: 30 November 2022; Accepted: 19 January 2023;
Published: 03 February 2023.
Edited by:
Yunheng Wang, University of Oklahoma, United StatesReviewed by:
Youcun Qi, Institute of Geographic Sciences and Natural Resources Research (CAS), ChinaCopyright © 2023 Li, Liu and Yuan. This is an open-access article distributed under the terms of the Creative Commons Attribution License (CC BY). The use, distribution or reproduction in other forums is permitted, provided the original author(s) and the copyright owner(s) are credited and that the original publication in this journal is cited, in accordance with accepted academic practice. No use, distribution or reproduction is permitted which does not comply with these terms.
*Correspondence: Xiaoli Liu, bGl1eGlhb2xpMjAwNHlAbnVpc3QuZWR1LmNu
Disclaimer: All claims expressed in this article are solely those of the authors and do not necessarily represent those of their affiliated organizations, or those of the publisher, the editors and the reviewers. Any product that may be evaluated in this article or claim that may be made by its manufacturer is not guaranteed or endorsed by the publisher.
Research integrity at Frontiers
Learn more about the work of our research integrity team to safeguard the quality of each article we publish.