 Daniela Tagtachian1,2*†Deborah Balk1,2,3†
- 1CUNY Institute for Demographic Research, City University of New York, New York, NY, United States
- 2Program in Sociology, Graduate Center, City University of New York, New York, NY, United States
- 3Marxe School of Public and International Affairs, Baruch College, City University of New York, New York, NY, United States
Fine scale data collection on vulnerability metrics is necessary for just policy outcomes. Those most likely to be disproportionately affected by specific climate risks should be identified early so that the needs of vulnerable communities (especially historically marginalized communities) can be addressed and mitigated in accordance with climate justice principles. While there is a growing body of event-specific and place-based studies, systematic studies on coastal populations at risk have typically not applied equity principles and have often ignored attributes such as race and ethnic composition, age structure, urban/rural classification, and housing tenure. Additionally, assumptions about future population trends depend on understanding past spatial patterns of change, as well as demographic and socioeconomic characteristics of the populations at risk, especially considering increasing coastal hazards. Yet, with few exceptions, research on coastal vulnerability has not analyzed changes in exposure over time and has not systematically addressed implications for communities of color over time. This paper seeks to fill these gaps. In this paper, using an equity lens and spatial demographic methods with the finest-resolution data available (census blocks), we estimate the extent of exposure and population change from 1990 to 2020 in the low elevation coastal zone in the continental United States. We find that the population of the LECZ has increased during this period, primarily by the growth of the urban population which has risen from about 22 million to 31 million persons. From 2000 to 2020, the urban population consistently grew at higher rates inside the LECZ than outside of it, reversing the pattern from the decade prior. We also examine changes in the population by race and Hispanic origin, urban and rural status, and a set of more expansive vulnerability themes. Our estimates, tabulated by counties and states, reveal the concentration and characteristics of exposure and changes to it over the past 30 years. Key findings include: residents of the LECZ are much older than average; Black residents are overrepresented in renter-occupied housing units in the urban LECZ; and from 2000 to 2020, Hispanic population growth was much higher in urban LECZ areas than urban areas elsewhere. These systematic insights into the demographic attributes of the populations most at risk of sea-level rise and associated coastal hazards can be used to ensure adaptation, mitigation, and disaster-related policies are tailored to the specific needs of these communities and actors at local, regional, and national scales. It also showcases how spatial methods can be used to understand demographic change and be put in place for future estimates of population in non-traditional units (e.g., coastal zones or other environmentally-vulnerable areas).
1 Introduction
Research on population exposure and vulnerability to sea-level rise and related coastal hazards at the global scale has shown that urban residents are at disproportionate risk (McGranahan et al., 2007) and due to population growth and urbanization in the past 25 years, urban residents are increasingly exposed to such hazards (MacManus et al., 2021). Global estimates place about 1:10 persons and 1:7 urban persons living in the low elevation coastal zone (LECZ) (MacManus et al., 2021) and nearly 1 million coastal residents in the US are estimated to be exposed annually to flooding alone (Hauer et al., 2021). The global framework (McGranahan et al., 2007) for understanding populations at risk was novel in that it explicitly aimed to understand the impact on city-dwellers and urbanization processes. It also established a method for understanding future population growth expected to take place largely in the world’s cities and towns in the context of climate adaptation (Revi et al., 2014). Recent studies (MacManus et al., 2021) show that differences in underlying datasets—such as coastal zone and urban-continuum constructs as well as population grids (Zoraghein and Leyk, 2019)—result in different estimates of population or land exposed and argue for multiple ways of estimating exposure. Concomitantly, much placed-based research in the past decade has also made great contributions to understanding local processes in urban and rural areas and has provided a fuller understanding of which subpopulations are at risk or likely to be disproportionately impacted by climate-related hazards (Fussell et al., 2010; Sastry and Gregory, 2014; Curtis et al., 2015; Winkler and Rouleau, 2021), while increasingly using environmental and climate justice frameworks (Schlosberg and Collins, 2014; Harlan et al., 2015; Hauer et al., 2021; Balk et al., 2022), and aiming to forecast change and migration at a local scale (Hauer et al., 2015; Hauer, 2017; McApline and Porter, 2018; Hauer et al., 2019).
Prior studies for the US that estimate or forecast populations at risk of seaward hazards associated with climate change or that will likely be exposed to future sea-level rise or other coastal hazards have typically used county-level data which assumes a uniform distribution of population within counties as a basis for understanding vulnerability (Hauer et al., 2016; Hauer et al., 2022) or understanding out-migration trajectories between counties (Curtis et al., 2015; Hardy and Hauer, 2018). However, estimates of populations at risk at a fine scale provide much more accurate estimation of such populations particularly when the exposure does not conform to the underlying units of analysis and may be irregularly shaped (Balk et al., 2013; Zoraghein and Leyk, 2018); those fine-spatial units can be regrouped by higher-order (e.g., census tracts) and policy-relevant geographies (e.g., counties, states, metropolitan statistical areas). Census blocks—the most granular unit in the US Census—therefore, allow for the best representation of populations at risk. Information reported at the census block level is, however, more limited thematically than other reporting units like census tracts or counties because it reflects the full headcount of the population rather than being derived from the American Community Survey, or prior to 2005, the census long-form (Donnelly, 2022). Yet block-level data include key population and housing variables like those on race and ethnicity that are necessary to assess inequality (Strmic-Pawl et al., 2018).
Understanding rates of urban and rural population growth in coastal communities is important for understanding future change and adaptation planning not only because American rural areas are losing population on average (Johnson and Lichter, 2019), but also because some US cities, in addition to states and federal agencies, have explicit climate action plans (e.g., Rosenzweig and Solecki, 2019). The urban/rural classification is particularly relevant because while the LECZ is disproportionately home to city dwellers in global terms, these differences have not been studied systematically within the American context (though see Bukvic et al., 2018). Further, in the United States, vulnerable communities of color are also disproportionately located in cities. While there is a growing body of local studies that explore racial disparities with respect to flooding using conventional flood-risk zones such as FEMA’s 100-year floodplains maps (e.g., Highfield et al., 2013; Smiley, 2020; Smiley et al., 2022), systematic studies on populations at risk have not typically examined attributes such as race and ethnic composition, age structure, and housing characteristics at a fine spatial scale, and stratifying by urban and rural areas. This paper aims to fill these gaps.
In this paper, using environmental and climate justice frameworks and spatial demographic methods with the finest-resolution data available, we estimate the extent of exposure and population change from 1990 to 2020 in the LECZ in the United States. In order to understand coastal vulnerability more fully, we examine this not only for the total population in the coastal states (of the lower 48 and DC) but also for the population by race and Hispanic origin and by urban and rural status, and a select set of more expansive themes that reflect population vulnerability (i.e., on aging and housing). Our estimates, which we tabulate by counties and states, reveal the concentration and characteristics of exposure and changes to it over the past 30 years. This systematic insight into the demographic and housing attributes of the populations most at risk of sea-level rise and associated coastal hazards can be used to ensure adaptation, mitigation, and disaster-related policies are tailored to the specific needs of these subpopulations and actors at local, regional, and national scales. It will also showcase how spatial methods can be used to understand demographic change and be used for future estimates of population in non-traditional units (e.g., coastal zones rather than states).
This paper is organized as follows: We begin with a review of the key themes in the literature that frame our analysis, then describe the methods and data used in our analysis, continue with a description and analysis of the results, and end with a discussion of our findings and concluding remarks. Supplementary Materials1 contain additional tables and figures.
2 Background
The National Oceanic and Atmospheric Administration (NOAA)’s State of the Coastal Report on National Coastal Population from 1970 to 2020 (2013), finds that regardless of how the coast is defined (i.e., coastal shoreline versus coastal watershed counties, with the former being the 452 counties adjacent to open water, including the Great Lakes; and the latter being the 769 counties that intersect a coastal watershed), it is more densely populated than inland areas and these higher densities are expected to continue to increase in the future. In their analysis, 39 percent of the US population in 2010 lived in a coastal shoreline county (which accounts for less than 10 percent of the US land area, omitting Alaska) but they grew more slowly—a 39 percent increase from 1970 in contrast to inland counties which increased by 52 percent over the same period. They establish that persons of color made up 35 percent of the population of coastal counties in 2010, in comparison to 28 percent in inland counties. While the share of households that earn over $100,000 in coastal counties is much greater than inland counties (47% vs. 39%, respectively), coastal and inland counties share the same poverty rate (13%) on average, suggesting that coastal counties have more unequal income distributions. These disparities make evident the need for an equity lens in understanding patterns and trends of socio-demographic change in hazard-prone areas, and thus, the value of making use of such information in climate adaptation and mitigation planning (Foster et al., 2019).
The guiding principles of environmental and climate justice—noting distributive, procedural, recognitional, and intergenerational dimensions of social justice (Newell et al., 2021)—are needed to ensure that climate adaptation and mitigation plans do not augment or reinforce existing inequalities and facilitate more equitable outcomes (Allen et al., 2021). An equity lens should be applied to all aspects of climate planning; from data collection and analysis and stakeholder engagement to the decision-making processes and policy proposals. In the current research, we use a distributive equity lens2 by systematically identifying differential exposures to seaward hazards by race/ethnic origin, housing tenure, and age. Climate-related disasters disproportionately impact vulnerable communities: in the United States, this includes racial and ethnic minorities, low-income residents, renters, older residents, and non-native English speakers (Bjarnadottir et al., 2011; Cutter et al., 2012; Chakraborty et al., 2019; National Academies of Sciences, Engineering, and Medicine, 2019; Allen et al., 2021).
In addition to examining differing exposure to disasters by subpopulations (e.g., Smiley, 2020; Smiley et al., 2022; Grineski et al., 2023), researchers have also analyzed interactions between different vulnerabilities and how they can build on each other. For example, among the racial and ethnic groups studied, Davidson et al. (2013) found that African Americans had the highest likelihood of experiencing PTSD symptoms in the aftermath of Hurricane Ike and found that African Americans had the strongest positive association between disaster-caused property damage and PTSD symptoms. Similarly, Flores et al. (2020) found that non-Hispanic Black persons, older people, and people in households that experienced job loss (post-hurricane) were more likely than non-Hispanic White persons to have post-traumatic stress after Hurricane Harvey. They also found that healthcare access was diminished post-Harvey for persons in households that experienced job loss (post-hurricane) and those with disabilities. Grineski et al. (2022) found that being any race other than White as well as having a disability was positively associated with post-traumatic stress after Winter Storm Uri in Texas.
Given the history of discriminatory policies that have resulted in today’s inequities—disparities in, for example, proximity to pollutants (and life expectancy), amount of tree cover, access to municipal resources, and poverty rates (Pulido, 2000; Elliott et al., 2009; Mohai et al., 2009; Faber, 2015; Rothstein, 2017; Hoffman et al., 2020; McDonald et al., 2021; Redfin News and Katz, 2021), the displacement effects of climate “gentrification” (Keenan et al., 2018; Aune et al., 2020), and the role housing plays in financial stability and intergenerational wealth, housing trends by race and ethnicity and their relationship to the compounding vulnerabilities associated with increased proximity to the coast must be equitably studied and mitigated. Due to the increased number of seniors (persons ages 65+) living in coastal communities (Climate Central, 2021) and the vulnerabilities of older residents (such as, a decreased ability to adjust to changes in temperature, lack of mobility, or stressors and difficulties of evacuating assisted living facilities and nursing homes), the aging trends in coastal communities should also be examined.
In the subsections that follow, we highlight relevant location, event, or population-specific findings, as well as general patterns, on a variety of natural hazards, to situate our empirical analysis which explores three aspects of vulnerability and socio-demographic change (race and Hispanic origin) in coastal zones: (a) the temporal nature of disproportionate exposures; (b) housing precarity; and (c) aging population.
2.1 Impacts of climate hazards must be studied over time
In perhaps the only historical analysis of the built environment of coastal zones, from c. 1900–2015, Braswell et al. (2022) find substantial growth in sea-level rise zones (6-feet zones, based on NOAA) in coastal communities in the continental US as compared to inland areas, especially in the second half of the 20th century. They find these patterns of growth with respect to the density of structures as well as developed land in coastal communities, with growth in hurricane-prone areas being especially prominent. Yet, with the exception of understanding population responses to hurricanes (e.g., Sastry and Gregory, 2014; Curtis et al., 2015; Fussell et al., 2017), analogous research on population vulnerability in coastal zones has largely neglected understanding changes in exposure over time. Further, given the vulnerability of the current groups living in coastal hazard prone areas (Watkins and Hagelman, 2011; Chakraborty et al., 2014; Wang et al., 2014; Maldonado et al., 2016), it is even more important to understand demographic and socioeconomic change throughout the coastal zone.
2.1.1 Implications of change over time among those disproportionately exposed to hazards
Understanding spatial patterns of socio-demographic change in the past can help us develop assumptions about and contextualize future population trends. Calculating changes in population exposure over time, as we demonstrate later in this paper, is one way to document the disproportionate risk experienced by vulnerable communities. Changes in the population composition of areas at-risk may be indicative of mitigation, adaptation, or recovery policies that perpetuate, augment, or exacerbate social inequities. Although not limited to coastal vulnerability, scholars have examined the impact of preventive efforts like government-funded strategic retreat programs for flood-prone areas (Elliot et al., 2020; Elliot and Wang, 2023) and recovery efforts such as FEMA aid after natural disasters on racial inequalities over time (Fussell et al., 2010; Peacock et al., 2015; Howell and Elliott, 2018; Aune et al., 2020). For example, by tracking a representative sample of respondents and analyzing household wealth in counties that suffered varying degrees of hazard damage, Howell and Elliot (2018) examined how racial inequality intersects with hazard damage over time. They found that controlling for disaster costs, “the more FEMA money a county receives, the more Whites’ wealth tends to grow and the more Blacks’ wealth tends to decline, all else equal” (p. 1). Moreover, the authors found that White respondents in counties that experienced a relatively low amount of damage (hazard damage amounting to $100,000), experienced an average wealth decrease from 1999 to 2013 of $26,000, but Blacks, Hispanics, and Asians experienced an average increase of $19,000, $72,000, and $21,000, respectively. That said, White respondents that live in counties with a high amount of damage (hazard damage amounting to $10 billion) increased their wealth by, on average, $126,000, while Blacks, Hispanics, and Asians decreased their wealth, by an average of $27,000, $29,000, and $10,000, respectively. In a longitudinal analysis of tornadoes (that is, not climate-related) disasters from 1980 to 2009, Raker (2020) found that disasters lead to an unequal replacement of socially-vulnerable residents: “Impacted neighborhoods become more socioeconomically advantaged in terms of median income and poverty, and they experience an increase in the White population” (p. 670). Since his study does not follow individuals from the impacted communities, he speculates that disadvantaged residents move away from places after a hazard or disaster, and more so in socioeconomically advantaged neighborhoods and areas with the most severe hazards, irrespective of presidential disaster declarations for the impacted area.
Elliot et al. (2020) analyzed racial inequities stemming from federal buyout assistance in flood-prone areas and found that, all else being equal, the Whiter the census tract in metropolitan areas (compared to the surrounding county), the higher the likelihood of participating in the federal buyout program. Notably, the authors found this pattern to be true over time (from the 1990s to 2015). In terms of the speed in which residents returned to New Orleans after getting displaced by Hurricane Katrina, Fussell et al. (2010) found that Blacks were more likely to live in areas that suffered more flooding and thus experienced more severe housing damage, which delayed their return to the city even after controlling for socioeconomic status and demographic characteristics. Peacock et al. (2015) found similar results in Miami after Hurricane Andrew and Galveston after Hurricane Ike, with race, ethnicity, and income being determinants of slower recovery rates and higher losses in Miami and income being the determinant factor in Galveston of higher damage and slower recovery rates. Disasters can also be used to facilitate “climate gentrification.” Aune et al. (2020) found that after Hurricane Katrina, gentrification was more likely to occur in areas with higher elevation and that gentrified areas became less Black, less unemployed, and more White. Racial patterns can even get perpetuated in voluntary managed retreat programs. For example, Elliot and Wang (2023) found that homeowners in communities that were majority White were more likely to stay in place with a higher flood risk and less likely to relocate to areas that were not also majority White.
2.2 Housing precarity in hazard-prone areas
As the effects of climate change continue and intensify, housing stability will be impacted—this is particularly concerning because housing is often determinative of residents’ financial security (Aspen Institute Financial Security Program and Boyd, 2019; Dundon and Camp, 2021). Households that are already in precarious financial situations are unlikely to have the resources to manage the disruption caused by unexpected housing expenses due to coastal hazards including storms and flooding such as having to move or pay for extensive repairs (Neal and McCaro, 2020). Ma and Smith (2020) examined disparities in the damage caused by Hurricane Maria in Puerto Rico by analyzing FEMA damage-severity classifications (i.e., minor, major, or destroyed), along with housing tenure, and income. They found that renters and lower-income households were more likely to have their home suffer damage classified as “major” or “destroyed” than homeowners and higher income households, respectively. Low-income residents have a higher likelihood of living in areas or buildings with substandard infrastructure. In addition to storms damaging housing structures, flooding can be expected to seriously damage the housing stock. Climate change is augmenting and accelerating the affordable housing crisis (Ortiz et al., 2019)3. By 2050, it is projected that the number of affordable housing units exposed to flooding will more than triple (Buchanan et al., 2020) and storm surges are likely to devastate coastal communities and substantially reduce the available affordable housing stock (Hammett and Worzala, 2018). Minority communities are likely to disproportionately bear the burdens of flooding attributable to climate change. For example, Smiley et al. (2022) found that 30%–50% of the properties that flooded with Hurricane Harvey would not have flooded were it not for climate change. The authors also found that the impacts attributable to climate change were most acutely felt in low-income Hispanic neighborhoods. As explored below, while low-income residents are particularly vulnerable in areas that are prone to flooding or other coastal hazards, low-income homeowners and renters are likely to experience flooding, storms, and sea-level rise differently since homeowners are likely to be less mobile and renters tend to have less equity.
2.2.1 Vulnerability to homeowners: constrained mobility and increasing exposure
Notably, due to their immobility and increasing exposure, homeowners in hazard-prone areas may experience substantial diminishing equity. While not limited to coastal hazards, a real-estate industry study in 2021 found that around a third of the housing stock in the US (around 35 million homes) are at “high risk” of a natural disaster (CoreLogic, 2021). The Census Bureau reported that throughout the US in 2015, home equity and retirement accounts accounted for over 60% of households’ net worth (Eggleston and Hays, 2019). This report also reveals vast disparities in net worth across housing tenure with homeowners having a median net worth that was 80 times larger than renters’ median net worth in 2015. The inequality continues across race and Hispanic origin with non-Hispanic Whites having a median household wealth of $139,300 and Asians having a median household wealth of $156,300 (not statistically significantly different from non-Hispanic Whites) as starkly compared to the median household wealth of Hispanic and Black householders, of $19,990 and $12,780, respectively (Eggleston and Hays, 2019). Black households are less likely to stay as owners of their homes when compared to Whites (Choi et al., 2019). That said, the Black householders that were able to keep owning their home had housing wealth of more than $23,500 at the age of about 60 when compared to those that transitioned to renting (Choi et al., 2019). Due to the increasing exposure to coastal hazards, homeowners in the low elevation coastal zone would face diminishing equity since their home values will eventually depreciate when living in that area is no longer viable. As such, there are important implications for intergenerational wealth for low-and middle-income homeowners.
2.2.2 Vulnerability to renters: constraints on housing and climate-induced financial burdens
While renters are often more mobile than homeowners, renters in hazard-prone areas face diminishing access to affordable housing, increasing exposure, and devastating climate-induced financial shocks. Renters are often overlooked in disaster relief efforts, from buyouts to “managed retreat” actions (Dundon and Camp, 2021) and renters are twice as likely to be residents of color. Low-income renters may be excluded from federal disaster aid due to the relief minimums not covering the loss of their property (Wesseler, 2021). For example, while 40% of damaged homes due to Hurricane Sandy were renter-occupied, renters only received 25% of the assistance (Gauthier and Aspen Institute Financial Security Program, 2021). Similarly, only 18% of the renters whose homes were damaged by Hurricanes Katrina or Rita received federal assistance, while 62% of the homeowners whose homes were damaged by these storms received assistance (Gauthier and Aspen Institute Financial Security Program, 2021). Renter-occupied buildings recover more slowly from storms than owner-occupied buildings (Spader, 2017), and studies on the aftermath of Hurricane Ike in Texas show that multifamily and duplex housing units recover more slowly than single-family residential houses (after controlling for the socio-economic status of the neighborhood and the severity of the damage sustained) (Hamideh et al., 2021). People of color are disproportionately renters and disproportionately low-income renters: while only 6% of White households are extremely low-income renters, the National Low Income Housing Coalition estimated 14% of Hispanic households, 18% of Indigenous households, and 20% of Black households to be extremely low-income renters (Aurand et al., 2019).
In addition to the general precarity of renters, the ramifications of extreme weather events can have compounding effects, often leaving the most vulnerable members of society susceptible to homelessness. For example, Ortiz et al. (2019) describe how the aftereffects of Hurricane Michael in the Florida Panhandle were most acutely felt by renters, since almost 75% of the damaged properties were rental homes and the supply shortage of rental homes then caused rents to increase dramatically. Moreover, a local recovery initiative estimated that Hurricane Michael caused more than 10% of residents of Bay County to experience homelessness. Compounding vulnerabilities may also be reflected in, for example, the duration of power outages. Grineski et al. (2023) studied the disparities in the length of basic service disruptions after Winter Storm Uri and found that longer power outages were associated with being Black, renting, and having children. The authors also found that being Black was associated with longer water outages. The authors highlight the need to ameliorate the discrepancies and their corresponding health risks.
2.2.3 Older individuals and their communities are more vulnerable
Like the rest of the US, communities proximate to seacoast are aging. Several studies have contributed to our understanding of these trends by, for example, examining whether coastal zones have an older baseline (Bukvic et al., 2018) and if so, whether they will become disproportionately older in the coming century (Hauer et al., 2022). Other studies have drawn out implications for housing needs and healthcare services to support older adults (Climate Central, 2021; Molinsky and Forsyth, 2022).
Using county-level data in a study of 258 coastal counties, Hauer et al. (2022) project the median age for coastal counties to be about 2 years greater (at 39.4 years) at mid-century and more than 3 years greater (at 47.9 years) in 2100 in comparison to inland counties. They also project that by 2100, the population over age 65 will more than triple the current population, reaching nearly 52 million people (with upper and lower bounds at 30 and 70 million, respectively), increasing the share of population over age 65 from about 1:6 in coastal counties to more than 1:3. Healthcare services and housing will change to support the needs of aging populations and concentrations of older people on the coast are likely to result in vulnerable infrastructure. For example, a study overlaid current locations of senior-living facilities in five high risk states (Florida, New Jersey, Texas, North Carolina, and South Carolina) with the potential to flood under current conditions and projected sea-level rise and found that Florida is expected to be the most impacted by future hazards (with New Jersey taking second place) and is projected to experience a 67% increase in the number of senior facilities exposed to flooding by 2050 (Climate Central, 2021).
Hurricane Ian, which hit Florida in fall 2022, serves as a reminder of the ways in which older adults are at greater risk of the impacts of coastal storms than younger persons: the death toll appears to have hit adults over 65 the hardest (O’Donnell, 2022). Similarly, although individuals over the age of 60 only represented 15% of the population, they accounted for more than 70% of the deaths caused by Hurricane Katrina (Centers for Disease Control, 2023). Results from a meta-analysis of 10 studies show that older adults are much more likely to experience deterioration in a range of mental health outcomes (Post Traumatic Stress Disorder, anxiety, depression) after disasters when compared to younger adults (Siskind et al., 2016). In their review of the literature, Fothergill et al. (1999) show how race and ethnicity intersect prior to, during, and after disasters with additional vulnerabilities such as community isolation, language barriers, and housing and construction patterns. In terms of psychological impacts, one of the studies Fothergill and others reference is Bolin and Klenow (1988) which found that older Black adults recover much more slowly from psychosocial disruption from a natural hazard than older White adults, even when controlling for housing damage.
Older residents are particularly at risk. In a study of 271 counties classified as coastal by NOAA’s 2010 Coastal Watershed Counties criteria (NOAA, 2017) in the 14 states along the Atlanta seacoast, Bukvic et al. (2018) find that residents aged 65 and older are unevenly distributed in the East Coast, with some areas having a significantly higher percentage of older residents living on the shoreline. The authors also find that many of the areas with large older populations have additional characteristics that add to the vulnerability of this age group including lower income, older housing stock, and increased disabilities and noted that the magnitude of these attributes are often different across urban and rural spaces. Like our study, this analysis used census blocks (and block-groups) as the backbone of their assessment of population exposure, but they then selected the top 10 counties (all with more than 20% of their population ages 65 and older) as a basis for case-studies in a single year (2015). Comparing two rural counties (Mathews County, Virginia, and Pamlico, North Carolina), they find that not only do older residents live closer to the shoreline, but they also live in areas with lower income per capita and in older homes. This increases their vulnerability to flood damages because they may end up with “competing priorities between supporting the growing costs of their healthcare that tends to be higher for this age group and investing resources in structural flood proofing and retrofits to meet present-day flood sensitive building codes” (p. 11). Of note, older homes may also be exempt from newer flood-sensitive building codes (especially if their homes were grandfathered in) or from participating in the National Flood Insurance Program which may also increase their flood risk. Their case study of urban counties (Cape May, New Jersey, and Brevard County, Florida) found that, like rural ones, households with older adults tend to concentrate near open water, placing them at much higher risk of coastal hazards. The authors find that urban areas are particularly vulnerable to coastal flooding because of the population density, proximity of critical infrastructure to the shore, and the interdependencies between built, social, and economic systems. In addition to aging buildings and infrastructure, older residents in urban areas also face challenges specific to the urban setting (including overburdened transportation systems, industrial pollution, and a lack of access to affordable housing). Bukvic et al. (2018) use different data for coastal exposures than we do here, measure exposures at only one point in time, and go in-depth on variables that are available at the block-group level but not race or ethnicity. That said, they make clear that urban and rural population exposures and socioeconomic features need to be identified and teased out with respect to older adults. Similarly, the review by Molinsky and Forsyth (2022) on how residential setting matters in the study of aging and climate change, makes plain the importance of disaggregating urban and rural settings for understanding how location and housing can exacerbate or ameliorate the impacts of climate change on the wellbeing of older residents.
3 Method and data
Using spatial demographic methods, we analyze the spatial distribution and demographic characteristics of those at risk in counties with exposed land area. Notably, complementing studies of specific localities or case studies (many of which were reviewed above), systematic studies on populations-at-risk have typically ignored attributes such as urban/rural classification, housing characteristics, race and ethnic composition, and age structure, (notable exceptions include Hauer et al., 2022; Hardy and Hauer, 2018). By using a range of census variables (at the highest spatial resolution that they are available) over several decades, and multiple exposure zones, we estimate who is at risk of seaward hazards such as sea-level rise, coastal flooding, and storms, and, importantly, whether those at risk include disproportionate concentrations of communities of color in exposure zones (both 0–5 m and 0–10 m). In this analysis, exposure, as measured by the LECZ, is a time-invariant proxy measure of proximity to seaward hazards (McGranahan et al., 2007) and because it is derived from time-fixed elevational data (and analytical rules about contiguity and proximity to sea-coast, MacManus et al., 2021), the LECZ exposure zone does not change throughout the study period. That said, census block boundaries change each decade, and thus changes that occur within blocks that make habitation more difficult (e.g., sea-level rise, salt-water intrusion, coastal flooding) would be reflected in the decadal block data (i.e., if the land comprising a census block were fully eroded, it would no longer be present in the data). According to the EPA, between 1996 and 2011 about 20 square miles of dry land and wetland was converted to open water along the Atlantic coast, with at least half of the lost land being tidal wetlands (Environmental Protection Agency EPA, 2014).
While the core-unit of analysis is census blocks, we will summarize those data in more policy-relevant units such as states and counties. County boundaries are largely unchanging during the period of study (and we use equivalency or “crosswalk” files where necessary) and state boundaries are constant during the period of study, making these units useful for aggregation and for temporal comparison. This study is limited to any state in the lower 48 states (and DC) with land in the LECZ, herein “coastal states”. (We recognize that much land area and population in Hawaii, Alaska, Puerto Rico and other unincorporated territories are at risk but defer a close analysis of those localities for another study.) The study uses publicly available datasets (CIESIN and CIDR, 2021; Manson et al., 2022a; Manson et al., 2022b; Manson et al., 2022c; Manson et al., 2022d), as described below.
3.1 Method
To construct estimates of exposure, we use simple spatial overlays: by overlaying data on exposure over the census blocks (for each decade, as they change with each census with [for the entire US] around 7 million blocks in 1990, more than 11 million blocks in 2010, and somewhat more than 8 million blocks again in 2020). Census blocks are not delineated based on population and while many blocks have no population (Rossiter, 2011), the block-groups, the next higher-order geography, in 2010, were designed to contain between 600 and 3,000 persons. In other words, blocks are small both in terms of area and population. Unlike survey-based census data products, such as the American Community Survey which are available for block-groups (which is one unit coarser than blocks) and higher-order spatial units, the block-level data that make up this analysis are census head counts and, therefore, are not subject to margins of error. Because the census block boundaries change every decade, we summarize the block estimates of exposure to the county (and state).
We designate a block as within the LECZ if any land area is located in (i.e., spatially intersects with) the LECZ, a zone of up to 10 m contiguous to seacoast (CIESIN and CIDR, 2021; MacManus et al., 2021). Estimates include blocks with land area only in the 0–5 m LECZ, blocks with land area only in the 5–10 m LECZ, blocks with land area in both the 0–5 m LECZ and 5–10 m LECZ, and blocks with all land area outside the LECZ. The rationale for dividing the LECZ into 0–5 m and 5–10 m zones was to be able address differential exposure within the LECZ. In global studies which use gridded data (and assume even distributions of population across the grid cell), the allocation to an LECZ zone is mutually exclusive (MacManus et al., 2021). Since our study is built on much finer-resolution census blocks, we do not use ancillary data or advanced reallocation methods—a technique commonly used for coarser units as well as gridded population estimates (Zoraghein and Leyk, 2019; Wan et al., 2022)—at the sub-block level to further apportion population within blocks.
Of all the blocks in the coastal states, 3.5% intersect the 0–5 m LECZ, 2.6% intersect the 0–5 m and the 5–10 m LECZ, and 7.6% intersect only the 5–10 m LECZ (for a total of nearly 14% of all blocks)4. We cannot say that exposure is more imminent for blocks in the 0–5 m zone than those that have land area in the 0–5 m and 5–10 m zone, but we can say that both of those types of blocks face higher risk than blocks whose land area is only in the 5–10 m zone; and of course, that blocks with any land area under 10 m face greater exposure than blocks outside of the LECZ (greater than 10m, not contiguous to coast).
In 2020, we estimate that 91.5% of the population living in a census block that intersects the LECZ is classified as urban as compared to the 80.7% of the continental US. In the coastal states, 54% percent of all blocks are classified as urban and about 46% are rural. Yet, the share of urban blocks in the LECZ is much greater than in rural areas: 3.8% intersect the 0–5 m LECZ, 3.0% intersect the 0–5 m and the 5–10 m LECZ and 11.2% intersect only the 5–10 m LECZ (for a total of nearly 18% of all urban blocks). In rural areas, these shares are 3.1%, 2.2%; and 3.2%, respectively, for a total of 8.6% of all rural blocks in coastal states. This decomposition further highlights the need to stratify our analysis by urban and rural.
Using Florida—since we will show that it leads the nation in having both the greatest number and share of its population in the LECZ—as an example to show our input data in Figure 1, we show a spatial overlay of the input data for this study: 1) the LECZ and 2) population (shown as density) as an example of a census variable available at the block-level and 3) county boundaries. The inset of areas around Lake Okeechobee shows an example of the fine-grained block-level boundaries used in this analysis for all census variables. The LECZ data is based on satellite inputs from the Shuttle Radar Topography Mission and subsequently enhanced to address “tree-height” bias (Multi-error Removed Improved Terrain DEM (MERIT)) for a single point in time, 2000; see details on the original data in Yamazaki et al. (2017) and as used to construct the LECZ in MacManus et al. (2021). Also shown in an inset is the urban-rural classification, designated by the Census Bureau at the census block level (Ratcliffe, 2015), which we use to stratify our results. These overlays allow us to tabulate exposures stratified by urban and rural areas and to determine whether patterns of population change are different in urban and rural areas by race and Hispanic origin—notably, to ask whether there has been population loss in coastal rural areas and in contrast, gain in coastal urban areas—and whether such changes are similar in magnitude to urban and rural areas outside the LECZ. (See Supplementary Figure S1 showing population by race and Hispanic origin with the LECZ and urban areas overlaid.) This process is repeated for each variable of interest.
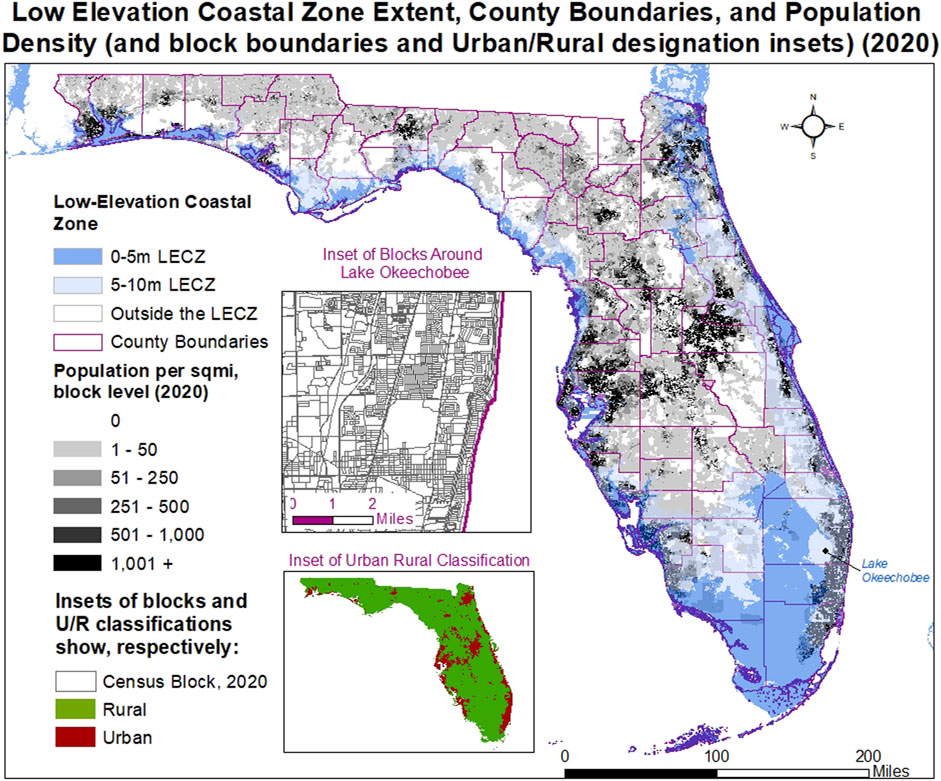
FIGURE 1. Population Density (based on census blocks) and Low Elevation Coastal Zone (LECZ), Florida (2020); inset maps show detail of input census block units and urban/rural classification.
This study has some known limitations. Census data represents the night-time de jure population on April 1. For coastal communities that may have seasonal residents (for example, “snow-birds” in Florida5), this analysis is likely to omit them6. Additionally, since the LECZ used was measured at one point in time, it does not capture potential fluctuations in exposures to coastal hazards or modifications to the coastline itself though, as noted above, if land area has been lost (Environmental Protection Agency EPA, 2014), it would not be included in the block-level data in a given census year. By using “intersection” as the method for including the population of a block in our zone of interest, our estimates of exposure can be considered somewhat inclusive (i.e., more so that applying a narrow criteria such as requiring a block to be “fully contained within” the LECZ) but these are almost certainly less upwardly biased when compared to estimates based on coarser geographic units such as tracts or counties. That said, it is important to note that the average area of a census block in the LECZ is very small (on average, 0.0134 square mile, for 2010) and much smaller than blocks outside of the LECZ (on average, 0.2422 square mile); and within the LECZ urban blocks, where the overwhelming share of the population lives, are much smaller (0.0039 square mile) compared to rural blocks (0.0368 square mile). Another limitation of this analysis is that not all possible cross-tabulations are made available in the block-level data (for example, we do not know age distributions by race, or housing tenure by age) or fuller permutations that would be available from census microdata samples (which are available only at much coarser spatial units). Use of coarser geographic units would have themselves required an allocation rule (such as areal weighting), and perhaps additional ancillary data, which would bring additional assumptions and possible limitations (Zoraghein and Leyk, 2019).
3.2 Demographic and socio-economic data
This study uses the finest spatial units of the US Census (blocks) from the decennial census from the past four censuses, to describe changes along a range of demographic and housing characteristics, downloaded and publicly available from IPUMS NHGIS (Manson et al., 2022a; Manson et al., 2022b; Manson et al., 2022c; Manson et al., 2022d). As noted above, only a few basic demographic and housing variables are available at the block-level, and the measurement of key variables (or how they are tabulated) change from decade to decade, but no study has yet to use these data to more fully understand patterns and changes in coastal vulnerability. Table 1 indicates the variables we used, indicating where transformations were necessary to make themes consistent across the four decades. Population counts are available, and measured consistently, in all four decennial censuses, but it is the only variable for which that is the case, therefore below, we describe changes in all other variables available and how we harmonize them.
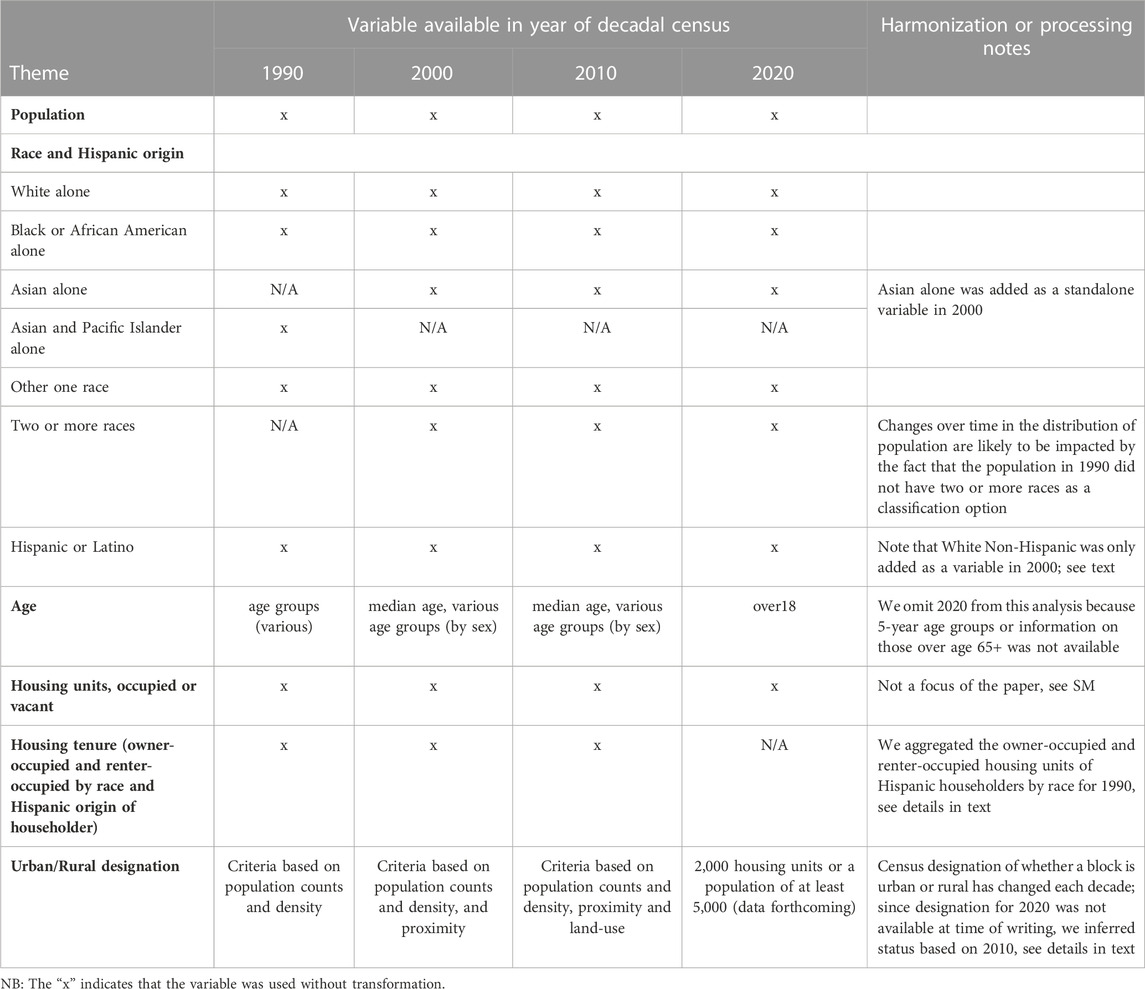
TABLE 1. Block-level Census variables used in analysis by year.
3.2.1 Variables, recodes and harmonization
3.2.1.1 Urban/rural
We use the census designation of urban and rural for each decade, even though the urban definition has changed in each decade (Ratcliffe, 2015; Jones et al., 2020). This designation for the 2020 census adopts a criteria based on housing (2000) or population (5,000) count minima for the 2020 census products (Federal Register, 2022a; Federal Register, 2022b), though the release of these data for blocks was not available as of mid-2023 and therefore was not available for use in this analysis. These definitional changes represent the Census’ best effort to capture the intrinsically dynamic construct of urbanization, given the technical and methodological constraints at each census. Since the urban/rural designation was not provided in the Public Law (PL) release of 2020 block level data, we extrapolated the designation by using the urban/rural designation used in the 2010 U.S. Census at the block level. We converted the 2010 polygons of the Census blocks into point format by estimating each block’s geographic centroid; these features included a designation of U (1) and R (0) status. We then used a spatial join of the 2010 centroids to the 2020 block polygons. The overlay produced the count of all points and the sum of urban points because the rural points have a value of 0. For census block polygons with no overlapping points, we then used a spatial join to calculate the distance to the nearest point. We then created an “urban_fraction” variable for the 2020 polygons. If the count was 1 (meaning only one point overlapped), we coded those 2020 polygons as equal to the 2010 urban/rural status of the centroid, with urban points recorded as 1 and rural points recorded as 0. If the count was 0 (meaning there was no centroid from 2010 that overlapped), we coded those 2020 polygons as equal to the urban/rural status of the closest 2010 centroid, with urban points recorded as 1 and rural points recorded as 0. The remaining 2020 polygons had a count of more than 1 (meaning more than one point overlapped). For these polygons, we calculated the urban fraction (that is, the sum of urban points/count of points). Note that this was possible because rural points count as 0. Finally, we created a dichotomous text field to code the polygon as rural or urban. If the “urban_fraction” was 0, the 2020 polygon was recoded as rural. If the “urban_fraction” was 1, the 2020 polygon was recoded as urban. If the “urban_fraction” was a fraction, it was recoded as rural if it was below 0.5 and as urban if it was greater than or equal to 0.5.
3.2.1.2 Total population
Total population counts are consistent across the four decennial censuses we examine in this paper (ET1001 in 1990, FXS001 in 2000, H7X001 in 2010, and U7B001 in 2020)7.
3.2.1.3 Race and ethnicity
The collection of data on race and ethnicity has changed frequently in the history of the census, complicating comparison over time (Humes and Hogan, 2009; Strmic-Paul et al., 2018). We compare the population for single race, White and Black as well as the Hispanic population (of any race) in 1990 (EUY001, EUY002, EU0001), 2000 (FXW001, FXW002, FXZ001), 2010 (H7X002, H7X003, H7Y002), and 2020 (U7B003, U7B004, U7C002) because they are consistent across the four decennial censuses we examine in this paper. In 1990, the Asian (EUY004) population was combined with the population of Pacific Islanders but starting in 2000, this single variable was split into two: Asian alone (FXW004) and Native Hawaiian and Other Pacific Islander alone (FXW005). While the 1990 census (and subsequent decades have) had a variable for individuals to identify as belonging to some other single race (EUY005), the variable for “two or more races” (FXV002) was only introduced in the 2000 census. Since it was not available in 1990, we must understand the change in population over time for any single race within the broader context of an increasing number of the population identifying as belonging to multiple races (Jones and Bullock, 2013; Alba, 2018). When the variable was introduced in 2000, 2.6% of the population (a little over 4.8 million people) selected this category but by 2020, 11.2% of the population (more than 24 million) identified as belonging to two or more races.
3.2.1.4 Age
The population distribution by age groups is provided in the 1990, 2000, and 2010 censuses. We were able to compare the age distribution of the population over time and subset the data to analyze changes in the spatial distribution of the population over 65 years of age. The age analysis does not extend to 2020 because the 2020 block-level census data do not include information on the distribution of people based on age groups (other than over age 18, that is, the legal age for voting) or even the median age. Median age is reported for 2000 (FYT001) and 2010 (H77001) since the variable was provided for both years, but the 1990 census provided the total population for different age groups (ET3001 to ET3031) and did not provide the median age. Since the most that could be calculated based on this information is an estimated average based on the midpoints of the age groups, we decided not to compute the median age for 1990. We report results for the full age distribution and proportion over age 65 for 1990 (ET3027 to ET3031), 2000 (F15001), and 2010 (H76020 to H766025 and H76044 to H76049) and place results with median ages for 2000 and 2010 in the SM.
3.2.1.5 Housing
We were able to compare owner-occupied and renter-occupied housing units with White, Black, and Hispanic (any race) householders for 1990, 2000, and 2010. Of the decennial censuses examined by this study, the 1990 census was the only census to subdivided owner-occupied and renter-occupied housing units with Hispanic householders by race (i.e., White Hispanic, Black Hispanic, American Indian, Eskimo or Aleut Hispanic, and other race Hispanic householders). For consistency, we aggregated the totals for owner-occupied and renter-occupied housing units with Hispanic householders of any race (i.e., aggregating ESC001 to ESC005 for owner-occupied housing units and aggregating ESC006 to ESC010 for renter-occupied housing units). Both the 2000 and 2010 censuses included single variables for renter-occupied and owner-occupied housing units with a Hispanic householder. The decennial censuses for 1990, 2000, and 2010 each provide single variables for renter-occupied and owner-occupied housing units with White and Black householders. A caveat to this analysis is that the 1990 census only included classifications by a single race. It was only in 2000 that the census began including a classification for two or more races. As such, housing units were not subdivided by householders that identified as having two or more races for 1990 but identified as such in 2000 and 2010. As discussed above, there is an increasing percentage of the population that identifies as belonging to two or more races. The 2020 census did not provide any information on renter-occupied or owner-occupied housing units. That said, the number of total, occupied, and vacant housing units was provided for all decadal censuses and analyzed in this paper. These variables are briefly analyzed in the SM. We do not focus on these variables for our analysis because we seek to highlight the vulnerabilities associated with differing housing tenure across different races and Hispanic origin.
4 Results
We first describe the patterns and change in the exposure for all coastal states with land area in the LECZ. Because we find that population exposure in the LECZ is highly concentrated, we further focus on areas of high exposure and describe patterns and change in urban and rural areas by race and ethnicity, median age, and housing tenure (renter vs. homeowner) by race and Hispanic origin of householder. As noted above, we have the ability to examine population by elevation strata (that is, whether the block falls only in the 0–5, both 0–5 and 5–10 m, only in 5–10 m LECZ, or is fully outside the LECZ); in the body of the paper we report most results for the full LECZ (0–10 m) and place a discussion of the different elevation zones into the SM. Because we restrict this analysis to the lower 48 states and DC, we refer to it interchangeably as the continental US. Of which, as we show below, 22 states and DC have land area in the LECZ, which we refer to as coastal states.
4.1 Concentration of population exposure in the LECZ
As of 2020, over 124 million people live in US counties (in the lower 48 states and DC) with land area in the LECZ. In other words, 37.4% of the continental US population lives in a county that has land area in the LECZ.8 A total of 364 counties of the approximate 3,100 in the lower 48-states have any land area in the LECZ. We estimate that more than 34 million persons (or about 1 out of 10 people in the continental US) live in the LECZ, as shown in Table 2. The population exposed is even more concentrated: In 2020, close to half (48.12%, representing 16.3 million persons) of the total population exposed is concentrated in 25 counties, with over 22% (7.6 million) of the total population exposed concentrated in 5 counties. The county with the highest population exposure, Miami-Dade, FL, contains more than 7.5% of all people exposed, echoing the global phenomena that coastal regions are disproportionately urban, and a point we will investigate further below. As can be seen in Table 2, the total population in the US that lives in the LECZ increased by 8.4 million people in the 30-year period from 1990 to 2020. This increase accounts for almost a quarter (24.9%) of the total population at risk in the US in 2020 (34 million).
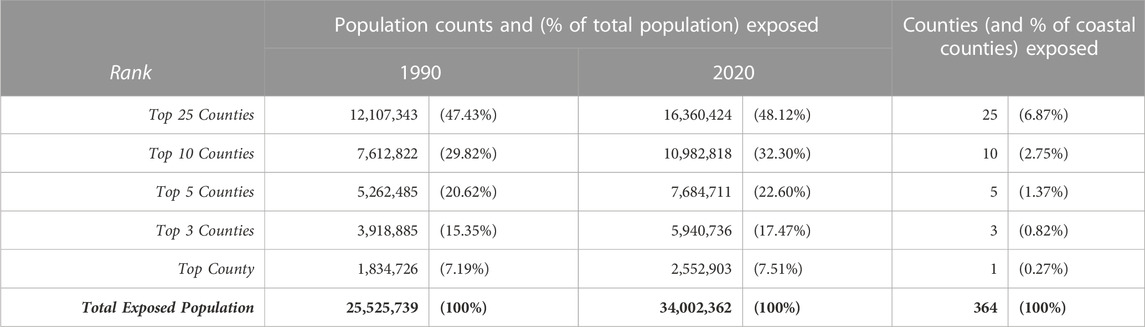
TABLE 2. Concentration of Population Exposure in the 0–10 meter LECZ (1990 and 2020), top 25 counties.
Even within the LECZ, states vary in their population in the LECZ. For example, Table 3 shows that in 2020, almost 57% of the total population living in Florida live in the LECZ, 36% of the total population living in the LECZ of the continental US reside in Florida, and 10% of the total population living in coastal states reside in Florida. (Respectively, the 2020 population and share of population within the LECZ by state; the share of each states’ LECZ population when compared to the US LECZ population; and the share of the coastal state as a fraction of the total population of all coastal states. The last column of Table 3 provides some context for evaluating the state shares in the LECZ of the country as a whole, as in the example for Florida.) Twelve states have more than 1:10 persons residing in the LECZ (all of those bordering the Atlantic sea-coast, except New Hampshire, as well as Louisiana).
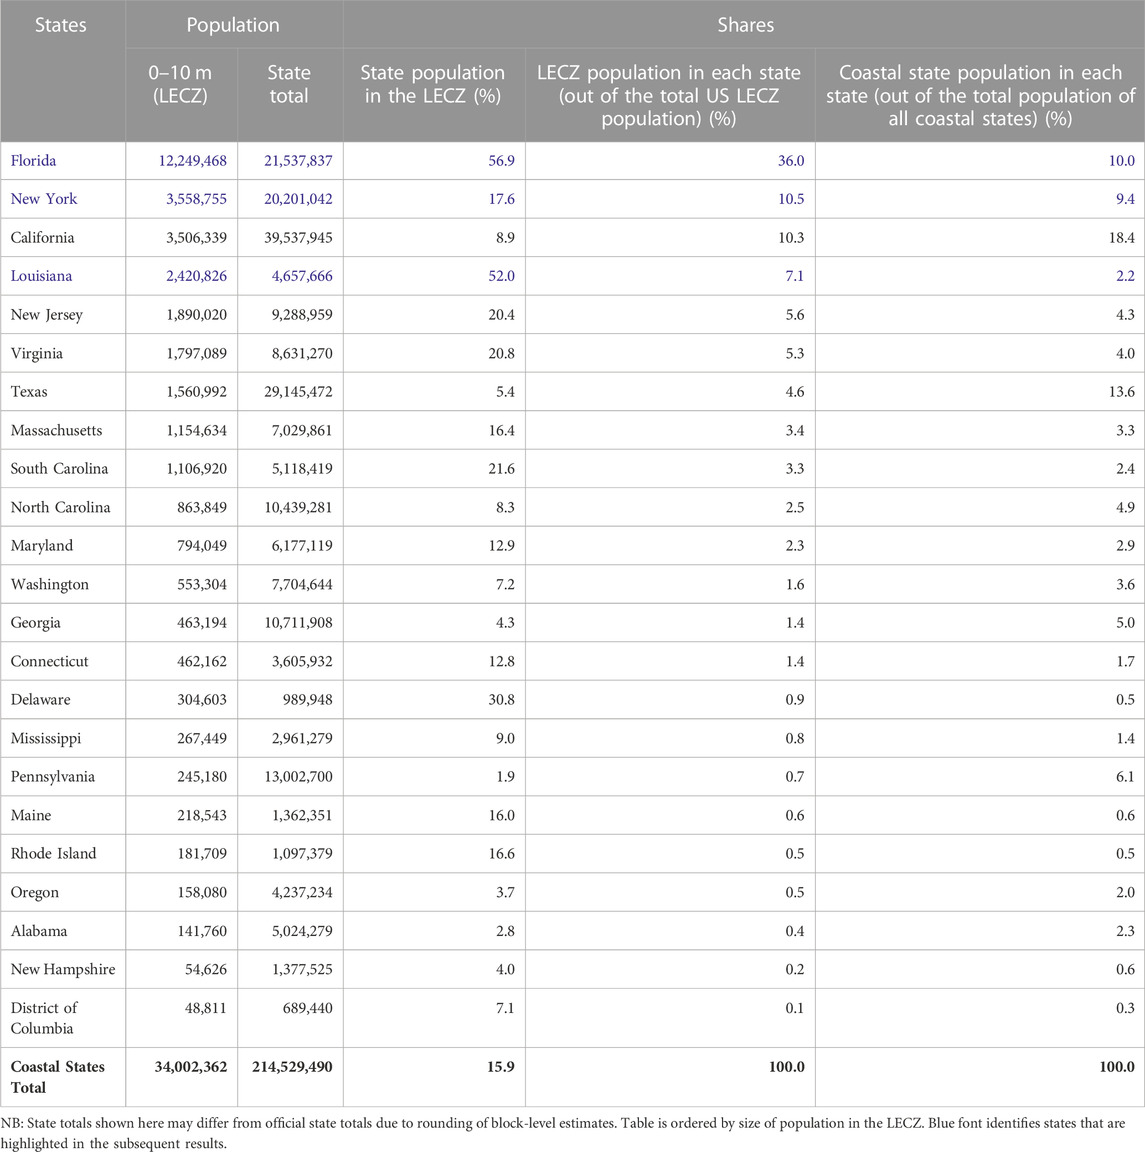
TABLE 3. Population counts and shares within the LECZ by state, 2020.
Figure 2 identifies the top 25 counties in the US with the highest population exposure in the 0–10 m LECZ. It is noteworthy that these top 25 counties are located in only 9 states and over half (14) of the top counties are in only 2 states (Florida and New York). While Florida has long been recognized as facing considerable seaward hazards and frequent tropical storms in the national discussion (USGCRP, 2018), there is increasing attention to New York and the northeast coast as also having the potential of having such future exposures (Reed et al., 2015; Garner et al., 2017; Solecki and Rosenzweig, 2019; Woodruff et al., 2021). Only two counties that are in the top 25 by population exposure in 2020 decreased in population from 1990 (Jefferson Parish, LA and Orleans Parish LA, making them the second and third most populous counties, respectively, in the state, from the second and first rank). Of the top 25 counties by population exposure in 1990, five decreased in population by 2020 (Jefferson Parish, LA; Orleans Parish, LA; Orange County, CA; Norfolk City, VA; and San Diego County, CA).
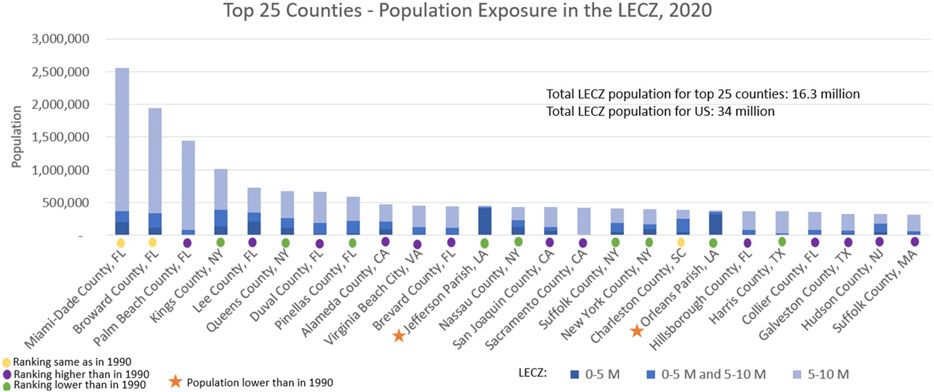
FIGURE 2. Top 25 US counties with highest population exposure in LECZ (2020).
Another important way to view vulnerability is to identify counties where most of the population is exposed. Figure 3 shows the 49 counties in which over 95% of their 2020 population resides in the LECZ: this represents over 8.5 million people and presents a different list of vulnerable counties than those found in Figure 2. Of this highly exposed subset, over one-third are parishes (i.e., counties) in Louisiana. Importantly, many of the Louisiana parishes (including the populous Orleans and Jefferson parishes) have much more than half of their population in the 0–5 m LECZ, in part because Louisiana is situated at the mouth of the Mississippi Delta9. Both perspectives—populations totals and shares at risk—matter for developing adaptation strategies, including in some areas the need to permanently move from the area (Vinke et al., 2020). Notably, more than half of the population of both Florida and Louisiana resides in the LECZ (Table 2). Given the disproportionate exposure in Florida and Louisiana, as well as New York (the second highest state in terms of persons at risk), we disaggregate some of the remaining results for those states in particular.
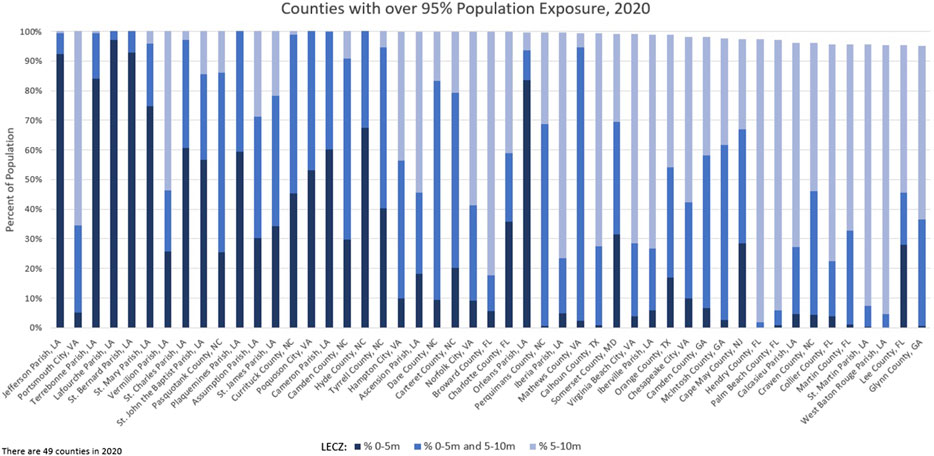
FIGURE 3. US counties with over 95% of their population residing in LECZ (2020).
Change over time analysis seeks to identify trends in population exposure in the LECZ. Figure 4 shows the total population living within and outside the LECZ, from 1990 to 2020: panel A shows that the urban population has risen from about 22 million to 31 million persons (also see Supplementary Table S1), representing a small decline proportionately from 18% of all urban residents in coastal states to 17.3%. The rural population in the LECZ remained close to 3.4 million persons in 1990 and 2020 though this represents a decline from 9.8% to 9% of the share of the rural population of coastal states. For context, panel B shows that populations have grown both inside (by close to 50 million persons) and outside of the LECZ (by about 7.5 million persons) in coastal states; and panel C shows the changes by urban (54 million persons) and rural (3.5 million persons) areas, both of which increase in coastal states from 1990 to 2020.
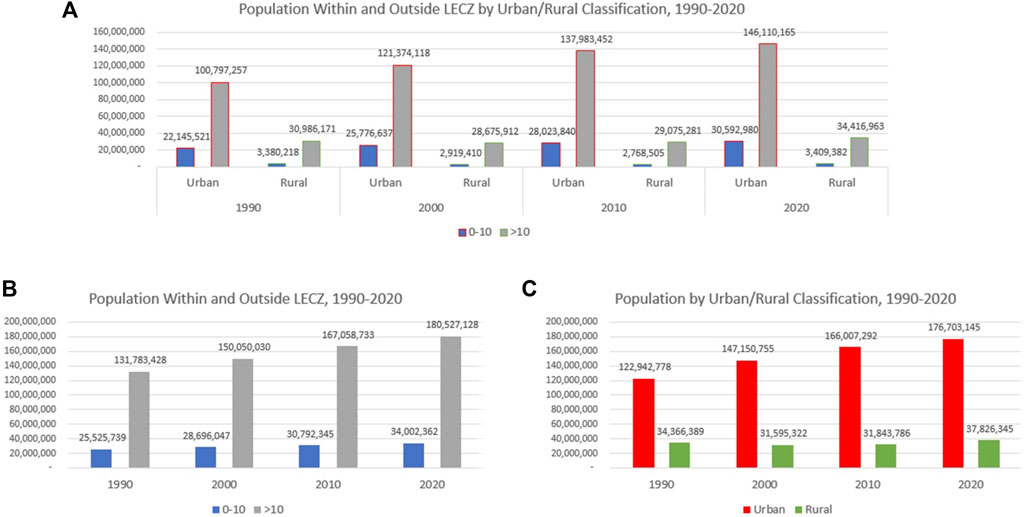
FIGURE 4. Coastal states population (A) within and outside the LECZ by urban/rural classification, (B) within and outside the LECZ, and (C) by urban/rural classification, 1990–2020.
Importantly, the urban population consistently grew at higher rates inside the LECZ (2.35% for 2000–2010 and 0.88% for 2010–2020) than outside of it from 2000 to 2020, (1.28% for 2000–2010 and 0.57% for 2010–2020), reversing the pattern from the decade prior (in which population grew at 1.52% in the urban LECZ, but 1.86% in urban areas outside of it), as shown in Figure 5. Rural population growth in the LECZ follows the same general pattern as seen outside the LECZ—population decline or little growth from 1990 to 2010 but more than 1.5% annual growth in the period 2010–2020; though from 1990 to 2000, the rate of population loss is greater in the LECZ and from 2010 to 2020, the rate of rural population growth is higher inside the LECZ. This rural pattern is seen in Florida, New York and Louisiana, but with notably higher rates of rural population decline in 1990–2000 and 2000–2010, and of rural population increase in the LECZ in 2010–2020. On net over this 30-year period, the rural population in the LECZ increases in absolute terms in Florida, whereas it declines in Louisiana and New York (Supplementary Table S2). The urban population growth rate is higher in all periods in the LECZ in Louisiana, and in New York in the period 2000–2020. But in Florida, urban annual population growth is somewhat lower in the LECZ than outside of it in 1990–2000 and 2010–2020 but higher in the intervening decade (2000–2010). In absolute terms, urban areas in the LECZ have gained population in all three states over the 20-year period and notably in Florida, by adding another 4 million urban residents to the LECZ (Supplementary Table S2). These overarching patterns set the stage for understanding changes in urban and rural areas by race and Hispanic origin, to which we turn next.
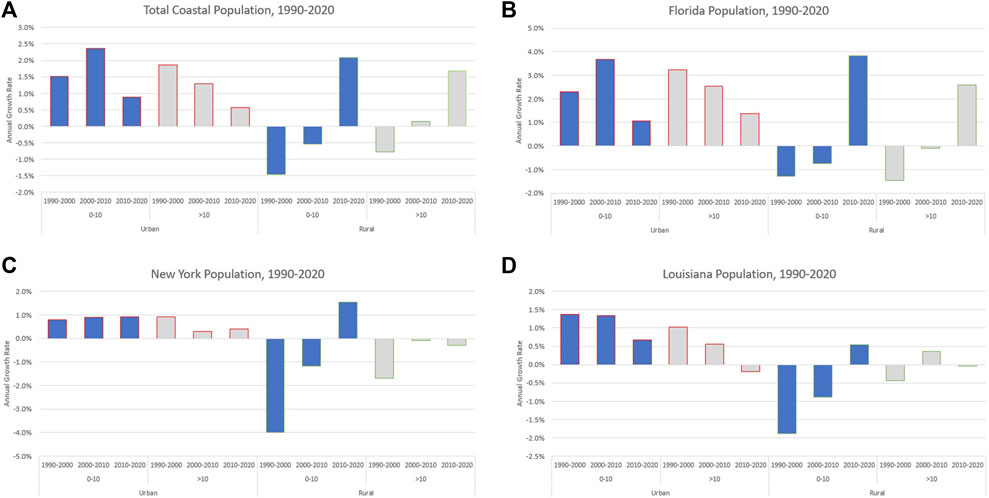
FIGURE 5. Annual growth rates, 1990–2020, for coastal states population within and outside the LECZ by urban/rural classification for (A) coastal states, (B) Florida, (C) New York and, (D) Louisiana.
4.2 Population exposure by race and Hispanic origin
Extending the analysis of annual population growth to population subgroups, we first consider population composition distribution by race and Hispanic origin10, as background to understanding differential growth (Supplementary Table S1 for 1990 and 2020, and Table 4 for 2020 only). The proportion of the urban White population living in the LECZ is slightly higher than the coastal states urban average (18.3% in 2020 as opposed to 18% in 1990) and declining in absolute numbers (16.6 million in 1990 to 16.4 million in 2020)11. Blacks are disproportionately found in the urban and rural LECZ, but in declining proportions from 1990 to 2020, and those identifying as two or more races (not available in 1990) are disproportionately found in the urban LECZ. The size of the Hispanic population in the urban LECZ grew by about 3.5 million in this period. A much smaller absolute increase was found in the rural LECZ, but this is notable against declining Black (and little change in the White rural LECZ) populations. Hispanics are somewhat underrepresented in both the urban and rural LECZ in 1990 and 2020. It is also notable that the shares of Hispanic and Black population in the rural LECZ are declining more so than those classified as White alone.
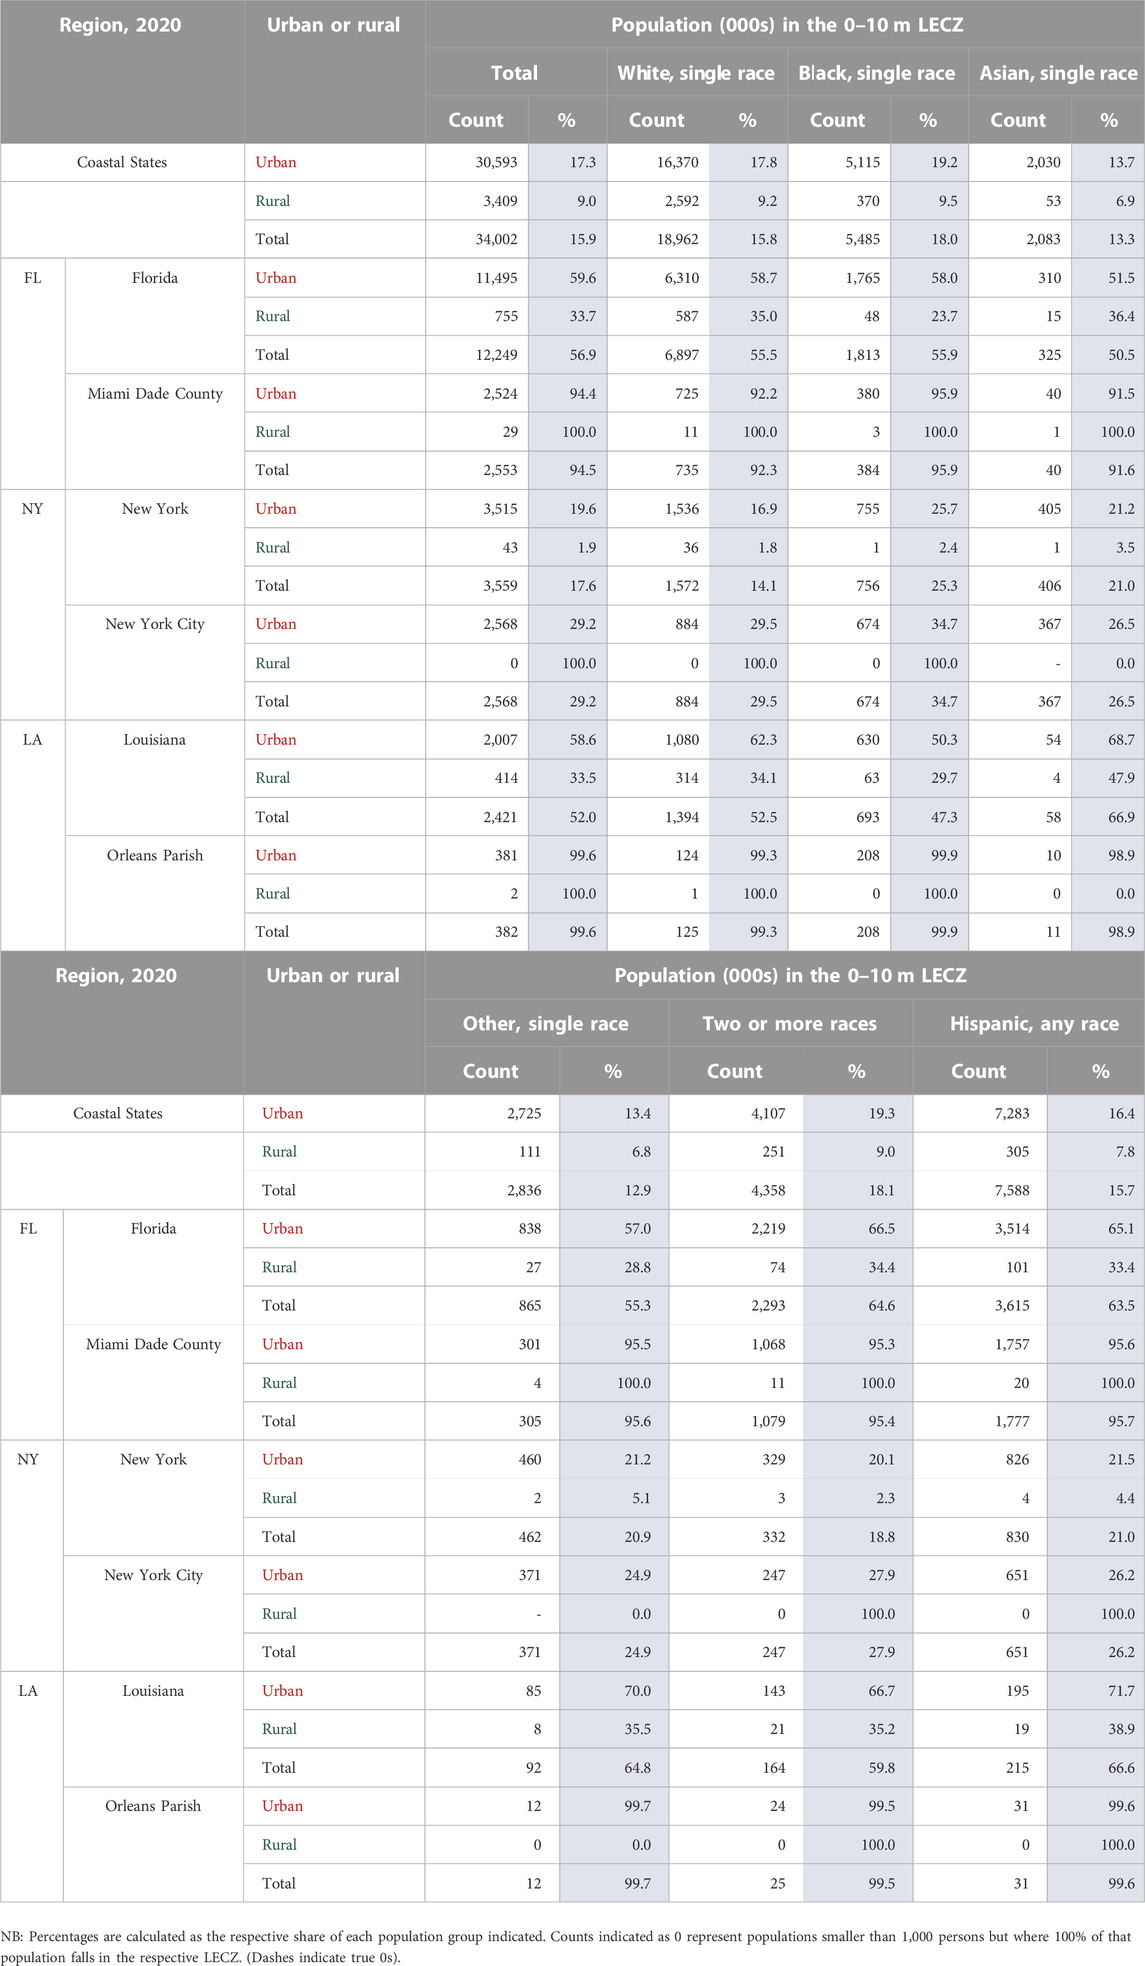
TABLE 4. Urban and Rural population totals (000s), by race and Hispanic origin, and percentages in the 0–10 m LECZ of all coastal states, Florida, New York, Louisiana, Miami-Dade County, New York City, and Orleans Parish, 2020.
Turning to the growth rates, Figure 612 shows that the White population largely followed the same pattern as that of the total population from 1990 to 2010. However, while the total population has been increasing in urban areas since 2010, the White population has declined in urban areas (both within and outside the LECZ) but, similar to the trends for the total population, has grown in rural areas with growth in the LECZ outpacing the rural areas outside the LECZ. The Black population also followed a similar pattern to the total population from 1990 to 2010. From 1990 to 2000, the Black population grew in urban areas and decreased in rural areas, increasing fastest outside the urban LECZ and decreasing fastest inside the rural LECZ. While the growth rates remained negative in the rural areas from 2000 to 2010, the rates within the urban areas saw a shift with the growth rate within the urban LECZ outpacing the growth rate outside the urban LECZ. In 2010, there was another shift and the Black population experienced growth in rural areas, with the fastest growth occurring in rural areas outside of the LECZ and, while still positive, the growth within the urban LECZ diminished. While Whites and Blacks have experienced population growth and decline at different times in different places in the past 30 years, Hispanic populations have consistently grown in urban and rural areas and within and outside the LECZ since 1990. From 1990 to 2010, Hispanics experienced more growth within urban areas than in rural areas and from 2000 to 2010, Hispanics experienced the highest growth rate in the urban LECZ at over 7% per annum (more than double that in urban areas outside the LECZ). While urban population growth for the Hispanic population remained higher in the LECZ than outside it from 2010 to 2020 (though at less than half the rate of the decade prior), this recent decade was marked by annual population growth above 5% in rural areas, both within and outside the LECZ.
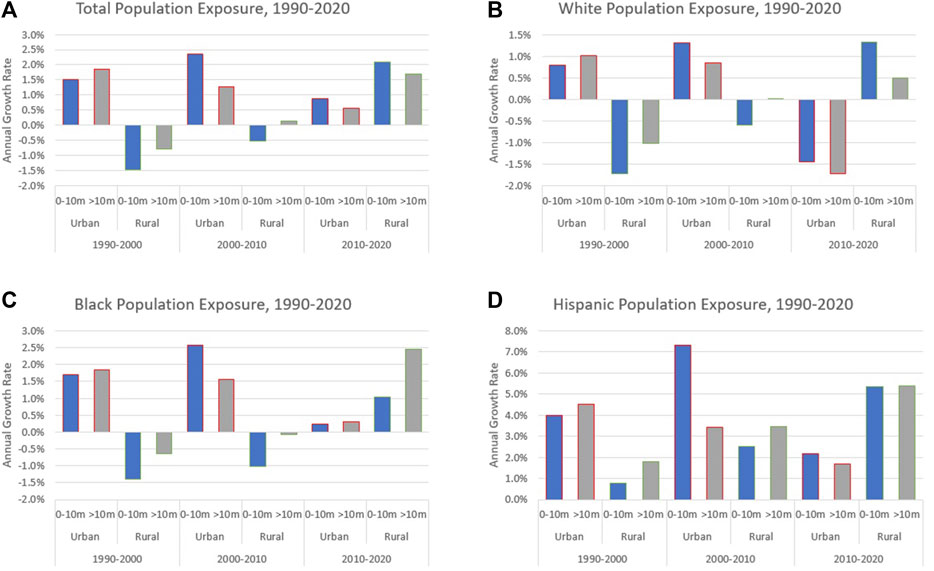
FIGURE 6. Annual growth rates, 1990–2020, for coastal states population within and outside the LECZ by urban/rural classification for (A) coastal states, by race and Hispanic origin (B) Whites, (C) Blacks and (D) Hispanics.
There is a good deal of heterogeneity by state in the growth of population, stratified by urban and rural, and race and ethnic subpopulations, in and outside of the LECZ. For example, (as shown in Supplementary Figure S2) within the LECZ in Florida, the Black urban population grew from less than 900,000 in 1990 to 1.7 million in 2020, in comparison to outside the LECZ which grew from around 600,000 to 1.2 million; in contrast, the urban White population, respectively in this time period grew from 5.9 million to 6.3 million in 2020 in the LECZ and 3 million to 4.4 million outside of the LECZ. (Supplementary Figures S2A–H provides these state-specific estimates for changes in the population by race and Hispanic origin from 1990 to 2020.)
Given the disproportionate urban nature of the LECZ and the fact that communities of color are more likely to live in cities, in Table 4 we estimate the population by race and Hispanic origin in the LECZ in coastal states in 2020, and the three aforementioned states and one city or county at risk: Florida and Miami-Dade County, Louisiana and Orleans Parish, New York and New York City (i.e., the five boroughs that comprise it: Bronx, Kings, New York, Richmond, and Queens counties)13.
Whites are overrepresented in the rural LECZ of Florida and Louisiana. Blacks are overrepresented in the urban LECZ of New York State and all three city/counties. Hispanics are overrepresented in the urban LECZ of Florida and New York, and Miami-Dade County and Orleans Parish (but not New York City, where 1:4 Hispanics live in the urban LECZ). Asians are underrepresented in both the urban and rural LECZ except in Louisiana where they are overrepresented in both the urban and rural LECZ. Over 4 million urban persons identify as two or more races, making such individuals overrepresented in the urban LECZ of coastal states, as well as in urban areas in Florida and Miami-Dade County, New York, and Louisiana. The racial and ethnic composition of states vary, but this evidence confirms that communities of color are disproportionately residents of the urban LECZ.
4.3 Housing vulnerability: who owns or rents in the LECZ
In 2020, 17.6% (15.7 million) of all housing units in the coastal states were located in the LECZ and more than 25 million new housing units were created from 1990 to 2020 (Supplementary Table S3). While the urban housing growth is faster outside the LECZ, vacant housing units within are on the decline, suggesting competition for housing in the urban LECZ is high and may exclude the poor (Supplementary Figure S3). (See Supplementary Figure S3 for information on total, occupied, and vacant housing units, along with their annual growth rates.) In Figure 714, we look at housing units by tenure (renter-occupied and owner-occupied) and householder race and Hispanic origin and by urban/rural classification in 201015, and show, for example, that 17.7% of urban housing units (panel C) and 8.9% of rural housing units (panel D) are located in the LECZ.
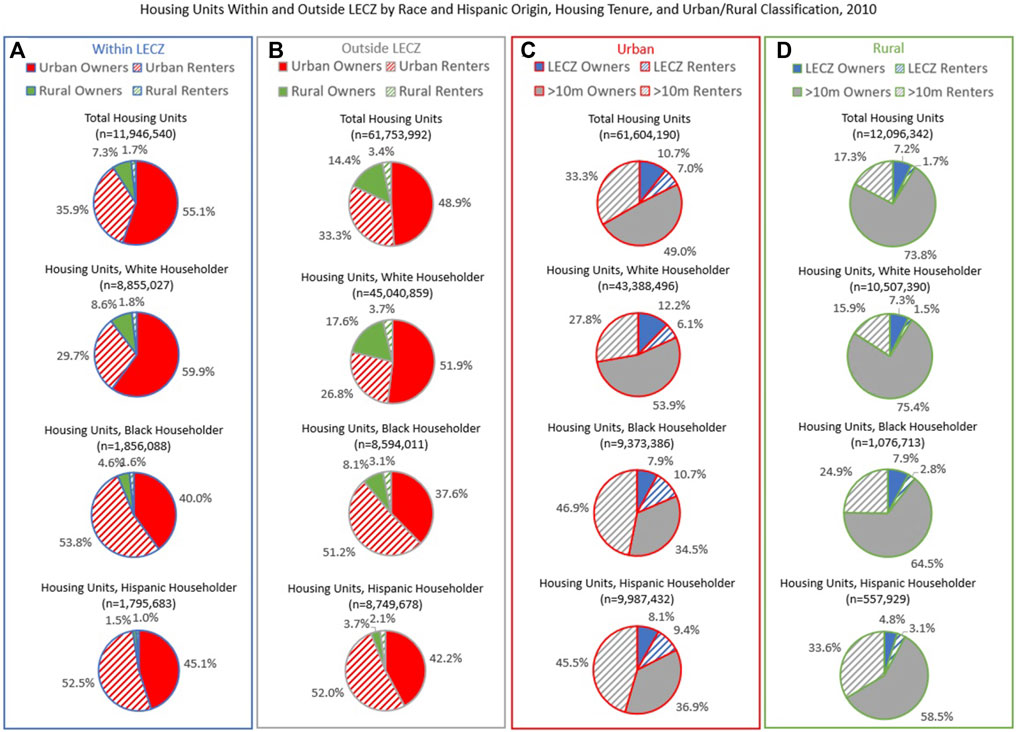
FIGURE 7. (A–D). Housing Units, 2010, for all coastal states, by race and Hispanic origin, and housing tenure, comparisons organized by (A) within vs. (B) outside LECZ and by (C) urban vs. (D) rural classification.
In the coastal states under study, White householders were much more likely than Black and Hispanic householders to own their own homes (Figures 7A, B). In 2010, almost 70% of White householders owned their home (inside and outside the LECZ), but only around 45%–47% of Black and Hispanic households owned their home (inside and outside the LECZ) (Figures 7A, B). White householders were much more likely to own than Black and Hispanic householders even when disaggregated by urban/rural classification and within and outside the LECZ (as in, this held true for housing units within and outside the LECZ as well as for housing units in urban and rural areas) (Figures 7A–D). Conversely, Black and Hispanic householders were substantially overrepresented in renter-occupied housing units with 55.5% of Black and 53.5% Hispanic households being renters in the LECZ, and 54.3% of Black and 54.1% of Hispanic households being renters outside the LECZ, in comparison to 30.8% of Whites within the LECZ and 30.5% of Whites outside the LECZ (Figures 7A–D). Renting in the LECZ places households in particularly precarious conditions that must be understood in tandem. When the data is disaggregated, we find that, for example, Black (1.96x) and Hispanic (1.83x) householders were almost twice as likely than Whites to live in urban renter-occupied housing units within the LECZ (shown in Supplementary Table S5A).
We have disaggregated the distributions of housing units for Florida (Supplementary Figures S4A–D), New York (Supplementary Figures S4E–H) and Louisiana (Figures 7I–L) to show a sample of the similarities and differences across states. For example, Hispanics are more likely to be homeowners in Florida, both inside and outside the LECZ, than in New York or Louisiana, but within the LECZ in Louisiana, Black householders are more likely to be homeowners than Hispanics householders. That said, with few exceptions, the LECZ in Florida, New York, and Louisiana has a greater share of urban renters regardless of race or Hispanic origin of householder when compared to the housing units outside the LECZ.
To determine patterns of racial disparities in housing within and outside the LECZ, we examine housing unit distributions (Figure 8A) and growth rates (Figure 8B) by housing tenure across race and Hispanic origin in 1990–2010. We find that while White householders outnumber others in terms of total number of units, Hispanic householders, whether inside or outside the LECZ, in rural or urban areas grew faster than Whites and Blacks for both 1990–2000 and 2000–2010 and was the only group that grew in all time periods studied as well as both owner-occupied and renter-occupied housing units for both urban and rural areas.
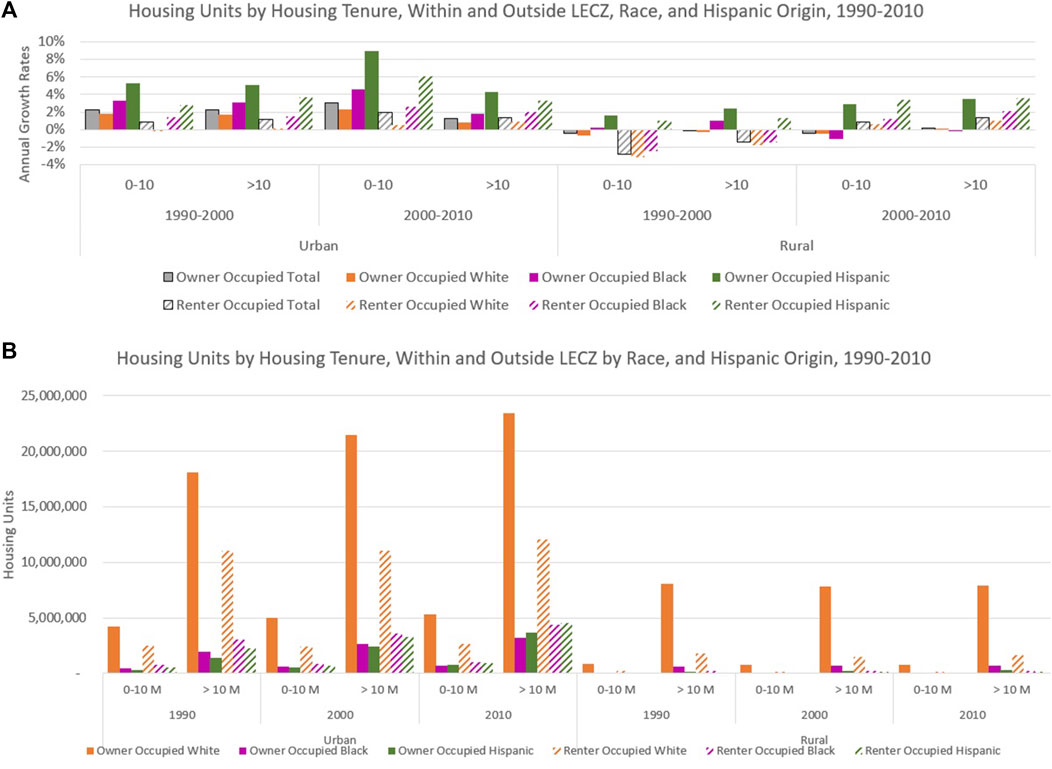
FIGURE 8. Housing units (A) and annual growth rates of housing units (B) by housing tenure, within and outside the LECZ, by urban/rural classification, and race and Hispanic origin of householders for coastal states, 1990–2010.
Notably, the urban story is quite different from the rural story. As panel B of Figure 8 shows in 1990–2000, urban owner-occupied housing units were growing at the same pace within and outside the LECZ, and urban renter-occupied housing units were growing faster outside the LECZ. While the growth rate for all rural housing units was negative, the growth rate for both rural owner-occupied housing units and renter-occupied housing units was lower within the LECZ (−0.45, −2.76, respectively) when compared to outside the LECZ (−0.06, −1.44, respectively). Yet in the following decade, from 2000 to 2010, urban housing units in the LECZ grew faster (3.06% for owner-occupied, 1.9% for renter-occupied) than outside the LECZ (1.24% for owner-occupied, 1.38% for renter occupied), while the reverse is true in rural areas, where housing units outside the LECZ (0.17% for owner-occupied, 1.32% for renter-occupied) grew faster than inside the LECZ (−0.46% for owner-occupied, 0.83% for renter-occupied).
There is a good deal of variety in the growth of housing units by state (see Supplementary Figures S5A, B), with no one pattern to fit all. Florida and New York saw a higher increase of urban homeowners outside the LECZ in comparison to within the LECZ. But, in Louisiana urban homeowners within the LECZ experienced faster growth in comparison to outside the LECZ. Starting from a much lower share of homeownership (Figure 8A), Black and Hispanic homeowners experienced faster growth rates than White homeowners in the urban LECZ in Florida, New York, and Louisiana.
While the total owner-occupied housing units in rural areas declined, urban White homeowners in Florida grew around twice as fast outside the LECZ than within the LECZ. However, urban Black homeowners grew about as fast within and outside the LECZ. Urban Hispanic homeowners in Florida outpaced all groups studied both within and outside the LECZ, in part due to growth of the Hispanic population. In rural areas, White and Black homeowners experienced a slight decline, while Hispanic homeowners increased.
New York’s urban homeowners experienced a slight increase both inside and outside the LECZ but rural owner-occupied housing units declined and experienced a greater loss inside the LECZ than outside the LECZ. Urban Black homeowners in the LECZ experienced the fastest growth in New York and rural Black homeowners experienced the highest decline in growth in the time period studied. Hispanic homeowners in New York grew fastest in urban areas but, as stated above, experienced growth all around.
Homeowners in Louisiana grew fastest in the urban LECZ and all homeowners studied declined in the rural LECZ. That said, overall Black homeowners experienced the highest decrease in the rural LECZ. While urban White homeowners experienced more growth within the LECZ than outside, the reverse was true for urban Black homeowners and urban Hispanic homeowners, which experienced greater growth outside the LECZ.
As for renters, Black and Hispanic renters in Florida grew faster in the urban LECZ when compared to Whites but all urban LECZ renters grew less than the urban renters outside the LECZ. Florida, New York, and Louisiana experienced a sharper decline in White and Black renters in the rural LECZ in comparison to rural areas outside the LECZ. Hispanic renters grew in rural Florida, New York, and Louisiana but grew faster outside the LECZ in rural Florida, inside the LECZ in rural New York, and at about the same pace inside and outside rural Louisiana.
Table 5 captures the share of the total housing units for each disaggregated group and provides the overall share within coastal states as a comparison in order to demonstrate which subgroups are over or underrepresented by housing tenure, urban/rural classification, as well as within and outside the LECZ. For example, although Black residents were only 14.6% of the population in coastal states in 2010, Black householders accounted for 23.3% of the renter-occupied housing units in the urban LECZ. Moreover, urban renters have been disproportionately Black or Hispanic since at least 1990. In contrast, Table 5 also shows that Whites have been more likely to be homeowners within and outside the LECZ in urban and rural areas. That said, Whites were also more likely to be renters in rural areas for all the years of our study. Furthermore, in urban areas Whites are even more likely to be home owners in the LECZ than outside of it and, conversely, in rural areas, even more likely to be homeowners outside the LECZ rather than in it. Similarly, in urban areas, Blacks are more likely to live in renter-occupied housing in the LECZ than outside of it. In fact, Blacks and Hispanics are almost twice as likely as Whites to be urban renters in the LECZ. Also notable is that the share of renter-occupied housing units with Black and Hispanic householders is increasing both within and outside the LECZ and in urban and rural areas, which may be indicative of increasing housing costs (Table 5). Despite higher growth rates of the Hispanic population (Figure 6, especially in the urban LECZ since 2000) and among Hispanic homeownership (Figure 8B), in all years Hispanic are underrepresented in all categories of homeownership and overrepresented in terms of urban renters (Table 5). In other words, the growth rate of the Hispanic population has not kept pace with their homeownership rates.
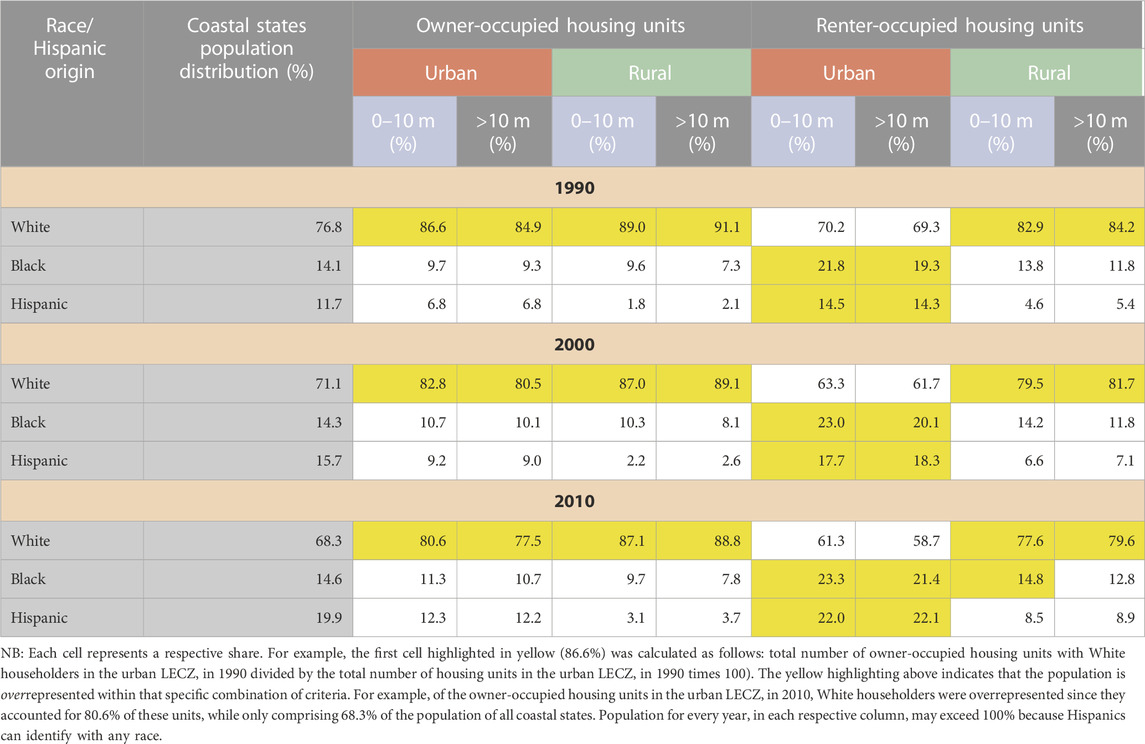
TABLE 5. Shares of housing units in coastal states by housing tenure, within and outside the LECZ by urban/rural classification and by race and Hispanic origin, 1990–2010.
4.4 Aging population at risk
Examining an area’s age structure (such as in a population pyramid, Figure 9) is important for understanding age-related aspects of vulnerability as well as informing future growth. Population aging—the “squaring off” from a more triangular shape of the population pyramid in 1990 (Figure 9A) and 2010 (Figure 9B)—is evident inside and out of the LECZ in urban areas (right-side panels). Rural areas (left-side panels) show a fairly flat distribution of population through working ages in the LECZ (blue bars), but outside the LECZ (gray bars), the population of persons ages 20–35 is particularly low perhaps as a result of lower past fertility and out-migration of these age groups from rural areas in general. The proportionate increase in the population over age 65 (the more rectangular shape of the blue bars relative to the gray ones in 2010, shown in panel B) is more evident inside the LECZ.
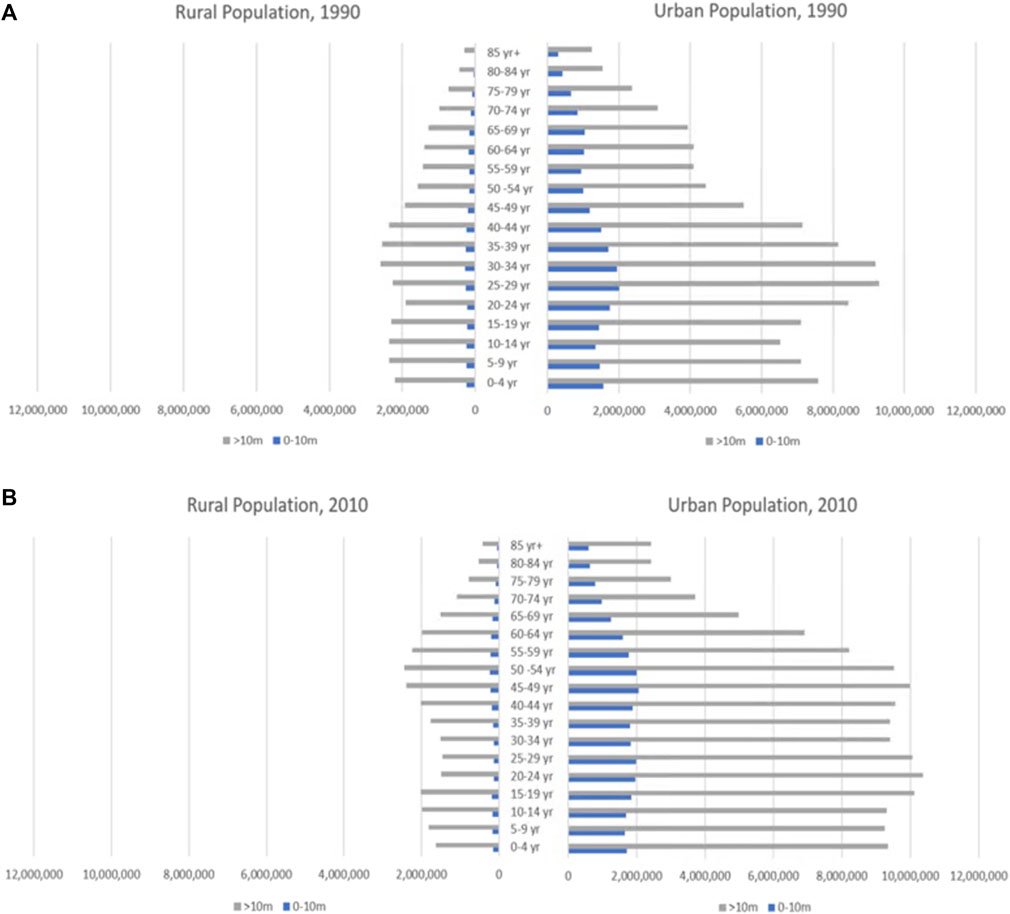
FIGURE 9. Population Pyramid showing the Age Distribution of Coastal States Within and Outside the LECZ, by Urban/Rural Classification, (A) 1990 and (B) 2010.
Residents of the LECZ are much older than average—nearly 3 percentage points greater in the LECZ than outside of it—as shown in Table 6 (which shows the respective shares of residents aged 65 and older, as well as their growth rates from 1990 to 2010). In 1990, 1 out of every 8 persons, averaging across all residents of coastal states, was over age 65. From 1990 to 2010, we see an additional 6 million and a small increase in the proportion 65+ to 12.9% in coastal states, on average. Yet the residents of the LECZ are much older than average (14.6% in 1990 rising to 15.2% in 2010). This is true in urban and rural areas: around 15% of urban residents in the LECZ are over age 65, whereas only about 12% of the population in urban areas outside the LECZ is over age 65; in 1990, 13.6% of the rural dwellers in the LECZ were over age 65 as compared to 12.1% of rural residents outside of the LECZ. By 2010, these shares had risen substantially to 16.9% within the LECZ and nearly 15% outside of it. While there is much variation across states, these patterns are generally found in Florida, Louisiana and New York, and across urban and rural areas (see Supplementary Table S4 and Supplementary Figure S6).
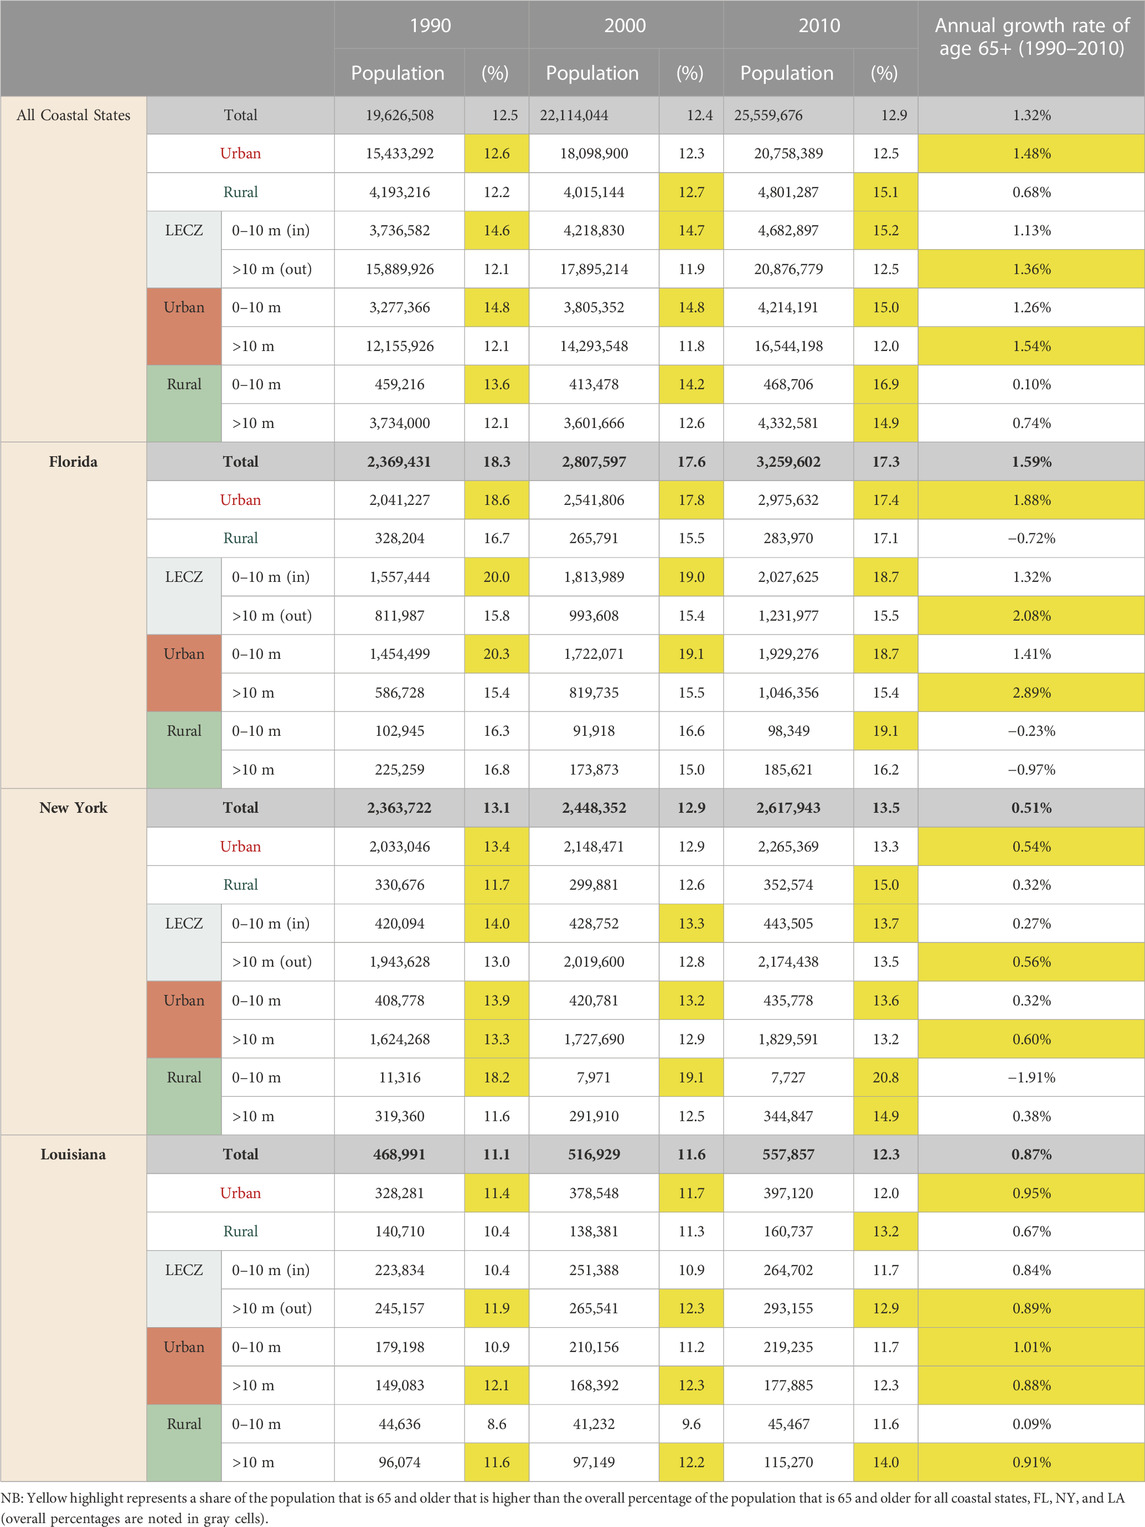
TABLE 6. Respective Shares of Older Residents (65+) Within and Outside the LECZ, by Urban/Rural Classification for Coastal States, Florida, New York, and Louisiana, and Annual Growth Rate of the population over age 65, 1990–2010.
Not surprisingly, Florida has much higher shares of older adults—over 18% statewide in 1990 and, while increasing by nearly 1 million older residents, declining to 17.3% of the state population in 2010. Nevertheless, the annual growth rate of this population (at 1.6% per year) is larger in Florida than elsewhere (1.3% for the coastal states average). In 1990, 1 out of 5 residents of the LECZ in Florida was over age 65, with even slightly higher proportions in the urban LECZ. Like the statewide trend, these fractions declined somewhat by 2010 (while the population itself is rose). Shares of the rural LECZ dwellers over age 65 exceed the Florida state average and the share of urban LECZ dwellers in 2010, rising from about 16% in 1990 to 19% in 2010.
Looking at New York State, in Table 6, which has somewhat greater shares of older adults than the coastal states average, the most notable trend is among rural LECZ dwellers. While the population of older adults in the rural LECZ was small in 1990 (less than 12,000 persons) and declined by 2010, the shares are rising. These represent communities along the seacoast of Long Island, next to New York City, where much of the rural land area is interspersed within suburban and urban settings. The shares of older adults in Louisiana (about 11% in 1990) are smaller than the coastal states average. While these shares have grown in the urban and rural LECZ from 1990 to 2010, they tend to have grown at a faster rate outside of the LECZ, perhaps due to an inability of poor elderly residents to rebuild after repeated storms and explicit policies to move rural communities that happen to be aging away from coastal areas.
5 Discussion and conclusion
While accounting for 1 out of every 10 persons (34 million persons) in the continental US, population exposure to coastal hazards is highly concentrated to subsets of counties in a small subset of states, where 1:6 persons live in low-lying coastal zones. Exposure is disproportionate to urban dwellers, and to communities of color, who are disproportionately residents of cities. Black residents, in particular, have the highest shares of population in both the urban and rural LECZ, with about 1 out of every 5 urban Black residents living in the LECZ.
A growing body of literature highlights the need for estimates from a range of exposure constructs including the use of the conventional 100-year floodplain data from FEMA (Elliot et al., 2020; Elliot and Wang, 2023) and NOAA’s Sea-level rise modeled data (Hauer et al., 2016; Braswell et al., 2022) and newer flood hazard modeled data such as that from First Street Foundation (Flores et al., 2022) and observed storm-related flood impacts data (Smiley, 2020)—the last of which showing that many of those areas impacted by floods (and particularly with concentrations of communities of color) live outside conventional floodplain data. While some of these datasets are ideal for local application, others, including the LECZ that we use here are intended for systematic study across a large extent such as all coastal areas. As a complement to other studies, our estimates are based on the population living in census blocks that intersect the LECZ rather than the entire population of coastal counties found in prior studies (NOAA, 2013; Bukvic et al., 2018; Hauer et al., 2022), thus producing a smaller total population [about one-third the estimate found by Hauer et al. (2022)]. While estimates of the total county population in coastal areas capture the number of people that are likely to be covered by local adaptation and mitigation policies and disaster preparation, by focusing on the people that live within the LECZ as we have done here, we sought to capture the people most vulnerable to coastal hazards (i.e., those living in 0–10 m contiguous to seacoast).
From 1990 to 2020, we estimate that the population of the LECZ has increased, primarily by the growth of the urban population which has risen from about 22 million to 31 million persons. In the two decades from 2000 to 2020, the urban population consistently grew at higher rates inside the LECZ than outside of it, reversing the pattern from the decade prior. Hispanics represent the fastest growing population in this period, and are the only subpopulation with positive growth in all categories (urban, rural, and inside and outside the LECZ). From 2000 to 2020, the Hispanic population growth was much higher in urban LECZ areas than urban areas elsewhere. Consistent with studies on population change in the context of weather-related hazards, there is little evidence that coastal proximity and its many hazards act to deter population growth (Fussell et al., 2017). Similarly, Braswell et al. (2022) found that coastal areas continue to grow in terms of the size and number of built-structures despite perpetual damage from hazards. Elliot and Wang (2023) found that even homeowners that leave flood zones are likely to move close by, which may not reduce their risk as much as moving to a “safer” region that is further away. As we plan for sea level rise and anticipate heightened coastal hazards, this last point becomes particularly concerning because those that have moved may be vulnerable again since current risks will change and more areas will be considered flood zones in the future. The 5–10 m LECZ of today used in this study may indeed become the 0–5 m LECZ with future sea level rise. Efforts to inform future migration as a component of climate adaptation should weigh these pervasive historical growth patterns when considering scenarios of long-distance moves that are based on increased risk but run counter to lived experiences (Hauer, 2017; Robinson et al., 2020; Hauer et al., 2021). With this in mind, it is necessary to construct effective adaptation plans (Bukvic and Harrald, 2019) and policies that promote sustainable development (Parton and Dundas, 2020).
In terms of housing, we find that while White householders are more likely than Black and Hispanic householders to own their homes within and outside the LECZ, Black and Hispanic householders are more likely to live in renter-occupied housing units in the urban LECZ. (Although from 2000 to 2010, the growth rates of both owner-occupied and renter-occupied urban housing units for Blacks and Hispanics outpaced that of Whites in the LECZ.) Despite these overarching patterns and trends, housing tenure and growth rates in housing display considerable heterogeneity between coastal states, urban/rural classification and location within or outside the LECZ, thus necessitating a nuanced approach to targeted, sustained, and effective adaptation planning (Bierbaum et al., 2013; Nordgren et al., 2016).
These racial inequalities in housing tenure in coastal states are consistent with those observed more generally across the US, for example, in median household wealth across race and housing tenure (Choi et al., 2019; Eggleston and Hays, 2019) and the legacies of discriminatory housing policies, discrimination in mortgage lending, and residential segregation, more generally (Pulido, 2000; Rothstein, 2017). Housing plays a central role in a household’s financial stability over its life-course and in the intergenerational wealth that can be transmitted to ones’ descendants. It is important to note that low-to-middle income renters and homeowners in coastal areas have different needs that should be taken into account: homeowners, for example, may not be able to move easily in response to heightened risk and are likely to have their home account for the majority of their wealth (which may depreciate in value with repeated exposure to or damage from coastal hazards). Whereas renters may be more mobile, and so, can leave in response to a hazardous event, but may not have the resources to obtain new quality housing. Additionally, even if vulnerable residents are able to leave, they may not be in a financial position to return to their original community (Elliot et al., 2009; Fussell et al., 2010; Fussell and Harris, 2014; Sastry and Gregory, 2014).
Like studies that use county-level data rather than blocks (NOAA, 2013; Hauer et al., 2022), we also find that the median age of persons living in the LECZ is higher than that of persons outside the zone. The aging of rural areas in the US is well accepted (Cromartie, 2018), and while urban areas are also aging they tend to be thought of as comparably younger. It is notable in this context that we find that the percent population over age 65 (in 2010, the last time this variable was available at the block level) was 3 percentage points greater in the urban LECZ than in urban areas outside of it (and over 15% of the population) and in rural areas nearly 17% of LECZ dwellers were over 65 as compared to about 15% of rural residents beyond the LECZ. Clear differences also were found by state with Florida having much higher shares of older adults and growth rates of 1.6% per year from 1990 to 2010 in the LECZ. If these trends are due to migration of young persons—since cities tend to receive younger persons and rural areas tend to lose them—there may well be implications for the vibrancy of rural economies and the provision of services from working age adults to older adults in rural areas (Bukvic et al., 2018). The provision of such services may be especially precarious during extreme weather events (Shih et al., 2018).
Our findings point to future policy and related research opportunities. These findings can provide city, county, and regional planners localized data (see Supplemental Materials) that can support equitable adaptation, mitigation, and recovery strategies to address current and future climate challenges. Using fine-scale census data rather than coarser-scale data allows us to identify the communities that are at risk and thus provide the necessary information to ensure the exposure risks of vulnerable communities are mitigated. Using social justice principles (Newell et al., 2021), at a minimum, climate adaptation and mitigation policies should not exacerbate present inequities. Climate policies present an opportunity to create a more equal society, and thereby should focus on equity as a core principle (Foster et al., 2019). Our findings make evident systematic racial disparities in homeownership and renter rates as well as the increased likelihood of exposure of minority communities to coastal hazards simply by being overrepresented in the LECZ. Adaptation planning therefore must be attentive to the needs of communities of color (Schlosberg, 2012; Yang et al., 2021). Since US cities are increasingly incorporating justice principles and elements in their climate plans (Diezmartínez and Short Gianotti, 2022), future studies may cover to what extent local, state, and federal programs have succeeded in eliminating or ameliorating socio-economic disparities. Future studies could also cover policies that are implicated in climate planning but may not be labeled as such, for example, New York City Local Law 78 (2021) requires racial equity reports for certain land use applications which, if implemented correctly, could help diminish the racial disparities in housing.
Our findings further suggest opportunities to mitigate various dimensions of precarity. The disparities highlighted above make evident that for disaster recovery to be equitable, assistance should not merely be based on the appraised value of homes, which only focuses on the restoration of wealth (through private property) and reinforces current social inequities. Instead, disaster relief should seek to minimize precarity. A research analyst from the National Low Income Housing Coalition (NLIHC), suggested a path forward stating that after a disaster, FEMA should activate the Disaster Housing Assistance Program (DHAP) in order to provide longer-term rental assistance directly to affected renters and also made clear that “the disaster housing recovery process generally needs to be rethought from the ground up, to prioritize the needs of the least well-off” (Elliot, 2021). Vulnerability, in all of its facets, should be minimized. For example, since the LECZ dwellers are older than average and increasing, the vulnerability of older residents should be accounted for in resiliency planning (Bukvic et al., 2018), housing policy (Molinsky and Forsyth, 2022) and corresponding emergency care and disaster relief services (Wang and Yarnal, 2012). Efforts tailored to the needs of older adults, sometimes called aging-in-place efforts, can help strengthen the resilience of older adults (Shih et al., 2018) and being able to monitor and analyze such changes will be necessary as the population continues to age under intensifying climate conditions and new climate regimes. Finally, in line with other studies that find differential risks along the urban-rural continuum (e.g., Bukvic and Harrald, 2019; Flores et al., 2022), this research has highlighted the importance of addressing differential urban and rural exposures and vulnerability in their own right in further analysis and planning. And while a simple urban-rural dichotomy was used in this study given the structure of the underlying data, a continuum of urban-rural forms should be incorporated, where possible, into vulnerability and equity analyses (Balk et al., 2018).
Data availability statement
The datasets presented in this study can be found in online repositories, respectively for the Census data from IPUM NHGIS (https://www.nhgis.org/) and for the LECZ data from the Socioeconomic Data and Application Center (SEDAC) (https://sedac.ciesin.columbia.edu/data/collection/lecz). The newly constructed county-level summary data table used for this analysis may be downloaded from this link: https://docs.google.com/spreadsheets/d/1z77CsLYc8Ftg00WAtNwtxtM6PeoKCkn8/edit?usp=drive_link&ouid=109627947882870439315&rtpof=true&sd=true.
Author contributions
All authors listed have made a substantial, direct, and intellectual contribution to the work and approved it for publication.
Acknowledgments
A preliminary version of this paper was presented at the Annual Meeting of the Population Association of America, 2022. We thank Kytt MacManus and Hasim Engin for their support in the construction of the underlying data used in this analysis. We thank the reviewers for their constructive comments. Partial support for this work comes from the CUNY Institute for Demographic Research (CIDR) Open-Access Publication Fund and the Sociology Program of the CUNY Graduate Center.
Conflict of interest
The authors declare that the research was conducted in the absence of any commercial or financial relationships that could be construed as a potential conflict of interest.
Publisher’s note
All claims expressed in this article are solely those of the authors and do not necessarily represent those of their affiliated organizations, or those of the publisher, the editors and the reviewers. Any product that may be evaluated in this article, or claim that may be made by its manufacturer, is not guaranteed or endorsed by the publisher.
Supplementary material
The Supplementary Material for this article can be found online at: https://www.frontiersin.org/articles/10.3389/fenvs.2023.1111856/full#supplementary-material
Footnotes
1For ease of reference, all supplemental tables and figures referenced in this paper begin with S (e.g., Supplementary Figure S1).
2Distributive climate justice focuses on how social costs/ills and benefits/goods are allocated, as well as temporarily and spatially distributed within a society (Newell et al., 2021).
3While it is beyond the scope of this paper, housing precarity has multiple dimensions and the relationship between housing instability, homelessness and climate change should also be addressed and mitigated in any plans for climate mitigation and adaptation (Bezgrebelna et al., 2021).
4It is worth noting that the number of counties that form the basis of our analysis is greater than used in recent studies by Hauer et al. (2022) or Bukvic et al. (2018) by about 100 counties, but given that our study defines the coastal zone as the land area in census blocks that intersect the LECZ rather than the entire county, we anticipate a smaller population estimate of exposure.
5While there are no estimates available of this population, county-level estimates of second-home ownership for 2020 can be found (Zhao and National Association of Home Builders, 2022). Because Florida is the state with the highest share (and number) of second homes, we assume our estimates for Florida (and other coastal communities that may have temporary winter-residents) would be underestimated. The degree to which this is the case cannot be quantified in our research and remains an open question (using information on vacant housing stock rather than residences) for future research.
6Though Florida is a special case, because of its lack of state income-tax, many “snow-birds” may prefer to consider their usual residence in Florida rather than their income-tax extracting state of origin; thus perhaps minimizing the potential for undercounting.
7Parenthetical variable names conform to those in the raw data downloaded from NHGIS.
8Our estimate of the population of counties with any exposure is similar to that of NOAA (2013) even though we use a more narrow construction of coastal exposure (i.e., within the LECZ) than that of NOAA, which uses entire counties proximate to open ocean, Great Lakes, or in a connected watershed. Similarly, the LECZ we use expands in some locations beyond those found in the NOAA analysis, yet our analysis is restricted to seacoast and NOAA’s also includes proximity to Great Lakes.
9Deltaic regions have disproportionate exposure in the LECZ globally (McGranahan et al., 2007) particularly in population exposure in the 0–5 m LECZ (McGranahan et al. forthcoming).
10Note that individuals of Hispanic origin can belong to any racial group.
11The inclusion of the two or more races option in the 2020 census, in comparison to 1990, complicates inferences over time.
12Panel A of Figure 6 contains the same information shown in panel A of Figure 5 but is organized for comparison by race and Hispanic origin.
13All three counties selected have nearly no rural population, and the population of Orleans Parish is essentially entirely in the LECZ.
14While the distribution of total housing units in Figure 7 captures the full universe of occupied housing units in 2010, Figure 7 does not include disaggregated distributions of housing units with householders that identify as Asian alone, Native Hawaiian and other Pacific Islander alone, American Indian and Alaska Native alone, some other single race alone, or two or more races. Additionally, it is important to note that Hispanic householders can identify as belonging to any racial category.
15These variables are not available in the block-level data for the 2020 census.
References
Alba, R. (2018). What majority-minority society? A critical analysis of the census bureau’s projections of America’s demographic future. Socius 4, 237802311879693. doi:10.1177/2378023118796932
Allen, T., Behr, J., Bukvic, A., Calder, R. S. D., Caruson, K., Connor, C., et al. (2021). Anticipating and adapting to the future impacts of climate change on the health, security and welfare of low elevation coastal zone (LECZ) communities in southeastern USA. J. Mar. Sci. Eng. 9 (11), 1196. doi:10.3390/jmse9111196
Aspen Institute Financial Security Program (2019). A glimpse into the eviction crisis: Why housing instability deserves greater attention. https://www.aspeninstitute.org/blog-posts/a-glimpse-into-the-eviction-crisis-why-housing-stability-deserves-greater-attention/.
Aune, K. T., Gesch, D., and Smith, G. S. (2020). A spatial analysis of climate gentrification in Orleans Parish, Louisiana post-Hurricane Katrina. Environ. Res. 185, 109384. doi:10.1016/j.envres.2020.109384
Aurand, A., Emmanuel, D., Threet, D., Rafi, I., and Yentel, D. (2019). The gap: A shortage of affordable rental homes. National low-income housing coalition. Available from https://tinyurl.com/rz2n2c2.
Balk, D., Guzman, J. M., and Schensul, D. (2013). “Harnessing census data for environment and climate change analysis,” in The demography of adaptation to climate change. Editors G. Martine, and D. Schnesul (New York, London: UNFPA, IIED, & El Colegio de Mexico), 74–95.
Balk, D., Leyk, S., Jones, B., Montgomery, M. R., and Clark, A. (2018). Understanding urbanization: A study of census and satellite-derived urban classes in the United States, 1990-2010. PloS one 13 (12), e0208487. doi:10.1371/journal.pone.0208487
Balk, D., Tagtachian, D., Jiang, L., Marcotullio, P. J., Cook, E., Jones, B., et al. (2022). Frameworks to envision equitable urban futures in a changing climate: A multi-level, multidisciplinary case study of New York city. Front. Built Environ. – Urban Sci. 8, 949433. doi:10.3389/fbuil.2022.949433
Bezgrebelna, M., McKenzie, K., Wells, S., Ravindran, A., Kral, M., Christensen, J., et al. (2021). Climate change, weather, housing precarity, and homelessness: A systematic review of reviews. Int. J. Environ. Res. Public Health 18 (11), 5812. doi:10.3390/ijerph18115812
Bierbaum, R., Smith, J. B., Lee, A., Blair, M., Carter, L., Chapin, F. S., et al. (2013). A comprehensive review of climate adaptation in the United States: More than before, but less than needed. Mitig. Adapt. strategies Glob. change 18 (3), 361–406. doi:10.1007/s11027-012-9423-1
Bjarnadottir, S., Li, Y., and Stewart, M. G. (2011). Social vulnerability index for coastal communities at risk to hurricane hazard and a changing climate. Nat. Hazards 59 (2), 1055–1075. doi:10.1007/s11069-011-9817-5
Braswell, A. E., Leyk, S., Connor, D. S., and Uhl, J. H. (2022). Creeping disaster along the U.S. coastline: Understanding exposure to sea level rise and hurricanes through historical development. PLoSONE 17 (8), e0269741. doi:10.1371/Journal.pone.0269741
Buchanan, M. K., Kulp, S., Cushing, L., Morello-Frosch, R., Nedwick, T., and Strauss, B. (2020). Sea level rise and coastal flooding threaten affordable housing. Environ. Res. Lett. 15 (12), 124020. doi:10.1088/1748-9326/abb266
Bukvic, A., Gohlke, J., Borate, A., and Suggs, J. (2018). Aging in flood-prone coastal areas: Discerning the health and well-being risk for older residents. Int. J. Environ. Res. Public Health 15 (12), 2900. doi:10.3390/ijerph15122900
Bukvic, A., and Harrald, J. (2019). Rural versus urban perspective on coastal flooding: The insights from the US Mid-Atlantic communities. Clim. Risk Manag. 23, 7–18. doi:10.1016/j.crm.2018.10.004
Centers for Disease Control (Cdc), (2023). No date. CDC’s disaster planning goal: Protect vulnerable older adults. https://www.cdc.gov/aging/pdf/disaster_planning_goal.pdf.
Chakraborty, J., Collins, T. W., and Grineski, S. E. (2019). Exploring the environmental justice implications of hurricane Harvey flooding in greater houston, Texas. Am. J. public health 109 (2), 244–250. doi:10.2105/ajph.2018.304846
Chakraborty, J., Collins, T. W., Montgomery, M. C., and Grineski, S. E. (2014). Social and spatial inequities in exposure to flood risk in Miami, Florida. Nat. Hazards Rev. 15 (3), 04014006. doi:10.1061/(asce)nh.1527-6996.0000140
Choi, J. H., McCargo, A., and Goodman, L. (2019). Three differences between Black and white homeownership that add to the housing wealth gap. https://www.urban.org/urban-wire/three-differences-between-black-and-white-homeownership-add-housing-wealth-gap.
Ciesin and Cidr, (2021), Low elevation coastal zone (LECZ) urban-rural population and land area estimates, version 3. Palisades. New York, NY, USA: NASA Socioeconomic Data and Applications Center SEDAC. doi:10.7927/d1x1-d702
Climate Central (2021). Report: Coming Storms: Climate change and the rising threat to America’s coastal seniors. https://www.climatecentral.org/climate-matters/climate-change-impacts-seniors-living-near-the-coast.
CoreLogic (2021). Risk redefined: CoreLogic climate change catastrophe report emphasizes need to address increasing frequency of hazard events. https://www.corelogic.com/press-releases/risk-redefined-corelogic-climate-change-catastrophe-report-emphasizes-need-to-address-increasing-frequency-of-hazard-events/.
Cromartie, J. (2018). Rural America at a glance 2018 edition. Washington, D.C., United States: Economic Research Service.
Curtis, K. J., Fussell, E., and DeWaard, J. (2015). Recovery migration after Hurricanes Katrina and Rita: Spatial concentration and intensification in the migration system. Demography 52 (4), 1269–1293. doi:10.1007/s13524-015-0400-7
Cutter, S. L., Boruff, B. J., and Shirley, W. L. (2012). “Social vulnerability to environmental hazards,” in Hazards vulnerability and environmental justice (England, UK: Routledge), 143–160.
Davidson, T. M., Price, M., McCauley, J. L., and Ruggiero, K. J. (2013). Disaster impact across cultural groups: Comparison of Whites, african Americans, and latinos. Am. J. community Psychol. 52 (1), 97–105. doi:10.1007/s10464-013-9579-1
Diezmartínez, C. V., and Short Gianotti, A. G. (2022). US cities increasingly integrate justice into climate planning and create policy tools for climate justice. Nat. Commun. 13 (1), 5763. doi:10.1038/s41467-022-33392-9
Donnelly, Frank (2022). Chapter 4: Datasets. U. S. Census Data Concepts Appl. Supporting Res. Libr. Technol. Rep. 58 (4), 16–22. doi:10.5860/ltr.58n4
Dundon, L. A., and Camp, J. S. (2021). Climate justice and home-buyout programs: Renters as a forgotten population in managed retreat actions. J. Environ. Stud. Sci. 11, 420–433. doi:10.1007/s13412-021-00691-4
Eggleston, J., and Hays, D. (2019). Many U.S. Households do not have biggest contributors to wealth: Home equity and retirement accounts. https://www.census.gov/library/stories/2019/08/gaps-in-wealth-americans-by-household-type.html.
Elliot, D. (2021). Storm’s path: FEMA fielding criticism for racial inequality in disaster aid. https://www.chn.org/voices/in-storms-path-fema-fielding-criticism-for-racial-inequality-in-disaster-aid/.
Elliott, J. R., Bellone Hite, A., and Devine, J. A. (2009). Unequal return: The uneven resettlements of New Orleans’ uptown neighborhoods. Organ. Environ. 22 (4), 410–421. doi:10.1177/1086026609347184
Elliott, J. R., Brown, P. L., and Loughran, K. (2020). Racial inequities in the federal buyout of flood-prone homes: A nationwide assessment of environmental adaptation. Socius 6, 237802312090543. doi:10.1177/2378023120905439
Elliott, J. R., and Wang, Z. (2023). Managed retreat: A nationwide study of the local, racially segmented resettlement of homeowners from rising flood risks. Environ. Res. Lett. 18 (6), 064050. doi:10.1088/1748-9326/acd654
Environmental Protection Agency Epa, (2014). Land loss along the atlantic coast. https://www.epa.gov/sites/default/files/2021-04/documents/land-loss_td.pdf.
Faber, J. W. (2015). Superstorm Sandy and the demographics of flood risk in New York City. Hum. Ecol. 43 (3), 363–378. doi:10.1007/s10745-015-9757-x
Federal Register (2022b). 2020 census qualifying urban area and final criteria. https://www.federalregister.gov/documents/2022/12/29/2022-28286/2020-census-qualifying-urban-areas-and-final-criteria-clarifications.
Federal Register (2022a). Urban area criteria for the 2020 census—final criteria. https://www.federalregister.gov/d/2022-06180.
Flores, A. B., Collins, T. W., Grineski, S. E., Amodeo, M., Porter, J. R., Sampson, C. C., et al. (2022). Federally overlooked flood risk inequities in houston, Texas: Novel insights based on dasymetric mapping and state-of-the-art flood modeling. Oxfordshire United Kingdom: Annals of the American Association of Geographers, 1–21.
Flores, A. B., Collins, T. W., Grineski, S. E., and Chakraborty, J. (2020). Disparities in health effects and access to health care among Houston area residents after Hurricane Harvey. Public Health Rep. 135 (4), 511–523. doi:10.1177/0033354920930133
Foster, S., Leichenko, R., Nguyen, K. H., Blake, R., Kunreuther, H., Madajewicz, M., et al. (2019). New York city panel on climate change 2019 report chapter 6: Community-based assessments of adaptation and equity. Ann. N. Y. Acad. Sci. 1439 (1), 126–173. doi:10.1111/nyas.14009
Fothergill, A., Maestas, E. G. M., and Darlington, J. D. (1999). Race, ethnicity and disasters in the United States: A review of the literature. Disasters 23, 156–173. doi:10.1111/1467-7717.00111
Fussell, E., Curran, S. R., Dunbar, M. D., Babb, M. A., Thompson, L., and Meijer-Irons, J. (2017). Weather-related hazards and population change: A study of hurricanes and tropical storms in the United States, 1980–2012. Ann. Am. Acad. Political Soc. Sci. 669 (1), 146–167. doi:10.1177/0002716216682942
Fussell, E., and Harris, E. (2014). Homeownership and housing displacement after Hurricane Katrina among low-income African-American mothers in New Orleans. Soc. Sci. Q. 95 (4), 1086–1100. doi:10.1111/ssqu.12114
Fussell, E., Sastry, N., and VanLandingham, M. (2010). Race, socioeconomic status, and return migration to new Orleans after hurricane Katrina. Popul. Environ. 31 (1-3), 20–42. doi:10.1007/s11111-009-0092-2
Garner, A. J., Mann, M. E., Emanuel, K. A., Kopp, R. E., Lin, N., Alley, R. B., et al. (2017). Impact of climate change on New York City’s coastal flood hazard: Increasing flood heights from the preindustrial to 2300 CE. Proc. Natl. Acad. Sci. 114 (45), 11861–11866. doi:10.1073/pnas.1703568114
Gauthier Aspen Institute Financial Security Program, (2021). The devastating effects of climate change on US housing security. https://www.aspeninstitute.org/blog-posts/the-devastating-effects-of-climate-change-on-us-housing-security/.
Grineski, S. E., Collins, T. W., and Chakraborty, J. (2022). Cascading disasters and mental health inequities: Winter Storm Uri, COVID-19 and post-traumatic stress in Texas. Soc. Sci. Med. 315, 115523. doi:10.1016/j.socscimed.2022.115523
Grineski, S. E., Collins, T. W., Chakraborty, J., Goodwin, E., Aun, J., and Ramos, K. D. (2023). Social disparities in the duration of power and piped water outages in Texas after Winter Storm Uri. Am. J. Public Health 113 (1), 30–34. doi:10.2105/ajph.2022.307110
Hamideh, S., Peacock, W. G., and Van Zandt, S. (2021). Housing type matters for pace of recovery: Evidence from Hurricane Ike. Int. J. disaster risk Reduct. 57, 102149. doi:10.1016/j.ijdrr.2021.102149
Hammett, V. L., and Worzala, E. (2018). The devastating impact of storm surge on coastal communities. Real Estate Issues 24 (11), 1–14.
Hardy, R. D., and Hauer, M. E. (2018). Social vulnerability projections improve sea-level rise risk assessments. Appl. Geogr. 91, 10–20. doi:10.1016/j.apgeog.2017.12.019
Harlan, S. L., Pellow, D. N., Roberts, J. T., Bell, S. E., Holt, W. G., and Nagel, J. (2015). “Climate justice and inequality,” in Climate change and society. Editors R. E. Dunlap, and R. J. Brulle (Oxford, United Kingdom: Oxford University Press), 127–163.
Hauer, M. E., Evans, J. M., and Alexander, C. R. (2015). Sea-level rise and sub-county population projections in coastal Georgia. Popul. Environ. 37, 44–62. doi:10.1007/s11111-015-0233-8
Hauer, M. E., Evans, J. M., and Mishra, D. R. (2016). Millions projected to be at risk from sea-level rise in the continental United States. Nat. Clim. Change 6 (7), 691–695. doi:10.1038/nclimate2961
Hauer, M. E., Hardy, D., Kulp, S. A., Mueller, V., Wrathall, D. J., and Clark, P. U. (2021). Assessing population exposure to coastal flooding due to sea level rise. Nat. Commun. 12 (1), 6900. doi:10.1038/s41467-021-27260-1
Hauer, M. E., Hardy, R. D., Mishra, D. R., and Pippin, J. S. (2019). No landward movement: Examining 80 years of population migration and shoreline change in Louisiana. Popul. Environ. 40, 369–387. doi:10.1007/s11111-019-00315-8
Hauer, M. E. (2017). Migration induced by sea-level rise could reshape the US population landscape. Nat. Clim. Change 7 (5), 321–325. doi:10.1038/nclimate3271
Hauer, M. E., Saunders, R. K., and Shtob, D. (2022). Research note: Demographic change on the United States coast, 2020–2100. Demography 59 (4), 1221–1232. doi:10.1215/00703370-10127418
Highfield, W. E., Norman, S. A., and Brody, S. D. (2013). Examining the 100-year floodplain as a metric of risk, loss, and household adjustment. Risk Analysis Int. J. 33 (2), 186–191. doi:10.1111/j.1539-6924.2012.01840.x
Hoffman, J. S., Shandas, V., and Pendleton, N. (2020). The effects of historical housing policies on resident exposure to intra-urban heat: A study of 108 US urban areas. Climate 8 (1), 12. doi:10.3390/cli8010012
Howell, J., and Elliott, J. R. (2018). As disaster costs rise, so does inequality. Socius 4, 237802311881679. doi:10.1177/2378023118816795
Humes, K., and Hogan, H. (2009). Measurement of race and ethnicity in a changing, multicultural America. Race Soc. Problems 1 (3), 111–131. doi:10.1007/s12552-009-9011-5
Johnson, K. M., and Lichter, D. T. (2019). Rural depopulation: Growth and decline processes over the past century. Rural. Sociol. 84 (1), 3–27. doi:10.1111/ruso.12266
Jones, B., Balk, D., and Leyk, S. (2020). Urban change in the United States, 1990–2010: A spatial assessment of administrative reclassification. Sustainability 12 (4), 1649. doi:10.3390/su12041649
Jones, N. A., and Bullock, J. J. (2013). Understanding who reported multiple races in the US decennial census: Results from census 2000 and the 2010 census. Fam. Relat. 62 (1), 5–16. doi:10.1111/j.1741-3729.2012.00759.x
Keenan, J. M., Hill, T., and Gumber, A. (2018). Climate gentrification: From theory to empiricism in miami-dade county, Florida. Environ. Res. Lett. 13 (5), 054001. doi:10.1088/1748-9326/aabb32
Ma, C., and Smith, T. (2020). Vulnerability of renters and low-income households to storm damage: Evidence from Hurricane Maria in Puerto Rico. Am. J. public health 110 (2), 196–202. doi:10.2105/ajph.2019.305438
MacManus, K., Balk, D., Engin, H., McGranahan, G., and Inman, R. (2021). Estimating population and urban areas at risk of coastal hazards, 1990–2015: How data choices matter. How data choices matter Earth Syst. Sci. Data 13 (12), 5747–5801. doi:10.5194/essd-13-5747-2021
Maldonado, A., Collins, T. W., Grineski, S. E., and Chakraborty, J. (2016). Exposure to flood hazards in Miami and houston: Are hispanic immigrants at greater risk than other social groups? Int. J. Environ. Res. Public Health 13, 775. doi:10.3390/ijerph13080775
Manson, S., Schroeder, J., Van Riper, D., Kugler, T., and Ruggles, S. (2022a). IPUMS national historical geographic information system: Version 17.0 [1990 census: STF 1 - 100% data]. Minneapolis, MN, USA: IPUMS. doi:10.18128/D050.V17.0
Manson, S., Schroeder, J., Van Riper, D., Kugler, T., and Ruggles, S. (2022b). IPUMS national historical geographic information system: Version 17.0 [2000 census: SF 1b - 100% data]. Minneapolis, MN, USA: IPUMS. doi:10.18128/D050.V17.0
Manson, S., Schroeder, J., Van Riper, D., Kugler, T., and Ruggles, S. (2022c). IPUMS national historical geographic information system: Version 17.0 [2010 census: SF 1a - P & H tables]. Minneapolis, MN, USA: IPUMS. doi:10.18128/D050.V17.0
Manson, S., Schroeder, J., Van Riper, D., Kugler, T., and Ruggles, S. (2022d). IPUMS national historical geographic information system: Version 17.0 [2020 census: P L 94-171 redistricting data summary file], Minneapolis, MN, USA: IPUMS. doi:10.18128/D050.V17.0
McAlpine, S. A., and Porter, J. R. (2018). Estimating recent local impacts of sea-level rise on current real-estate losses: A housing market case study in miami-dade, Florida. Popul. Res. Policy Rev. 37 (6), 871–895. doi:10.1007/s11113-018-9473-5
McDonald, R. I., Biswas, T., Sachar, C., Housman, I., Boucher, T. M., Balk, D., et al. (2021). The tree cover and temperature disparity in US urbanized areas: Quantifying the association with income across 5,723 communities. PloS one 16 (4), e0249715. doi:10.1371/journal.pone.0249715
McGranahan, G., Balk, D., and Anderson, B. (2007). The rising tide: Assessing the risks of climate change and human settlements in low elevation coastal zones. Environ. Urbanization 19 (1), 17–37. doi:10.1177/0956247807076960
Mohai, P., Pellow, D., and Roberts, J. T. (2009). Environmental justice. Annu. Rev. Environ. Resour. 34, 405–430. doi:10.1146/annurev-environ-082508-094348
Molinsky, J., and Forsyth, A. (2022). Climate change, aging, and well-being: How residential setting matters. Oxfordshire United Kingdom: Taylor & Francis. doi:10.1080/10511482.2022.2109711Hous. Policy Debate
National Academies of Sciences, Engineering, and Medicine, (2019). Framing the challenge of urban flooding in the United States. Washington, D.C., United States: National Academies Press.
National Oceanic and Atmospheric Administration (2017). Coastal counties. Available online: https://coast.noaa.gov/data/digitalcoast/pdf/qrt-coastal-county-definitions.pdf.
National Oceanic and Atmospheric Administration (2013). National coastal population: Population trends from 1970 to 2020, NOAA: State of the coastal report. https://aambpublicoceanservice.blob.core.windows.net/oceanserviceprod/facts/coastal-population-report.pdf.
Neal, M., and McCargo, A. (2020). How economic crises and sudden disasters increase racial disparities in homeownership. Washington, D.C., United States: Urban Institute.
New York City (Nyc) Local Law 78, (2021). A Local Law to amend the administrative code of the city of New York, in relation to requiring a citywide equitable development data tool and racial equity reports on housing and opportunity. https://www.nyc.gov/assets/planning/download/pdf/data-maps/edde/local-law-78.pdf.
Newell, P., Srivastava, S., Naess, L. O., Torres Contreras, G. A., and Price, R. (2021). Toward transformative climate justice: An emerging research agenda. Wiley Interdiscip. Rev. Clim. Change 12 (6), e733. doi:10.1002/wcc.733
Nordgren, J., Stults, M., and Meerow, S. (2016). Supporting local climate change adaptation: Where we are and where we need to go. Environ. Sci. Policy 66, 344–352. doi:10.1016/j.envsci.2016.05.006
O’Donnell, C. (2022). Hurricane Ian was lethal for elderly, those with chronic health conditions. https://www.tampabay.com/hurricane/2022/10/21/hurricane-ians-lethal-elderly-those-withchronic-health-conditions/.
Ortiz, G., Schultheis, H., Novack, V., and Holt, A. (2019). A perfect storm: Extreme weather as an affordable housing crisis multiplier. https://cdn.americanprogress.org/content/uploads/2019/07/31124019/A-Perfect-Storm-2.pdf.
Parton, L. C., and Dundas, S. J. (2020). Fall in the sea, eventually? A green paradox in climate adaptation for coastal housing markets. J. Environ. Econ. Manag. 104, 102381. doi:10.1016/j.jeem.2020.102381
Peacock, W. G., Van Zandt, S., Zhang, Y., and Highfield, W. E. (2015). Inequities in long-term housing recovery after disasters. J. Am. Plan. Assoc. 80 (4), 356–371. doi:10.1080/01944363.2014.980440
Pulido, L. (2000). Rethinking environmental racism: White privilege and urban development in southern California. Ann. Am. Assoc. Geogr. 90, 12–40. doi:10.1111/0004-5608.00182
Raker, Ethan J. (2020). Natural hazards, disasters, and demographic change: The case of severe tornadoes in the United States, 1980–2010. Demography 57 (2), 653–674. doi:10.1007/s13524-020-00862-y
Ratcliffe, M. “A century of delineating a changing landscape: The census bureau’s urban and rural classification, 1910 TO 2010,” in Proceedings of the Presented at the Annual Meeting of the Social Science History Association, Baltimore, MD, USA, November, 2015.
Redfin News (2021). A racist past, a flooded future: Formerly redlined areas have $107 billion worth of homes facing high flood risk—25% more than non-redlined areas. https://www.redfin.com/news/redlining-flood-risk/.
Reed, A. J., Mann, M. E., Emanuel, K. A., Lin, N., Horton, B. P., Kemp, A. C., et al. (2015). Increased threat of tropical cyclones and coastal flooding to New York City during the anthropogenic era. Proc. Natl. Acad. Sci. 112 (41), 12610–12615. doi:10.1073/pnas.1513127112
Revi, A., Satterthwaite, D. E., Aragón-Durand, F., Corfee-Morlot, J., Kiunsi, R. B., Pelling, M., et al. (2014). “Urban areas,” in Climate change 2014: Impacts, adaptation, and vulnerability. Part A: Global and sectoral aspects. Contribution of working group II to the fifth assessment report of the intergovernmental panel on climate change. Editor C. Field (Cambridge, United Kingdom: Cambridge University Press), 535–612.
Robinson, C., Dilkina, B., and Moreno-Cruz, J. (2020). Modeling migration patterns in the USA under sea level rise. Plos one 15 (1), e0227436. doi:10.1371/journal.pone.0227436
Rosenzweig, C., and Solecki, W. (2019). New York city panel on climate change 2019 report chapter 1: Introduction. Ann. N. Y. Acad. Sci. 1439, 22–29. doi:10.1111/nyas.14004
Rossiter, K. (2011). What are census blocks? available at https://www.census.gov/newsroom/blogs/random-samplings/2011/07/what-are-census-blocks.html.
Rothstein, R. (2017). The color of law: A forgotten history of how our government segregated America. New York, NY, United States: Liveright Publishing.
Sastry, N., and Gregory, J. (2014). The location of displaced New Orleans residents in the year after Hurricane Katrina. Demography 51 (3), 753–775. doi:10.1007/s13524-014-0284-y
Schlosberg, D. (2012). Climate justice and capabilities: A framework for adaptation policy. Ethics & Int. Aff. 26 (4), 445–461. doi:10.1017/s0892679412000615
Schlosberg, D., and Collins, L. B. (2014). From environmental to climate justice: Climate change and the discourse of environmental justice. WIREs Clim. Change 5 (3), 359–374. doi:10.1002/wcc.275
Shih, R. A., Acosta, J. D., Chen, E. K., Carbone, E. G., Xenakis, L., Adamson, D. M., et al. (2018). Improving disaster resilience among older adults: Insights from public health departments and aging-in-place efforts. Rand health Q. 8 (1), 3.
Siskind, D. J., Sawyer, E., Lee, I., Lie, D. C., Martin-Khan, M., Farrington, J., et al. (2016). The mental health of older persons after human-induced disasters: A systematic review and meta-analysis of epidemiological data. Am. J. Geriatroc Psychiatry 24 (5), 379–388. doi:10.1016/j.jagp.2015.12.010
Smiley, K. T., Noy, I., Wehner, M. F., Frame, D., Sampson, C. C., and Wing, O. E. (2022). Social inequalities in climate change-attributed impacts of Hurricane Harvey. Nat. Commun. 13 (1), 3418. doi:10.1038/s41467-022-31056-2
Smiley, K. T. (2020). Social inequalities in flooding inside and outside of floodplains during Hurricane Harvey. Environ. Res. Lett. 15 (9), 0940b3. doi:10.1088/1748-9326/aba0fe
Solecki, W., and Rosenzweig, C. (2019). New York city panel on climate change 2019 report chapter 9: Perspectives on a city in a changing climate 2008-2018. Ann. N. Y. Acad. Sci. 1439, 280–305. doi:10.1111/nyas.14017
Spader, J. (2017). Rebuilding housing in harvey’s aftermath: Two lessons from hurricanes Katrina and Rita. https://www.jchs.harvard.edu/blog/rebuilding-housing-in-harveys-aftermath-two-lessons-from-hurricanes-katrina-and-rita.
Strmic-Pawl, H. V., Jackson, B. A., and Garner, S. (2018). Race counts: Racial and ethnic data on the US census and the implications for tracking inequality. Sociol. Race Ethn. 4 (1), 1–13. doi:10.1177/2332649217742869
United States Global Change Research Program (Usgcrp), (2018). Impacts, risks, and adaptation in the United States: Fourth national climate assessment. Washington, DC, USA: U.S. Global Change Research Program. doi:10.7930/NCA4.2018
Vinke, K., Bergmann, J., Blocher, J., Upadhyay, H., and Hoffmann, R. (2020). Migration as adaptation? Migr. Stud. 8 (4), 626–634. doi:10.1093/migration/mnaa029
Wan, H., Yoon, J., Srikrishnan, V., Daniel, B., and Judi, D. (2022). Population downscaling using high-resolution, temporally-rich U.S. property data. Cartogr. Geogr. Inf. Sci. 49 (1), 18–31. doi:10.1080/15230406.2021.1991479
Wang, C., and Yarnal, B. (2012). The vulnerability of the elderly to hurricane hazards in Sarasota, Florida. Nat. Hazards 63, 349–373. doi:10.1007/s11069-012-0151-3
Wang, F., Tang, Q., and Wang, L. (2014). Post-katrina population loss and uneven recovery in new Orleans, 2000–2010. Geogr. Rev. 104, 310–327. doi:10.1111/j.1931-0846.2014.12028.x
Watkins, C., and Hagelman, C. R. (2011). Hurricane Katrina as a lens for assessing socio-spatial change in new Orleans. Southeast. Geogr. 51, 110–132. doi:10.1353/sgo.2011.0009
Wesseler, S. (2021). Climate change increases renters’ risks. https://yaleclimateconnections.org/2021/05/climate-change-increases-renters-risks/.
Winkler, R. L., and Rouleau, M. D. (2021). Amenities or disamenities? Estimating the impacts of extreme heat and wildfire on domestic US migration. Popul. Environ. 42, 622–648. doi:10.1007/s11111-020-00364-4
Woodruff, S., Meerow, S., Gilbertson, P., Hannibal, B., Matos, M., Roy, M., et al. (2021). Is flood resilience planning improving? A longitudinal analysis of networks of plans in boston and fort lauderdale. Clim. Risk Manag. 34, 100354. doi:10.1016/j.crm.2021.100354
Yamazaki, D., Ikeshima, D., Tawatari, R., Yamaguchi, T., O’Loughlin, F., Neal, J. C., et al. (2017). A high-accuracy map of global terrain elevations: Accurate Global Terrain Elevation map. Geophys. Res. Lett. 44, 5844–5853. doi:10.1002/2017GL072874
Yang, H., Lee, T., and Juhola, S. (2021). The old and the climate adaptation: Climate justice, risks, and urban adaptation plan. Sustain. Cities Soc. 67, 102755. doi:10.1016/j.scs.2021.102755
Zhao, N., and National Association of Home Builders (Nahb), (2022). The nation’s stock of second homes. https://eyeonhousing.org/2022/05/the-nations-stock-of-second-homes/.
Zoraghein, H., and Leyk, S. (2019). Data-enriched interpolation for temporally consistent population compositions. GIScience remote Sens. 56 (3), 430–461. doi:10.1080/15481603.2018.1509463
Keywords: low elevation coastal zone (LECZ), population, coastal vulnerability, US, climate justice, urban/rural, housing tenure, aging
Citation: Tagtachian D and Balk D (2023) Uneven vulnerability: characterizing population composition and change in the low elevation coastal zone in the United States with a climate justice lens, 1990–2020. Front. Environ. Sci. 11:1111856. doi: 10.3389/fenvs.2023.1111856
Received: 30 November 2022; Accepted: 25 July 2023;
Published: 11 August 2023.
Edited by:
Lynn Donelson Wright, College of William & Mary, United StatesReviewed by:
Dylan Shane Connor, Arizona State University, United StatesAaron Flores, Arizona State University, United States
Copyright © 2023 Tagtachian and Balk. This is an open-access article distributed under the terms of the Creative Commons Attribution License (CC BY). The use, distribution or reproduction in other forums is permitted, provided the original author(s) and the copyright owner(s) are credited and that the original publication in this journal is cited, in accordance with accepted academic practice. No use, distribution or reproduction is permitted which does not comply with these terms.
*Correspondence: Daniela Tagtachian, dtagtachian@gradcenter.cuny.edu
†These authors have contributed equally to this work