
95% of researchers rate our articles as excellent or good
Learn more about the work of our research integrity team to safeguard the quality of each article we publish.
Find out more
ORIGINAL RESEARCH article
Front. Environ. Sci. , 04 September 2023
Sec. Soil Processes
Volume 11 - 2023 | https://doi.org/10.3389/fenvs.2023.1108272
This article is part of the Research Topic Early-Career Scientists’ Contributions to Soil Processes Research: 2022 View all 7 articles
 Beverly Álvarez Torres1
 David R. Sotomayor Ramírez1*
 José Pablo Castro Chacón1
 Gustavo Martínez Rodríguez2Luis R. Pérez Alegría3Thomas M. DeSutter4
Soil degradation due to salts affects over 100 countries, especially in arid and semi-arid regions where salts migrate to the plant root zone via capillary action when evapotranspiration exceeds rainfall. Soil salinity reduces germination, growth, and root development, impacting crop yields, while excess sodium decreases water movement into the soil. Soil properties, namely, electrical conductivity (ECe), sodium adsorption ratio (SARe), and pH (pHe), affected by sparingly and soluble salts, are typically analyzed using soil saturated paste (SP). However, a simpler and cost-effective alternative is assessing soil salinity using soil:water solutions at ratio 1:5 (SW). This study developed empirical models between EC1:5-ECe, SAR1:5-SARe, and pH1:5-pHe to monitor soil salinity and sodicity in Lajas Valley, Puerto Rico, an agricultural reserve with 1,140 mm of mean annual rainfall and soils classified as saline and/or sodic. The ECe Sampling, Assessment, and Prediction software for Response Surface Sampling Design (ESAP-RSSD) optimized soil sampling with 48 points. Measurements of EC, pH, cations (Ca2+, Mg2+, Na+), and SAR were conducted using SP and 1:5 SW extracts. Simple linear regression models estimated ECe (R2 > 0.93, p < 0.0001) and SARe (R2 > 0.98, p < 0.0001) from 1:5 extracts. The pHe models varied with depth, showing a strong correlation (R2 > 0.62, p < 0.0001) from 0 to 30 cm and weakening (R2 > 0.27, p < 0.0022) from 90 to 120 cm. The simple linear regression models generally perform well for EC and pH variables, with better performance observed at shallower depths. SW proves to be a practical, cost-effective, and efficient method for assessing salt-affected soils in Lajas Valley. By enabling regular soil salinity analysis, the developed estimation models combined with SW extraction could improve soil management practices and agricultural productivity.
Halite, also known as sodium chloride (NaCl), is a mineral salt that has a detrimental effect on soil-water systems. High NaCl content in the soil leads to increased levels of total dissolved solids (TDS), soil alkalinity (pH), electrical conductivity (EC), and sodium adsorption ratio (SAR), which ultimately pose harm to the soil ecosystem, particularly those with clay-dominated textures like Vertisols and Mollisols from arid and semi-arid regions with shallow groundwaters. In those areas, the salts migrate to the plant root zone via capillary action when evapotranspiration exceeds rainfall, increasing the soil salinity and the crop water use (Aboelsoud et al., 2023). The solubilized sodium (Na+) ions penetrate between the clay layers, causing soil particle expansion and dispersion, reducing soil infiltration and overall structure (Rengasamy, 2010). Additionally, high chloride (Cl−) concentrations can lead to plant discoloration, necrosis, leaf burning, reduced nutrient absorption, and yield loss (Geilfus, 2018a; Geilfus, 2018b). More than 100 countries have soils with salt and Na+ concentrations high enough to reduce the yield of sensitive crops (Shahid et al., 2018). In 1990, the agricultural losses due to soil salinization were around $12 billion, and in 23 years, it would be expected to increase to $27.3 billion (Ghassemi et al., 1995). Salt-affected soils are found mainly in arid and semi-arid areas, sometimes classified as areas with agricultural potential. 1,030 Mha of the cultivated land area affected by salts or sodium presented 40% (412 Mha) saline conditions and 60% (618 Mha) sodic conditions (FAO-ITPS, 2015).
By the 1950s, the USSL recommended evaluating soil salinity and sodicity using the saturated paste (SP) method (USSL et al., 1954). This laboratory analysis consists of equilibrating a soil sample near its saturation point for 24 h and extracting the solution to measure (ECe), pHe, and quantify cations (Ca+2, Mg+2, and Na+) to calculate SARe. The SP method allows soils to be evaluated in a standard way and under similar hydric conditions, but it can be laborious and expensive in circumstances that require the analysis of a large number of samples, such as in studies on a regional scale.
As an alternative, empirical models have established the quantitative relationships between the parameters measured in extracts of SP and soil:water solutions at ratio 1:5 (SW)to generate conversion factors that allow predicting one method to another (Table 1). Furthermore, The Australian Soil Classification System integrates SW to assess soil salinity and sodicity. This system estimates conversion factors between the EC measured in SP and SW extracts at a ratio of 1:5 (m:v) adjusted to soil texture (Isbell, 2021).
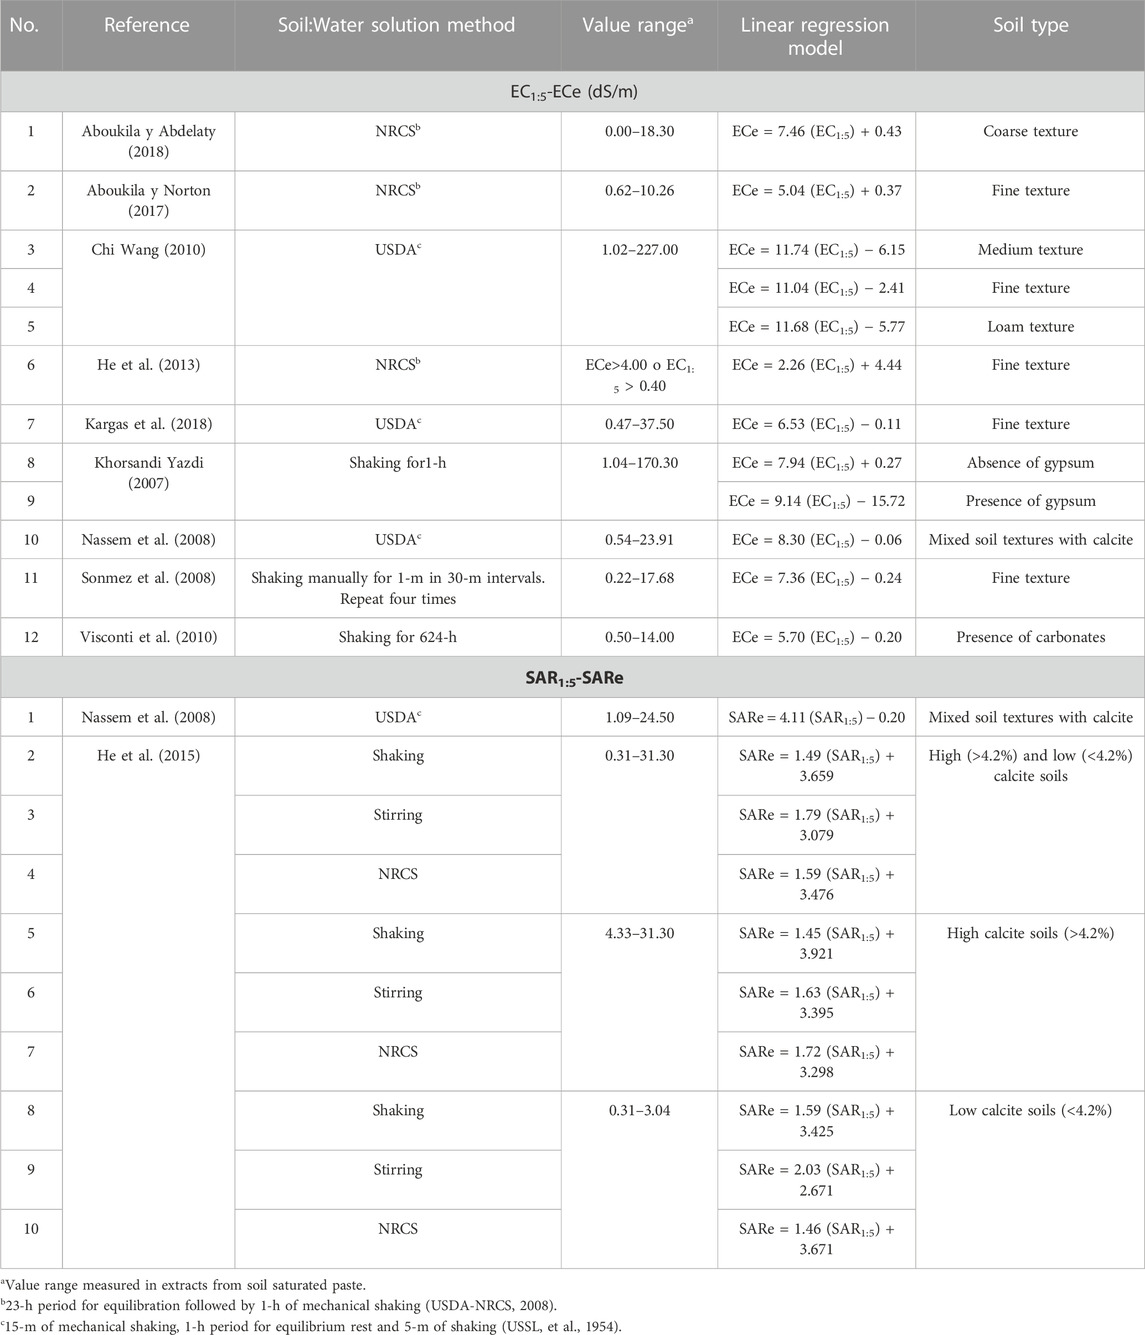
TABLE 1. List of published simple linear regression models for EC1:5-ECe and SAR1:5-SARe.
Soil:water extractions reduce the number of samples, preparation time, and labor required to evaluate the soil salinity. However, SW extracts are not a substitute for SP extracts (Corwin and Yemoto, 2017). In SW, the water content can exceed the soil saturation point, promoting the dilution of salts, the breaking of microaggregates, and changes in EC, pH, and SAR values, depending on the proportion of soil:water used, soil texture and mineralogy, salt solubility, and cation exchange capacity, among other properties (USSL et al., 1954). The technique used must be consistent in terms of the proportion, the extraction method used, and the equilibrium time of the SW so that the prediction models developed are practical and valid in the area of interest (Khorsandi and Yazdi, 2007; Nassem et al., 2008; Sonmez et al., 2008; Chi and Wang, 2010; Visconti et al., 2010; He et al., 2015; 2013; 2012; Aboukila and Abdelaty, 2017; Aboukila and Norton, 2017; Kargas et al., 2018; Franzen et al., 2019; Isbell, 2021).
Bonnet and Brenes (1958) generated an inventory of salt-affected soils in 9,932.6 ha in the Lajas Valley, Puerto Rico, an agricultural reserve with 1,140 mm (44.88 inches) of mean annual rainfall (Viqueira and Meyer, 2012; US Dept. of Commerce-NOAA-NWS, 2020). 14% of the evaluated area (0–20 cm deep) was classified as saline, sodic, or saline-sodic, according to the criteria established by USSL (1954). The degree of salinity and sodicity in the valley soils increased at greater depths. More than 60 years after the construction of the Lajas Valley irrigation and drainage system, soil salinity continues to be a concern among farmers despite their efforts to implement agronomic practices that promote soil quality and conservation in agricultural terms.
Currently, replicating the SP analyses at the same sampling density would be costly, even if the sample is sent processed (dry and sieved), since usually the SP is twice as expensive as the SW. The objective of this study was to develop empirical models between the EC (EC1:5-ECe), SAR (SAR1:5-SARe), and pH (pH1:5-pHe) measured in SP and SW at a ratio of 1:5 (m:v), as an alternative method to promote the continuous monitoring of the salinity and sodicity status of the soils of Valle de Lajas, Puerto Rico.
The soil samples used in this study were collected in the Lajas Valley, southwest of Puerto Rico.Soil sample sets were taken from farms managed by the companies BASF (F1; 17.990565, −66.961497), dedicated to the row crop seed industry, and RiceTec (F2; 18.025890, −67.028734), dedicated to the production of hybrid rice seeds (Figure 1). F1 is a farm located southwest of the valley with a total area of 93 ha of continuous land. F2 is a farm in the center of the valley composed of eleven nearby discontinuous fields with a total area of 88 ha. A third set of soil samples distributed among farms in the valley (F3) was used for the regression model’s validation process. These soil samples covered a total area of 1,107 ha as part of a soil salinity study at the regional scale (Castro-Chacón, 2021).
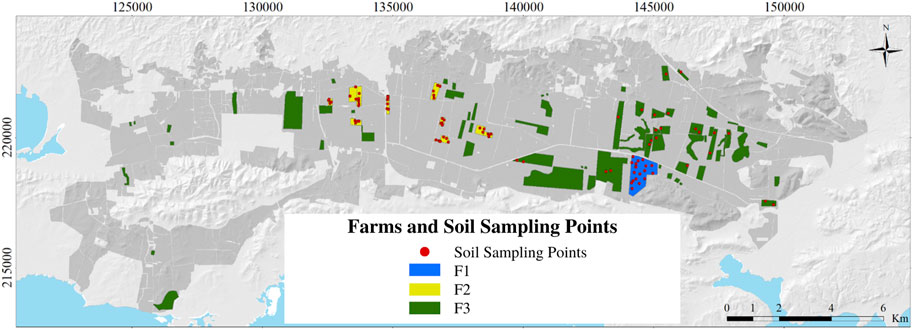
FIGURE 1. Map of the farms and sampling points in the Lajas Valley, Puerto Rico.
Apparent electrical conductivity surveys in vertical mode (ECaV) were taken with an EM-38 sensor (Geonics Limited, Ontario, Canada). The ECaV surveys grouped by soil series were taken as part of a field and regional scale soil salinity study implementing electromagnetic induction (Castro-Chacón, 2021; Álvarez-Torres, 2021). Sampling points in F1 (n = 18) and F2 (n = 30) were determined and georeferenced by stochastic methods using the ECe Sampling, Assessment, and Prediction - Response Surface Sampling Design Software (ESAP-RSSD) (Lesh et al., 2000). The execution of this program optimized the selection of sampling points, reducing the number of samples necessary to relate ECaV with soil properties such as ECe, pHe, and SARe. Accordingly, 48 soil profiles were taken from 0 to 120 cm and divided in four increments of 30 cm for a total of 192 soil samples. Two sampling points and its relevant samples (n = 8) were removed by proximity to soil tumors conditions (Acevedo et al., 1959). The remaining 184 soil samples represented the soil subgroups Sodic Epiaquerts (n = 24), Sodic Haplusterts (n = 48), Typic Calciaquerts (n = 44), and Typic Haplusterts (n = 68).
The soil samples were air-dried at a mean room temperature of 24°C, followed by 24 h in a ventilated oven at 40°C, and hand-milled and sieved through a 2-mm mesh, both manufactured by Global Gilson Company, Inc., (Lewis Center, OH). Aqueous extracts were obtained from soil SP and SW at 1:5 ratio (m:v). The soil saturated paste extracts were obtained by the Charles E. Kellogg Soil Survey Laboratory (KSSL), in Lincoln, NE, following the methods 4F2 and 4F3, included in the Kellogg Soil Survey Laboratory Methods Manual (Soil Survey Staff, 2014). The ECe, pHe, and cations were analyzed by the methods 4F2b1, 4C1a1a2, and 4F2c1a, respectively.
For SW, the samples were processed using a methodology adapted from USSL (1954), Zhang et al. (2005), He et al. (2012), Crouse et al. (2014), and Herrero et al. (2015). Accordingly, 25 mL of distilled water were added to 5 g of soil, stirred for 4 h, the supernatant was separated by centrifugation at 3,000 rpm for 10 min at 19°C and filtered through a 0.45 µm cartridge filter (Whatman™ Autovial ™ Syringeless Filters). During preliminary tests, the soil:water ratio 1:5 (m:v) was selected because at higher soil ratios, little volume of extract was obtained by the expansion of the 2:1 clays, predominantly from the smectite group (Soil Survey Staff, 2014). A 15-mL portion was sent to the University of Georgia (UGA) Agricultural and Environmental Services Laboratories, in Athens, GA, to quantify cations (Ca+2, Mg+2, and Na+ in meq/L) by induction plasma spectroscopy (ICP-OES) (Martin et al., 1994). The pH and EC adjusted to 25°C were measured using the Orion Star™ A215 pH/Conductivity meter (Thermo Scientific Orion, MA, USA) calibrated with buffer solutions at pH values of 4.01, 7.00 and 10.01 and EC standard solutions at 1.413 dS/m and 12.9 dS/m, following the manufacturer’s instructions.
In both extracts, the sodium adsorption ratio (SAR) was calculated according to the following equation:
The use of SAR instead of the Cation Ratio of Soil Structural Stability (CROSS) was based on the specific conditions of the soil since the potassium concentration was significantly lower compared to sodium levels. This imbalance in the potassium-to-sodium ratio could affect the soil’s structural stability. However, by utilizing the SAR, the potential impact of high sodium levels on soil permeability and structure can be assessed. SAR provides valuable information about the sodium hazard in the soil, helping us understand the risk of soil dispersion and reduced water infiltration caused by excessive sodium content. While CROSS is a useful parameter for evaluating the stability of soil aggregates based on cation ratios, the emphasis on SAR in this case reflects the specific concern regarding the low potassium concentration compared to sodium (Rengasamy and Marchuk, 2011).
A second validation data set was completed using soil samples obtained from soil sampling points selected near the central area of fields distributed around the Lajas Valley (F3). These samples were processed and analyzed implementing the same methods, excepted for the SP which were prepared by laboratory staff from the University of Puerto Rico–Mayaguez, Puerto Rico (UPRM), following the method described by (USSL et al., 1954). Both extracts were analyzed by UGA Agricultural and Environmental Services Laboratories (Athens, GA) to quantify cations (Ca+2, Mg+2, and Na+ in meq/L) by Inductively Coupled Plasma Optical Emission spectroscopy (ICP-OES) (U.S. EPA, 1994) and by the UPRM to measure pH, EC, and SAR utilizing the methods described above. This validation was made with the objective of determining the applicability of the simple linear models to soil extracts obtained from SP and SW at 1:5 ratio (m/v) performed by different soil laboratories.
The soil sample dataset (F1+F2) was divided into 2 sub-datasets, one for calibration (78%; n = 144) and one for validation (22%; n = 40). The statistical summary and analysis were performed using the statistical software Infostat Version 2014 (UNC, Córdoba, Argentina) (Balzarini et al., 2008). In both datasets, the outlier values were identified based on the interquartile range beyond the quartiles. The assumptions of normality of experimental errors, homogeneity of variances, and linearity were validated using a Shapiro-Wilks test, histograms, and F test, respectively. An analysis of variance (ANOVA) using the comparison method Fisher LSD was performed to compare the mean of the parameters between methods, farm, depth, and soil subgroup. With the calibration set, simple linear regression model were generated to determine predictive equations between EC (dS/m), pH and SAR measured in SP and SW at 1:5 ratio (m:v). The simple linear regression models were generated by general depth (0–120 cm) and by increments of 30 cm of depth in those with a minimal statistically significant difference. From both validation data sets, the ECe, pHe, and SARe were compared with estimations obtained from the generated predictive models and from predictive models published previously (Table 1).
The descriptive statistics results are summarized in Table 2. The EC, pH, SAR and cations measured in both extracts presented asymmetric distributions positively skewed, except for the pHe with symmetric distribution. In general, the means of EC, Ca+2, Mg+2, and Na+ were 3.4, 12.7, 8.5, and 3.6 times higher in extracts from SP when compared to the extract from SW at 1:5 ratio (m:v) (p < 0.0001), while in pHe was 1.0 time lower than pH1:5 (p < 0.0001) (Table 3). The SAR means were not statistically different between methods (p = 0.6782) (Table 3).
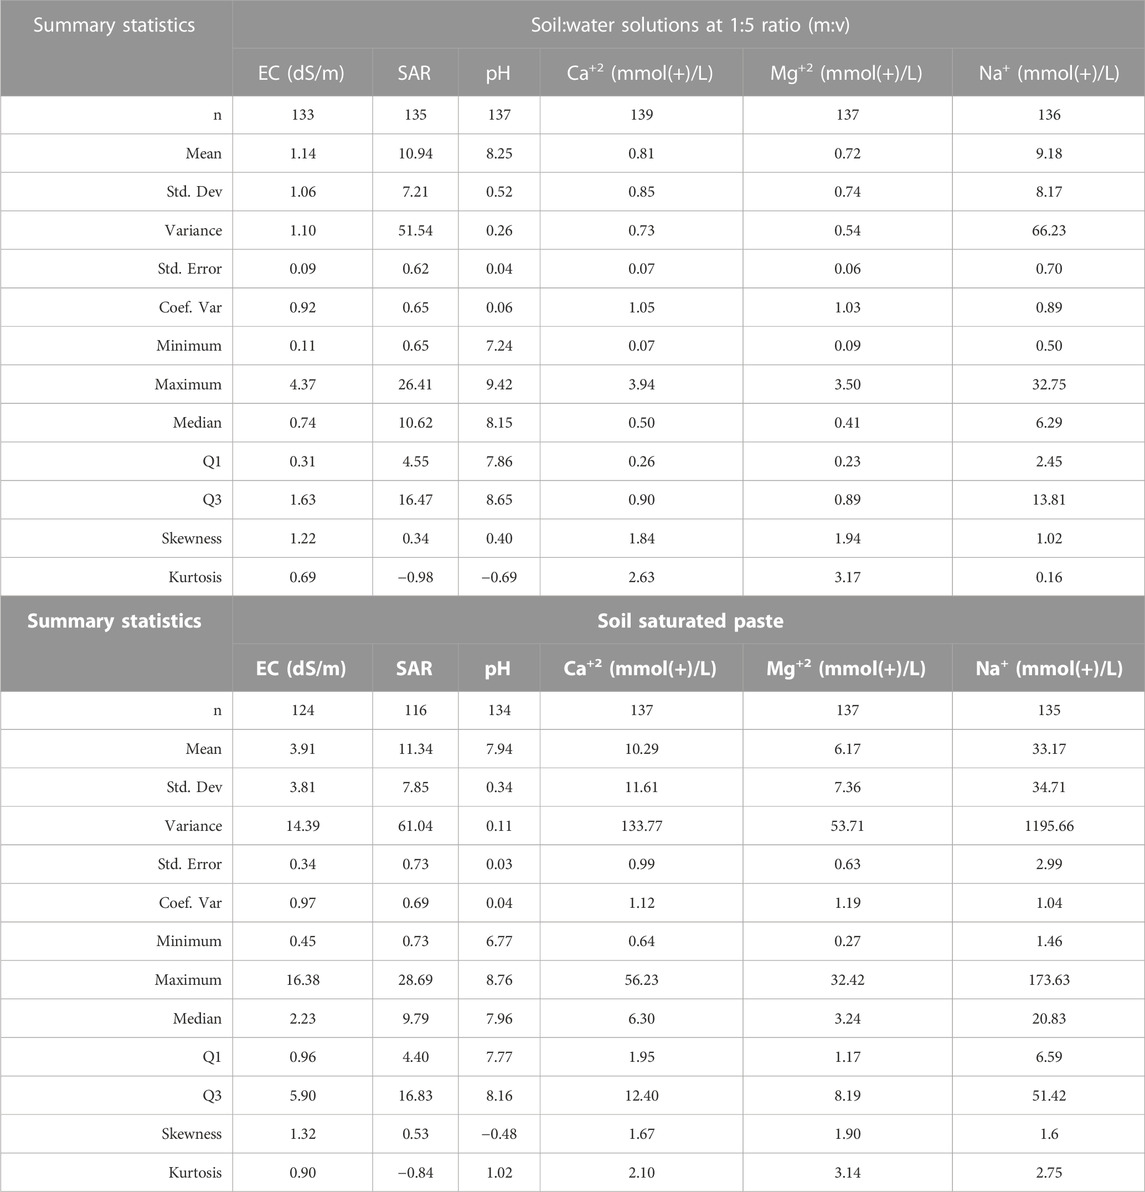
TABLE 2. Statistical summary of electrical conductivity (EC), sodium adsorption ratio (SAR), pH, and cation concentrations in extracts from soil saturated paste and soil:water solutions at 1:5 ratio.
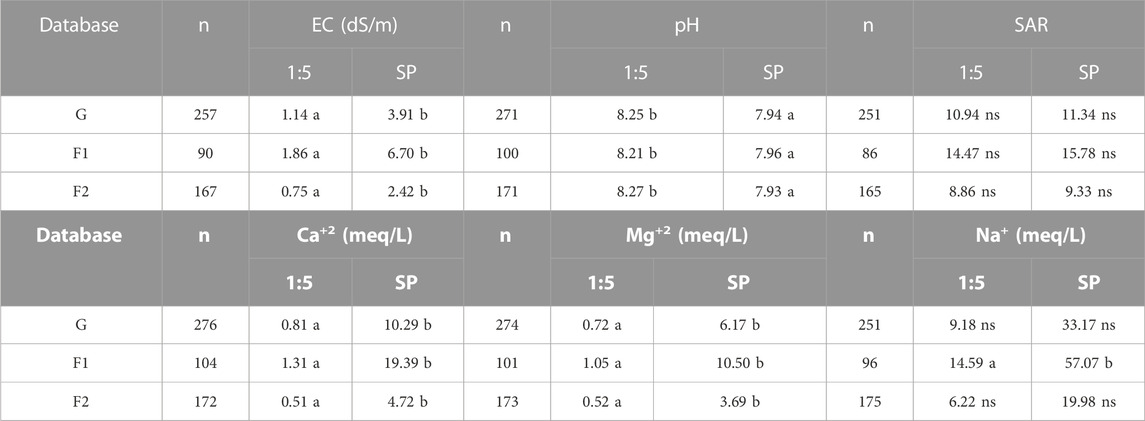
TABLE 3. Comparison of means for EC, pH and SAR, Ca+2, Mg+2, and Na+ grouped by laboratory methods.
In F1, the means of EC, SAR, Ca+2, Mg+2, and Na+ measured in both extracts were statistically higher than in F2 (p < 0.0001), while the pH means were not statistically different between farms (p = 0.4877) (Table 4). In both farms, the means of EC, Ca+2, Mg+2, and Na+ were statistically higher in extracts from SP (p < 0.0001), while pH means were statistically higher in SW extracts (p = 0.0018) and SAR means were no statistically different between methods (p > 0.05) (Table 4).
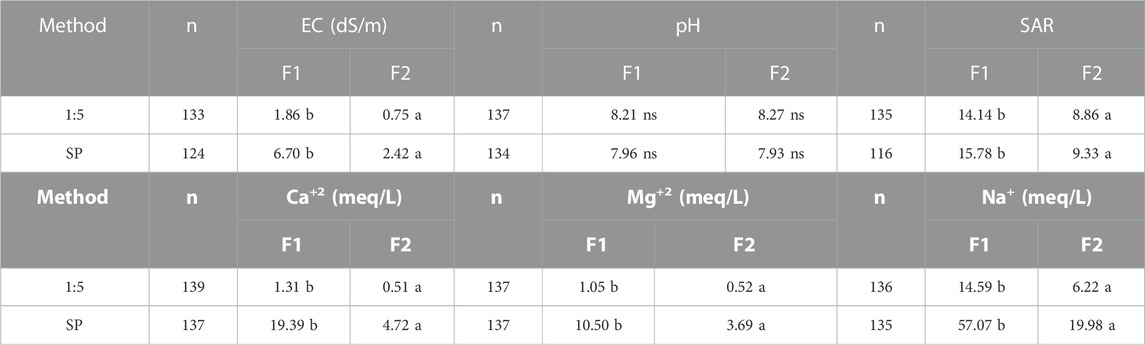
TABLE 4. Comparison of means for EC, pH and SAR, Ca+2, Mg+2, and Na+ grouped by farms.
By the depth, the ECe, SARe, pHe, EC1:5, and cation in both extracts were statistically higher from 90 to 120 cm (p < 0.0001) (Table 5). The lowest values for the salinity parameters measured in both extracts were obtained from 0 to 30 cm, followed by 30–60 cm (Table 5). The smallest number of samples (n) belongs to depth from 90 to 120 cm. At that depth, values out of range were presented and classified as atypical points or outliers.
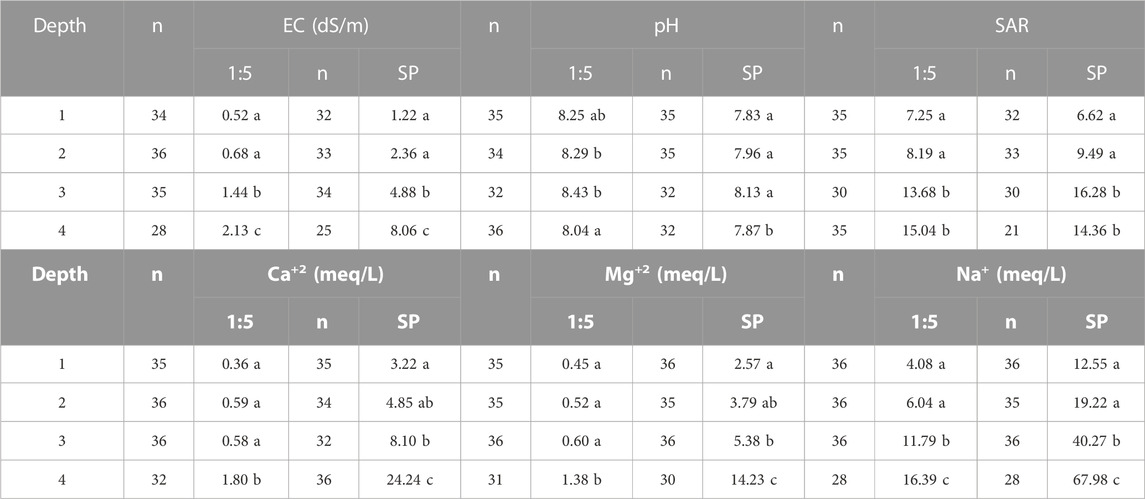
TABLE 5. Comparison of means for EC, pH and SAR, Ca+2, Mg+2, and Na+ grouped by depths.
The soil subgroup Typic Haplusterts obtained the lowest means for ECe (p < 0.0001) and SARe (p < 0.0001), while the highest means for both parameters were obtained in Typic Calciaquerts (p < 0.0001) and Sodic Haplusterts (p < 0.0001), where Ca+2 and Na+ were the predominant cations (Table 6). The pHe was not significantly different (p > 0.05) between subgroups, with values between 8.11 and 3.35 for soil:water solution extracts and 7.89 and 8.01 for soil saturated paste extracts (Table 6).
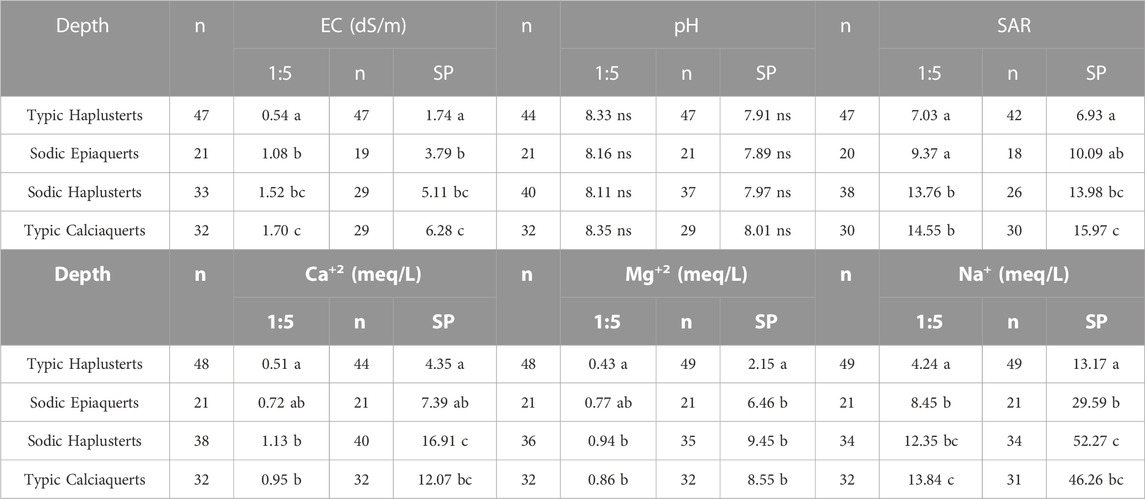
TABLE 6. Comparison of means for EC, pH and SAR, Ca+2, Mg+2, and Na+ grouped by soil subgroup.
Simple linear regressions were conducted to calibrate EC1:5, pH1:5 and SAR1:5 to ECe, pHe and SARe, respectively. The general regression models for EC1:5-ECe pH1:5-pHe and SAR1:5-SARe were significant (p < 0.0001) (Table 7). The linear correlations obtained for ECe and SARe were very strong with R2 of 0.97 (Figure 2A) and 0.99 (Figure 3A), respectively, while for pHe, the correlation was strong (R2 = 0.62) (Figure 4A). Unlike the models SAR1:5-SARe and pH1:5-pHe, the EC1:5-ECe models did not meet the assumption of homogeneity of variances (p = 0.0007).
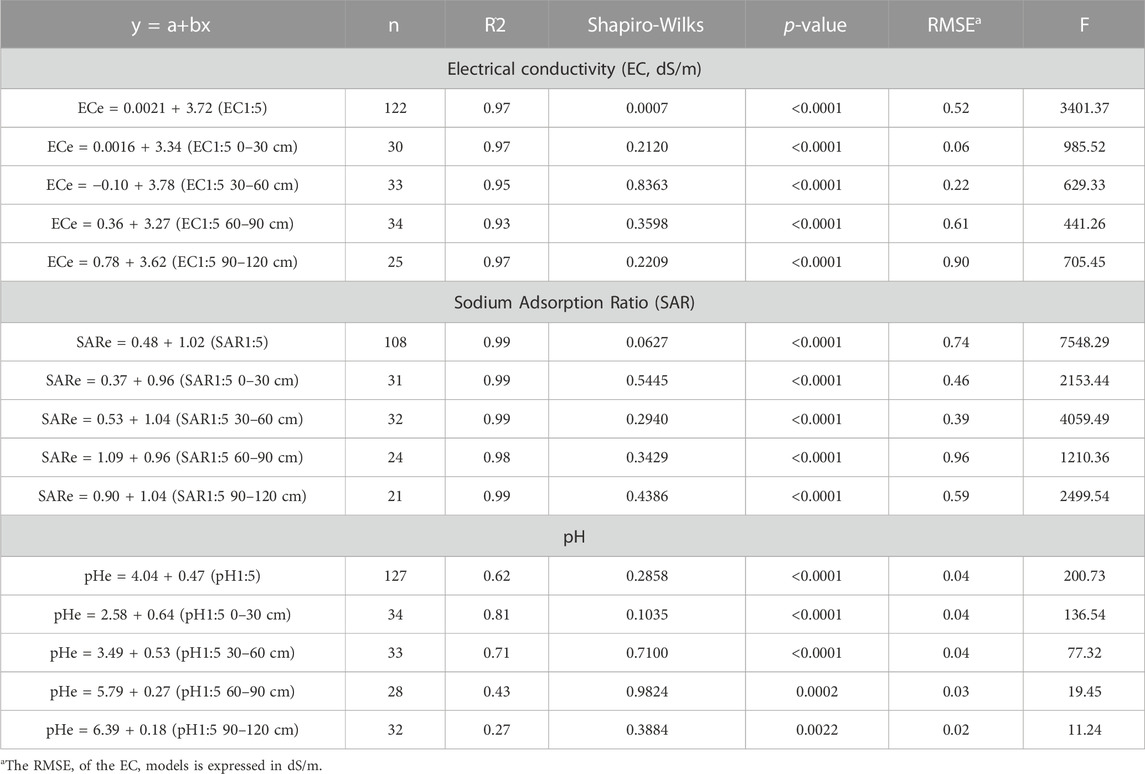
TABLE 7. Simple linear regression models to calibrate EC1:5 (dS/m), pH1:5 and SAR1:5 into ECe (dS/m), pHe and SARe for soils in the Lajas Valley, Puerto Rico.
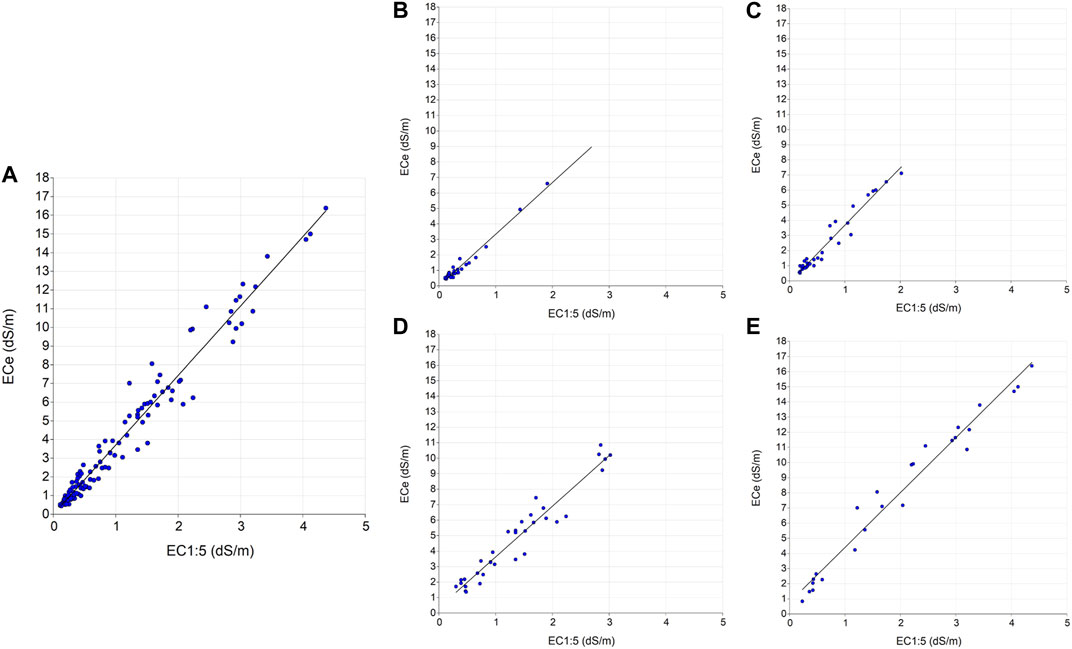
FIGURE 2. Simple linear regression for ECe using a general (A) and segmented models for depth 1 (B), 2 (C), 3 (D), and 4 (E).
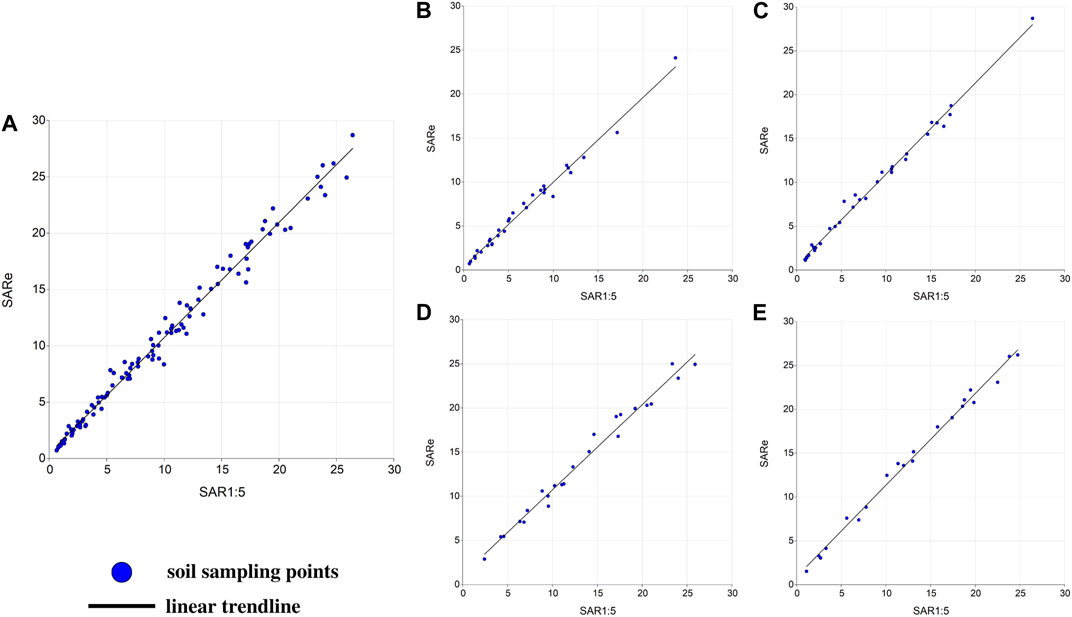
FIGURE 3. Simple linear regression for SARe using a general (A) and segmented models for depth 1 (B), 2 (C), 3 (D), and 4 (E).
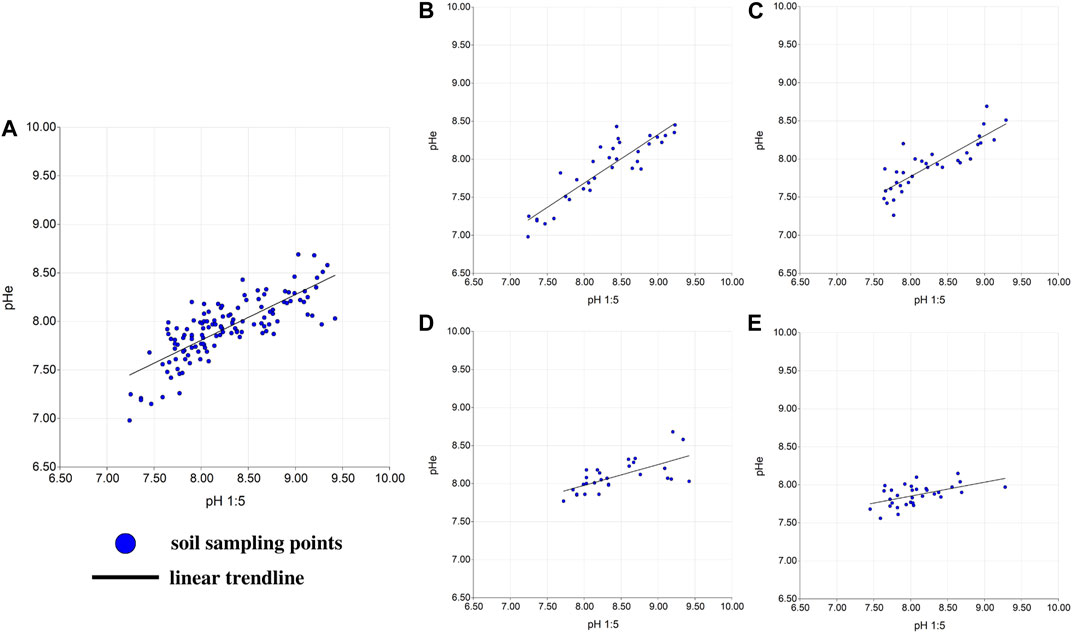
FIGURE 4. Simple linear regression for pHe using a general (A) and segmented models for depth 1 (B), 2 (C), 3 (D), and 4 (E).
For the grouped data, the results demonstrated a slope indicator not equal to zero and a linear correlation between the values of EC, pH, and SAR measured in both extracts. The positive asymmetry distribution of the homogeneity of variances in the EC1:5-ECe regression model could be due by the predominance of values below the mean and points of high influence. The slope estimator in the models indicated that for each unit change in the EC1:5, pH1:5, and SAR1:5 values, the ECe, SARe, and pHe, values will change by 3.72 dS/m, 1.02, and 0.47 units, respectively. Based on the confidence intervals with a confidence level of 95%, the mean value of the predicted ECe, SARe, and pHe will change between 3.59 and 3.84 dS/m, 1.00 and 1.05, and 0.27 and 0.39 units for each unit of EC1:5, SAR1:5, and pH1:5 respectively. If the initial value for EC1:5, SAR1:5, pH1:5 is zero, the value for ECe, SARe, pHe is expected to be 0.0021 dS/m, 0.48, and 4.04, respectively. However, in the context of the Lajas Valley, it is important to note that the initial value of the independent variable (x) may not be expected to be exactly zero due to the prevailing soil salinity conditions. Consequently, the intercepts obtained from the linear models do not necessarily represent a true zero point but rather the starting point within the observed range, considering the existing soil salinity conditions in the Lajas Valley. It is essential to be aware of this aspect when interpreting the intercept values in relation to the respective variables under investigation.Based on observations by Bonnet and Brenes (1958) relating soil salinity and depth of sampling, the data was segmented by depth (1 = 0–30 cm, 2 = 30–60 cm, 3 = 60–90 cm, and 4 = 90–120 cm) to conduct simple linear regressions. The regression models for EC1:5-ECe pH1:5-pHe and SAR1:5-SARe segmented by depth were significant (p < 0.0001) and met the assumption of homogeneity of variances (Table 7). The linear correlations obtained for ECe and SARe were very strong with R2 > 0.93 and R2 > 0.98 for all depths (Figures 2, 3), respectively. For pHe, the correlation was very strong for depth 1 (R2 = 0.81), strong for depth 2 (R2 = 0.71), medium for depth 3 (R2 = 0.43), and weak for depth 4 (R2 = 0.27) (Figure 4).
For the segmented data by depth, the results demonstrated a slope indicator not equal to zero and a linear correlation between the values of EC, pH, and SAR measured in both extracts. The slope estimator presented the tendency to increase with depth, except for depth 3 in which the values were slightly lower than depth 1. Accordingly, for each unit change in the EC1:5, SAR1:5, and pH1:5 values, the ECe, SARe, and pHe values will change by 3.34, 0.96, and 0.64 units for depth 1, 3.78, 1.04, and 0.53 units for depth 2, 3.27, 0.96, and 0.27 units for depth 3, and 3.62, 1.04, and 0.18 units for depth 4, respectively. Based on the confidence intervals with a confidence level of 95%, the mean value of the predicted ECe will change between 3.12 and 3.55 dS/m for depth 1, 3.48 and 4.09 units for depth 2, 2.96 and 3.59 units for depth 3, and 3.34 and 3.91 units for depth 4. For the pH, the mean value of the predicted pHe will change between 0.12 and 0.28 units for depth 1, 0.18 and 0.39 units for depth 2, 0.40 and 0.82 units for depth 3, and 0.54 and 1.15 units for depth 4. For the SAR, the mean value of the predicted SARe will change between 0.92 and 1.00 units for depth 1, 1.01 and 1.07 units for depth 2, 0.91 and 1.02 units for depth 3, and 1.00 and 1.09 units for depth 4. If the initial values for EC1:5, SAR1:5, and pH1:5 in depths 1, 2, 3, and 4 are all 0, the expected values for ECe, SARe, and pHe by depth are 0.0016 dS/m, 0.37, and 2.58, respectively, for depth 1; −0.10 dS/m, 0.53, and 3.49, respectively, for depth 2; 0.36 dS/m, 1.09, and 5.79, respectively, for depth 3; and 0.78 dS/m, 0.90, and 6.39, respectively, for depth 4.
If the initial value for EC1:5 in dept 1, 2, 3 and 4 is 0 dS/m, the value for ECe by depth is expected to be 0.0016, −0.10, 0.36, and 0.78 dS/m, respectively. If the initial value for SAR1:5 in depth 1, 2, 3 and 4 is 0, the value for SARe by depth is expected to be 0.37, 0.53, 1.09, and 0.90, respectively. If the initial value for pH1:5 in depth 1, 2, 3 and 4 is 0, the value for pHe by depth is expected to be 2.58, 3.49, 5.79, 6.39, respectively.
The validation of the regression models was completed determining the r value between the measured and predicted ECe, SARe and pHe using the general and segmented models (Figure 5). The regression line established between the measured and predicted ECe using the general model obtained a r value of 0.96, while for depths 1, 2, 3, and 4, the r value was 0.98, 0.99, 0.81, and 0.95, respectively (Figure 5A). For the SARe, the general regression model obtained a r value of 0.80, while for depths 1, 2, 3, and 4, the r value was 0.97, 0.73, 0.69, and 0.67, respectively (Figure 5B). For the pHe, the general regression model obtained a r value of 0.78, while for depths 1, 2, 3, and 4, the r value was 0.94, 0.93, 0.61, and 0.39, respectively (Figure 5C). The second validation data set analyzed the relationship between the predicted and measured ECe using the general model. The general model’s r value was 0.86, while the predicted r value was 0.77, 0.97, 0.85, and 0.96 for depths 1, 2, 3, and 4, respectively (Figure 5D). For the SARe, the model’s r value was 0.86, while the predicted r value was 0.99, 0.90, 0.99, and 0.96, for depths 1, 2, 3, and 4, respectively (Figure 5E). The general model’s r value for the pHe was 0.52. On the other hand, the values for depths 1, 2, 3, and 4, were respectively 0.20, 0.60, 0.91, and −0.51 (Figure 5F).
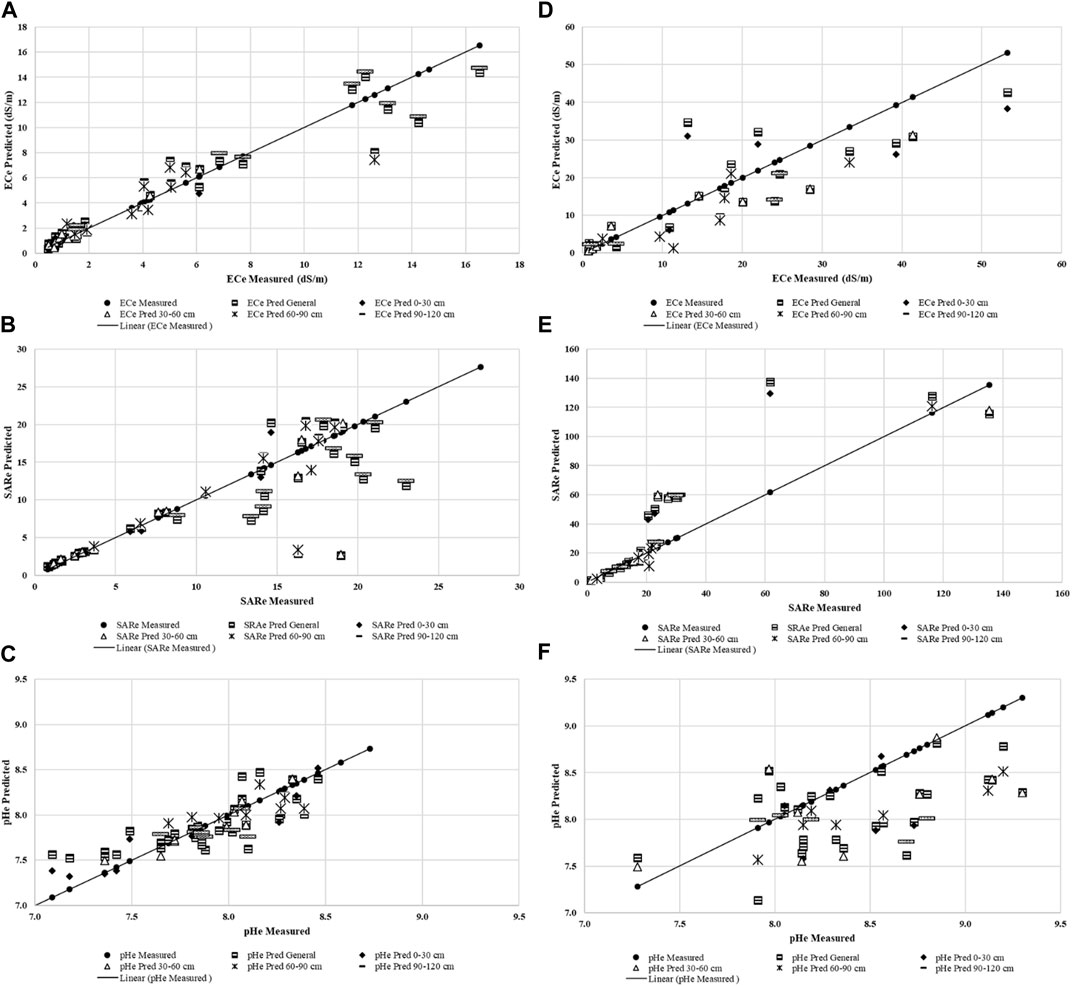
FIGURE 5. Relationship between measured and predicted ECe, SARe, and pHe implementing general and segmented models by depths in soil samples from F1-F2 (A–C), and F1-F2-F3 (D–F).
Different authors have found that the EC1:5-ECe prediction models are specific to the types of soils and their characteristics. Based on t-ANOVA, the regression model generated in this study to predict ECe from EC1:5 was not statistically different (p > 0.05) from those obtained by Aboukila and Norton (2017) (r = 0.96), He et al. (2013) (r = 0.76), Sonmez et al. (2008) (r = 0.92), Visconti et al. (2010) (r = 0.94), Aboukila and Abdelaty (2017) (r = 0.92), Nassem et al. (2008) (r = 0.92), and Kargas et al. (2018) (r = 0.96) (Table 8). These simple linear regression models obtained slopes between 2.26 and 9.14 considering samples with ECe values less than 37.50 dS/m, fine texture, and with carbonate and smectitic clay.
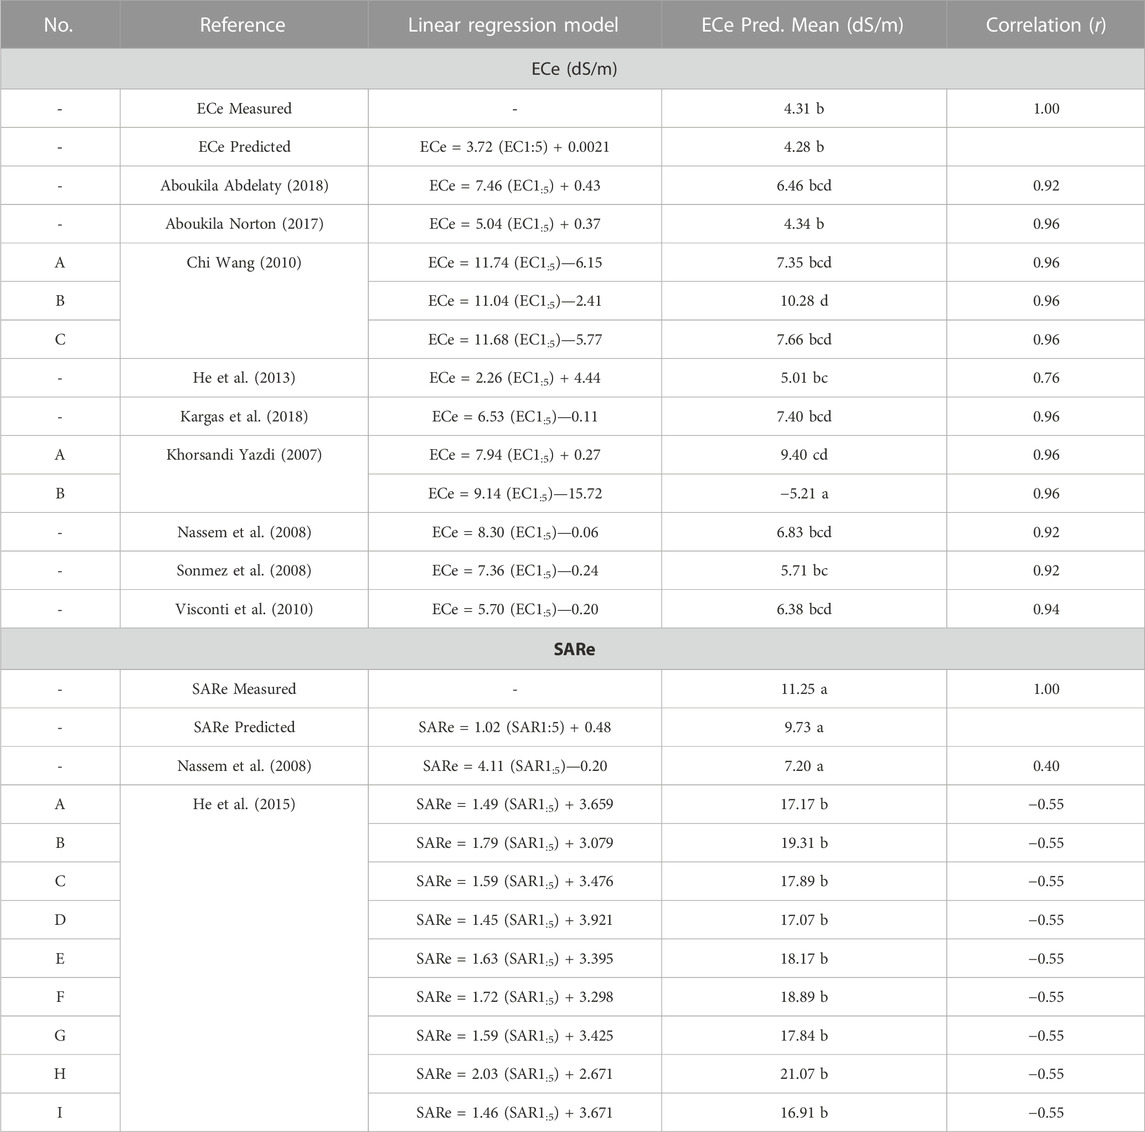
TABLE 8. Correlation between measure and predicted ECe and SARe using published simple linear regression models for EC1:5-ECe and SAR1:5-SARe.
Khorsandi and Yazdi (2007) segmented the models by absence (A) or presence (B) of gypsum, including soil samples with ECe values from 1.04 to 170.30 dS/m and gypsum content from 0 to 23.30 cmol/kg. Both models obtained a r = 0.96, but the values were not well fitted to the measured ECe trend line (Figure 6). The ECe predicted means with the regression models A and B were significantly different (p < 0.05) from our general model, but not from the mean ECe predicted from other authors (Table 8). The regression model B presented a trend line to negative ECe predicted values.
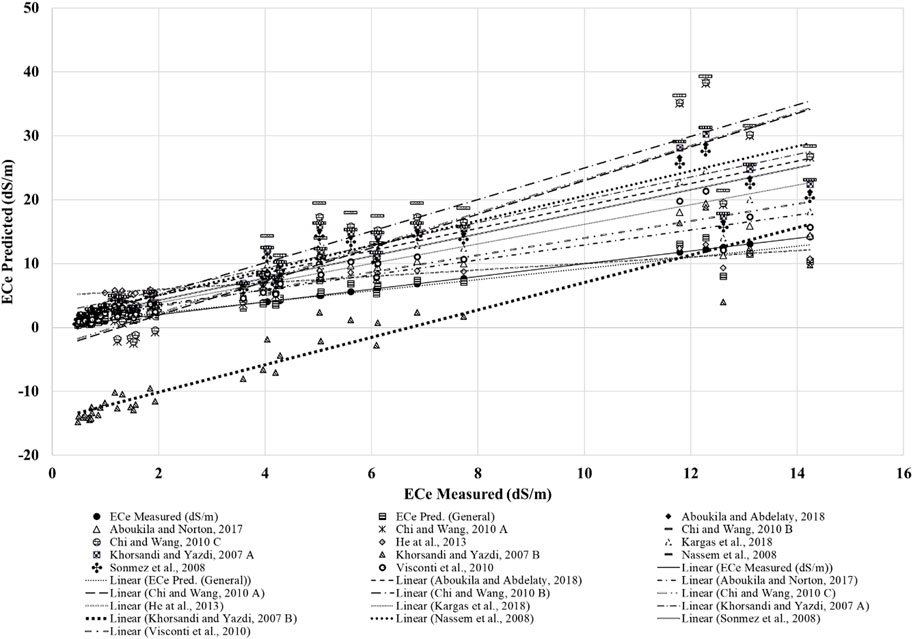
FIGURE 6. Comparison between predicted ECe in soils samples from the Lajas Valley using EC1:5-ECe regression models generated by different authors (Table 1).
The correlation between the SARe measured and the SARe predicted obtained an r value of −0.55 and 0.40 for the regression models developed by He et al. (2013) and Nassem et al. (2008), respectively (Figure 7). Based on t-ANOVA, the mean SARe predicted using the regression model published by Nassem et al. (2008) was not statistically different (p < 0.05) from the SARe measured in this study (Table 8). However, regression models developed by He et al. (2013) for soils with similar properties in the Great Plains, were statistically different (p > 0.05) from the predicted SARe using the general model developed in this study (Table 8).
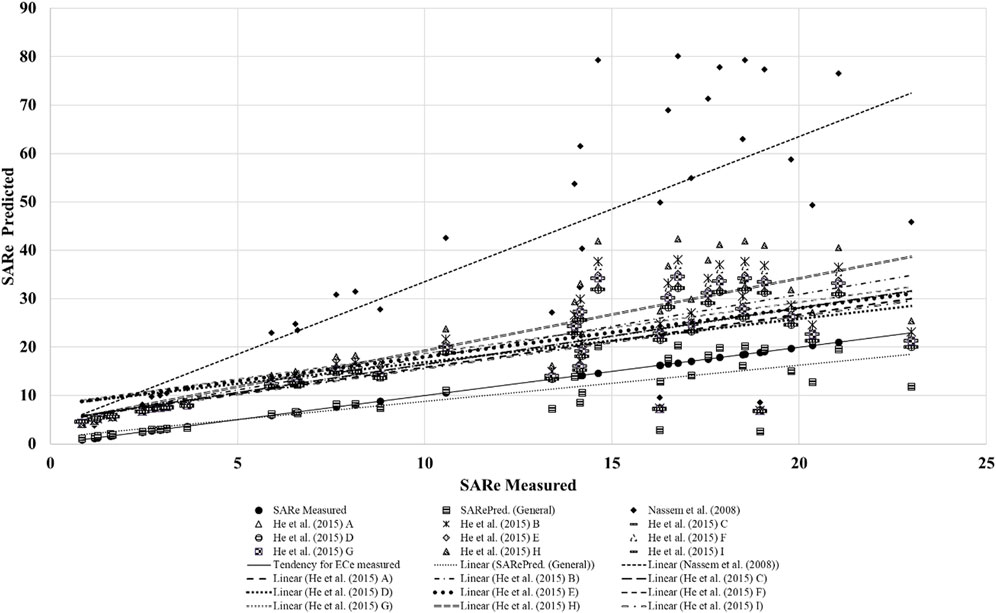
FIGURE 7. Comparison between predicted SARe in soils samples from the Lajas Valley using EC1:5-ECe regression models generated by different authors (Table 1).
The mean values of EC, pH and SAR were greater than median values, resulting in positively skewed distributions. The similarity in the measurements of SAR1:5 and SARe was due to the fact that the proportion in the concentration of Ca+2+Mg+2 and Na+ between methods was maintained. This difference between the concentration of cations could imply the underestimation of the sodicity of the soil, since the arithmetic of the equation to calculate SAR uses the concentration of Na+ as numerator and the sum of the concentrations of Ca+2+Mg+2 as denominator. In the case of pH1:5 and pHe, it could be manifesting the buffering capacity of the predominant smectite and vermiculite clays in the soils of the valley (USDA-NRCS, 2008), a property that allows resisting abrupt changes in pH in the soil solution (Buol et al., 2011).
In general, 42%, 45% and 7% of the samples obtained ECe> 4 dS/m, SARe> 13, and pHe> 8.5, respectively. When classifying soils according to the criteria established by the USSL (1954) using the ECe, SARe, and pHe values from soil samples, at least 42% presented a soil condition classified normal or non-affected by salts, while 7%, 35%, and 5% presented saline, saline-sodic, and sodic conditions, respectively. From 0 to 60 cm of depth, 32% of the samples were predominantly normal, while from 60 to 120 cm, 24% presented saline-sodic condition.
Based on the mean values, soil samples from 0 to 30 cm of depth presented normal conditions, while from 60 to 120 cm presented saline-sodic conditions. Soil samples from 30 to 60 cm of depth the soil condition presented a tendency to turn from a normal to a saline-sodic condition. These findings are consistent with results obtained by Bonnet and Brenes (1958) at regional scale, which could be indicating that the tendency of these soil parameters in the Lajas Valley have not undergone a significant change over the years. Based on mean values, saline-sodic was the predominant soil condition in general and in F1, while soil samples in F2 presented a tendency to turn from a normal to a saline-sodic condition. These observations were expected considering the approximation of F1 to fields that were part of the already drained Guánica Lagoon, an artesian ground-water discharge area where previous findings reported saline and/or sodic conditions in soil samples (Acevedo et al., 1959).
When classifying soils according to the criteria established by the USSL (1954) using the ECe, SARe, and pHe mean values, the soils subgroups Sodic Haplusterts (Fe and Cartagena series) and Typic Calciaquert (Guánica series) classified as saline-sodic, while those under Typic Haplusterts (Fraternidad and Santa Isabel series) and Sodic Epiaquerts (Aguirre series) classified as normal and saline, respectively (Figure 8). For the Sodic Haplusterts and Typic Calciaquert subgroups, the results obtained were consistent with the taxonomic description, which indicates that the soils under the Sodic Haplusterts subgroup have SARe values greater than or equal to 13 within the first 100 cm of depth, and soils under Typic Calciaquert a calcic horizon within the top 100 cm of mineral soil, according to the US Soil Taxonomy (USDA-NRCS, 2008). For the Typic Haplusterts subgroup, the soil conditions classified as normal as described in the taxonomic description even at depths greater than those evaluated in this study. For the Sodic Epiaquerts subgroup, the soil condition classified as saline, which was a result inconsistent with the taxonomic description, which indicates that the soils under this subgroup have SARe values greater than or equal to 13 within the first 100 cm of depth, according to the US Soil Taxonomy (USDA-NRCS, 2008). However, this inconsistent could be suggesting that the salt content in the Aguirre soils, classified as Sodic Epiaquerts, could have decrease over the years.
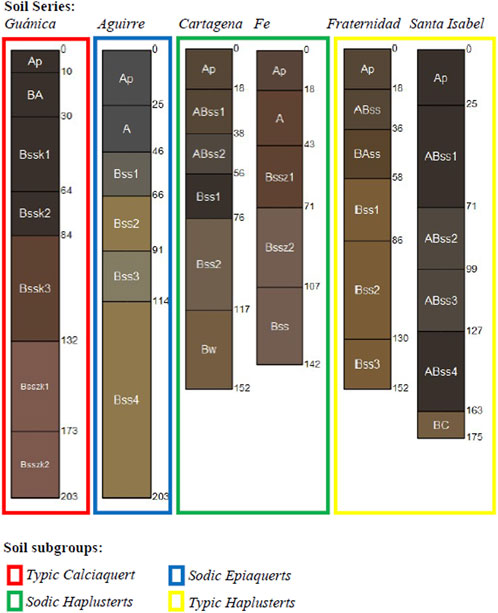
FIGURE 8. Visual comparison of soil profiles classified under different soil subgroups (Source: SoilWeb App by UCDavis-California Soil Resource Lab at https://casoilresource.lawr.ucdavis.edu/soilweb-apps/).
The validation process determined very strong to strong relationships between measured and predicted ECe, SARe, and pHe, with a decreasing tendency with depth. The validation results indicated that the general model obtained a better fit predicting ECe, SARe, and pHe than regression models segmented by depth. However, regression models for depth 1 presented very strong correlations. For depth 2, the correlation for SARe values was strong, as well for depth 3 and 4. The regression model for pHe at depth 4 obtained a weak correlation, the lowest in the validation. By comparing the r values of the two validation data sets, it was found that simple linear regression models fit better with the data collected from soil saturated paste at the KSSL laboratory using methods 4F2, 4F3, 4F2b1, 4C1a1a2, and 4F2c1a (Soil Survey Staff, 2014). The general model for ECe and for depth 2, 3 and 4 obtained very strong regressions with lower r for the general and depth 2 and higher for depth 3 and 4. For depth 1, the lower regression was strong. In comparison to ECe, the validation data for pHe showed a similar pattern. For general and depth 4, the pHe model showed moderated regressions with the lowest r. According to the results from the second validation, the general and segmented models for depth 4 may have underestimated or overestimated pHe values, respectively. Depth 1 had a weak lower regression. For depth 2, the regression was lower and very weak, whereas for depth 3, it was higher and very strong. Across all models, the r value was higher for the SARe. However, the models for SAR show a higher deviation between predicted and actual values, with varying performance across different depths. These findings suggest that additional factors or nonlinear models may be necessary to improve the prediction accuracy for SAR.
The model Mean Squared Error (MSE), Mean Absolute Error (MAE), and Root Mean Squared Error (RMSE) were used to evaluate the model’s performance, while the Mean Squared Deviation (MSD), Mean Absolute Deviation (MAD), and Root Mean Squared Deviation (RMSD) were used for model’s selection (Table 9). The simple linear regression models generally perform well for EC and pH variables, with better performance observed at shallower depths. For EC, the MSE values are relatively low, indicating a good fit between the predicted and actual values. The same is true for the MAE, RMSE, MSD, MAD, and RMSD. Overall, the models perform reasonably well for EC. When considering the models by depth, it is observed that the performance varies. For EC at depths 1 and 2, the MSE, MAE, RMSE, MSD, MAD, and RMSD values are considerably lower compared to depths 3 and 4. This suggests that the models at shallower depths (1 and 2) are more accurate and have better predictive power. For pH, the performance metrics are generally low, indicating a good fit for the linear regression models. Similar to EC, the models for pH at depths 1 and 2 have lower MSE, MAE, RMSE, MSD, MAD, and RMSD values, indicating better performance compared to depths 3 and 4. Regarding SAR, the performance metrics are relatively higher compared to EC and pH. The MSE, MAE, RMSE, MSD, MAD, and RMSD values are higher, indicating a larger deviation between predicted and actual values. However, the models for SAR at depth 1 and 3 show relatively better performance compared to depths 2 and 4.

TABLE 9. Evaluation of the simple linear model’s performance and selection.
Regarding the suggestion to explore non-linear approaches such as machine learning, it is certainly an avenue worth considering for future research. Machine learning techniques have the potential to capture complex relationships and interactions between various factors influencing soil salinity. By incorporating machine learning algorithms, it may be possible to uncover hidden patterns or non-linear dependencies that linear regression models might overlook. Future directions could include expanding the study to encompass a more diverse range of soil types and geographical locations within Puerto Rico or even extending the research to other regions with similar soil salinity issues. This would enable the development of more robust and adaptable models that could better capture the complexities of different soil ecosystems.
It is important to note that the models developed in this study were primarily focused on applicability in the Lajas Valley, which is known to be one of the most salt-affected areas in Puerto Rico due to specific soil conditions. One of the key limitations of the study lies in the sample size and diversity of the dataset used for analysis. The dataset was carefully collected from the Lajas Valley, considering its specific soil characteristics and salinity levels. Although the findings provide valuable insights into the salinity dynamics in this particular region, the generalizability of the results to other geographical locations with different soil types and environmental conditions may be limited. Therefore, caution should be exercised when extrapolating the results beyond the study area.
Comparison between regression models of EC1:5—ECeSimple linear regression models published by Aboukila and Norton (2017), He et al. (2013), Sonmez et al. (2008), and Kargas et al. (2018) predicted ECe values similar to the ECe measured. The affinity between regression models could be explained by the fact that those models used soil sample sets with fine texture, as the predominant soil texture in this study. The regression models published by Visconti et al. (2010), Aboukila and Abdelaty (2017), and Nassem et al. (2008) predicted ECe values similar to the ECe measured, but slightly higher than the models previously mentioned. This observation could be possible due to the coarse texture and carbonate presence of the soil sets used for the studies. The models published by Khorsandi and Yazdi (2007) were not well fitted with the ECe measured. The ECe predicted using the regression model developed for soil samples without gypsum was overestimated, while the ECe predicted from the model for samples containing gypsum was underestimated and obtained negative ECe predicted values. Those findings were unexpected considering that based on the soil taxonomy description 37% of the samples in this study belonged to the Guánica and Fe series, which are soils with a gypsum content of up to 2% (percentage, in weight, of hydrated calcium sulfates in the soil fraction less than 20 mm in size) in Bsszk between 132 and 203 cm and in Bssz between 43 and 107 cm depth, respectively (USDA-NRCS, 2008).
The fitting for the models published by Chi and Wang (Chi and Wang, 2010) was varied. Chi and Wang (2010) segmented the regression models by soil texture: medium (A), fine (B), and loam (C), obtained a r = 0.96 when compared with ECe measured. The ECe predicted means from the regression models A and C was not statistically different (p > 0.05) from the ECe measured, contrary to model B (p < 0.05) (Table 8). The regression models A and C presented a trend line to negative ECe predicted values, while model B presented the highest ECe predicted mean, a value statistically different from the ECe measured mean. The ECe predicted using models A, B, and C overestimated the ECe predicted, but model A and C would predicted negative EC1:5 values below ∼2 dS/m, based on the trend line. This finding was expected considering that the soil samples from the study presented a minimum ECe value higher than the minimum ECe measured in this study, limiting the predictability of the models Chi and Wang (2010) to predict ECe at low EC1:5 values. On the other hand, it was unanticipated because both soil sample sets are predominantly fine, clayed, smectitic soils, based on soil descriptions published by Chi and Wang (2010) and USDA-NRCS (2008).
SAR1:5-SARe regression models are few compared with the quantity of EC1:5-ECe models already published. The soil sample set used by Nassem et al. (2008) contained between 0.47% and 70.5% calcium carbonates, a common mineral in the Lajas Valley soils due to soil parent materials derived from marine deposits, limestone, and sedimentary rocks (USDA-NRCS, 2008). However, this model overestimated SARe predicted values more than triple (Figure 7). The statistical different between SARe predicted means using regression model published by He et al. (2015) was unexpected because the soil sample set used to build the regression models were soils from the soil order Mollisols containing carbonates and gypsum, soil properties presents in the valley soils. Nevertheless, Mollisols from the Lajas Valley are derived from alluvial and marine sediments deposition, while in the Great Plains soil are derived from glacial and marine deposits (Bluemle, 1977). However, these regression models are not useful for the Lajas Valley because the SARe predicted double the SARe measured.
As observed by Bonnet and Brenes (1958) and by USDA-NRCS (2008), the soil salinity and sodicity in the Lajas Valley, Puerto Rico, increased with depth, with soils predominantly non-salt affected from 0 to 60 cm of depth, and saline-sodic from 60 to 120 cm. As expected from soil descriptions at 100 cm of depth, soils from Sodic Haplusterts (Fe and Cartagena series) and Typic Calciaquert (Guánica series) subgroups were classified as saline-sodic. Soils under the subgroup Sodic Epiaquerts (Aguirre series) showed low SARe values classified as saline and indicated an apparent decrease in sodium. Soil subgroup Typic Haplusterts (Fraternidad and Santa Isabel series) presented normal conditions.
Soil:water solutions at ratio 1:5 (m:v) proved to be a viable alternative extraction method to evaluate saline and sodic soil conditions in the Lajas Valley. SW is a fast, reliable, low-cost, and useful evaluation method for monitoring soil salinity in the valley, emphasizing that any alternative method to soil saturated paste for measuring ECe, SARe, and pHe must be standardized by empirical methods. Linear models were generated to estimate ECe, SARe, and pHe values in saturated soil paste extracts from EC1:5, SAR1:5, and pH1:5, respectively, using a general dataset as there was no significant difference between the models generated by the farm (F1 and F2). Based on validation, general regression models predict ECe, SARe, and pHe more accurately than regression models segmented by depth. For pHe, the regression models should consider additional soil properties to improve the calibration results.
Previous publications have shown that simple linear regression models differ according to soil types and their characteristics. However, a precise and accurate regression model requires considering the dominant soil property in soil sampling and/or regression models. In the EC1:5-ECe and SAR1:5-SARe regression models, predictions were similar to those obtained by other authors using samples from other types of soils, so it is recommended to evaluate the applicability of the regression models obtained for predicting ECe and SARe in other soils types on the island. Nevertheless, the future should also be directed towards non-linear approaches such as machine learning.
The raw data supporting the conclusions of this article will be made available by the authors, without undue reservation.
JC organized the database. BA performed the statistical analysis and wrote the first draft of the manuscript. All authors contributed to the article and approved the submitted version.
This project is made possible through the support of USDA-NIFA-HSI Award Number 2016-38422-25542 and USDA-NIFA-HATCH accession number 1013206 awarded to DS.
This project was possible thanks to the collaboration of the laboratory staff from University of Puerto Rico, in Mayaguez, PR, Charles E. Kellogg Soil Survey Laboratory (KSSL), in Lincoln, NE, and University of Georgia (UGA) Agricultural and Environmental Services Laboratories, in Athens, GA. As well, thanks to the farms staff for the help and tools provided during the survey.
The authors declare that the research was conducted in the absence of any commercial or financial relationships that could be construed as a potential conflict of interest.
All claims expressed in this article are solely those of the authors and do not necessarily represent those of their affiliated organizations, or those of the publisher, the editors and the reviewers. Any product that may be evaluated in this article, or claim that may be made by its manufacturer, is not guaranteed or endorsed by the publisher.
Aboelsoud, H. M., Habib, A., Engel, B., Hashem, A. A., El-Hassan, W. A., Govind, A., et al. (2023). The combined impact of shallow groundwater and soil salinity on evapotranspiration using remote sensing in an agricultural alluvial setting. J. Hydrol. Reg. Stud. 47, 101372. doi:10.1016/j.ejrh.2023.101372
Aboukila, E., and Abdelaty, E. (2017). Assessment of saturated soil paste salinity from 1:2.5 and 1:5 soil-water extracts for coarse textured soils. Alexandria Sci. Exch. J. 38 (6), 722–732. doi:10.21608/asejaiqjsae.2017.4181
Aboukila, E. F., and Norton, J. B. (2017). Estimation of saturated soil paste salinity from soil-water extracts. Soil Sci. 182 (3), 107–113. doi:10.1097/SS.0000000000000197
Acevedo, G., Lugo-Lopez, M. A., and Ortiz-Vélez, J. (1959). Occurrence of soil tumors northeast of the. J. Agric. Univ. P. R. 43 (2), 103–115.
Álvarez-Torres, B. (2021). Magnitud y distribución espacial de la salinidad y sodicidad del suelo a escala de campo en el Valle de Lajas, Puerto Rico. https://medium.com/@arifwicaksanaa/pengertian-use-case-a7e576e1b6bf.
Balzarini, M., Gonzalez, L., Tablada, E., Casanoves, F., and Di Rienzo, J., (2008). InfoStat Software Estadístico - Manual del Usuario. Córdoba, Argentina: Universidad Nacional de Córdoba.
Bluemle, J. P. (1977). The face of north Dakota. Bismarck, North Dakota, United States: North Dakota Geological Survey - Educational Serie.
Bonnet, J. A., and Brenes, E. J. (1958). Detailed salinity survey of Lajas Valley. San Juan, Puerto Rico: Bulletin of University of Puerto Rico Agricultural Experiment Station.
Buol, S. W., Southard, R. J., Graham, R. C., and McDaniel, P. A. (2011). “Soil genesis and classification,” in Vertisols: Shrinking and swelling dark clay soils. 6th Edition (Pondicherry, India: John Wiley and Sons, Ltd., Publication).
Castro-Chacón, J. P. (2021). Cartografía regional de suelos salinos y sódicos en el Valle de Lajas. suroeste de Puerto Rico: University of Puerto Rico.
Chi, C. M., and Wang, Z. C. (2010). Characterizing salt-affected soils of Songnen Plain using saturated paste and 1:5 soil-to-water extraction methods. Arid Land Res. Manag. 24 (1), 1–11. doi:10.1080/15324980903439362
Corwin, D. L., and Yemoto, K. (2017). Salinity: Electrical conductivity and total dissolved solids. Methods Soil Analysis 2 (1), 0. doi:10.2136/msa2015.0039
Crouse, K. K., Hardy, D. H., Heckendorn, S., Huluka, G., and Joines, D. K., (2014). Soil test methods from the southeastern United States. Athens, GA, United States: University of Georgia.
Franzen, D., Gasch, C., Augustin, C., DeSutter, T., and Kalwar, N., (2019). Managing saline soils in North Dakota. NDSU Ext. Circ. SF1087 Revis., 1087.
Geilfus, C. M. (2018a). Chloride: From nutrient to toxicant. Plant Cell Physiol. 59 (5), 877–886. doi:10.1093/pcp/pcy071
Geilfus, C. M. (2018b). Review on the significance of chlorine for crop yield and quality. Plant Sci. 270, 114–122. doi:10.1016/j.plantsci.2018.02.014
Ghassemi, F., Jakeman, A., and Nix, H. (1995). Salinisation of land and water resources: Human causes,extent, management and case studies. Wallingford, England: CABI Publishing.
He, Y., De Sutter, T., Hopkins, D., Jia, X., and Wysocki, D. A. (2013). Predicting ECe of the saturated paste extract from value of EC1:5. Can. J. Soil Sci. 93 (5), 585–594. doi:10.4141/CJSS2012-080
He, Y., DeSutter, T. M., Hopkins, D. G., Wysocki, D. A., and Clay, D. E. (2015). Relationship between 1:5 soil/water and saturated paste extract sodium adsorption ratios by three extraction methods. Soil Sci. Soc. Am. J. 79 (2), 681–687. doi:10.2136/sssaj2014.09.0384
He, Y., DeSutter, T., Prunty, L., Hopkins, D., Jia, X., and Wysocki, D. A. (2012). Evaluation of 1:5 soil to water extract electrical conductivity methods. Geoderma 185-186, 12–17. doi:10.1016/j.geoderma.2012.03.022
Herrero, J., Weindorf, D. C., and Castañeda, C. (2015). Two fixed ratio dilutions for soil salinity monitoring in hypersaline wetlands. PLoS One 10 (5), e0126493. doi:10.1371/journal.pone.0126493
Isbell, R. F. (2021). The Australian soil classification. 3er edn., Melbourne, Australia: CSIRO Publishing.
Kargas, G., Chatzigiakoumis, I., Kollias, A., Spiliotis, D., Massas, I., and Kerkides, P. (2018). Soil salinity assessment using saturated paste and mass soil:water 1:1 and 1:5 ratios extracts. WaterSwitzerl. 10 (11), 1589–1611. doi:10.3390/w10111589
Khorsandi, F., and Yazdi, F. A. (2007). Gypsum and texture effects on the estimation of saturated paste electrical conductivity by two extraction methods. Commun. Soil Sci. Plant Anal. 38 (7–8), 1105–1117. doi:10.1080/00103620701278120
Martin, T. D., Brockhoff, C. A., and Creed, J. T.EMMC Methods Work Group (1994). Method 200.7 - determination of elements and trace elements in water and wastes by inductively coupled plasma-atomic emmission spectropmetry. Washington, D.C., United States: United States Environmental Protection Agency.
Nassem, M. G., Hussein, M. A., and Gader, K. A. A. (2008). Comparative study on salinity measurements in soils of the north western coastal region of Egypt. Alexandria Sci. Exch. J. Int. Q. J. Sci. Agric. Environ. 29, 45–54. doi:10.21608/asejaiqjsae.2008.3181
Rengasamy, P., and Marchuk, A. (2011). Cation ratio of soil structural stability (CROSS). Soil Res. 49 (3), 280–285. doi:10.1071/SR10105
Rengasamy, P. (2010). Soil processes affecting crop production in salt-affected soils. Funct. Plant Biol. 37 (7), 613–620. doi:10.1071/FP09249
Shahid, S. A., Zaman, M., and Heng, L. (2018). Soil salinity: Historical perspectives and a world overview of the problem. Berlin, Germany: Springer. doi:10.1007/978-3-319-96190-3
Soil Survey Staff (2014). Kellogg soil survey laboratory methods manual. Washington, D.C., United States: Natural Resources Conservation Service.
Sonmez, S., Buyuktas, D., Okturen, F., and Citak, S. (2008). Assessment of different soil to water ratios (1:1, 1:2.5, 1:5) in soil salinity studies. Geoderma 144 (1–2), 361–369. doi:10.1016/j.geoderma.2007.12.005
USSL Brown, J. W., Allison, L. E., Fireman, M., and Pearson, G. A., (1954). Diagnosis and improvement of saline and alkali soils. Washington, D.C., United States: U.S. Department of Agriculture.
Visconti, F., de Paz, J. M., and Rubio, J. L. (2010). What information does the electrical conductivity of soil water extracts of 1 to 5 ratio (w/v) provide for soil salinity assessment of agricultural irrigated lands? Geoderma 154 (3–4), 387–397. doi:10.1016/j.geoderma.2009.11.012
Keywords: electrical conductivity, salinity, salt-affected soils, saturated paste extract, sodicity, sodium adsorption ratio, soil:water extract
Citation: Álvarez Torres B, Sotomayor Ramírez DR, Castro Chacón JP, Martínez Rodríguez G, Pérez Alegría LR and DeSutter TM (2023) An alternative method to measure electrical conductivity (EC) and sodium adsorption ratio (SAR) in salt-affected soil extracts. Front. Environ. Sci. 11:1108272. doi: 10.3389/fenvs.2023.1108272
Received: 25 November 2022; Accepted: 21 August 2023;
Published: 04 September 2023.
Edited by:
Gilles Colinet, University of Liège, BelgiumReviewed by:
Isaya Kisekka, University of California, Davis, United StatesCopyright © 2023 Álvarez Torres, Sotomayor Ramírez, Castro Chacón, Martínez Rodríguez, Pérez Alegría and DeSutter. This is an open-access article distributed under the terms of the Creative Commons Attribution License (CC BY). The use, distribution or reproduction in other forums is permitted, provided the original author(s) and the copyright owner(s) are credited and that the original publication in this journal is cited, in accordance with accepted academic practice. No use, distribution or reproduction is permitted which does not comply with these terms.
*Correspondence: David R. Sotomayor Ramírez, ZGF2aWQuc290b21heW9yQHVwci5lZHU=
Disclaimer: All claims expressed in this article are solely those of the authors and do not necessarily represent those of their affiliated organizations, or those of the publisher, the editors and the reviewers. Any product that may be evaluated in this article or claim that may be made by its manufacturer is not guaranteed or endorsed by the publisher.
Research integrity at Frontiers
Learn more about the work of our research integrity team to safeguard the quality of each article we publish.