 Hannah V. Herrero
 Jane Southworth
 Reza Khatami2
 Stephanie Insalaco
 Carly Muir
- 1Department of Geography and Sustainability, University of Tennessee Knoxville, Knoxville, TN, United States
- 2Department of Geography, University of Florida, Gainesville, FL, United States
The Greater Limpopo Transfrontier Conservation Area (GLTFCA) of southeastern Southern Africa is home to five large national parks and is an important protected area crossing different geopolitical borders, but with the same conservation goals. However, even with similar management techniques, there have been concerning declines in vegetation observed across the last few decades. This study proposes that a larger driver, climate, is linked to this decline over time, and raises the point that these conservation areas are more important now than ever. Precipitation (annual and seasonal), the Normalized Difference Vegetation Index (NDVI, indicator of vegetation health), and Directional Persistence data (D, metric to measure trends in vegetation health over time compared to a baseline value) from 2000 to 2020 are used. Overall, there was a negative trend in precipitation during the 21st century in all seasons except the beginning of the wet season. Linked to this were negative trends in vegetation health both in absolute Normalized Difference Vegetation Index values and resultant D values. Overall, this study found a decline in precipitation, which was significantly linked to a decline in vegetation health across the majority of the year in the Greater Limpopo Transfrontier Conservation Area. This study supports literature on browning in sub-Saharan Africa and gives managers even more reason to work together towards a unified conservation strategy for this important region.
1 Introduction
In January of 2022, 150 years after the creation of the world’s first national park, just 16% of the terrestrial world has been set aside to be used as a protected area (Protected Planet, 2019), despite a goal of 30% by 2030 (Dinerstein et al., 2019). In this ever-globalizing world, it is becoming more important to work across geopolitical borders in order to most effectively manage protected areas (Home - Peace Parks Foundation, 2022). Part of these protected areas are savannas, which is a type of dryland that consists of a heterogeneous landscape with a mix of grasses, trees, and shrubs (Vogel and Strohbach, 2009; Hanan and Lehmann, 2010; Chapin et al., 2011). Savannas take up about 20% of all of Earth’s land cover, and approximately 55% of southern Africa (Chapin et al., 2011). The 79 national parks across Southern Africa all contain some type of savanna (Herrero et al., 2020a). Peace Parks Foundation, founded by Nelson Mandela, Dr. Anton Rupert, and HRH Prince Bernhard of the Netherlands in 1997, is leading the effort to manage protected areas, largely consisting of savannas, across Africa. The management of savannas is vital because they are an important conservation landscape. They have a high level of biodiversity, the systems support large human populations, they contribute to the carbon cycle, and consist of 14% of the global net primary productivity (Monseroud et al., 1993; Ojima et al., 1993; Scholes and Archer, 1997; Houghton et al., 1999).
A hotspot for savanna landscapes is the Greater Limpopo Transfrontier Conservation Area (GLTFCA) in southeastern Africa (Figure 1). The GLTFCA consists of five national parks that are all vital to conservation in the area. Each of the parks contain a majority of pixels which are classified as some type of savanna by the Moderate Resolution Imaging Spectroradiometer (MODIS) Collection 5 global land cover product. Precipitation is a predominant factor driving landscape productivity and patterns throughout the GLTFCA, which also determines vegetation type (Scholes and Archer, 1997; Sankaran et al., 2005; Southworth et al., 2016). Grassland systems are expected in an areas with up to 750 mm of mean annual precipitation, and mixed systems are found between 750 and 950 mm of precipitation (Campo-Bescos et al., 2013a). Any landscape that receives more than 950 mm of precipitation will likely be dominated by trees (Scholes and Archer, 1997; Sankaran et al., 2005; Staver et al., 2011; Campo-Bescos et al., 2013b). With the ever-changing climate, precipitation has been severely affected. These savanna systems may be seeing a decrease in precipitation causing a resultant change in vegetation. With decreasing precipitation, the expansion of shrub/scrub cover is encouraged (Sankaran et al., 2005; Southworth et al., 2016). High temperatures can cause a decrease in soil moisture within savannas, which can diminish vegetation health and productivity (Bunting et al., 2016). While it is necessary to acknowledge the range of factors that could alter vegetation in the GLTFCA, given the large area and consistent management strategy, this analysis focuses on climate as a driver of change.
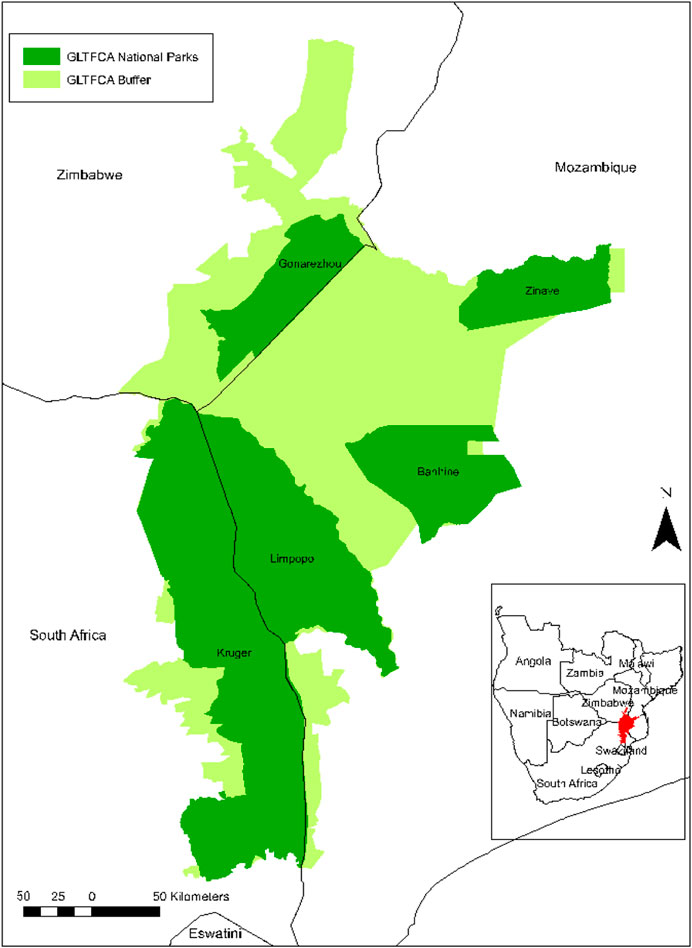
FIGURE 1. Study area map of the five National Parks and surrounding Great Limpopo Transfrontier Conservation Area (GLTFCA) in southern Africa across three countries: South Africa, Mozambique, and Zimbabwe.
Savanna ecosystems in national parks are difficult landscapes to monitor through remote sensing due to the transitional and variable vegetation cover. Yet even with this heterogeneity challenge, it is important for remote sensing techniques to advance in these areas because of the ecological and socioeconomic importance of savannas. The use of time series analysis of satellite imagery has become a well-known method for evaluating savannas (Southworth et al., 2016). Additionally, NDVI (Normalized Difference Vegetation Index) can be used as a proxy to determine the biomass, health, and abundance of vegetation (Tucker, 1979; Carlson and Ripley, 1997; Lambin and Ehrlich, 1997; Wang et al., 2005; Jiang et al., 2006; Begue et al., 2011; Southworth et al., 2016). By using a time series analysis with NDVI, we gain a better understanding of trends and patterns in vegetation health over time (Waylen et al., 2014). Directional persistence (D) is a measure derived from NDVI, which has been useful in the study of drylands globally (Waylen et al., 2014; Southworth et al., 2016; Herrero et al., 2020b; Herrero et al., 2020a; Muir et al., 2021). D uses NDVI time series analysis to compare the greenness of vegetation in a selected season and year, to a baseline time period. By using D, the researcher can determine the spatial patterns of interannual changes of NDVI and identify landscape patterns of change, while also looking at the statistical significance of these patterns at a pixel level (Waylen et al., 2014; Southworth et al., 2016).
This study focuses on the five National Parks within the GLTFCA and the health of its vegetation through the lens of climate. Conservation is carried out in these areas because within parks there is a focus of maintaining biodiversity while minimizing human impacts. A theory of landscape ecology suggests that larger parks (or transfrontier conservation areas) tend to have more success in their conservation goals due to their greater spatial extent and resources (Newmark, 2008; Herrero et al., 2020a). It is just recently that multiple country, cross border parks like the GLTFCA have been developed. These transfrontier conservation areas are based on the landscape ecology principle of connectivity, where when an area is more physically connected, it has a better chance of success for conservation (Saura et al., 2018). In addition, the use of the GLTFCA effectively eliminates or holds constant the variability in management techniques across countries so other variables may be investigated, such as climate as within this study (Home - Peace Parks Foundation, 2022). Based on the study (Herrero et al., 2020b), the GLTFCA was identified as an area of concern for negative vegetation trends, so further evaluation of this area is needed.
This research seeks to evaluate if the GLTFCA is working in terms of vegetation health patterns and trends, and how climate and specifically precipitation, are influencing the vegetation health of the savannas across the landscape. NDVI and D will be used to determine the health of the vegetation, so trends can be established, and patterns identified. The research objectives of this study are to: 1) Examine the change in precipitation at both annual and seasonal periods in the GLTFCA 2) Evaluate significant spatio-temporal trends in absolute vegetation health in the GLTFCA, and 3) Assess the influence of precipitation on absolute vegetation health within each of the national parks comprising the GLTFCA.
2 Materials and methods
2.1 Study area
The GLTFCA is located in southeastern Africa and spans across three countries—South Africa (ZA), Mozambique (MOZ), and Zimbabwe (ZIM), and five national parks—Banhine (MOZ), Gonarezhou (ZIM), Kruger (ZA), Limpopo (MOZ), and Zinave (MOZ) (Figure 1) (Home - Peace Parks Foundation, 2022). The national parks alone within the GLTFCA are approximately 45,000 km2 in area (Table 1), but the entirety of the GLTFCA, which connects and surrounds the national parks, acting as functional buffer zones, is almost 100,000 km2 in area (Home - Peace Parks Foundation, 2022). The GLTFCA is home to more than 850 animal species as well as over 2,000 plant species, all of which are now carefully managed for conservation (Home - Peace Parks Foundation, 2022).
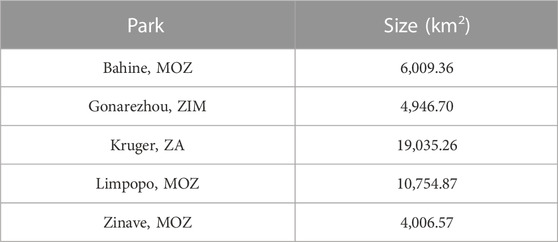
TABLE 1. Park name, country location and size.
This area is one of the earliest established and most successful examples worldwide of the conservation value of peace parks. Peace parks are defined as conservation areas that are managed cooperatively across geopolitical boundaries, and in this case specifically, are coordinated by a neutral third party, the Peace Parks Foundation (PPF) (Home - Peace Parks Foundation, 2022). The long-term goal of the PPF is to preserve large and functional ecosystems, such as the GLTFCA, so that the natural resources that humans depend on, such as food, medicine, clean water, and clean air are preserved for current and future generations (Home - Peace Parks Foundation, 2022). “Our dream is to reconnect Africa’s wild spaces to create a future for man in harmony with nature” (Home - Peace Parks Foundation, 2022).
Each of these ecosystems within the GLTFCA can be categorized as some type of savanna system, which range from grassland dominated to woodland dominated. One of the most important factors that influences the type of savanna is precipitation, and this whole area is categorized as dryland (Sankaran et al., 2005; Andela et al., 2013; Campo-Bescós et al., 2013b; Lehmann et al., 2014). Precipitation varies in these parks from Mean Annual Precipitation (MAP) of 439 mm in Bahine to 602 mm in Zinave (Figure 2), but as all these MAP values are below the well-published 650 mm threshold, the vegetation types are grass dominated savanna systems (Scholes and Archer, 1997; Sankaran et al., 2005; Staver et al., 2011; Campo-Bescos et al., 2013a). Southern Africa has two primary seasons, a rainy season from November to April and a dry season from May to October. Therefore, there is a high degree of seasonal fluctuation of precipitation across the year in these national parks (Figure 2).
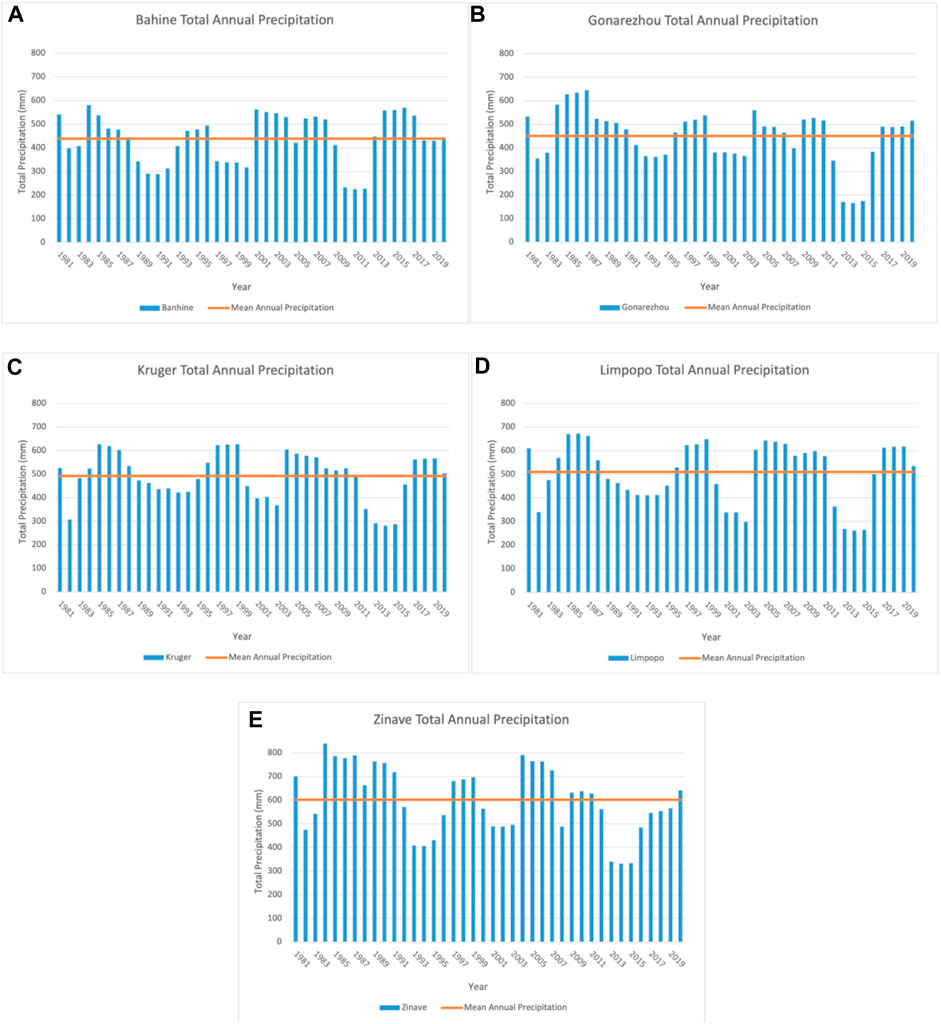
FIGURE 2. Total precipitation across the five National Parks from 1981 to 2020 (with mean annual precipitation line, listed from lowest to highest in mm: (A) Bahine 439 mm, (B) Gonarezhou 451 mm, (C) Kruger 492 mm, (D) Limpopo 510 mm, (E) Zinave 602 mm.
2.2 Precipitation
Precipitation data was a key part of this analysis, given its important relationship with savanna vegetation, and healthy vegetation is the basis of conservation for all other species in this study area (Sankaran et al., 2005; Andela et al., 2013; Campo-Bescós et al., 2013b; Lehmann et al., 2014). The precipitation data was acquired from the Climate Hazards Group InfraRed Precipitation with Station Data (CHIRPS) website (Funk et al., 2015). This gridded dataset is available at 0.05° spatial resolution beginning in 1981 to present (Funk et al., 2015). To account for the discrepancy in spatial resolution of the precipitation data and the size of the parks, a mean value for each park over time and by seasons was extracted using the park shapefile subset over the CHIRPS grids.
In southern Africa, the dry season occurs from approximately May to October, and the wet season occurs from approximately November to April. Vegetation green-up lags 1 month behind precipitation occurrence (Zhu and Southworth, 2013). Triads were created to represent the seasons (beginning wet, end wet, beginning dry, end dry). Therefore, precipitation/vegetation triads were defined respectively as November-December-January (NDJ)/December-January-February (DJF); February-March-April (FMA)/March-April-May (MAM); May-June-July (MJJ)/June-July-August (JJA); August-September-October (ASO)/September-October-November (SON).
The two time periods evaluated are 2000–2020 to match the beginning of the available satellite imagery, and 1981–2020 which is the longest available climate data to establish longer term trends for this region through CHIRPS. Evaluating longer-term climate trends using a continuous time period is a standard practice in savanna system research (Scholes and Archer, 1997; Sankaran et al., 2005; Staver et al., 2011; Herrero et al., 2016; Herrero et al., 2020b). CHIRPS data was downloaded at the monthly time scale and accumulated in the following ways. This includes: a) total annual precipitation (defined as February 2000 to January 2021 to match the start of satellite vegetation data in March 2000), b) total precipitation by each season from 1981 to 2020 for each park (where mean seasonal precipitation was also calculated), and c) similarly, total precipitation by each season over time from 1999 to 2020 by park. To determine any significant changes in precipitation over time, Z-scores were calculated to identify anomalies, and linear trendlines were creat ed (Herrero et al., 2020b). This was done in R and represents 40 statistical tests: the five national parks, each tested for significant increases or decreases in precipitation for each of the four triads at both time periods a) 1981–2020 and b) 1999–2020.
2.3 Normalized difference vegetation index (NDVI)
The normalized difference vegetation index (NDVI) is a measure of vegetation abundance and greenness and is often used in the context of evaluating the health of conservation areas (Herrero et al., 2016; Herrero et al., 2019; Herrero et al., 2020b; Herrero et al., 2020a; Blentlinger and Herrero, 2020). NDVI uses a ratio between the red band (R, absorptive in healthy vegetation) and the near infrared band (NIR, reflective in healthy vegetation) from multispectral satellite imagery to determine a pixel value between −1 and +1, where higher values indicate greener/denser vegetation and values less than 0 indicate no vegetation (Measuring Vegetation, 2000).
The satellite imagery used for this analysis was an NDVI composite product from the Moderate Resolution Imaging Spectroradiometer (MODIS) sensor. This product, MOD13Q1.006 Terra Vegetation Index, has a 250 m spatial resolution and is made from a 16-day composite of the maximum NDVI value per pixel. This data from Google Earth Engine comes atmospherically corrected as well as being masked for clouds, cloud shadows, heavy aerosols, and water (Google Earth Engine Explorer, 2021). This MODIS data was available from 2000 to 2020. The NDVI data was then aggregated into triads by mean value, hereafter referred to as seasons, to make it compatible with the precipitation regimes. The wet season is represented by DJF and MAM and the dry season is represented by JJA and SON, the spatial results of which are below in Figure 6.
The mean NDVI value for each season was calculated by pixel and then averaged by park. This was plotted as a continuous time series by park from 2000 to 2020 to demonstrate annual phenology in these protected areas. The mean NDVI pixel value was also calculated by seasons and park for the periods 2000–2004, 2005–2008, 2009–2012, 2013–2016, and 2017–2020 to further identify differences over finer time periods (multiple years to account for any potential anomalies). These values were also presented spatially through maps.
2.4 Directional persistence
Greening studies have utilized remotely sensed time-series of vegetation indices, which included seasonality and serial auto-correlation. These studies have attempted to correct for trends using multiple statistical methods such as harmonic regression, time series using calendar days, linear models with non-parametric components for seasonality, etc. However, in a study by De Jong et al. (2012) they determined that greening or browning results varied significantly, depending on the method used in the analysis, and not necessarily the actual change on the landscape (De Jong et al., 2012). In response to these difficulties, the creation of a straightforward, repeatable, and statistically valid method was warranted (Southworth et al., 2023). NDVI time series can be used to study global vegetation change in several ways. D is a per pixel continuous measure of the direction of change in NDVI over time and identifies significant positive or negative cumulative change, as compared to a baseline condition (Waylen et al., 2014; Southworth et al., 2016; Herrero et al., 2020b, 2020a). The NDVI product (MOD13Q1.006) used for calculating D is described above in Section 2.3. This novel technique allows for both the space and time components to be addressed in and around these protected areas at a pixel scale over large landscapes and for extended periods of time. This technique provides a spatially broad and temporally long metric to determine patterns in vegetation stability or change. The application of this technique for understanding dynamics of these critical conservation areas, such as the GLTFCA, can assist in their management and protection (Herrero et al., 2020b; Herrero et al., 2020a).
To calculate the D statistic, a multi-year seasonal mean (2000–2004) is used as a baseline of comparison. Including multiple years in the baseline accounts for any anomalous years (Waylen et al., 2014). Following this, each ensuing season/year is compared to the baseline, creating a random walk statistic for each pixel (Waylen et al., 2014). This indicates that there is an equal chance that a pixel will be above or below the mean. If there is a “success” (NDVI is higher than the baseline), that pixel is assigned a value of +1. If there is a “failure” (NDVI is lower than the baseline), that pixel is assigned a value of −1. These pixel values are summed through time producing a net D value; in this study comparing 2005–2020 to the baseline creates N = 15. A pixel value of +15 would mean that every subsequent year was higher than the baseline (a very strong positive trend in vegetation health of the protected areas over time), and a pixel value of −15 would mean that every subsequent year was lower than the baseline (a very strong negative trend in vegetation health of the protected areas over time).
Where the value of statistical significance lies is based on a hypergeometric distribution (Waylen et al., 2014). Given the nature of the application of this study and investigating how the vegetation health of these conservation areas have changed over time and how these changes could make a meaningful difference in the parks, the lowest conventionally accepted statistical significance of 0.10 was used to allow for examining more change. Therefore, any pixels with a D value of ±7 are deemed significant.
2.5 Normalized difference vegetation index (NDVI) regressed against precipitation
The general relationship between precipitation and savanna vegetation using NDVI as a proxy has been established (Tucker, 1979; Carlson and Ripley, 1997; Lambin and Ehrlich, 1997; Scholes and Archer, 1997; Sankaran et al., 2005; Wang et al., 2005; Jiang et al., 2006; Bégué et al., 2011; Staver et al., 2011; Campo-Bescós et al., 2013a; Bunting et al., 2016; Southworth et al., 2016). However, in this study the specific question is determining if the savanna vegetation in these five national parks have a similar relationship with changing precipitation over time. Total seasonal precipitation was quantitatively compared to the mean NDVI over time in each park by regressing mean NDVI against precipitation and statistically interpreting the results (Tucker, 1979; Carlson and Ripley, 1997; Lambin and Ehrlich, 1997; Scholes and Archer, 1997; Sankaran et al., 2005; Wang et al., 2005; Jiang et al., 2006; Bégué et al., 2011; Staver et al., 2011; Campo-Bescós et al., 2013a; Southworth et al., 2016).
3 Results
3.1 Long-term precipitation
In Figure 3, total seasonal precipitation is plotted by park over the total time period of 1981–2020. The long term trends in precipitation were important to study in order to establish the historical conditions and climatological norms of each park, as conservation efforts are heavily influenced by climate. This was further broken down in Figure 3 into 1999–2020 to compare seasonally specific precipitation trends with satellite-based vegetation data in the form of NDVI. Figure 3 shows that there are strong negative trends during the dry seasons (MJJ and especially ASO) over time across all parks. During the wet season, and especially the onset of the rainy season (NDJ) there was a slightly stronger positive trend over time. This is particularly true in Zinave, which has the greatest mean annual and seasonal precipitation, Table 2. In FMA over the longer time period there was a slightly positive trend, however, in FMA from 2000 to 2020, there was a strong negative trend, especially in Zinave, indicating that there may be more variability in this park. These stronger trends at the beginning of the wet season and end of the dry season again support that precipitation is changing most likely in terms of temporal distribution, for example, early or late rains, etc., (Herrero et al., 2020b).
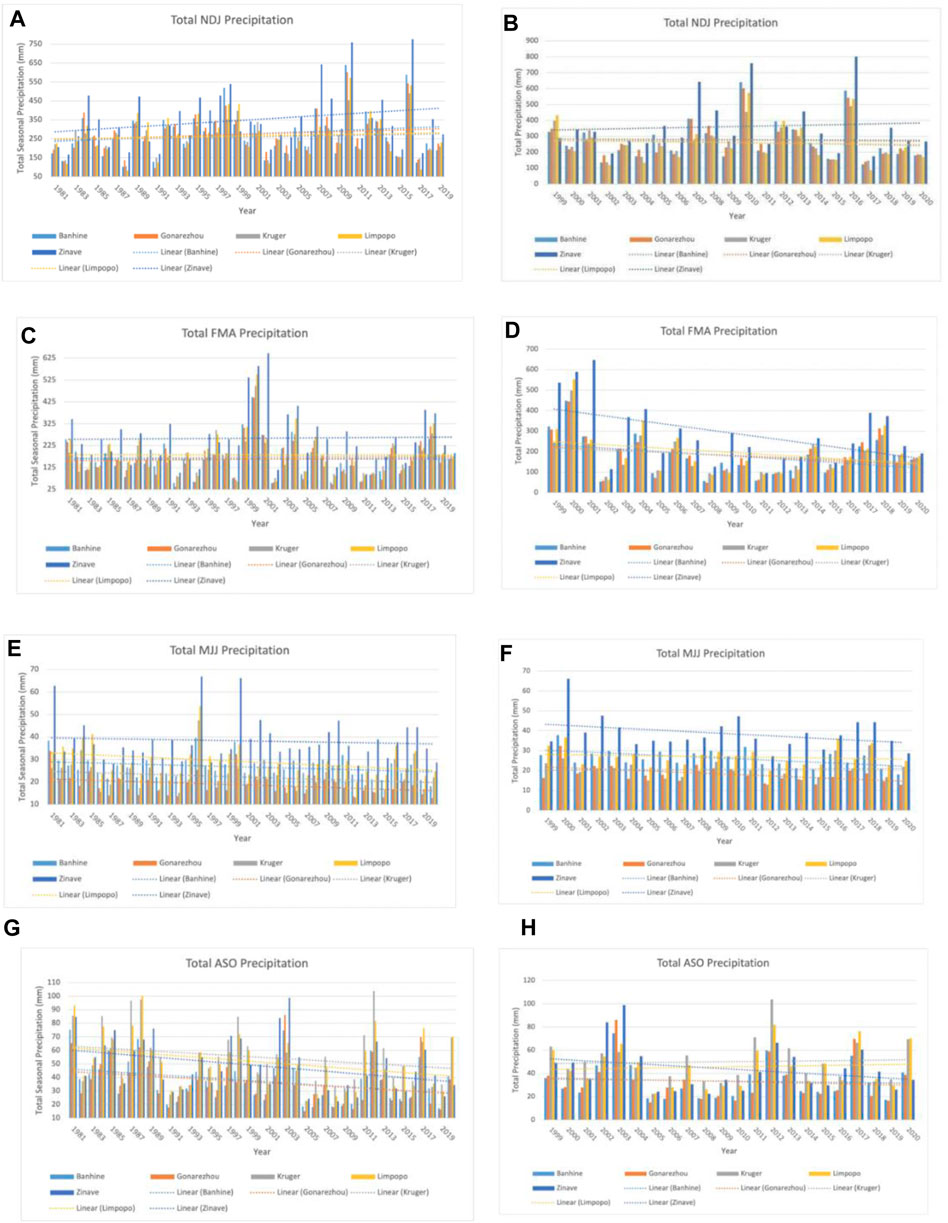
FIGURE 3. Total seasonal precipitation (mm) by national park from 1981 to 2020 demonstrating longer-term climate. Precipitation is lagged 1 month from vegetation: NDJ, November, December, January for (A) 1981–2020 and (B) 2000–2020; FMA, February, March, April for (C) 1981–2020 and (D) 2000–2020; MJJ, May, June, July for (E) 1981–2020 and (F) 2000–2020; ASO, August, September, October for (G) 1981–2020 and (H) 2000–2020.
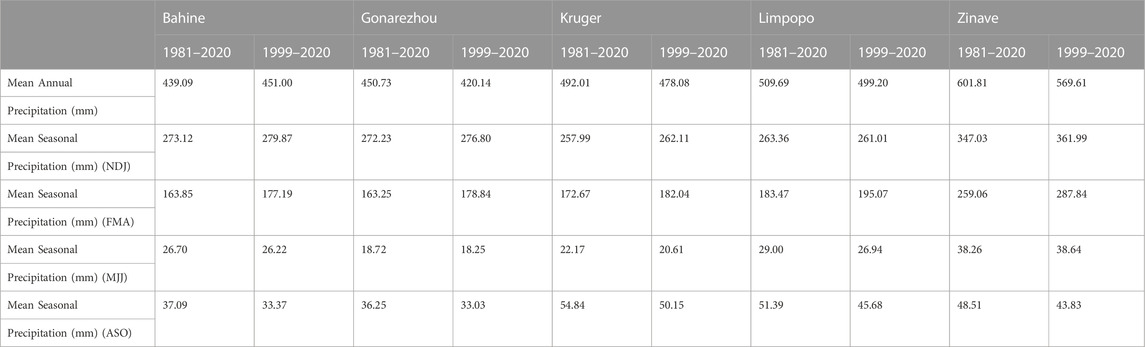
TABLE 2. Climatic conditions in national parks, including mean values of precipitation from 1981 to 2020 by both the total year and by season (lagged 1 month from vegetation, NDJ, November, December, January; FMA, February, March, April; MJJ, May, June, July; ASO, August, September, October).
Results presented in Table 3 show that there are statistically significant negative trends in both the longer time series of 1981–2020 and from 1999 to 2020. The parks with the greatest (Zinave) and least (Bahine) mean annual and seasonal precipitation, had the most significantly negative trends. In every park there was a significant negative trend in precipitation during the later part of the dry season (ASO), occurring across the whole time period. Similarly, in the beginning of the dry season (MJJ) there was a significant downward trend in either the period 1981–2020 or 1999–2020 in every park, except Kruger, which only exhibited significant change in precipitation during ASO 1981–2020). In only one park, Zinave, during the beginning of the wet season (NDJ) over the whole time period of 1981–2020 was there any significant positive change in precipitation, which supports results in Figure 3. This further supports the theory that changes in precipitation most prominently occur at the edges of the seasons. In total, of the 40 statistical scenarios tested, there were 14 that were statistically significant 13 negative and 1 positive change in precipitation over time.
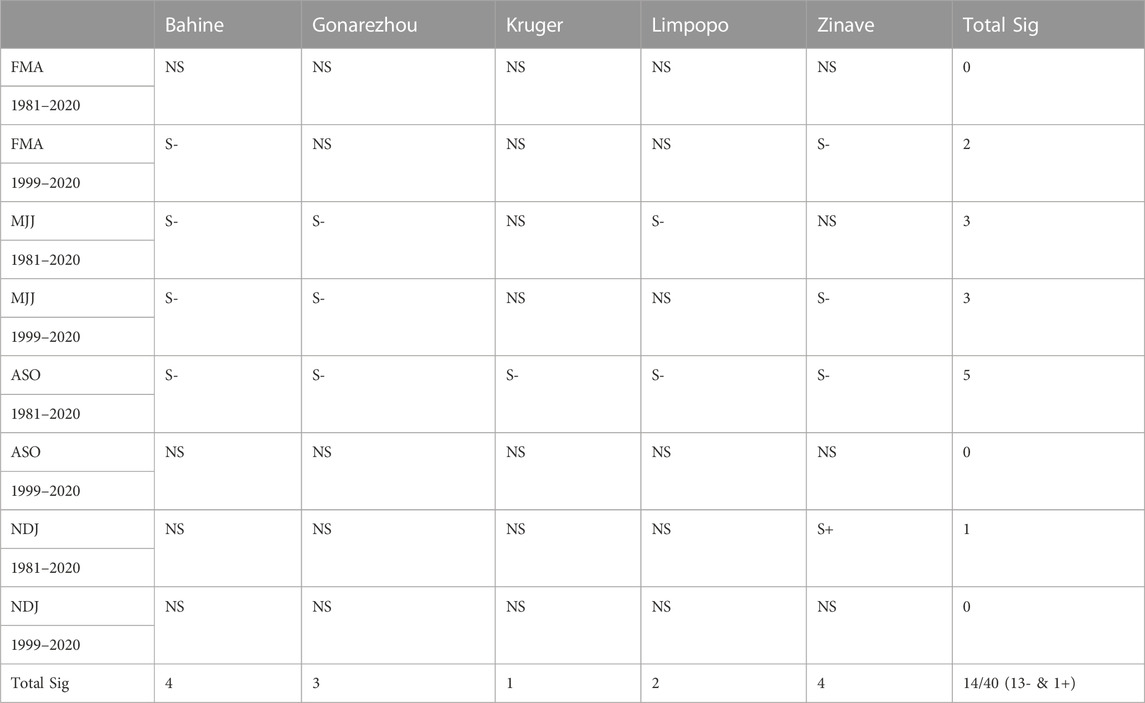
TABLE 3. Trends in Precipitation over time, ordered left to right for the parks with least to greatest mean annual precipitation, highlighting negatively significant trend (S-), positively significant trend (S+), or no significant trend (NS) in precipitation over different time periods, seasons, and parks through Z-scores.
3.2 Normalized difference vegetation index (NDVI)
When approaching the Normalized Difference Vegetation Index (NDVI) as a time series, Figure 4 shows that there is a great deal of intra-annual variability in NDVI, which follows the rains, i.e., there is greater abundance of vegetation during the rainy season and a lower abundance of healthy vegetation during the dry season. When looking at these seasonal trends over time, each park, buffer, and the total landscape has a negative trend in the abundance of healthy vegetation (Figure 4). However, Zinave had the least negative trend, which aligns with the results of wet season precipitation above.
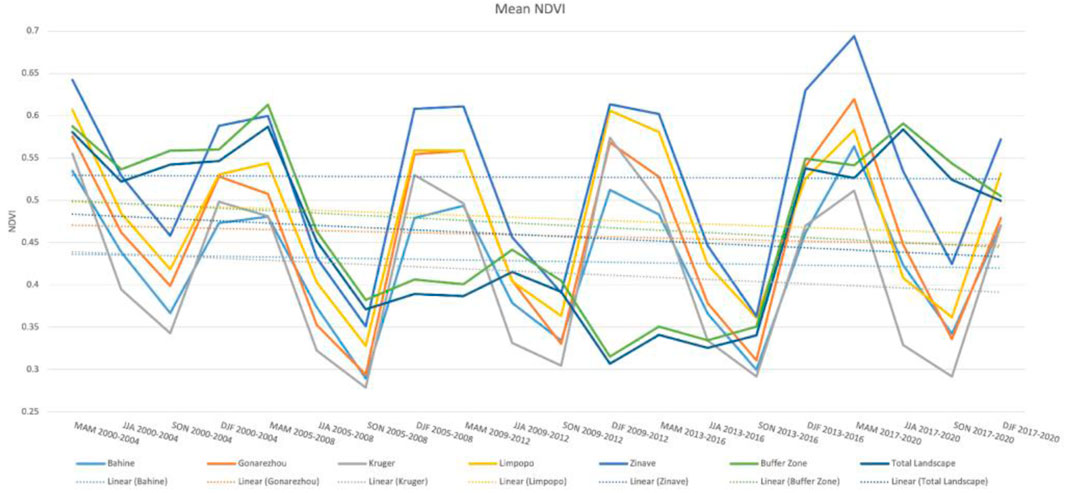
FIGURE 4. Mean Normalized Difference Vegetation Index (NDVI) by national park as a continuous time series from 2000 to 2020 by season (MAM, March, April, May; JJA, June, July, August; SON, September, October, November; DJF, December, January, February).
Figure 5 shows seasonal NDVI by season and park and depicts the expected variability between parks. During MAM and JJA, consistently across parks, the first and last time periods had the highest mean NDVI, with the lowest mean NDVI occurring during the second period. During SON, the first time period had the highest mean NDVI. In DJF, the third and fourth periods had the highest mean NDVI.
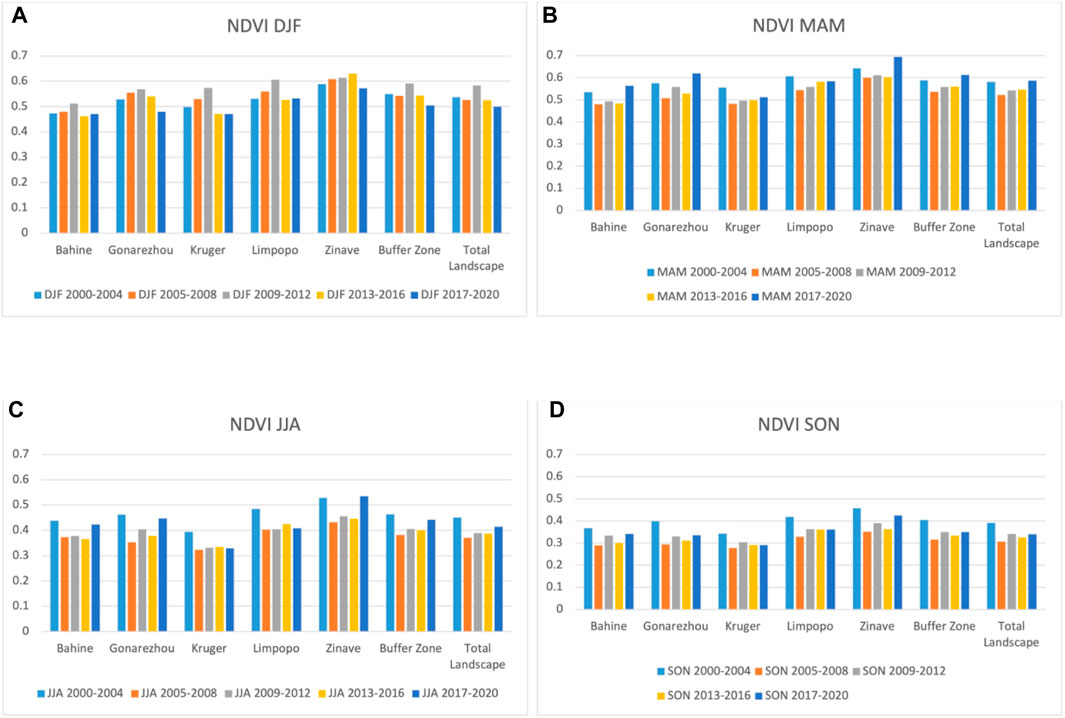
FIGURE 5. Mean Normalized Difference Vegetation Index (NDVI) by national park and season: (A) DJF, December, January, February; (B) MAM, March, April, May; (C) JJA, June, July, August; (D) SON, September, October, November.
Figure 6 represents the spatialized context of NDVI across southern Africa by season and time period; there is a clear trend of minimum NDVI values in the JJA and SON seasons. The latter part of the wet season (MAM) represents the highest values of the year, and the latter part of the dry season (SON), represents the lowest values of the year.
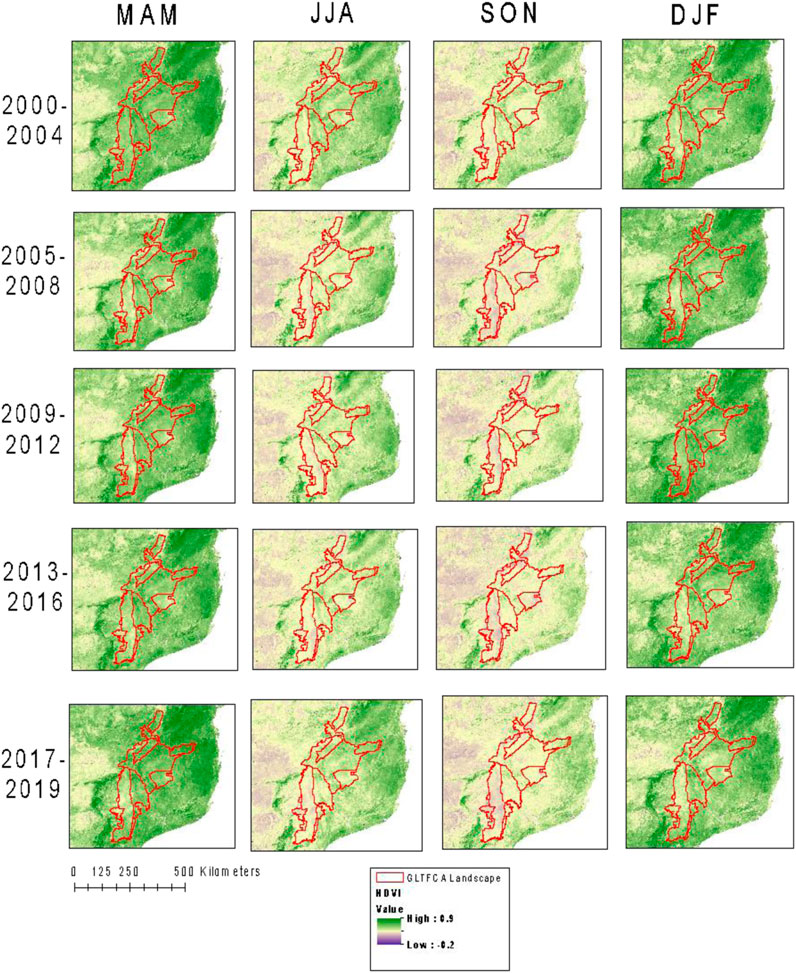
FIGURE 6. Mean Normalized Difference Vegetation Index (NDVI) across southern Africa by time period (NDVI = 2000–2004, 2005–2008, 2009–2012, 2013–2016, 2017–2020) and season (MAM, March, April, May; JJA, June, July, August; SON, September, October, November; DJF, December, January, February).
3.3 Directional persistence
There is a strong negative mean value of D (2000–2020, 2000–2004 baseline and 2005–2020 comparison to benchmark) across all five of the national parks and the buffer zone in all seasons (except for DJF) ranging from −4 to −12 (Figure 7). From the maps in Figure 8, it can be identified that the strongest negative trend is proximate to our study area, where South Africa, Mozambique, and Zimbabwe meet. Furthermore, their trends of negative persistence are far more extensive than positive persistence. Table 4 highlights that there are large portions of the National Parks and buffer zone in the GLTFCA with significant negative persistence across all seasons, whereas there are only very small portions of the National Parks in the GLTFCA with significant positive persistence across the seasons, again, except for DJF, where about 25% of the landscape has a significant positive persistence value. Spatialized D shows a very significant negative pattern in vegetation health across the study area in all seasons except those in the onset of the rainy season (DJF), where there are more neutral values (Figure 8).
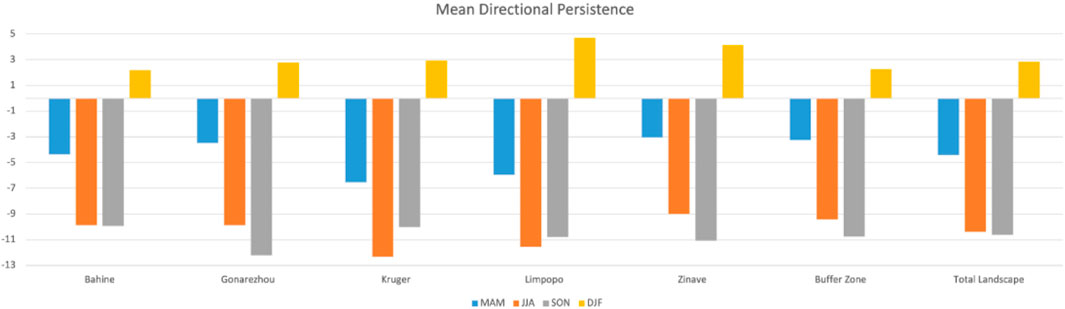
FIGURE 7. Mean Directional Persistence (D) by national park and season (MAM, March, April, May; JJA, June, July, August; SON, September, October, November; DJF, December, January, February) from 2000 to 2020 (2000–2004 baseline and 2005–2020 comparison to benchmark).
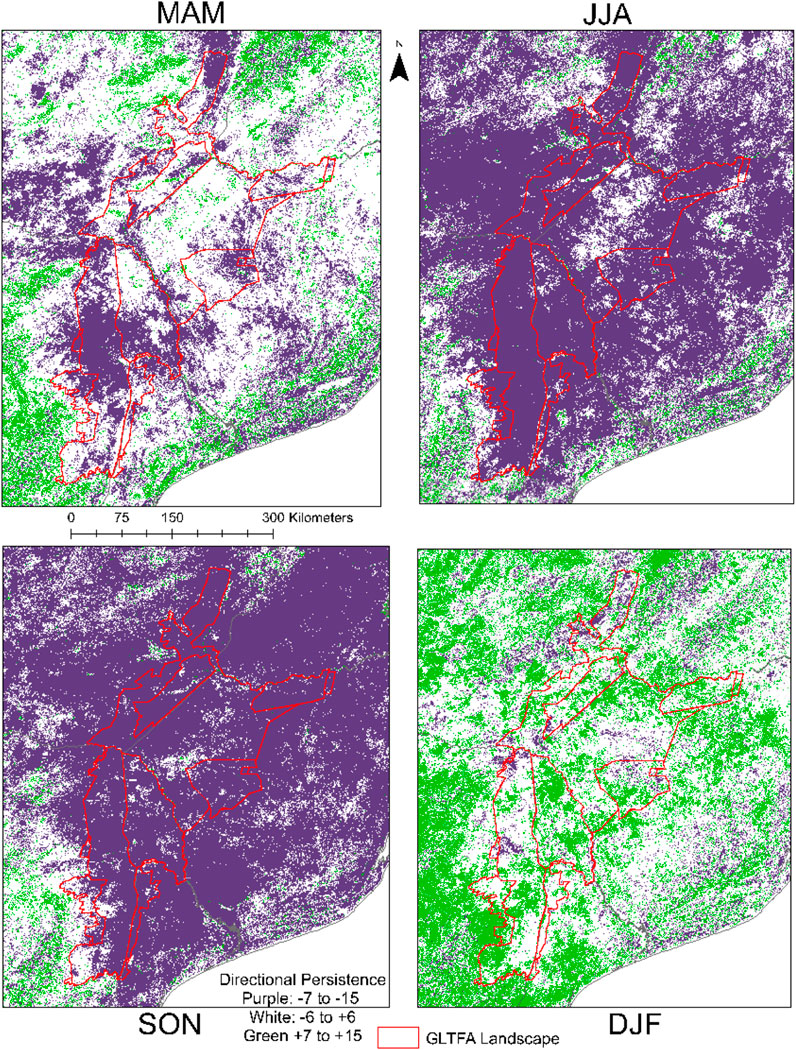
FIGURE 8. Statistically significant Directional Persistence (D) by national park and season (MAM, March, April, May; JJA, June, July, August; SON, September, October, November; DJF, December, January, February) from 2000 to 2020 (2000–2004 baseline and 2005–2020 comparison to benchmark). Statistically significant values of −7 to −15 are in purple, and +7 to +15 are in green, while all other non-significant values are white.
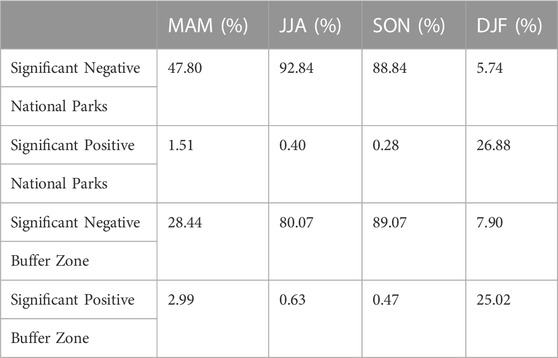
TABLE 4. Percentage of National Parks in the GLTFCA landscape that have significant negative Directional Persistence or significant positive Directional Persistence, by season. (MAM, March, April, May; JJA, June, July, August; SON, September, October, November; DJF, December, January, February).
3.4 Normalized difference vegetation index (NDVI) regressed against precipitation
Figure 9 demonstrates that there is a positive relationship between NDVI and precipitation within the five national parks from 2000 to 2020. Table 5 indicates that there is a significant positive relationship between precipitation and NDVI in each of the parks (p-values = 0.00). Notably, there are varying degrees of explanatory power of precipitation on NDVI, from 55% [Bahine (a), relatively smallest slope] to 79% [Kruger (c), relatively steepest slope], which is strong for a real-world relationship.
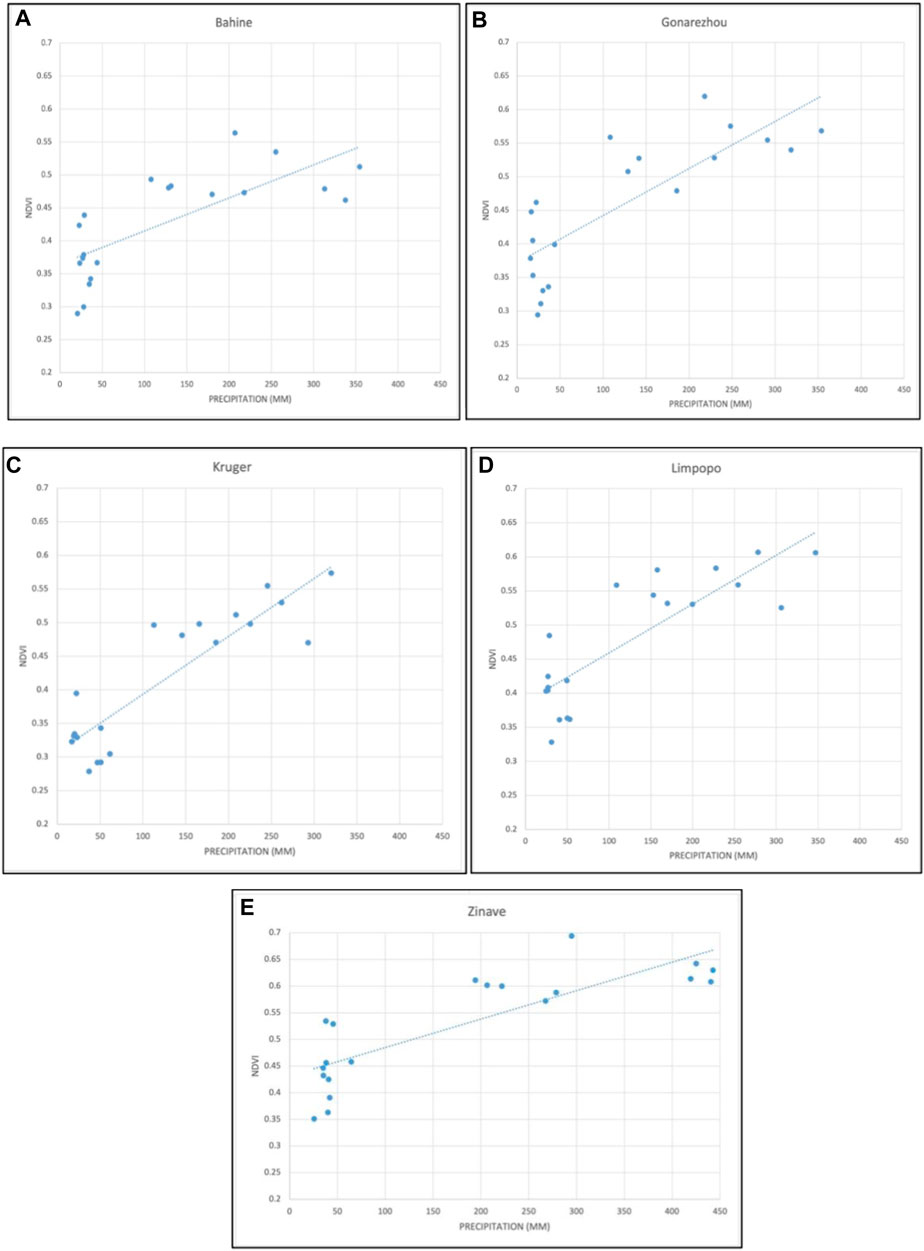
FIGURE 9. Mean Normalized Difference Vegetation Index (NDVI) regressed against total precipitation (mm) from 1999 to 2020 by National Park (A) Bahine (B) Gonarezhou (C) Kruger (D) Limpopo (E) Zinave.
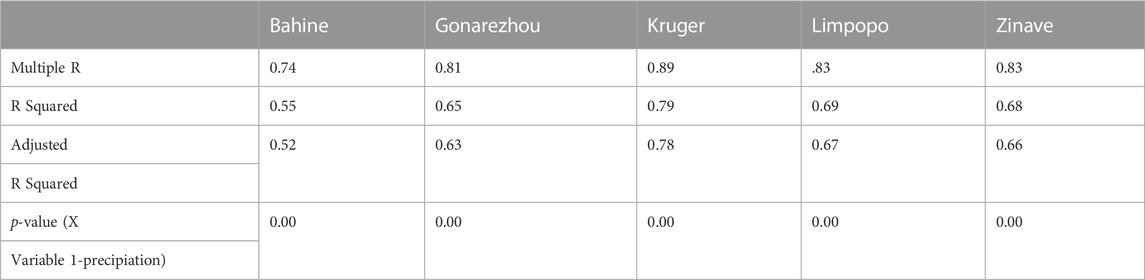
TABLE 5. Regression statistic results from Figure 8 (n = 20).
4 Discussion and conclusion
The GLTFCA serves to conserve ecosystems by effectively eliminating management policy differences across countries. So, with this major variable eliminated, it allows this study to focus on larger scale drivers, such as precipitation. This study supports literature that precipitation is a major driver in savanna systems and is therefore critical to understand for major conservation areas like the GLTFCA (Scholes and Archer, 1997). From this research we can conclude that there has been a change in precipitation across seasons. This has occurred concurrently with a decline in vegetation health between 2000 and 2020 as evidenced by NDVI and D within the National Parks of the GLTFCA.
The precipitation results presented in Table 3 showed that seasons examined from a longer-term climatic period of 1981–2020 had a greater number of statistically significant negative trends than the period of 1999–2020. This indicates that during the latter half of our time period, there may not have been as great of a decline in precipitation, or that the time period was not long enough to establish as strong of a climatic trend. We also found stronger trends in the beginning of the wet season (positive) and the end of the dry season (negative), which exemplifies the need to monitor savanna vegetation during seasonal transitions in the precipitation. For example, dry seasons in southern Africa have been starting earlier, which may help explain why negative trends in NDVI have kept increasing (Andela et al., 2013). This may be related to a change in timing of green-up and senescence in these grassland dominated landscapes, which has been demonstrated in other studies conducted by this research group (Herrero et al., 2020b).
Several studies have assessed changing precipitation and vegetation dynamics and their interactions, as well as the broader impacts within savanna ecosystems. Jung et al., 2010 found a global decline in precipitation led to reduced soil moisture and evapotranspiration, which negatively affects vegetation health (Jung et al., 2010). Some remote sensing studies have found an overall global greening when assessing satellite-derived proxies of vegetation trends (Mitchard et al., 2009; Piao et al., 2011; De Jong et al., 2012; Guay et al., 2014; Brandt et al., 2015; Schimel et al., 2015; Garonna et al., 2016; Bastin et al., 2017). However, our study finds negative directional persistence and supports literature that has suggested that browning hotspots are rising in subequatorial Africa (De Jong et al., 2012; Herrero et al., 2020b). With the overall negative trends of vegetation health based on NDVI and correspondence with precipitation, especially in the southwest portions of the GLTFCA, we can determine that there is a strong link between precipitation and vegetation biomass in savannas in this area, which may override management techniques at larger spatio-temporal scales.
There was a positive relationship between precipitation and NDVI in each of the five parks throughout the time period, although the explanatory power of precipitation on NDVI did vary. Kruger serves as an example of the strong, real-world relationship between precipitation and vegetation, where 79% of NDVI was explained by precipitation, again, overriding potential management interventions. There was an overall decrease in precipitation and NDVI across the landscape. From this research we can determine that the GLTFCA and its parks have seen a decline in healthy vegetation despite cohesive management. The purpose of the GLTFCA and other protected areas are to conserve vegetation through maintaining a well-functioning ecosystem, although currently there is a strong negative trend in vegetation health, when compared to the total landscape, the park is performing somewhat better. This is supported by other studies, which show that these protected areas can still be used as an effective method for vegetation conservation relative to the rest of the landscape (Newmark, 1996; Newmark and Hough, 2000; Newmark, 2008; Herrero et al., 2020a).
The results of this study can inform local management practices within the GLTFCA to assist with possible conservation strategies, within an already changing environment. Using the spatialized D product, the teams within the conservation area can identify the presence of regions vulnerable to vegetation decline (specifically where South Africa, Mozambique, and Zimbabwe meet, as evidenced by Figure 8). When looking at the entire landscape, there is a strong negative D and decreasing NDVI values that are linked with a decline in precipitation, and a changing of arrival of the rains, which is beyond the scale of managers, but must be acknowledged and ultimately, adapted to. The total landscape had similar trends in vegetation health to the national parks, although slightly more negative in NDVI and D. With these spatialized results, the Peace Parks Foundation that oversees the GLTFCA can better target conservation efforts on its landscape, in addition to the work they are doing to help preserve the plant and animal species within the parks and buffer zones. However, even with different conservation techniques, this research highlights how the PPF may have difficulty accounting for the larger scale precipitation driver to achieve its goal of preserving natural resources within the area for future generations, while also retaining harmony across its geopolitical borders (Scholes and Archer, 1997).
This study was limited by the use of regionally aggregated measures of precipitation represented by a mean value for each park and time period, rather than spatialized precipitation data. This may be a future point for improvement to link with our spatialized vegetation data. One other limitation is that the D values account for the relative direction, but not the magnitude of change, i.e., we do not know how much more positive or negative a pixel value is from the deadline, only that the occurrence of years with higher or lower NDVI, as compared to the baseline, was more frequent than expected. Linking such analysis with actual NDVI trends and analysis, as was done in this work, does however, help minimize this limitation.
The methods used in this study, where a time series NDVI analysis is used to evaluate a measure of vegetation health (D) and the connection to precipitation, can be applied globally. Of course, there are many savanna systems within Africa where these methods would be extremely useful, but the focus of this analysis is on transfrontier conservation areas because this was identified as being a significant variable in the prediction of vegetation health in parks by our previous paper (Herrero et al., 2020a), though the GLTFCA was identified as an area of significant concern for D when evaluating a map of all of southern Africa. As discussed above, conservation exists within parks because of the focus of maintaining biodiversity, but in addition to minimizing human impacts, we must be aware of the natural state of vegetation across these landscapes (through indices like NDVI or D) so we can effectively manage these areas and resources.
This study concludes that there have been significant declines in vegetation around the GLTFCA over the 21st century. There was a decline in the NDVI metric and a strong significant decline in the D metric, which can be linked to an overall decline in precipitation. The quantifications of these spatial and temporal changes across this transfrontier study area can facilitate the continuation of collaboration among managers and promote multi-stakeholder efforts to target specific areas of the GLTFCA to conserve natural resources, with data and information that is both timely and spatially targeted, as needed by land managers globally.
Data availability statement
The raw data supporting the conclusion of this article will be made available by the authors, without undue reservation.
Author contributions
Conceptualization, HH and JS; methodology, HH, JS, and CM; software, RK; validation, HH; formal analysis, HH, RK, and CM; investigation, HH and JS; resources, RK; data curation, HH and RK; writing—original draft preparation, HH and SI; writing—review and editing, JS, RK, CM, and SI; visualization, HH and RK; supervision, JS; project administration, JS; funding acquisition, JS. All authors have read and agreed to the published version of the manuscript.
Acknowledgments
These authors would like to thank the Peace Parks Foundation for their data on transfrontier conservation areas.
Conflict of interest
The authors declare that the research was conducted in the absence of any commercial or financial relationships that could be construed as a potential conflict of interest.
Publisher’s note
All claims expressed in this article are solely those of the authors and do not necessarily represent those of their affiliated organizations, or those of the publisher, the editors and the reviewers. Any product that may be evaluated in this article, or claim that may be made by its manufacturer, is not guaranteed or endorsed by the publisher.
References
Andela, N., Liu, Y. Y., van Dijk, A. I. J. M., de Jeu, R. A. M., and McVicar, T. R. (2013). Global changes in dryland vegetation dynamics (1988–2008) assessed by satellite remote sensing: Comparing a new passive microwave vegetation density record with reflective greenness data. Biogeosciences 10, 6657–6676. doi:10.5194/bg-10-6657-2013
Bastin, J. F., Berrahmouni, N., Grainger, A., Maniatis, D., Mollicone, D., Moore, R., et al. (2017). The extent of forest in dryland biomes. Science 356, 635–638. doi:10.1126/science.aam6527
Bégué, A., Vintrou, E., Ruelland, D., Claden, M., and Dessay, N. (2011). Can a 25-year trend in soudano-sahelian vegetation dynamics be interpreted in terms of land use change? A remote sensing approach. Glob. Environ. Change, Special Issue Polit. Policy Carbon Capture Storage 21, 413–420. doi:10.1016/j.gloenvcha.2011.02.002
Blentlinger, L., and Herrero, H. V. (2020). A tale of grass and trees: Characterizing vegetation change in payne’s creek national park, Belize from 1975 to 2019. Appl. Sci. 10, 4356. doi:10.3390/app10124356
Brandt, M., Mbow, C., Diouf, A. A., Verger, A., Samimi, C., and Fensholt, R. (2015). Ground- and satellite-based evidence of the biophysical mechanisms behind the greening Sahel. Glob. Chang. Biol. 21, 1610–1620. doi:10.1111/gcb.12807
Bunting, E. L., Fullman, T., Kiker, G., and Southworth, J. (2016). Utilization of the SAVANNA model to analyze future patterns of vegetation cover in Kruger National Park under changing climate. Ecol. Model. 342, 147–160. doi:10.1016/j.ecolmodel.2016.09.012
Campo-Bescós, M. A., Muñoz-Carpena, R., Kaplan, D. A., Southworth, J., Zhu, L., and Waylen, P. R. (2013a). Beyond precipitation: Physiographic gradients dictate the relative importance of environmental drivers on savanna vegetation. PLoS ONE 8, e72348. doi:10.1371/journal.pone.0072348
Campo-Bescós, M. A., Muñoz-Carpena, R., Southworth, J., Zhu, L., Waylen, P. R., and Bunting, E. (2013b). Combined spatial and temporal effects of environmental controls on long-term monthly NDVI in the southern Africa savanna. Remote Sens. 5, 6513–6538. doi:10.3390/rs5126513
Carlson, T. N., and Ripley, D. A. (1997). On the relation between NDVI, fractional vegetation cover, and leaf area index. Remote Sens. Environ. 62, 241–252. doi:10.1016/S0034-4257(97)00104-1
Chapin, F. S., Chapin, M. C., Matson, P. A., and Vitousek, P. (2011). Principles of terrestrial ecosystem ecology. Berlin/Heidelberg, Germany: Springer.
De Jong, R., Verbesselt, J., Schaepman, M. E., and De Bruin, S. (2012). Trend changes in global greening and browning: Contribution of short-term trends to longer-term change. Glob. Chang. Biol. 18, 642–655. doi:10.1111/j.1365-2486.2011.02578.x
Dinerstein, E., Vynne, C., Sala, E., Joshi, A. R., Fernando, S., Lovejoy, T. E., et al. (2019). A global deal for nature: Guiding principles, milestones, and targets. Sci. Adv. 5, eaaw2869. doi:10.1126/sciadv.aaw2869
Funk, C., Peterson, P., Landsfeld, M., Pedreros, D., Verdin, J., Shukla, S., et al. (2015). The climate hazards infrared precipitation with stations—A new environmental record for monitoring extremes. Sci. Data 2, 150066–150121. doi:10.1038/sdata.2015.66
Garonna, I., de Jong, R., and Schaepman, M. E. (2016). Variability and evolution of global land surface phenology over the past three decades (1982–2012). Glob. Chang. Biol. 22, 1456–1468. doi:10.1111/gcb.13168
Google Earth Engine Explorer (2021). Earthenginen. Avaliable At: https://explorer.earthengine.google.com/#detail/MODIS%2F006%2FMOD13Q1.
Guay, K. C., Beck, P. S., Berner, L. T., Goetz, S. J., Baccini, A., and Buermann, W. (2014). Vegetation productivity patterns at high northern latitudes: A multi-sensor satellite data assessment. Glob. Chang. Biol. 20, 3147–3158. doi:10.1111/gcb.12647
Hanan, N., and Lehmann, C. (2010). Tree-grass interactions in savannas: Paradigms, contradictions, and conceptual models. Boca Raton, FL, USA: Taylor and Francis Group.
Herrero, H., Southworth, J., Muir, C., Khatami, R., Bunting, E., and Child, B. (2020a). An evaluation of vegetation health in and around southern african national parks during the 21st century (2000–2016). Appl. Sci. 10, 2366. doi:10.3390/app10072366
Herrero, H. V., Southworth, J., Bunting, E., Kohlhaas, R. R., and Child, B. (2019). Integrating surface-based temperature and vegetation abundance estimates into land cover classifications for conservation efforts in savanna landscapes. Sensors 19, 3456. doi:10.3390/s19163456
Herrero, H. V., Southworth, J., and Bunting, E. (2016). Utilizing multiple lines of evidence to determine landscape degradation within protected area landscapes: A case study of chobe national park, Botswana from 1982 to 2011. Remote Sens. 8, 623. doi:10.3390/rs8080623
Herrero, H., Waylen, P., Southworth, J., Khatami, R., Yang, D., and Child, B. (2020b). A healthy park needs healthy vegetation: The story of gorongosa national park in the 21st century. Remote Sens. 12, 476. doi:10.3390/rs12030476
Home - Peace Parks Foundation (2022). Peaceparks. Avaliable At: https://www.peaceparks.org/.
Houghton, R. A., Hackler, J. L., and Lawrence, K. T. (1999). The US carbon budget: Contributions from land-use change. Science 285, 574–578. doi:10.1126/science.285.5427.574
Jiang, Z., Huete, A. R., Chen, J., Chen, Y., Li, J., Yan, G., et al. (2006). Analysis of NDVI and scaled difference vegetation index retrievals of vegetation fraction. Remote Sens. Environ. 101, 366–378. doi:10.1016/j.rse.2006.01.003
Jung, M., Reichstein, M., Ciais, P., Seneviratne, S. I., Sheffield, J., Goulden, M. L., et al. (2010). Recent decline in the global land evapotranspiration trend due to limited moisture supply. Nature 467 (7318), 951–954. doi:10.1038/nature09396
Lambin, E. F., and Ehrlich, D. (1997). Land-cover changes in sub-saharan Africa (1982–1991): Application of a change index based on remotely sensed surface temperature and vegetation indices at a continental scale. Remote Sens. Environ. 61, 181–200. doi:10.1016/S0034-4257(97)00001-1
Lehmann, C. E. R., Anderson, T. M., Sankaran, M., Higgins, S. I., Archibald, S., Hoffmann, W. A., et al. (2014). Savanna vegetation-fire-climate relationships differ among continents. Science 343, 548–552. doi:10.1126/science.1247355
Measuring Vegetation (2000). Earthobservatory. Avaliable At: https://earthobservatory.nasa.gov/features/MeasuringVegetation.
Mitchard, E. T., Saatchi, S. S., Gerard, F. F., Lewis, S. L., and Meir, P. (2009). Measuring woody encroachment along a forest–savanna boundary in central Africa. Earth Interact. 13, 1–29. doi:10.1175/2009ei278.1
Monserud, R. A., Tchebakova, N. M., and Leemans, R. (1993). Global vegetation change predicted by the modified Budyko model. Clim. Chang. 25, 59–83. doi:10.1007/bf01094084
Muir, C., Southworth, J., Khatami, R., Herrero, H., and Akyapı, B. (2021). Vegetation dynamics and climatological drivers in Ethiopia at the turn of the century. Remote Sens. 13 (16), 3267. doi:10.3390/rs13163267
Newmark, W. D., and Hough, J. L. (2000). Conserving Wildlife in Africa: Integrated Conservation and Development Projects and beyond Because multiple factors hinder integrated conservation and development projects in Africa from achieving their objectives, alternative and complementary approaches for promoting wildlife conservation must be actively explored. BioScience 50, 585–592. doi:10.1641/0006-3568(2000)050[0585:CWIAIC]2.0.CO;2
Newmark, W. D. (1996). Insularization of Tanzanian parks and the local extinction of large mammals. Conserv. Biol. 10, 1549–1556. doi:10.1046/j.1523-1739.1996.10061549.x
Newmark, W. D. (2008). Isolation of African protected areas. Front. Ecol. Environ. 6, 321–328. doi:10.1890/070003
Ojima, D. S., Valentine, D. W., Mosier, A. R., Parton, W. J., and Schimel, D. S. (1993). Effect of land use change on methane oxidation in temperate forest and grassland soils. Chemosphere 26, 675–685. doi:10.1016/0045-6535(93)90452-b
Piao, S., Wang, X., Ciais, P., Zhu, B., Wang, T. A. O., and Liu, J. I. E. (2011). Changes in satellite-derived vegetation growth trend in temperate and boreal Eurasia from 1982 to 2006. Glob. Chang. Biol. 17, 3228–3239. doi:10.1111/j.1365-2486.2011.02419.x
Protected Planet (2019). Prot. Planet. Avaliable At: https://www.protectedplanet.net/.
Sankaran, M., Hanan, N. P., Scholes, R. J., Ratnam, J., Augustine, D. J., Cade, B. S., et al. (2005). Determinants of woody cover in African savannas. Nature 438, 846–849. doi:10.1038/nature04070
Saura, S., Bertzky, B., Bastin, L., Battistella, L., Mandrici, A., and Dubois, G. (2018). Protected area connectivity: Shortfalls in global targets and country-level priorities. Biol. Conserv. 219, 53–67. doi:10.1016/j.biocon.2017.12.020
Schimel, D., Pavlick, R., Fisher, J. B., Asner, G. P., Saatchi, S., Townsend, P., et al. (2015). Observing terrestrial ecosystems and the carbon cycle from space. Glob. Change Biol. 21 (5), 1762–1776. doi:10.1111/gcb.12822
Scholes, R. J., and Archer, S. R. (1997). Tree-grass interactions in savannas. Annu. Rev. Ecol. Syst. 28, 517–544. doi:10.1146/annurev.ecolsys.28.1.517
Southworth, J., Ryan, S. J., Herrero, H. V., Khatami, R., Bunting, E. L., Hassan, M., et al. (2023). Latitudes and land use: Global biome shifts in vegetation persistence across three decades. Front. Remote Sens. 4, 3. doi:10.3389/frsen.2023.1063188
Southworth, J., Zhu, L., Bunting, E., Ryan, S. J., Herrero, H., Waylen, P. R., et al. (2016). Changes in vegetation persistence across global savanna landscapes, 1982–2010. J. Land Use Sci. 11, 7–32. doi:10.1080/1747423X.2015.1071439
Staver, A. C., Archibald, S., and Levin, S. (2011). Tree cover in sub-Saharan Africa: Rainfall and fire constrain forest and savanna as alternative stable states. Ecology 92, 1063–1072. doi:10.1890/10-1684.1
Tucker, C. J. (1979). Red and photographic infrared linear combinations for monitoring vegetation. Remote Sens. Environ. 8, 127–150. doi:10.1016/0034-4257(79)90013-0
Vogel, M., and Strohbach, M. (2009). “Monitoring of savanna degradation in Namibia using Landsat TM/ETM+ data,” in Proceedings of the Geoscience and Remote Sensing Symposium, Cape Town, South Africa, 12–17 July 2009 (IEEE), 931–934.
Wang, J., Rich, P. M., Price, K. P., and Kettle, W. D. (2005). Relations between NDVI, grassland production, and crop yield in the central great plains. Geocarto Int. 20, 5–11. doi:10.1080/10106040508542350
Waylen, P., Southworth, J., Gibbes, C., and Tsai, H. (2014). Time series analysis of land cover change: Developing statistical tools to determine significance of land cover changes in persistence analyses. Remote Sens. 6, 4473–4497. doi:10.3390/rs6054473
Keywords: remote sensing, vegetation dynamics, savanna landscapes, national parks, conservation, climate
Citation: Herrero HV, Southworth J, Khatami R, Insalaco S and Muir C (2023) Examining the relationship between vegetation decline and precipitation in the national parks of the Greater Limpopo Transfrontier Conservation Area during the 21st century. Front. Environ. Sci. 11:1106849. doi: 10.3389/fenvs.2023.1106849
Received: 24 November 2022; Accepted: 28 February 2023;
Published: 14 March 2023.
Edited by:
Jie Wang, China Agricultural University, ChinaReviewed by:
Gautam Talukdar, Wildlife Institute of India, IndiaDi Yang, University of Wyoming, United States
Copyright © 2023 Herrero, Southworth, Khatami, Insalaco and Muir. This is an open-access article distributed under the terms of the Creative Commons Attribution License (CC BY). The use, distribution or reproduction in other forums is permitted, provided the original author(s) and the copyright owner(s) are credited and that the original publication in this journal is cited, in accordance with accepted academic practice. No use, distribution or reproduction is permitted which does not comply with these terms.
*Correspondence: Hannah V. Herrero, aGhlcnJlcm9AdXRrLmVkdQ==