 Wenxuan Fan
 Jie Li
 Zhiwei Han2,3
 Jiawei Li
94% of researchers rate our articles as excellent or good
Learn more about the work of our research integrity team to safeguard the quality of each article we publish.
Find out more
ORIGINAL RESEARCH article
Front. Environ. Sci., 19 January 2023
Sec. Atmosphere and Climate
Volume 11 - 2023 | https://doi.org/10.3389/fenvs.2023.1101745
This article is part of the Research TopicAir Pollution, Deposition, and Source Identification in South AsiaView all 5 articles
From March to April, widespread forest fires and agro-residue burning frequently occur in Southeast Asia, which release large amounts of gas species and aerosols and impact air quality over the wide source and downwind regions. In this study, we investigated the impact of biomass burning (BB) over Southeast Asia on particulate matter concentrations and aerosol properties in downwind areas of the low-latitude plateau from 1 March to 30 April 2019, with a focus on a typical pollution event in Kunming (KM), the capital of Yunnan Province, by using a wide variety of observations from the Chenggong ground monitoring station in Yunnan University, an air quality network in China, satellite retrievals and ERA-5 reanalysis data and numerical simulation. A regional pollution event contributed by BB pollutants from Southeast Asia and the India-Myanmar trough occurred in Yunnan Province on 31 March to 1 April 2019, which was the only typical pollution event that pollution transmission ran through central Yunnan Province from south to north since 2013, when the Airborne Pollution Action Plan was unveiled by China government. The daily mean PM2.5, PM1, and black carbon concentrations increased by 73.3 μg m−3(78%), 70.5 μg m−3 (80%), and 7.7 μg m−3 (83%), respectively, and the scattering and absorbing coefficients increased by 471.6 Mm−1 and 63.5 Mm−1, respectively, at the Chenggong station. The southwest winds exceeding 2 km vertically thick appeared in front of the India-Myanmar trough over the fire regions, pushing BB plumes northward into Yunnan Province. The model results show that 59.5% of PM2.5 mass produced by BB in Yunnan Province was sourced from the Myanmar-Thailand border, and 29.3% was from western Myanmar at a lower altitude (<4.9 km), which indicated that BB in the Myanmar-Thailand border was the dominant contributor.
Biomass burning (BB) is an important source of particulate matter (PM) and gaseous species at both global and regional scales and has a profound influence on the oxidation capacity of the atmosphere, ozone concentration, aerosol properties, and cloud microphysics (Crutzen and Andreae, 1990; Andreae and Merlet, 2001; Chan et al., 2006; Nie et al., 2015; Zhu et al., 2017; Eck et al., 2019). BB occurs worldwide, such as in the Amazon rainforest, Southeast Asia, central and western Africa, and the forest regions of Siberia. A number of studies on the radiative and climatic effects of BB over the above regions have been conducted in past two decades. Zhang et al. (2008) numerically investigated the effects of biomass-burning aerosols on land-atmosphere interactions over the Amazon, which indicated that smoke aerosols reduced net solar radiation at the surface and increased solar absorption at higher levels, stabilizing the lower troposphere and leading to anomalous wind divergence in the southern Amazon. Tosca et al. (2010) proposed a possible positive feedback loop in which anthropogenic burning in the tropical forests of equatorial Asia intensified drought stress during El Niño. Zhang et al. (2010) used an integrated method of filter measurement, satellite data, and Positive Matrix Factorization (PMF) analysis and estimated the annual mean contribution of BB to PM2.5 mass to be 13% over southeast US, with a much higher contribution in winter. By using a global aerosol and chemistry transport model, Myhre et al. (2008) investigated the radiative forcing associated with biomass burning aerosols over West Africa and estimated a strong negative radiative forcing by BB aerosols at the top of the atmosphere (TOA) under clear-sky conditions and a radiative forcing close to zero under all-sky conditions.
In recent years, several studies on BB over East Asia have been carried out. Deng et al. (2008) found that BB from Southeast Asia reduced ultraviolet (UV) intensity and ozone formation in Guangzhou. Lee et al. (2011) observed the enhancement of PM2.5 mass and water-soluble ions in the plumes from Southeast Asia at a mountain site in Taiwan, with a maximum increase of PM2.5 up to 40 μg m−3; Fu et al. (2012) indicated that BB in March in Southeast Asia had a significant impact on Yunnan and Guangxi Provinces of China and the South China Sea, with the percentage contributions of 20%–70% to total PM2.5 concentration; Jung et al. (2016) analyzed smoke plumes emitted from Siberian forest fires to the Korean Peninsula, which led to approximately five times higher levoglucosan concentrations and high organic carbon/elemental carbon (OC/EC) ratios. The model results from Zhu et al. (2017) showed that the smoke from Northeast India and North Myanmar extended from the surface to 4 km and was transported to Southwest China, which contributed 57% of the aerosol optical depth (AOD) over Kunming (KM). The above studies demonstrated a significant impact of BB on atmospheric chemistry, air quality, and radiative forcing over East Asia. However, our knowledge of BB and its influence over East Asia is still limited.
The long-range transport of BB pollutants from Southeast Asia in spring has become the decisive resistance to the improvement of air quality in Southwest China, and has attracted extensive attention from Chinese and Southeast Asian governments. It is necessary to deepen the research and understanding of the pollution transport. A regional pollution event from 31 March to 2 April 2019 occurred over the low-latitude plateau in China, with PM2.5 concentrations in seven cities in Yunnan Province exceeded the Grade II National Ambient Air Quality Standard (75 μg m−3) on 1 April. It was a typical pollution event formed with the cooperation of emissions and the local synoptic system, mainly resulting from the long-range transport of BB pollutants from Southeast Asia, contributed by the India-Myanmar trough over the fire regions. This study attempts to explore BB sources, transboundary pathways, aerosol concentrations, and aerosol optical properties over Southeast Asia and southwestern China. The impact of BB over Southeast Asia on air quality in downwind regions, especially during this typical pollution event in KM, was comprehensively investigated with a series of observations and simulations. The transport pathways of BB pollution were identified by analysis of back-trajectory, satellite retrievals, and the model simulations. This study would provide some significant insights into the transport mechanism of BB. Section 2 describes the observation data set and methods, the analysis results are presented in Section 3, and Section 4 summarizes the findings and discusses the major issues.
Ground measurements from 1 March to 30 April 2019 were conducted at the monitoring station (102.85°E, 24.83°N) of the Key Laboratory of Atmospheric Environment and Processes in the Boundary Layer (AEPBL) in the Chenggong Campus of Yunnan University. This station is located in the low-latitude plateau, approximately 30 km southeast of KM downtown. Table 1 summarizes all measurement information for this study. The measurements were conducted inside a measurement container, in which the temperature was maintained at 24°C. The temporal resolutions of each instrument were 5 min and the original data were averaged at an interval of 1 h via data post-processing and analysis. The PM2.5 and PM1 mass concentrations were measured using an environmental dust monitor (Grimm EDM 180-MC, GRIMM Aerosol Technik GmbH & Co. KG), which is an automated monitoring analyser utilizing a measurement principle based on an active sampling of ambient aerosols and contemporaneous analysis by the means of a light-scattering technique for determination of particle size and mass concentration. The nitrogen oxides (NOx), sulfur dioxide (SO2), and carbon monoxide (CO) trace gases were measured using online analysers (TEI 42i, 43i and 48i, respectively, Thermo Fisher Scientific Inc.). The 42i analyzer calculates NO by measuring the light intensity produced by the reaction between NO and O3, while NO2 is converted into NO for measurement. The 43i analyzer calculates SO2 by measuring UV light produced by the excited SO2 molecule attenuates to a lower energy state. The 48i analyzer is designed based on the absorption of CO to infrared radiation with a wavelength of 4.6 μm.
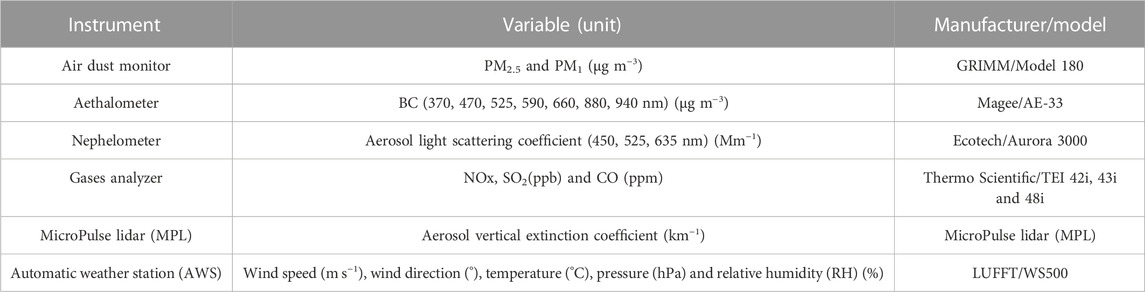
TABLE 1. Instruments for measurements at the Chenggong station.
The hourly observational data of air pollutants concentration, including PM2.5, ozone (O3), nitrogen dioxide (NO2), and carbon monoxide (CO) at the four cities, Jinghong (JH, 100.80°E, 22.01°N), Puer (PE, 100.98°E, 22.80°N), Yuxi (YX, 102.54°E, 24.36°N) and Kunming (KM, 102.71°E, 25.01°E) of Yunnan Province (shown in Figure 1B) are derived from the Air Quality Database of the Ministry of Environmental Protection (https://www.mee.gov.cn/). Furthermore, PM2.5 concentrations of 211 sites in Yunnan, Sichuan, Guizhou, and Guangxi Provinces between 97°E∼110°E and 21°N∼30°N were interpolated to a grid with a spatial resolution of 0.25° × 0.25°.
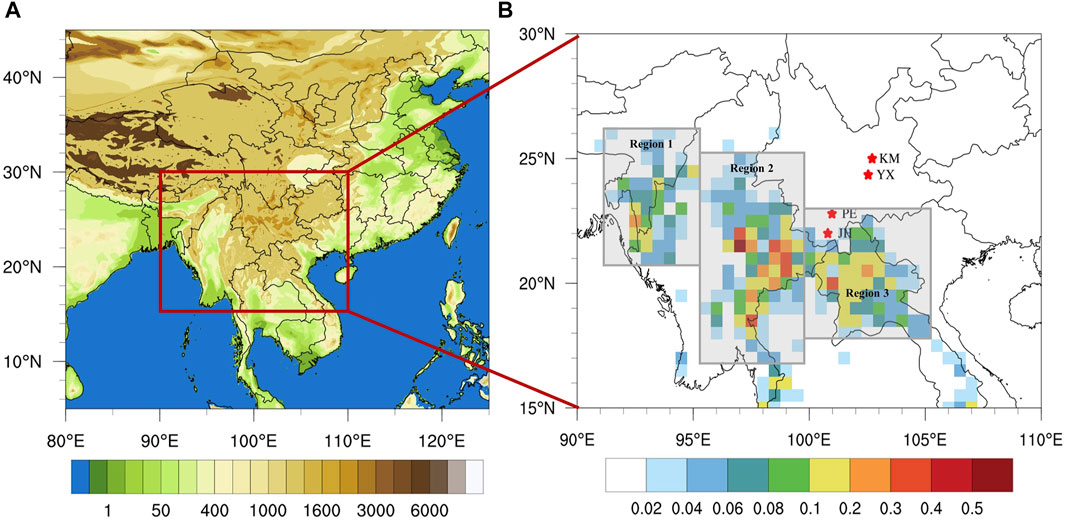
FIGURE 1. The study domain with terrain height (unit: meter) and the focused area (A). The spatial distribution of mean emission rates (mg m−2 hr−1) of black carbon (BC) from GFED during the study period and the three sub-regions where biomass burning occurred (B). Red stars denote the major sites where observations for meteorology, air pollutants concentrations are available for model validation (JH, Jinghong, 100.80°E, 22.01°N; PE, Puer, 100.98°E, 22.80°N; YX, Yuxi, 102.54°E, 24.36°N; KM, Kunming, 102.71°E, 25.01°E).
The black carbon (BC) instrument model AE33 measures the attenuation of light by continuously collecting particles on the filter membrane. The concentration of BC aerosol was obtained according to the absorption characteristics of BC aerosol and the attenuation degree of transmitted light at 370, 470, 520, 590, 660, 880, and 950 nm. The AE33 can realize dual point sampling on the parallel filter belt membrane according to different particle loading rates, which avoids the overload effect of particles at the same point effectively, thereby improving the accuracy of BC measurement and calculation. The BC absorbing coefficient (532 nm) was calculated using the BC880 mass concentration (Yan et al., 2008). Aerosols from BB contain abundant light-absorbing organic compounds, and these organic compounds can strongly enhance light absorption at ultraviolet wavelengths compared to those in the near-infrared wavelengths, so the BC370 and BC880 could be used to represent BB BC and fossil fuel combustion-related BC (Zheng et al., 2021).The light scattering coefficients corresponding to three wavelengths (450 nm, 525 nm and 635 nm) were measured by Aurora 3000 integral nephelometer of Ecotech, Australia, which is an instrument that directly measures the scattering coefficient of particles based on the exponential attenuation law of light. The aerosol vertical extinction coefficient was measured by an elastic backscattering micropulse lidar (MPL-4B-IDS), which is used for long-term automatic observation of aerosols and clouds. The emitted laser beam is 532 nm green light. The meteorological data, including wind speed (m s−1), wind direction (°), air temperature (°C), pressure (hPa) and RH (%), was collected at Chenggong station using the automatic weather station (LUFFT/WS500).
The daily Visible Infrared Imaging Radiometer Suite (VIIRS) deep blue aerosol products at a resolution of 1° × 1°, including the column AOD at 0.550 μm and aerosol type (Hsu et al., 2019), were used in this study. AOD represents the extinction of solar radiation by aerosols in the atmospheric column. An AOD less than 0.3 can be regarded as clean, and an AOD higher than 1.0 represents highly polluted conditions (Hsu et al., 2019; Huang et al., 2019). A new smoke mask in the VIIRS Deep Blue (DB) algorithm was developed based on the spectral curvature of measured reflectance to distinguish BB smoke from weakly absorbing urban/industrial aerosols. The Collection 6 Terra and Aqua Moderate Resolution Imaging Spectroradiometer (MODIS) fire products (https://firms.modaps.eosdis.nasa.gov/) were also used in this study, which were the basement for the estimation of fire emissions in Global Fire Emission Database version 4 (GFEDv4) (van der Werf et al., 2017) (http://www.globalfiredata.org/).
The satellite products from the Cloud-Aerosol Lidar and Infrared Pathfinder Satellite Observations (CALIPSO) (https://asdc.larc.nasa.gov/) were also collected. The Cloud-Aerosol Lidar with Orthogonal Polarization, on board the CALIPSO platform, is a spaceborne polarization-sensitive two-wavelength (532 and 1,064 nm) lidar (Wu et al., 2017). It observes the global aerosol/cloud vertical distribution and provides products of aerosol-type classification and optical properties. In this study, level 2 aerosol extinction and aerosol type were used.
For tracking potential pollution sources and transport pathways, the backward trajectories were reproduced using the Hybrid Single-Particle Lagrangian Integrated Trajectory (HYSPLIT) model from the Air Resource Laboratory of the National Oceanic and Atmospheric Administration (https://ready.arl.noaa.gov/HYSPLIT.php). The model is driven by the Global Data Assimilation System (GDAS) meteorological field, with a temporal resolution of 3 h and a horizontal resolution of 1° × 1° and 23 layers in the vertical. The satellite products from the Cloud-Aerosol Lidar and Infrared Pathfinder Satellite.
The synoptic condition, such as the India-Myanmar trough, is an essential factor affecting pollutant transport and distribution. The ERA5 reanalysis data from the European Centre for Medium-Range Weather Forecasts (ECMWF) with a resolution of 0.25° × 0.25° was used to analyze synoptic conditions and provide boundary conditions for model simulation. It includes horizontal wind at 100 m (UV100), wind (U, V, ω) and geopotential height between 1,000 and 450 hPa. The hourly observations of meteorological variables, including air temperature and relative humidity at 2 m (T2 and RH2) and wind speed and direction at 10 m (WS10 and WD10), are derived from the National Meteorological Information Center (http://data.cma.cn), and the monitoring sites in KM, YX, PE, and JH (shown in Figure 1B) are selected for evaluation of meteorological simulations.
A regional air quality model system (RAQMS) driven by the Weather Research and Forecasting Model version 4.1 (WRFv4.1) is applied in this study. Boundary conditions in WRFv4.1 are provided by the ERA5 reanalysis data. RAQMS is a three-dimensional Eulerian model, which is constructed on a spherical and terrain-following coordinate system and comprises major physical and chemical processes of gases and aerosols in the troposphere, including advection, diffusion, dry and wet depositions, and multi-phase chemistry (Han et al., 2004; Han et al., 2008; Li et al., 2018). The study domain covers most areas of Southeast Asia and China (80°E∼125°E, 5°N∼45°N), with a focus on the low-latitude plateau in China (Figure 1A). RAQMS in this study uses a 0.5° × 0.5° horizontal resolution and 12 layers in the vertical extending from near surface to 10 km. The study periods are from 0000 UTC on 15 March to 2300 UTC on 15 April 2019, during which the typical pollution event over the low-latitude plateau in China exactly occurred. The first 5 days are taken as initialization.
Monthly mean anthropogenic emissions for China with a horizontal resolution of 0.5° for 2019 are provided by the Multi-resolution Emission Inventory for China (MEIC) developed by Tsinghua University (http://meicmodel.org) (Li et al., 2017a; Zheng et al., 2018). Monthly mean anthropogenic emissions for Asian countries except for China, with a horizontal resolution of 0.25°, are provided by the MIX inventory (http://meicmodel.org) (Li et al., 2017b). Three-hourly BB emissions with a horizontal resolution of 0.25° are derived from GFEDv4. The emissions include sulfur dioxide (SO2), nitric oxide (NOx), ammonia (NH3), volatile organic compounds (VOCs), CO, carbon dioxide (CO2), BC, OC, and primary PM2.5 (PPM2.5), etc., which are directly released from burning of savanna, grassland, shrubland, boreal forest, temperature forest, tropical forest, peat fires, and agricultural waste. Figure 1B shows the mean emission rates of BC from GFEDv4 during the study period in Southeast Asia bordering Yunnan Province. It is found that high BC emissions mainly occurred in three sub-regions, western Myanmar (Region 1, R1), the border between Myanmar and Thailand (Region 2, R2), and northern Laos (Region 3, R3), with the maximum up to 0.2, 0.5, and 0.3 mg m−2 hr−1, respectively. In addition, daily BB emissions with a horizontal resolution of 0.1° are also obtained from the Fire INventory (FINNv2.5, https://rda.ucar.edu/datasets) for the analysis of simulation uncertainty.
A series of sensitivity simulations are conducted to quantify the impact of BB emissions in Southeast Asia on air quality and to identify the individual contributions of BB emissions in different regions of Southeast Asia to air pollutants mass in Yunnan Province during the study period. Base is run with only anthropogenic and biogenic emissions. Scenario 1 (S1) includes BB emissions in Southeast Asia (excluding BB emissions in China), with other inputs being the same as in Base run; the difference between Base run and S1 (S1 minus Base) indicates the impact of BB emissions in Southeast Asia on air quality. Based on S1, Scenario 2 (S2) turns off the BB emissions in Region 1; the difference between S1 and S2 (S1 minus S2) represents the contribution of BB emissions in R1. Scenario 3 (S3) further turns off the BB emissions in Region1 and Region 2; the difference between S2 and S3 (S2 minus S3) represents the contribution of BB emissions in R2. Scenario 4 (S4) is the same as S3, except BB emissions in Region 3 are turned off. S3 minus S4 represents the contribution of BB emissions in R3, while S4 minus Base run denotes the contribution of BB emissions in other regions (OR) except R1, R2, and R3 in Southeast Asia.
The southwest wind prevailed at the Yunnan University (YNU) Chenggong station from 1 March to 30 April 2019, with wind speed in a range of 2–5 m s−1 (Figure 2A). The daily variations of PM, BC, aerosol scattering coefficient (525 nm), and absorbing coefficient (532 nm) were similar to each other (Figures 2B–D). The mean concentrations of PM2.5 and PM1 were 34.5 and 30.5 μg m−3, respectively, during the period. It was striking that the daily mean PM2.5 and PM1 concentrations increased remarkably from 20.2 μg m−3 to 17.2 μg m−3 on 30 March to 93.5 and 87.7 μg m−3 on 1 April, which exceeded the Grade II National Ambient Air Quality Standard (75 μg m−3) and indicated the occurrence of an air pollution event. At the same time, BC concentration, aerosol scattering coefficient, and absorbing coefficient also increased simultaneously within 48 h, with BC370 and BC880 concentrations, the scattering and absorbing coefficients increased by 12.1 μg m−3, 7.7 μg m−3, 471.6 Mm−1, and 63.5 Mm−1, respectively. During the pollution episode, the fractional contributions of long-range transport of BB pollutants from Southeast Asia to the YNU site were estimated to be approximately 80% for PM1, 78% for PM2.5, and 83% for BC880 concentrations, respectively, which demonstrated a substantial influence of the BB on the air quality of KM in spring 2019. Previous studies found that BB from Southeast Asia could explain about 20–70% of PM2.5 in Yunnan Province (Fu et al., 2012) and 57% of the total AOD in KM (Zhu et al., 2017). It is noted that our results were slightly higher compared to previous studies, which was due to the PM2.5 concentration in a typical event was reasonably higher than that of the monthly mean.
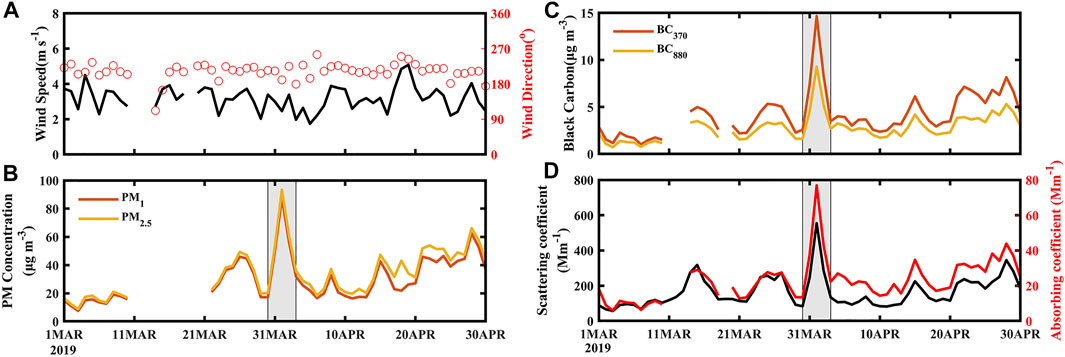
FIGURE 2. Daily mean observations of (A) wind speed (m s−1) and wind direction (°), (B) PM2.5 and PM1 concentrations (μg m−3), (C) BC370 and BC880 concentrations (μg m−3) and (D) aerosol scattering coefficient (525 nm) and absorbing coefficient (532 nm) (Mm−1) at the Chenggong station from 1 March to 30 April 2019. The pollution episode occurred from 30 March to 2 April 2019 is denoted by the grey shaded area.
For more details, Figure 3 shows the hourly mean values of PM and BC concentrations, scattering coefficient, absorbing coefficient, meteorological variables and the vertical aerosol profiles from 30 March to 2 April 2019, when the air pollution event occurred. PM and BC concentrations and scattering coefficient began to increase on 31 March, with the maximums of PM2.5 and PM1 concentrations reached 130.1 and 122.7 μg m−3 in the early morning of 2 April, respectively (Figures 3A–C). The southwest wind prevailed during the episode with a wind direction of 180°–270°, and the maximum wind speed in the daytime was larger than 5 m s−1, suggesting the air mass was from the southwest. The westerly wind abruptly increased at 7:00 LST on 2 April, resulted in the dissipation of pollutants and the ending of the pollution episode (Figure 3D).
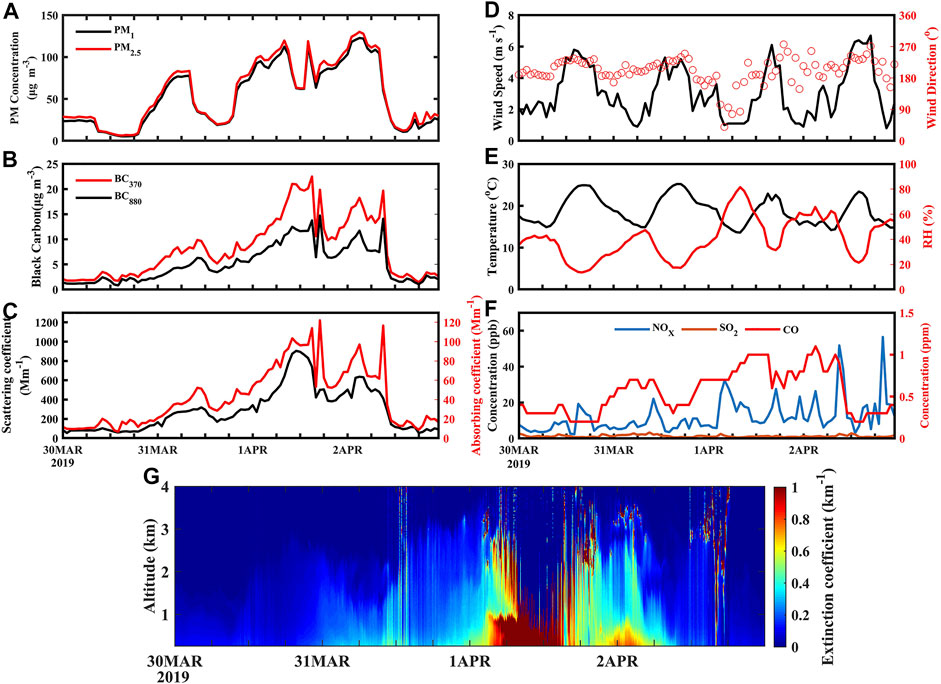
FIGURE 3. Hourly mean observations of (A) PM2.5 and PM1 concentrations (μg m−3), (B) BC370 and BC880 concentrations (μg m−3), (C) aerosol scattering coefficient (525 nm) and absorbing coefficient (532 nm) (Mm−1), (D) wind speed (m s−1) and wind direction (°), (E) temperature (°C) and relative humidity (RH, %), (F), NOx, SO2 (ppb) and CO concentrations (ppm) and (G) the vertical profiles of aerosol extinction coefficient (km−1) at the Chenggong station from 30 March to 2 April 2019.
The maximum of BC concentrations, the scattering, and absorbing coefficients appeared around noon on 1 April (Figures 3B, C). Wang et al. (2011) indicated that BC370 concentration was generally much larger than BC880 concentration in the air mass of BB due to aerosols from BB could strongly absorb light at ultraviolet wavelengths. The concentration of BC370 was larger than that of BC880 during the pollution episode in this study, with the maximum differences between BC370 and BC880 up to 9 μg m−3 and 7 μg m−3 on 1 April and 2 April (Figure 3B), respectively, suggesting the considerable influence of BB from Southeast Asia through long-range transport. Previous studies indicated that wildfire was one of the primary sources of CO (Mafusire et al., 2016). Figure 3F shows the hourly variation of NOx, SO2 and CO concentrations, demonstrating that CO rather than NOx and SO2 increased simultaneously with PM and BC. The hourly CO concentration reached the maximum value of 1.1 ppm on 2 April, much higher than the mean CO concentration (0.5 ppm) in March and April 2019, indicating that the primary source of the pollutants observed in KM was BB over Southeast Asia.
The vertical aerosol profiles detected by lidar at the YNU Chenggong station are shown in Figure 3G. Aerosols were mainly concentrated near surface on 30 March, and the aerosol extinction coefficient was less than 0.15 km−1. The aerosol extinction coefficient slightly increased to 0.3 km−1 on 31 March, while high aerosol concentration was still mainly concentrated below 1 km. It was also noticed that, below 1 km, the aerosol concentration gradually accumulated on the night of 31 March and the high extinction coefficient larger than 1 km−1 abruptly appeared in the early morning of 1 April. In addition to the accumulation of near surface aerosols, there could be a downward transport of aerosols from the altitude of 1.5–3 km to the surface, suggesting that long-range transport coming from different paths occurred at upper and lower altitudes. There was another weak peak of the aerosol extinction coefficient on 2 April, and the aerosol extinction coefficient decreased at noon on 2 April.
Figure 4 shows the observed hourly concentrations of PM2.5 at the four cities in Yunnan Province during the pollution episode and the 29-h backward trajectories ending at 0 m altitude and 05:00 UTC (13:00 LST) on 1 April at these cities, when the hourly PM2.5 concentration in KM reached the maximum. It was noteworthy that the temporal variations of PM2.5 concentration were alike among these cities (Figure 4A), the maximum PM2.5 gradually decreased from south to north, negatively correlated with the distance to the fire regions in Southeast Asia, and the air mass arriving at the four cities came from near the borders of Myanmar, Thailand, and Laos (Figure 4B). It is noticed that the PM2.5 concentration substantially increased (up to 173 μg m−3) at midnight on 1 April in JH, a city near the border between Myanmar and China (JH in Figure 1B). The PM2.5 maximum up to 114 μg m−3 appeared around noon on 1 April in KM (the northernmost site among the four cities) (Figure 4A), about 12 h later than that in JH, reflecting an evident regional transport path of Southeast Asian BB regions to Yunnan Province.
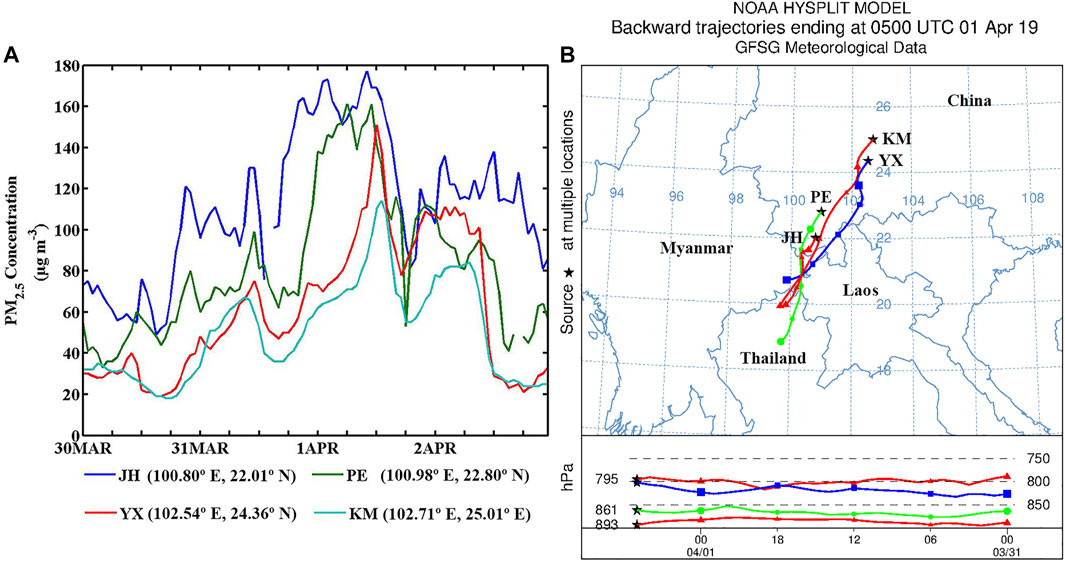
FIGURE 4. (A) The observed hourly concentrations of PM2.5 (μg m−3) in Jinghong (JH,100.80°E, 22.01°N), Puer (PE, 100.98°E, 22.80°N), Yuxi (YX, 102.54°E, 24.36°N) and Kunming (KM, 102.71°E, 25.01°E) from 30 March to 2 April, 2019. (B) The 29-h backward trajectories of air parcels ending at 0 m altitude above ground level over 4 sites at 05:00 UTC on 1 April, when the hourly maximum of PM2.5 appeared in Kunming. Note that trajectories were colored with ending date.
To further identify the potential sources of this pollution event, the vertical aerosol profiles detected by the CALIPSO satellite and the backward trajectories were analyzed (shown in Figure 5). The CALIPSO satellite passed over Southeast Asia and western Yunnan Province from north to south at 19:22–19:26 UTC on 31 March. It shows that the air masses arriving at the locations on the satellite orbit track in Yunnan Province were mainly from Myanmar (Figure 5A). It was striking that there was an approximately 2 km vertically thick smoke layer at 1–4 km altitude extending from northern Thailand (98.4°E, 19°N), crossing eastern Myanmar (99.1°E, 22.2°N) to western Yunnan Province (99.8°E, 25°N) (Figures 5B, C, blank areas denote data unavailable due to cloud, etc.), with the maximum aerosol extinction coefficient >2 km−1. Figure 5D exhibited negative vertical velocities (upward movement of air mass) from 19°N to 24°N along the track, uplifting most fire plumes at 3 km altitude. These satellite retrievals indicated the smoke plumes mainly originated in the fire emissions over eastern Myanmar and the long-range transport of fire aerosols towards Yunnan Province, consistent with the analysis of surface observations and backward trajectory. It should be mentioned that the elevation gradually increased from Southeast Asia to Yunnan Province (Figure 5C), and the height of the Chenggong station and KM was 1920 m above sea level. Although there was no CALIPSO track crossing KM (102.71°E, 25.01°N) during this episode, the proximity of KM to the track and the large-scale transport characteristic of the fire plumes suggested that the BB over Southeast Asia likely contributed to the pollution event in KM on 1 April.
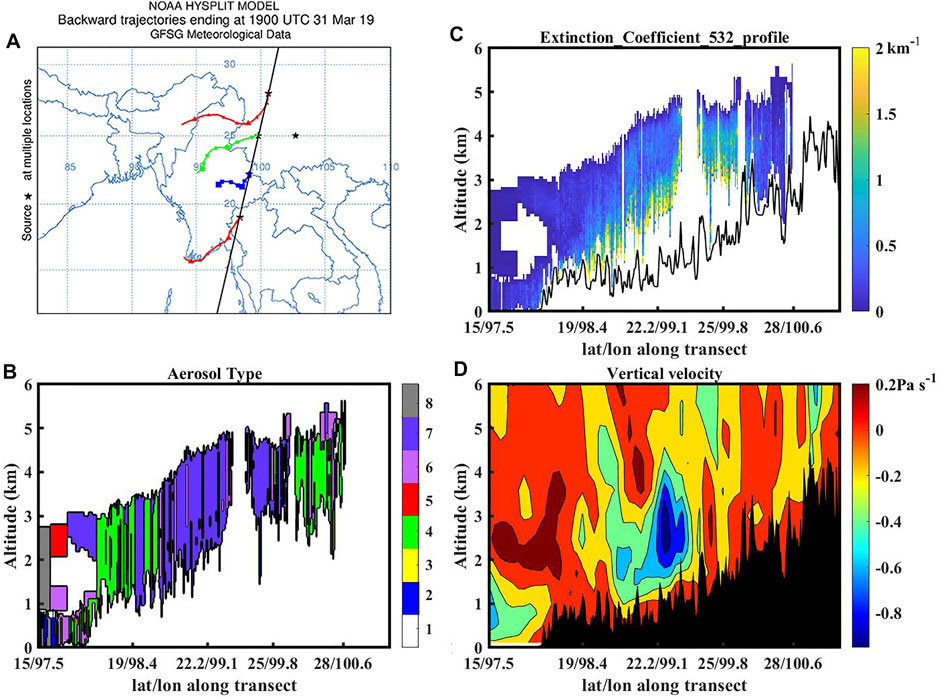
FIGURE 5. (A) The 48-h backward trajectories of air parcels ending at 0 m altitude at the 4 locations on the CALIPSO satellite orbit tracks. CALIPSO vertical profiles of (B) aerosol types (where 1 = not determined, 2 = clear marine, 3 = dust, 4 = polluted continental, 5 = clear continental, 6 = polluted dust, 7 = smoke, and 8 = other) and (C) aerosol extinction coefficient (km−1) (the black line represents surface elevation) at 19:22–19:26 UTC on 31 March 2019, (D) Vertical velocity (Pa s−1) at 18:00 UTC on 31 March 2019.
The MODIS and VIIRS data provide more details on aerosol properties (Figure 6), although the data is unavailable over the central and northern parts of Yunnan Province. The regions with high AOD corresponded well to those with large fire spots, indicating the presence of BB particles. For example, the fires were widely distributed in Myanmar, Laos, and northern Thailand on 30 March 2019 (Figure 6A), and high AOD was concentrated over Laos and northern Thailand (Figure 6E), and smoke exactly existed on the border between Myanmar, Laos, Thailand, and China (Figure 6I). Furthermore, the fire spots were concentrated in Laos on 31 March (Figure 6B), and high AOD moved northward and westward to the border between Laos, Vietnam, and China (Figure 6F). The smoke on the border between Myanmar, Laos, Thailand, and China also moved northward, and new smoke appeared in northern Myanmar (Figure 6J). The fire spots increased in eastern Myanmar and Laos on 1 April (Figure 6C); it was impressive that the smoke plumes moved further northward and reached KM (Figure 6K), with AOD up to 1.8 (Figure 6G), consistent with the above surface observation analysis for the pollution event in KM. AOD values decreased in KM and most parts of Yunnan Province on 2 April (Figure 6H).
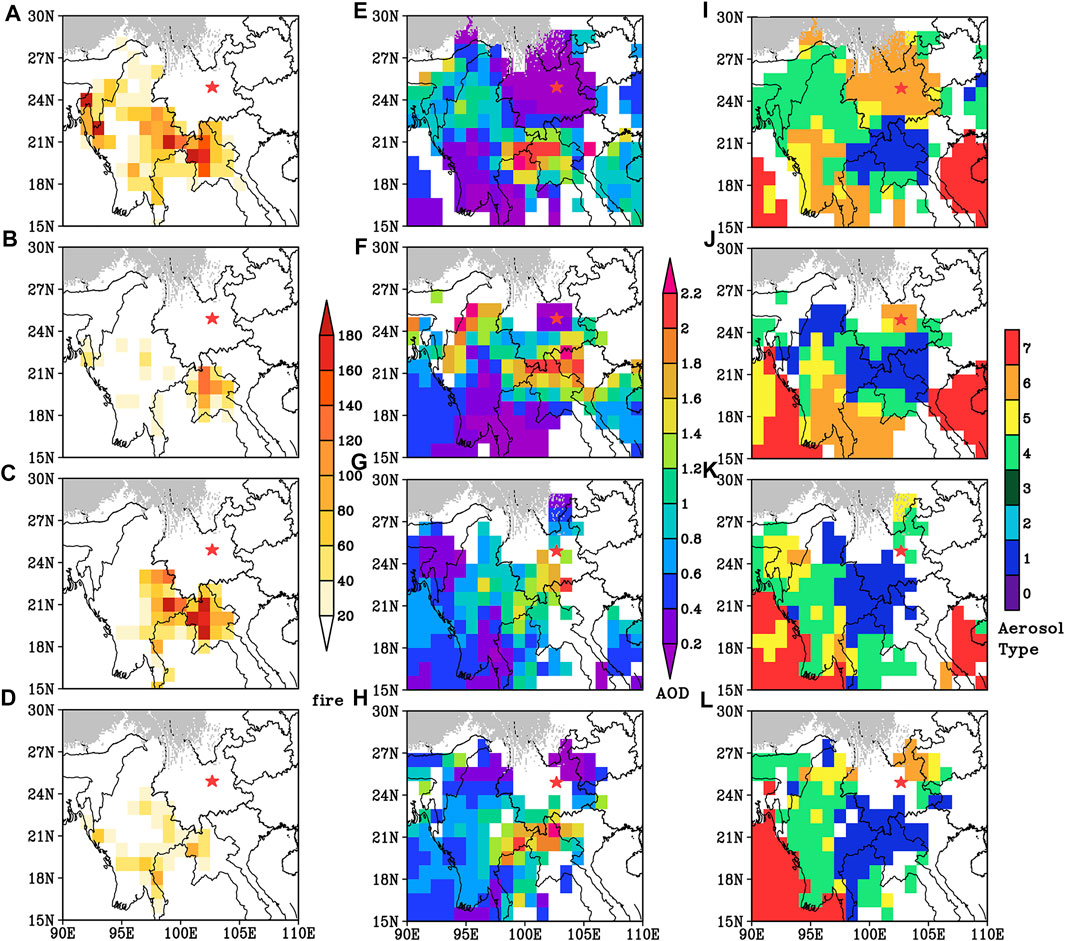
FIGURE 6. MODIS retrieved daily mean (A–D) fire spots, VIIRS retrieved daily mean (E–H) AOD and (I–L) aerosol type from 30 March 2019 to 2 April 2019, where 0 = dust (land + ocean), 1 = smoke, 2 = high altitude smoke, 3 = pyrocumulonimbus clouds, 4 = non-smoke fine mode, 5 = mixed (land + ocean), 6 = background (land + ocean maritime), and 7 = fine dominated. The red star denotes the location of Kunming (KM).
Biomass fires occurred in the northern Indochina Peninsula almost over the entire period of March-April 2019, but BB pollutants were not always transported into Yunnan Province during this period. There was a northwest wind in Myanmar before 29 March, and the fire plumes were transported to Thailand and downwind regions (Figures 7A, B). A shallow trough (the India-Myanmar trough) appeared around 90°E just to the west of Myanmar on 29 March and was strengthened and moved eastward on 30–31 March (Figures 7C, D). Although the trough line disappeared on 1 April, southwestern wind was strengthened under the compression of the South China Sea high pressure (Figure 7E). The occurrence of the trough changed the wind direction from northwest to the southwest over the fire regions and drove the pollutants to southwest China, which led to a remarkable enhancement of PM levels over most areas of Yunnan Province and the pollution event in KM on 1–2 April. The high pressure disappeared after 2 April, accompanied by reducing fire spots and weakening southwestern wind (Figure 7F).
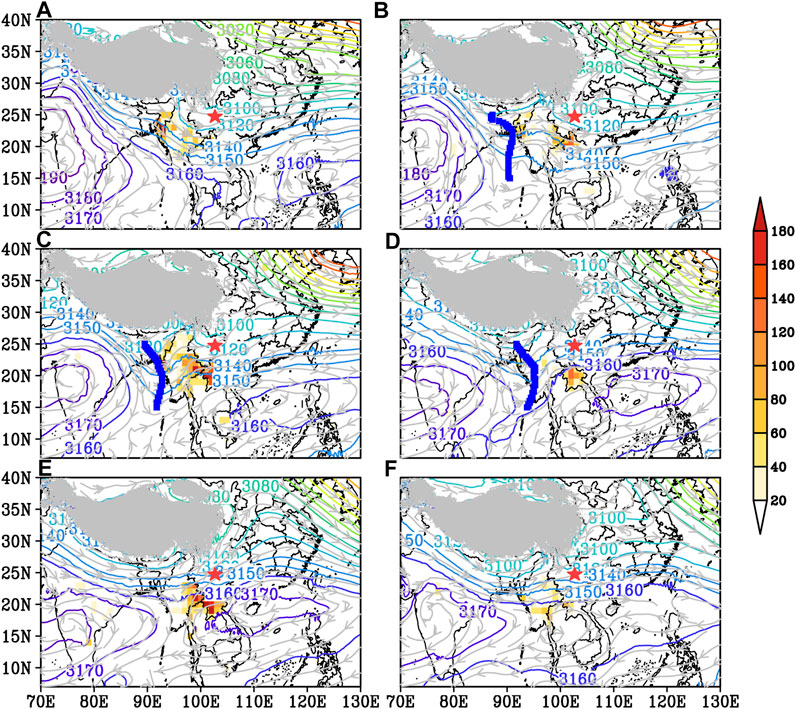
FIGURE 7. The daily means wind streamline and geopotential height (contour, gpm) at 700 hPa with ground fire counts (shaded) from 28 March to 2 April 2019 (A–F). The blue lines represent the location of the trough line and the red star denotes the location of Kunming (KM).
The PM2.5 gradually moved toward the northeast of Yunnan Province, accompanied by the development of the India-Myanmar trough. The daily mean PM2.5 concentrations exceeded 70 μg m−3 in southern Yunnan Province on 28–30 March due to the transport of BB plumes, whereas those in KM were less than 30 μg m−3 (Figures 8A–C). A southerly convergence zone formed in the vicinity of KM on 31 March, accompanied by the strengthening of the India-Myanmar trough (Figure 8D), which favored the accumulation of pollutants from BB and contributed to the PM increase, thus, the daily mean PM2.5 concentrations increased in the whole of Yunnan Province. The PM2.5 concentration exceeded 110 μg m−3 in southern Yunnan Province, whereas that in KM was larger than 50 μg m−3. The southerly further increased on 1 April, which contributed to the PM increase, with the daily PM2.5 concentration exceeding 80 μg m−3 in KM (Figure 8E). The southerly gradually decreased after the India-Myanmar trough disappeared on 2 April (Figure 8F), leading to an abrupt decrease in the PM level from 07:00 LST (Figure 3A).
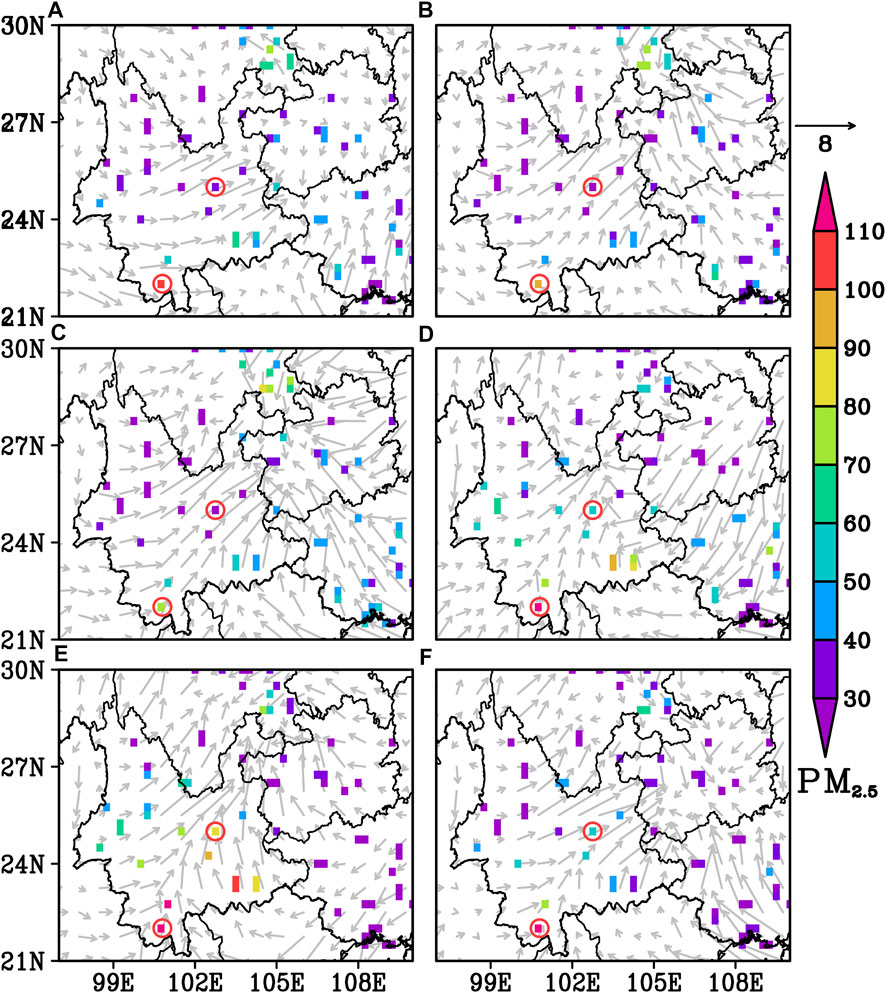
FIGURE 8. The daily means wind vectors (m s−1) and PM2.5 (μg m−3, fill color) concentrations near the surface in the Low-latitude Plateau from 28 March 2019 to 2 April 2019 (A–F). The red circles denote the location of Kunming (KM, Northeast) and Jinghong (JH, Southwest).
Along the southwest wind direction in front of the trough, the vertical profiles of daily mean meridional wind and the model simulated vertical profiles of daily mean PM2.5 concentrations produced by BB in Southeast Asia across JH and KM from 28 March to 2 April 2019 are shown in Figure 9. The deep southerly wind produced by the India-Myanmar trough favored the transmission of pollutants. When the India-Myanmar trough appeared just to the west of Myanmar on 29 March, the weak southerly layer appeared near the ground north of JH (Figure 9B1), and the PM2.5 produced by BB in Southeast Asia remained to the south of JH (Figure 9B2). When the India-Myanmar trough strengthened on 30–31 March, the southerly also strengthened (Figures 9C1, D1), and the PM2.5 had been transported from the border between Myanmar and Thailand to KM (Figures 9C2, D2). The southerly was most robust on 1 April, the maximum wind speed exceeded 8 m s−1 (Figure 9E1), and PM2.5 produced by BB in Southeast Asia spread furthest (Figure 9E2). The southerly decreased on 2 April (Figure 9F1), accompanied by the reduction of the transmission of PM2.5 (Figure 9F2).
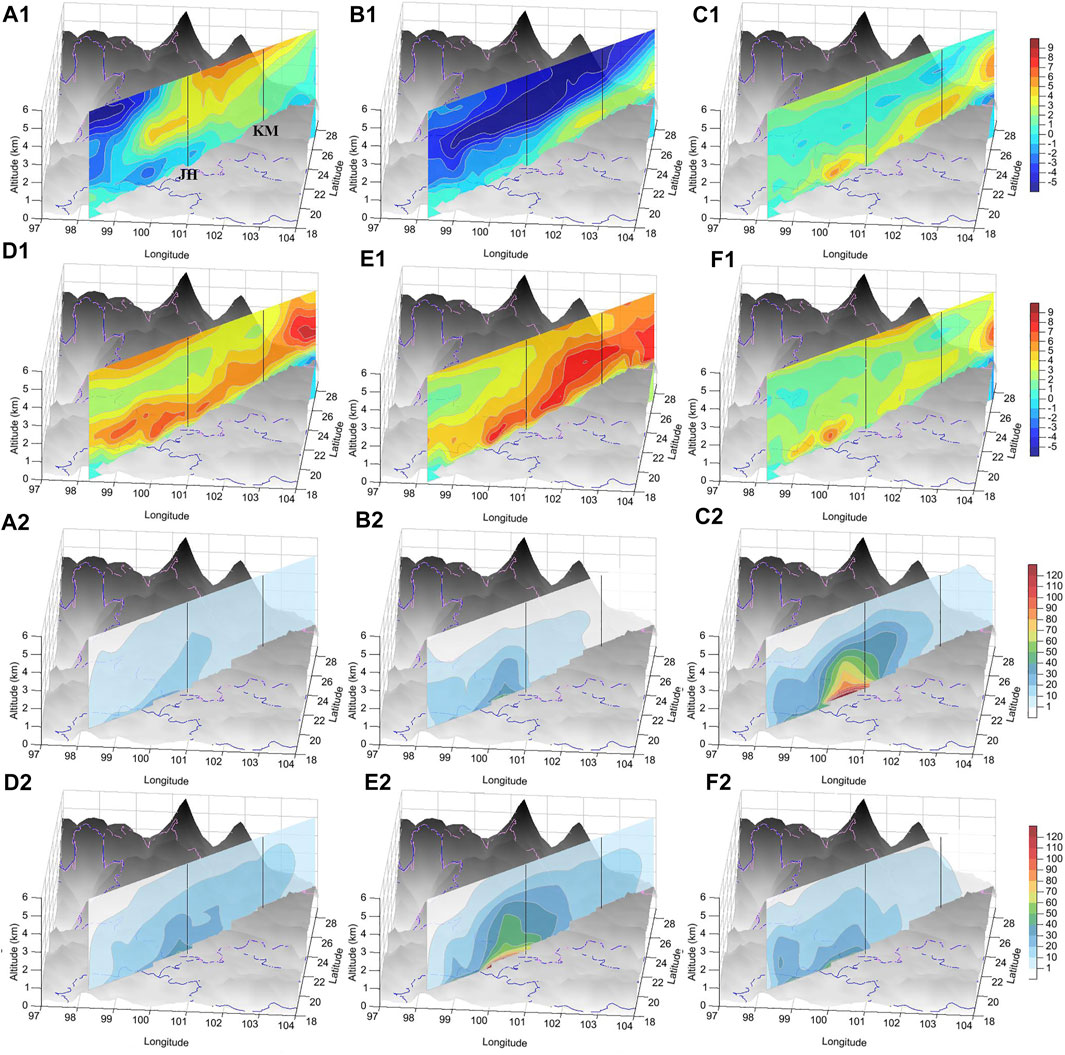
FIGURE 9. The vertical profiles of daily mean (A1–F1) Meridional wind (m s−1) and (A2–F2) the model simulated PM2.5 concentrations (μg m−3) produced by biomass burning in Southeast Asia across JH and KM from 28 March to 2 April 2019 (A–F). The black lines denote the location of Kunming (KM, Northeast) and Jinghong (JH, Southwest).
Model comparison against various observations demonstrated that the model could reasonably reproduce meteorological variables, and the model simulated air pollutants concentration generally agreed with observations. Table 2 presents the statistics between model simulations and observations in the four cities of Yunnan Province. The air temperature and relative humidity at 2 m were well reproduced, with correlation coefficients (COR) of 0.85–0.94 and 0.82–0.86, the normalized mean biases (NMB) of −11.7% ∼-1.3% and −34.9%–0.2%, respectively. The underestimation of RH2 in the JH could be due to more active and complex land-atmosphere interactions in the tropics. The model simulated wind speed and direction reasonably well in KM, with COR of 0.78 and a slight bias (<5%), but the model tended to predict higher wind speed in JH and lower wind speed in YX and PE, with NMBs of 54.8% and approximately −20%, respectively. Statistics for comparison between observations and the S1 simulations for air pollutants at these cities are also presented in Table 2. The performance statistics for PM2.5 were generally good, with the COR of 0.32–0.51 and the NMB of −36%∼−67.3%, respectively. The performance for trace gases (O3, NO2, and CO) was generally poorer than that for PM2.5, with COR of 0.13–0.58. In order to evaluate the simulation performance of PM2.5, the simulation results of 10 provinces in southern China other than Yunnan Province were also compared with the observations (not shown in Table 2), with the mean COR of 0.36 and the NMB of 11.7%, respectively, indicating that the simulation results of PM2.5 were approved.
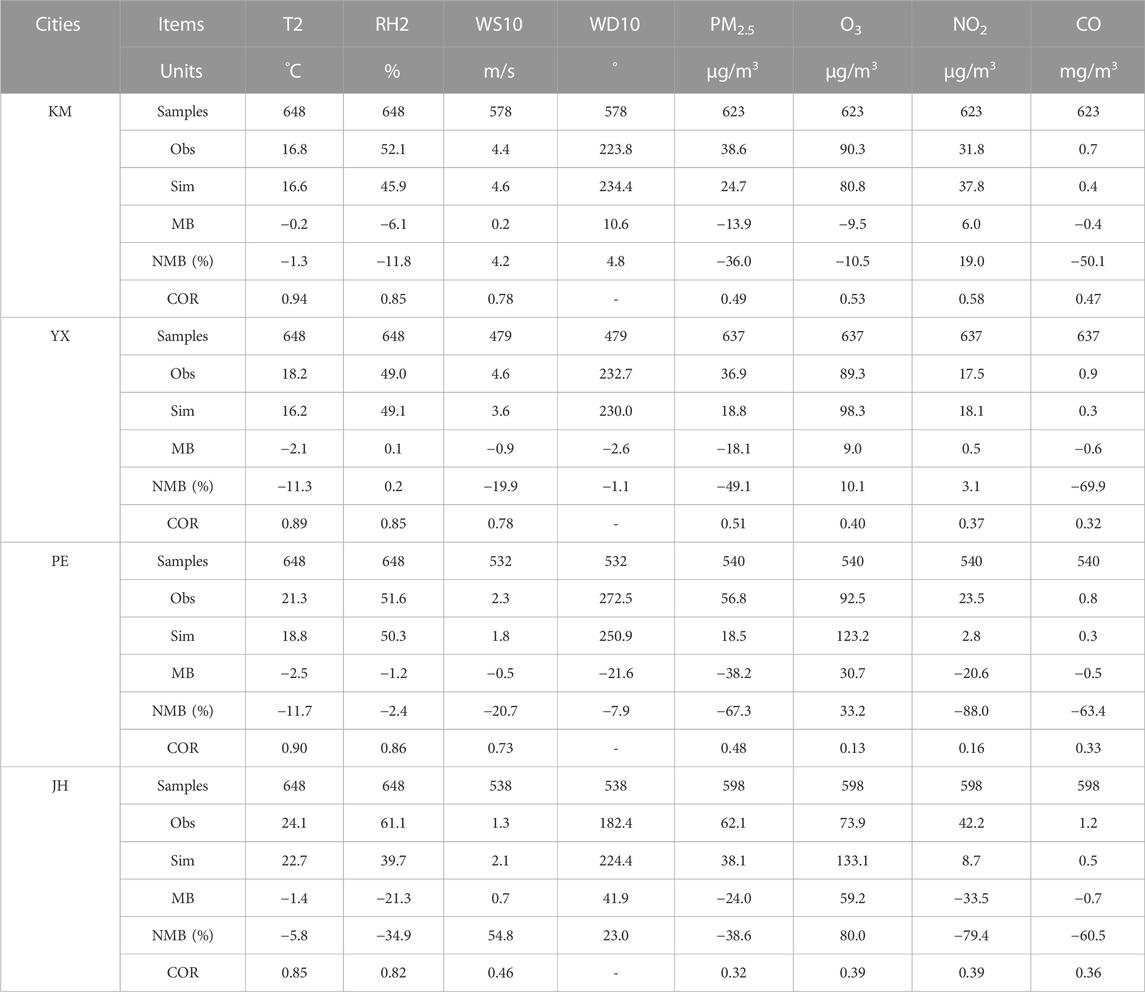
TABLE 2. Model performance statistics for meteorological variables and air pollutants in the 4 cities of Yunnan Province during the study period.
The underestimation of PM2.5 in Yunnan province could be associated with potential uncertainties in emission inventories, meteorological fields, heterogeneous chemistry (Zheng et al., 2015), the representatives of ground-based measurements, or the relatively coarser grid resolution. The possible underestimation of BB emissions in Southeast Asia and anthropogenic emissions in Yunnan province was one of the critical reasons for the underestimation of PM2.5. The simulation bias of PM2.5 would be significantly improved when the anthropogenic emission of Yunnan Province was doubled, with the NMB in a range of −50%–16.4%. The NMB and COR of the simulated mean concentration of PM2.5 in JH decreased from −38.6% to 1.6%, and from 0.32 to 0.23, respectively, when BB emissions from FINN were applied, which was due to the higher emission amount (about 3–5 times of that in GFED) and courser temporal resolution of FINN. While the simulation results of the cities farther from the border (KM, YX, and PE) had not been improved obviously by using BB emission from FINN, with main underestimation in peak concentrations during 31 March to 1 April when the transport pollution occurred, indicating that there could be possible simulated bias in the meteorological fields. It is worth noting that the WS10 of YX and PE was significantly underestimated, with NMB of −19.9% and −20.7%, respectively, thus the BB pollutants that should be transported here might not arrive totally, which also reasonably explained the occurrence of main underestimation during transport pollution episode. The underestimation of simulated PM2.5 could also be affected by meteorological fields through the heterogeneous chemistry. For example, the underestimation of PM2.5 in KM and JH might be due to the underprediction of RH2, with had a significant impact on the secondary formation of PM2.5 by heterogeneous reaction. In addition, ground-based measurements were mainly conducted in urban aeras and the observation results might be affected by the surrounding highways or catering, and the coarser resolution of the model could not reproduce this situation well.
The simulation results derived from GFED with finer temporal resolution were used for further analysis considering that a typical pollution event with short duration was mainly focused on in this study, and the simulation results derived from FINN were used to analyze the potential uncertainty of simulation results caused by emission differences among two BB inventories. Figure 10 presents the simulated daily mean near-surface PM2.5 concentrations (Figures 10A1–F1) and PM2.5 column concentrations in the troposphere (Figures 10A2–F2) produced by BB in Southeast Asia on 28–31 March and 1–2 April during the severe BB episode, which are derived from the simulation of Base run and S1 (S1 minus Base) by using GFED. It is noteworthy that the contributions of BB in Southeast Asia to the PM2.5 concentration in Yunnan Province were calculated using the difference between the two scenarios (the last paragraph of Section 2.2 for details), which effectively reduced the bias caused by the underprediction of aerosols. High concentrations persistently occurred over western Myanmar, the border between Myanmar and Thailand, and northern Laos, consistent with the location of BB emissions (Figure 1B), with the maximum daily mean PM2.5 concentration reaching 250 μg m−3. From 28 March to 31 March, the daily mean near-surface PM2.5 concentration in western Myanmar gradually decreased from >250 μg m−3 to <50 μg m−3, while the PM2.5 concentration in the Myanmar-Thailand border and northern Laos showed a trend of first increasing and then decreasing (Figures 10A1–D1). Afterward, another small peak appeared on 1 April and gradually dissipated on 2 April (Figures 10E1, F1). It should be noted that the near-surface PM2.5 concentrations in most areas of the low-latitude plateau in China (e.g., Yunnan Province) were slightly affected by the transboundary process on 29 March, when there was a northerly wind; the contribution of the transboundary process to the near-surface PM2.5 concentration in KM (red star located) was less than 1.0 μg m−3.
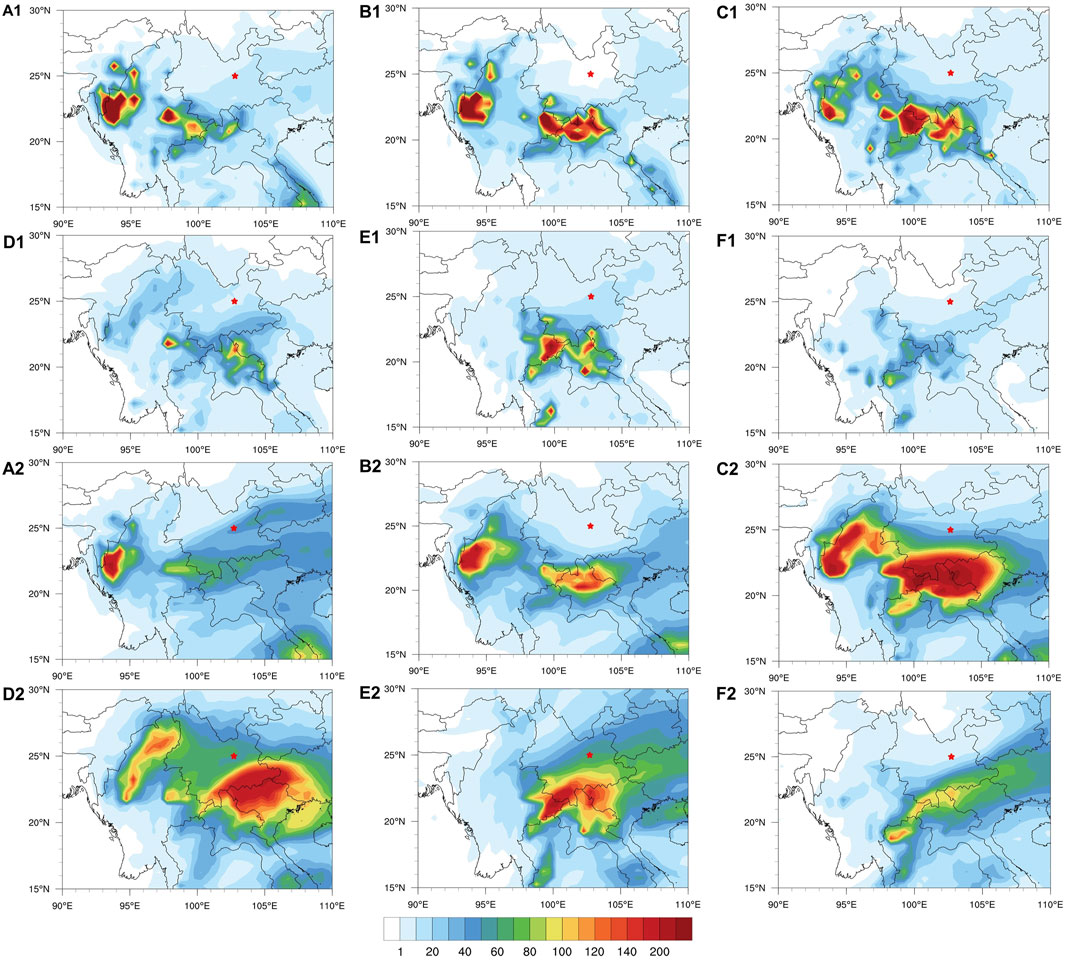
FIGURE 10. The model simulated daily mean (A1–F1) near surface PM2.5 concentrations (μg m−3) and (A2–F2) PM2.5 column concentrations (mg m−2) in the troposphere produced by biomass burning in Southeast Asia from 28 March to 2 April 2019 (A–F). The red stars denote the location of Kunming (KM).
The temporal variation of the daily mean PM2.5 column concentrations during this episode was similar to that of the near-surface PM2.5 concentrations, reaching a maximum value on 30 March and 31 March (Figure 10C2, D2) and then dissipating on 2 April (Figure 10F2). However, the spatial distribution of daily mean PM2.5 column concentrations significantly differed from near-surface PM2.5 concentrations. Before 29 March, PM2.5 was transported toward the east in westerly. The distribution of daily mean PM2.5 column concentrations was characterized by a southwest-northeast belt extending from the areas where BB occurred in Southeast Asia to southern China after 30 March (Figures 10C2–F2), caused by the deep southerly layer produced by the India-Myanmar trough, with the maximum concentration exceeding 250 mg m−2 on 30 March at the southern border of Yunnan Province. Although the near-surface PM2.5 concentrations decreased after 31 March, the high daily mean PM2.5 column concentrations remarkably expanded toward the northeast of Yunnan Province and even reached Guizhou Province (Figure 10D2). The PM2.5 column concentration in the troposphere in Yunnan Province was affected by the transboundary process of BB in Southeast Asia, with a maximum contribution of 150 mg m−2 during this episode, which indicated that a large part of air pollutants had been uplifted during the burning and then transported and diffused into China. It is noticed that the near surface concentration and tropospheric column concentration derived from FINN showed the same spatial distribution and temporal variation characteristics as those from GFED, except that the daily mean concentrations in source regions and its nearby regions (e.g., the southern border of Yunnan Province) were higher, with the maximum reaching 300 μg m−3 near the surface and 300 mg m−2 in the troposphere, respectively. This indicated that larger impacts on the air quality of Yunnan province would be produced by much higher BB emissions in Southeast Asia.
Figure 11 shows the simulated average contribution of BB in various regions of southeast Asia on mean near-surface PM2.5 concentrations and PM2.5 column concentrations in the troposphere during the severe BB episode from 28 March to 2 April 2019, which are derived from the differences between the two scenarios (the last paragraph of Section 2.2 for details) by using GFED. The aerosols in Regions 1 and 2 might be introduced from the western border and the southwestern border of Yunnan Province under the transmission of west and southwest winds. In contrast, the aerosols in Region 3 mainly affected aerosol concentrations in the southeastern border of Yunnan Province. The near-surface PM2.5 concentration of KM was rarely transferred from Region 1 (only 1–10 μg m−3). However, Region 1 contributed 15–20 mg m−2 of the PM2.5 column concentration in the troposphere in KM, which demonstrated that the transfer from Region 1 to Yunnan Province might have occurred at a higher altitude (Figure 11A). BB in Region 2 (Myanmar-Thailand border) had the most dominant impact on PM2.5 column concentration in the whole of Yunnan Province, contributing more than 100 mg m−2 to the PM2.5 column concentration in the southern border of Yunnan Province and it could be transported to Guizhou Province and Guangxi Province. However, Region 2 only contributed 1–10 μg m−3 to near-surface PM2.5 concentration in KM (Figure 11B). BB in Region 3 (northern Laos) had a dominant impact on PM2.5 column concentration in the southeastern border of Yunnan Province, and was further transported to Guangxi Province (Figure 11C). The contribution of other regions (OR) to near-surface and tropospheric column PM2.5 concentrations in Yunnan Province was almost negligible (Figure 11D). There was a negligible discrepancy in the mean PM2.5 concentration and spatial distribution near the surface over Yunnan Province between the simulation results from GFED and those from FINN except Region 3. The near surface PM2.5 concentration in Region 3 derived from FINN was much higher than that from GFED, with a maximum up to 300 μg m−3. Moreover, the BB in Region 1 contributed 20–25 mg m−2 to the tropospheric column concentration of KM, exceeding the contribution of Region 2, with almost constant contributions in Region 2, Region 3 and other regions to tropospheric column PM2.5 concentration in KM.
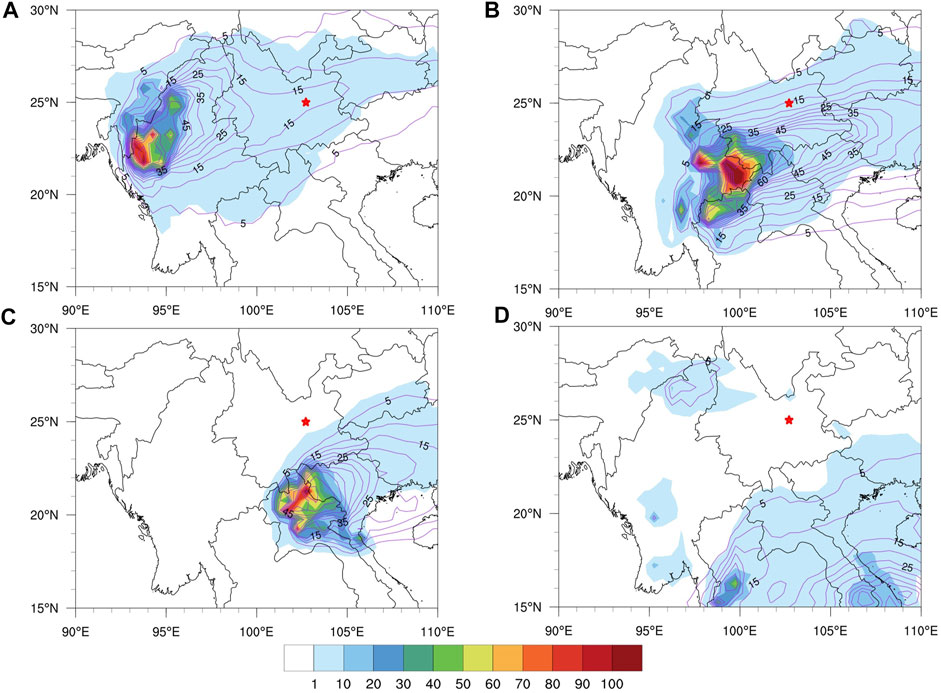
FIGURE 11. The model simulated mean near surface PM2.5 concentrations (μg m−3) (Fill color) and PM2.5 column concentrations (mg m−2) in the troposphere (Purple contour) produced by biomass burning in different regions of Southeast Asia during 28 March to 2 April 2019 (A): Region 1; (B): Region 2; (C): Region 3; (D): Other regions). The red stars denote the location of Kunming (KM).
The vertical distribution of PM2.5 from BB during the severe BB episode from 28 March to 2 April 2019 averaged over Yunnan province is exhibited in Figure 12, which are derived from the differences between the two scenarios (the last paragraph of Section 2.2 for details) by using GFED. The PM2.5 mass per unit height in Yunnan Province produced by BB in Southeast Asia gradually decreased from ∼5,000 kg to 0 kg from near surface to 10 km, in which the larger transmission mass was concentrated in the boundary layer below 4.1 km. The maximum transmission occurred in the layer of 0.9–2.1 km, contributing 30% of the total transmission mass in the troposphere due to the larger transmission mass per unit height (∼4,000 kg) and the larger thickness (1,200 m) of this layer. Consistently, The PM2.5 mass per unit height in Yunnan Province derived from FINN also showed a decreasing trend from near surface to 10 km, with the larger transmissi on mass concentrated in the boundary layer below 4.1 km. The PM2.5 mass per unit height reached ∼8,000 kg near surface, higher than that from GFED.
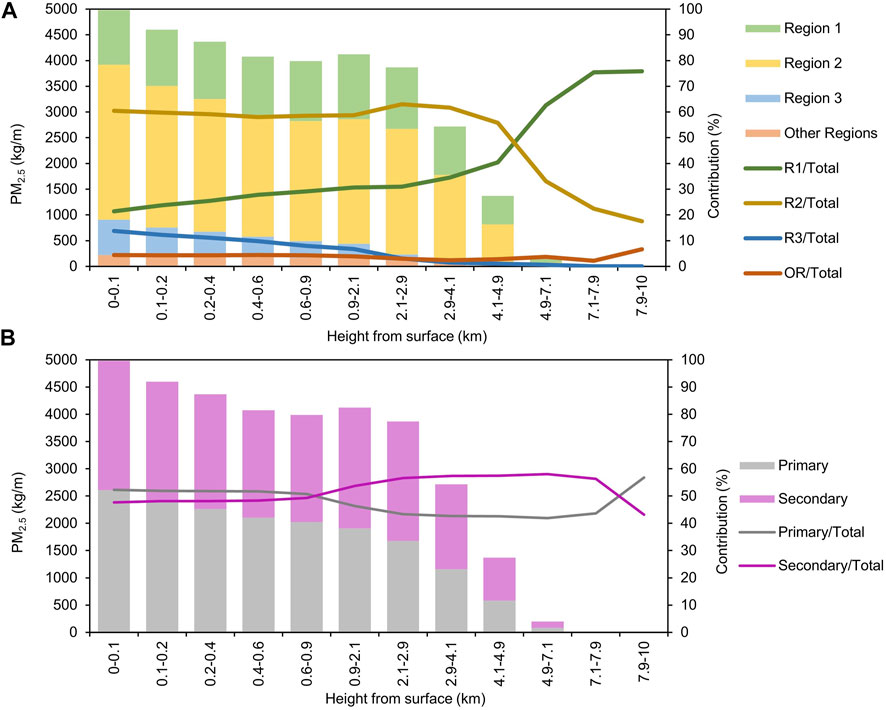
FIGURE 12. The mean per unit PM2.5 mass quality (kg/m) at different heights in Yunnan Province (A) from biomass burning in different regions [Region 1, 2, 3 (R1, R2, R3) and other regions (OR)] and (B) produced by primary emission and secondary formation of biomass burning in Southeast Asia during 28 March to 2 April 2019.
The PM2.5 mass per unit height of each vertical layer in Yunnan Province from different regions and pathways are further explored and identified. Figure 12A shows the relative contributions of individual regions to PM2.5 mass. The average contribution of Region 1, Region 2, Region 3, and other regions to the mean mass of PM2.5 in the entire 12 layers were 39.8%, 50.7%, 5.7%, and 3.8%, respectively. It is striking that the changes in the contributions of Region 1 from near surface to 10 km were opposite to those of Region 2. The larger contributions of Region 1 were concentrated in higher layers, and the larger contributions of Region 2 focused on lower layers. For example, the mean percentage contributions of Region 1 to PM2.5 mass were from 21.4% at the near-surface to 75.8% at the layer of 7.9–10 km, increasing with height. However, the contributions of Region 2 to PM2.5 mass decreased from 60.5% at the near-surface to 15.6% at the layer of 7.9–10 km, decreasing with height. Below 4.9 km, the PM2.5 in Yunnan Province was mainly sourced from Region 2, while above 4.9 km, Region 1 contributed the most of PM2.5 in Yunnan Province. Figure 12B shows the relative contributions of PM2.5 mass produced by primary emission and secondary formation of BB. The average contributions of primary emission and secondary formation to the mean mass of PM2.5 in the entire 12 layers were comparable, contributing 48% and 52%, respectively. Interestingly, the changes in the contribution of primary emission from near surface to 7.9 km were opposite to secondary formation. For example, the mean percentage contributions of PM2.5 mass produced by primary emission were larger than those of PM2.5 mass produced by secondary formation below 0.9 km. In comparison, the contributions of secondary formation exceeded those of primary emission in the layers from 0.9 to 7.9 km. It is also noticed that the contributions of Region 1 to PM2.5 from BB averaged over Yunnan province increased with the height, being opposite to those of Region 2 by suing FINN, which was consistent with the simulation results from GFED. The average contribution of Region 1, Region 2, Region 3, and other regions to the mean mass of PM2.5 in vertical layers were 35.2%, 44.0%, 18.5%, and 2.4%, respectively by using FINN. The contribution of Region 3 had increased significantly due to higher concentration near surface, while Region 2 was still the dominant contributor to the BB aerosols over Yunnan province. In addition, the simulation results presented a relatively higher contribution of PM2.5 mass produced from secondary formation by using FINN, with an average over Yunnan province of 68%.
Most air pollution events in spring observed in Yunnan Province could be associated with the transboundary transport of air pollutants from BB in South Asia and Southeast Asia (Yang, et al., 2020; Yin et al., 2021; Zhou et al., 2022). The percentages of days that mean PM2.5 concentrations exceeded the polluted level (75 μg m−3) during March–April of 2015–2019 were 6.7–18.7% for southwest cities (Dehong, Lincang, Puer, and Xishuangbannan) and 1.0–12.8% for the southeast cities (Honghe, Wenshan, and Yuxi) of Yunnan Province, respectively. Still, the mean PM2.5 concentrations in Kunming (KM), a city in the middle of Yunnan Province, reached the polluted level only for 3 days (Zhu, et al., 2022), which might be affected by the synoptic condition over Southeast Asia and low-latitude plateau in China. In this study, the impacts of BB over Southeast Asia on PM concentrations and aerosol properties in downwind regions of Yunnan Province in China in March-April 2019 were comprehensively investigated using an integrated data set from ground observations, satellite retrievals, reanalysis data, and model simulations. The results from this study demonstrate that the pollution event in KM at the end of March was mainly attributed to the long-range transport of BB pollutants from Southeast Asia.
During the pollution episode, the air quality of the entire Yunnan Province has significantly decreased due to the transboundary advection of BB pollutants from Southeast Asia. The daily mean PM2.5 concentrations significantly increased during 31 March to 2 April 2019, with the maximum approximately reaching 75 μg m−3 in Chenggong station of Yunnan University on 1 April. The daily mean PM2.5 concentrations in JH, PE, YX, and KM were 154.7, 119.2, 78.7, and 75.1 μg m−3, respectively, on 1 April, clearly showing a decrease in the concentrations from south to north Yunnan Province, consistent with the pollution transport characteristics. In addition, the occurrence of hourly PM2.5 maximum in four cities showed a time lag from south to north, reflecting an apparent regional transport characteristic. Besides, the satellite retrievals and analysis of back-trajectory further indicated a long-range transport of BB pollutants from Southeast Asia. It is worth noting that there was a severe pollution with hourly concentration of PM2.5 at 1:00 on 5 February 2019 (close to the period of this period) reached near 300 μg m−3 in JH (Yin et al., 2021), but the pollutants were not transported northward and affected the air quality of KM, which also proved that there were significant differences in transport process under specific atmospheric circulation conditions.
AOD increased remarkably on 30 March over vast areas of northern and eastern Myanmar, Laos, and northern Thailand, with the maximum AOD exceeding 2.2. The aerosol types over the fire regions were mainly characterized by smoke, corresponding well to the high AOD regions. The smoke plumes moved northward from 30 March to 1 April. The CALIPSO satellite retrieved extinction coefficient profiles showed an approximately 2 km vertically thick smoke layer at 1–4 km altitude extending from northern Thailand, crossing eastern Myanmar to southern Yunnan Province on 31 March, with the maximum extinction coefficient exceeding 2 km−1. The AOD near KM exceeded 1.6 on 1 April in this study, which was larger than the instantaneous values and temporal means (0.39 ± 0.20) observed by the Sun photometer in KM during March-April 2013 (Zhu, et al., 2017), and was also significantly larger than the Sun photometer measured mean AOD of 0.28 ± 0.15 from 2012 to 2013 and 0.49 ± 0.28 from 2014 to 2017 in KM reported by Xia et al. (2016) and Shao et al. (2021), respectively. Below 1 km, a high extinction coefficient larger than 2 km−1 abruptly appeared at the Chenggong station in the early morning of 1 April, and there could be a downward transport of aerosols from the altitudes of 1.5–3 km to the surface, suggesting the long-range transport coming from different paths occurred in upper levels and lower altitudes. The fire plumes were uplifted on the transport pathway to Yunnan Province due to the upward movement of air masses.
It is worth noting that the occurrence of this typical pollution event was a cooperated result of continuous emissions of BB in Southeast Asia and the India-Myanmar trough effect, which was closely related to the location and timing of BB emissions, the specific synoptic system of the low-latitude plateau, and the duration of the system, etc. From 2014 to 2021, there were only four events that the near surface PM2.5 concentrations in KM were exceeded 75 μg m−3 during BB season over Southeast Asia after the Airborne Pollution Action Plan was unveiled by China government in September 2013, and two of the four pollution events were contributed by the India-Myanmar trough, with the trough existed for more than 3 days. BB pollutants were mainly introduced from the southern border of Yunnan Province and transported deepest to the north under the effect of the India-Myanmar trough in this event, which is obviously different from other pollution events with BB pollutants introduced from the western border of Yunnan Province (Fu et al., 2012; Zhu et al., 2017; Xing et al., 2021). The deep southwest winds appeared in front of the trough over the fire regions after 30 March. The southerly wind was the most robust on 1 April, with the maximum wind speed exceeding 8 m s−1, which resulted in the PM2.5 produced by BB in Southeast Asia spread furthest, and the PM2.5 concentration of 10–20 μg m−3 appeared near 28° N.
According to the model simulations in this study, BB emissions have a significant contribution to the near-surface concentration of atmospheric pollutants in the source region and southern China, which is consistent with the latest modeling studies (Fu et al., 2012; Huang et al., 2013; Lin et al., 2014; Duc et al., 2016). For example, Khodmanee and Amnuaylojaroen (2021) investigated the impacts of biomass burning on the surface O3, CO, and NO2 over Northern Thailand in March 2014 using the Weather Research and Forecasting Model with Chemistry (WRF-Chem) and the results showed that BB increased O3, CO, and NO2 levels by 9%, 51%, and 96%, respectively. Xing et al. (2021) simulated a BB pollution event over Southeast Asia in March 2015 using WRF-Chem and indicated that BB emissions in southeast Asia increased near-surface PM2.5 concentrations by more than 40 μg m−3 in the source region and 39.3 μg m−3 (68.0%) in Yunnan Province. Most previous studies had paid much attention to near-surface concentrations of air pollutants from BB in Southeast Asia, while as discussed in the study of Xing et al. (2021), BB plumes could be lifted above the planetary boundary layer and transported to downwind areas along the westerly wind. Therefore, this study not only simulated and analyzed the spatial distribution characteristics of near-surface PM2.5 concentrations produced by BB, but also focused on the three-dimensional spatial distribution characteristics in the free troposphere, revealed the transboundary path of BB aerosols in vertical levels. In addition, the relative contributions of BB in different source regions (R1, R2, R3, and OR) to tropospheric aerosol concentrations of Yunnan Province were explored, and the proportions of tropospheric aerosols produced from primary emission and secondary formation were further identified, which are limited in previous studies.
The model results of this study show that 59.5% of PM2.5 mass produced by BB in Yunnan Province was sourced from the Myanmar-Thailand border, and 29.3% was from western Myanmar at a lower altitude (<4.9 km), which indicated that BB in the Myanmar-Thailand border was the dominant contributor. While western Myanmar contributed 71.3% of PM2.5 mass produced by BB in Yunnan Province, and the Myanmar-Thailand border contributed 24.3% at a higher altitude (>4.9 km). The deep southwest winds above the ground caused by the India-Myanmar trough drove BB plumes from the Myanmar-Thailand border northward into Yunnan Province, and the westerly winds in upper levels brought BB plumes from western Myanmar to Yunnan Province. The simulation results derived from FINN also showed that PM2.5 mass produced by BB sourced from the Myanmar-Thailand border contributed most to the total PM2.5 mass from BB in Southeast Asia. Furthermore, atmospheric chemical reactions played a vital role in the formation of aerosols; the average contribution of secondary formation to the mean mass of PM2.5 produced by BB in Yunnan Province was 52%, and this contribution would increase to 68% by using FINN for BB emission inputs.
The findings from this study represent a step towards understanding the mechanism of long-range transport of BB species from Southeast Asia to southwestern China. However, potential shortcomings and limitations still exist in this study, which will be addressed in the future, these are: 1) More fine model horizontal resolution and vertical layers should be selected in the future when calculation conditions are improved and high-resolution emission inventories are provided; 2) GFED and FINN have been widely used in modeling studies, but lacks the vertical distribution of emissions. In fact, the injection height of BB plumes could reach above the planetary boundary layer (Zhu et al., 2018), and a new BB emission injection height scheme should be adopted in further studies; 3) The present studies are focused on one typical case study, but the impact of BB in Southeast Asia may vary significantly due to the large variability in BB emissions and meteorological conditions. Therefore, further investigations with longer time need to be conducted to quantify the interannual variation of the impacts and to explore the interactions between BB and weather systems in the above regions.
The original contributions presented in the study are included in the article/Supplementary Material, further inquiries can be directed to the corresponding author.
WF: Investigation, formal analysis, validation, writing-original draft, JeL: Methodology, investigation, software, writing-review and editing, supervision, ZH: Methodology, investigation, Analysis, JW: Validation, analysis, SZ: Validation, analysis, CZ: validation, analysis, JaL: Software, analysis.
This study was supported by the National Natural Science Foundation of China (Nos. 41865001, 41861144017, and 41875178), the Jiangsu Collaborative Innovation Center for Climate Change and the Program for Key Laboratory at the University of Yunnan Province.
The authors declare that the research was conducted in the absence of any commercial or financial relationships that could be construed as a potential conflict of interest.
All claims expressed in this article are solely those of the authors and do not necessarily represent those of their affiliated organizations, or those of the publisher, the editors and the reviewers. Any product that may be evaluated in this article, or claim that may be made by its manufacturer, is not guaranteed or endorsed by the publisher.
Andreae, M. O., and Merlet, P. (2001). Emission of trace gases and aerosols from biomass burning. Glob. Biogeochem. Cy. 15 (4), 955–966. doi:10.1029/2000gb001382
Chan, C. Y., Wong, K. H., Li, Y. S., Chan, L. Y., and Zheng, X. D. (2006). The effects of Southeast Asia fire activities on tropospheric ozone, trace gases and aerosols at a remote site over the Tibetan Plateau of Southwest China. Tellus B Chem. Phys. Meteorology 58, 310–318. doi:10.1111/j.1600-0889.2006.00187.x
Crutzen, P. J., and Andreae, M. O. (1990). Biomass burning in the tropics: Impact on atmospheric chemistry and biogeochemical cycles. Science 250, 1669–1678. doi:10.1126/science.250.4988.1669
Deng, X. J., Tie, X. X., Zhou, X. J., Wu, D., Zhong, L., Tan, H., et al. (2008). Effects of Southeast Asia biomass burning on aerosols and ozone concentrations over the Pearl River Delta (PRD) region. Atmos. Environ. 42, 8493–8501. doi:10.1016/j.atmosenv.2008.08.013
Duc, H. N., Bang, H. Q., and Quang, N. X. (2016). Modelling and prediction of air pollutant transport during the 2014 biomass burning and forest fires in peninsular Southeast Asia. Environ. Monit. Assess. 188, 106. doi:10.1007/s10661-016-5106-9
Eck, T. F., Holben, B. N., Giles, D. M., Slutsker, I., Sinyuk, A., Schafer, J. S., et al. (2019). AERONET remotely sensed measurements and retrievals of biomass burning aerosol optical properties during the 2015 Indonesian burning season. J. Geophys. Res. Atmos. 124, 4722–4740. doi:10.1029/2018JD030182
Fu, J. S., Hsu, N. C., Gao, Y., Huang, K., Li, C., Lin, N.-H., et al. (2012). Evaluating the influences of biomass burning during 2006 BASE-ASIA: A regional chemical transport modeling. Atmos. Chem. Phys. 12, 3837–3855. doi:10.5194/acp-12-3837-2012
Han, Z. W., Ueda, H., Matsuda, K., Zhang, R. J., Arao, K., Kanai, Y., et al. (2004). Model study on particle size segregation and deposition during Asian dust events in March 2002. J. Geophys. Res. 109, D19205. doi:10.1029/2004jd004920
Han, Z., Zhang, R., Wang, Q. g., Wang, W., Cao, J., and Xu, J. (2008). Regional modeling of organic aerosols over China in summertime. J. Geophys. Res. 113, D11202. doi:10.1029/2007jd009436
Hsu, N. C., Lee, J., Sayer, A. M., Kim, W., Bettenhausen, C., and Tsay, S.-C. (2019). VIIRS deep blue aerosol products over land: Extending the EOS long-term aerosol data records. J. Geophys. Res. Atmos. 124, 4026–4053. doi:10.1029/2018jd029688
Huang, K., Fu, J. S., Hsu, N. C., Gao, Y., Dong, X., Tsay, S. C., et al. (2013). Impact assessment of biomass burning on air quality in Southeast and East Asia during BASE-ASIA. Atmos. Environ. 78 (7), 291–302. doi:10.1016/j.atmosenv.2012.03.048
Huang, K., Fu, J. S., Lin, N.-H., Wang, S.-H., Dong, X., and Wang, G. (2019). Superposition of gobi dust and SoutheastSoutheast Asian biomass burning: The effect of multisource long-range transport on aerosol optical properties and regional meteorology modification. J. Geophys. Res. Atmos. 124, 9464–9483. doi:10.1029/2018jd030241
Jung, J. S., Lyu, Y., Lee, M., Hwang, T., Hong, Y., Hong, J., et al. (2016). Impact of Siberian forest fires on the atmosphere over the Korean Peninsula during summer 2014. Atmos. Chem. Phys. 16, 6757–6770. doi:10.5194/acp-16-6757-2016
Khodmanee, S., and Amnuaylojaroen, T. (2021). Impact of biomass burning on ozone, carbon monoxide, and nitrogen dioxide in northern Thailand. Front. Environ. Sci. 9, 641877. doi:10.3389/fenvs.2021.641877
Lee, C.-T., Chuang, M.-T., Lin, N.-H., Wang, J.-L., Sheu, G.-R., Chang, S.-C., et al. (2011). The enhancement of PM2.5 mass and water-soluble ions of biosmoke transported from Southeast Asia over the Mountain Lulin site in Taiwan. Atmos. Environ. 45, 5784–5794. doi:10.1016/j.atmosenv.2011.07.020
Li, J., Han, Z., and Yao, X. (2018). A modeling study of the influence of sea salt on inorganic aerosol concentration, size distribution, and deposition in the Western Pacific Ocean. Atmos. Environ. 188, 157–173. doi:10.1016/j.atmosenv.2018.06.030
Li, M., Liu, H., Geng, G., Hong, C., Liu, F., Song, Y., et al. (2017a). Anthropogenic emission inventories in China: A review. Natl. Sci. Rev. 4, 834–866. doi:10.1093/nsr/nwx150
Li, M., Zhang, Q., Kurokawa, J., Woo, J. H., He, K. B., Lu, Z. F., et al. (2017b). Mix: A mosaic asian anthropogenic emission inventory under the international collaboration framework of the MICS-asia and HTAP. Atmos. Chem. Phys. 17, 935–963. doi:10.5194/acp-17-935-2017
Lin, C. Y., Zhao, C., Liu, X., Lin, N.-H., and Chen, W.-N. (2014). Modelling of long-range transport of Southeast Asia biomass-burning aerosols to Taiwan and their radiative forcings over East Asia. Tellus B Chem. Phys. Meteorology 66 (1), 23733. doi:10.3402/tellusb.v66.23733
Mafusire, G., Annegarn, H. J., Vakkari, V., Beukes, J. P., Josipovic, M., van Zyl, P. G., et al. (2016). Submicrometer aerosols and excess CO as tracers for biomass burning air mass transport over southern Africa. J. Geophys. Res. Atmos. 121 (10), 10, 262. doi:10.1002/2015JD023965
Myhre, G., Hoyle, C. R., Berglen, T. F., Johnson, B. T., and Haywood, J. M. (2008). Modeling of the solar radiative impact of biomass burning aerosols during the Dust and Biomass-burning Experiment (DABEX). J. Geophys. Res. Atmos. 113, D00C16. doi:10.1029/2008JD009857
Nie, W., Ding, A. J., Xie, Y. N., Xu, Z., Mao, H., Kerminen, V.-M., et al. (2015). Influence of biomass burning plumes on HONO chemistry in eastern China. Atmos. Chem. Phys. 15, 1147–1159. doi:10.5194/acp-15-1147-2015
Shao, P., Xin, J., Zhang, X., Gong, C., Ma, Y., Wang, Y., et al. (2021). Aerosol optical properties and their impacts on the co–occurrence of surface ozone and particulate matter in Kunming City, on the Yunnan–Guizhou Plateau of China. Atmos. Environ. 266, 105963. doi:10.1016/j.atmosres.2021.105963
Tosca, M. G., Randerson, J. T., Zender, C. S., Flanner, M. G., and Rasch, P. J. (2010). Do biomass burning aerosols intensify drought in equatorial Asia during El Nino? Atmos. Chem. Phys. 10, 3515–3528. doi:10.5194/acpd-9-23319-2009
van der Werf, G. R., Randerson, J. T., Giglio, L., van Leeuwen, T. T., Chen, Y., Rogers, B. M., et al. (2017). Global fire emissions estimates during 1997–2016. Earth Syst. Sci. Data. 9, 697–720. doi:10.5194/essd-9-697-2017
Wang, Y. G., Hopke, P. K., and Utell, M. J. (2011). Urban-scale spatial-temporal variability of black carbon and winter residential wood combustion particles. Aerosol Air Qual. Res. 11 (5), 473–481. doi:10.4209/aaqr.2011.01.0005
Wu, Y., Han, Y., Voulgarakis, A., Wang, T., Li, M., Wang, Y., et al. (2017). An agricultural biomass burning episode in eastern China: Transport, optical properties, and impacts on regional air quality. J. Geophys. Res. Atmos. 122, 2304–2324. doi:10.1002/2016JD025319
Xia, X., Che, H., Zhu, J., Chen, H., Cong, Z., Deng, X., et al. (2016). Ground–based remote sensing of aerosol climatology in China: Aerosol optical properties, direct radiative effect and its parameterization. Atmos. Environ. 124, 243–251. doi:10.1016/j.atmosenv.2015.05.071
Xing, L., Bei, N., Guo, J., Wang, Q., Liu, S., Han, Y., et al. (2021). Impacts of biomass burning in peninsular Southeast Asia on PM2.5 concentration and ozone formation in southern China during springtime: A case study. J. Geophys. Res. Atmos. 126, e2021JD034908. doi:10.1029/2021jd034908
Yan, P., Tang, J., Huang, J., Mao, J. T., Zhou, X. J., Liu, Q., et al. (2008). The measurement of aerosol optical properties at a rural site in Northern China. Atmos. Chem. Phys. (ACP) Discuss. (ACPD). 8, 2229–2242. doi:10.5194/acp-8-2229-2008
Yang, K., Teng, M., Luo, Y., Zhou, X., Zhang, M., Sun, W., et al. (2020). Human activities and the natural environment have induced changes in the PM2.5 concentrations in Yunnan Province, China, over the past 19 years. Environ. Pollut. 265, 114878. doi:10.1016/j.envpol.2020.114878
Yin, X., Kang, S., Rupakheti, M., de Foy, B., Li, P., Yang, J., et al. (2021). Influence of transboundary air pollution on air quality in southwestern China. Geosci. Front. 12 (6), 101239. doi:10.1016/j.gsf.2021.101239
Zhang, X., Hecobian, A., Zheng, M., Frank, N. H., and Weber, R. J. (2010). Biomass burning impact on PM2.5 over the southeastern US during 2007: Integrating chemically speciated FRM filter measurements, MODIS fire counts and PMF analysis. Atmos. Chem. Phys. 10, 6839–6853. doi:10.5194/acp-10-6839-2010
Zhang, Y., Fu, R., Yu, H., Dickinson, R. E., Juarez, R. N., Chin, M., et al. (2008). A regional climate model study of how biomass burning aerosol impacts land-atmosphere interactions over the Amazon. J. Geophys. Res. Atmos. 113, D14S15. doi:10.1029/2007JD009449
Zheng, B., Tong, D., Li, M., Liu, F., Hong, C., Geng, G., et al. (2018). Trends in China's anthropogenic emissions since 2010 as the consequence of clean air actions. Atmos. Chem. Phys. 18, 14095–14111. doi:10.5194/acp-18-14095-2018
Zheng, B., Zhang, Q., Zhang, Y., He, K. B., Wang, K., Zheng, G. J., et al. (2015). Heterogeneous chemistry: A mechanism missing in current models to explain secondary inorganic aerosol formation during the january 2013 haze episode in north China. Atmos. Chem. Phys. 15, 2031–2049. doi:10.5194/acp-15-2031-2015
Zheng, H., Kong, S., Chen, N., Fan, Z., Zhang, Y., Yao, L., et al. (2021). A method to dynamically constrain black carbon aerosol sources with online monitored potassium. npj Clim. Atmos. Sci. 4, 43. doi:10.1038/s41612-021-00200-y
Zhou, F., Yang, J., Wen, G., Ma, Y., Pan, H., Geng, H., et al. (2022). Estimating spatio-temporal variability of aerosol pollution in Yunnan Province, China. Atmos. Pollut. Res. 13 (6), 101450. doi:10.1016/j.apr.2022.101450
Zhu, J., Xia, X., Wang, J., Zhang, J., Wiedinmyer, C., Fisher, J. A., et al. (2017). Impact of Southeast Asian smoke on aerosol properties in Southwest China: First comparison of model simulations with satellite and ground observations. J. Geophys. Res. Atmos. 122, 3904–3919. doi:10.1002/2016JD025793
Zhu, J., Yue, X., Che, H., Xia, X., Lei, Y., Wang, J., et al. (2022). Contribution of fire emissions to PM2.5 and its transport mechanism over the Yungui Plateau, China during 2015–2019. J. Geophys. Res. Atmos. 127, e2022JD036734. doi:10.1029/2022JD036734
Keywords: biomass burning, pollutants, Southeast Asia, transboundary pathway, the India-Myanmar trough
Citation: Fan W, Li J, Han Z, Wu J, Zhang S, Zhang C and Li J (2023) Impacts of biomass burning in Southeast Asia on aerosols over the low-latitude plateau in China: An analysis of a typical pollution event. Front. Environ. Sci. 11:1101745. doi: 10.3389/fenvs.2023.1101745
Received: 18 November 2022; Accepted: 10 January 2023;
Published: 19 January 2023.
Edited by:
Lei Liu, Lanzhou University, ChinaReviewed by:
Junjun Deng, Tianjin University, ChinaCopyright © 2023 Fan, Li, Han, Wu, Zhang, Zhang and Li. This is an open-access article distributed under the terms of the Creative Commons Attribution License (CC BY). The use, distribution or reproduction in other forums is permitted, provided the original author(s) and the copyright owner(s) are credited and that the original publication in this journal is cited, in accordance with accepted academic practice. No use, distribution or reproduction is permitted which does not comply with these terms.
*Correspondence: Jie Li, bGlqaWUwODMwQHludS5lZHUuY24=
Disclaimer: All claims expressed in this article are solely those of the authors and do not necessarily represent those of their affiliated organizations, or those of the publisher, the editors and the reviewers. Any product that may be evaluated in this article or claim that may be made by its manufacturer is not guaranteed or endorsed by the publisher.
Research integrity at Frontiers
Learn more about the work of our research integrity team to safeguard the quality of each article we publish.