 Zeqiong Li
 Boqing Wu1
94% of researchers rate our articles as excellent or good
Learn more about the work of our research integrity team to safeguard the quality of each article we publish.
Find out more
ORIGINAL RESEARCH article
Front. Environ. Sci. , 31 March 2023
Sec. Environmental Economics and Management
Volume 11 - 2023 | https://doi.org/10.3389/fenvs.2023.1101736
The swift urbanization in China during the past two decades heightened the environmental pressure on cities from anthropogenic production and consumption beyond the regional capacity. The Sichuan Basin, situated in southwest China, faced severe air pollution as its unique topography as a basin surrounded by mountains caused frequent temperature inversion and trapped air pollutants. In this paper, we investigated the evolution of spatiotemporal patterns of particulate matter with diameter not greater than 2.5 µm (PM2.5) across eighteen cities in the Sichuan Basin. In addition, a spatial association network was characterized through social network analysis using China’s air monitoring data and relevant socioeconomic data. The results were as follows: (1) A significant reduction in PM2.5 emissions in the Sichuan Basin occurred from 2015 to 2020, but challenges remain: the number of cities with a PM2.5 annual concentration above 35.00 µg/m3 decreased from seventeen to six, and the annual concentration declined from 62.92 µg/m3 to 40.83 µg/m3 in Chengdu and from 55.08 µg/m3 to 32.67 µg/m3 in Chongqing. PM2.5 concentrations were the highest in the winter, around 1.50–2.00 times the annual concentration. (2) The PM2.5 overall network displayed significant spatial association with periodic changes implying that the inter city association strengthened , then weakened, and then strengthened again from 2015 to 2019 despite a sharp drop in the PM2.5 concentration. Network density remained at 0.29 between 2015 and 2019 but increased to 0.30 in 2017, efficiency increased from 0.72 to 0.80 and connectedness from 0.78 to 1.00. A “core edge” pattern explicitly presented that Chengdu and Chongqing were located at the center with degree of 94.40 and 82.35, respectively, while other cities marginalized less than 35.30. (3) The driving factors of network structure were explored by quadratic assignment procedure, which showed that enlarging the difference in gross domestic product gap between secondary and tertiary industries and urban population and narrowing the difference among urban ratio, the number of civilian vehicle and distance between cities efficiently promotes the PM2.5 spatial association in the Sichuan Basin. The dominant factors impacting the PM2.5 spatial and temporal differences were the gross domestic product gap between secondary and tertiary industries, urban population and the number of civilian vehicle identified by quadratic assignment procedure. A synergetic effect among these factors played an important role as the cities with annual concentration PM2.5 < 35.00 µg/m3 corresponded to those with a combination of relatively small value for these driving factors.
China has experienced swift urbanization during the past two decades, with the urban ratio climbing from 36.22% in 2000 to 63.89% in 2020, accompanied by a huge population influx into cities (National Bureau of Statistics of China, 2001, 2021). This has heightened the environmental pressure on cities from anthropogenic production and consumption beyond the regional capacity. Air pollution has been recognized as one of the most critical threats to human health as no one is able to escape from the risks posed by severe haze episodes (Yin et al., 2017; Zhang et al., 2022). In 2019, it was the fourth-leading cause of early death throughout the world and strong attention has been focused on three pollutants in particular: PM2.5, ground-level ozone and indoor fine particulate matter. In the same year, over 90% of the population was exposed to PM2.5 concentrations greater than 10.00 μg/m3 annually, while 51.00% of the population experienced even worse conditions, with PM2.5 concentrations exceeding 35.00 μg/m3, the standard and interim target-1 level in the World Health Organization (WHO) guidelines. Approximately 6.67 million deaths were ascribed to diseases linked to air pollution worldwide in 2019, of which 4.14 million were specifically related to PM2.5 pollution. In China, around 1.85 million deaths were associated with air pollution and 1.42 million deaths with PM2.5 pollution (Song et al., 2017; Health Effects Institute, 2020). The WHO tightened the standard from the previous 10.00 to 5.00 μg/m3 in 2021 (WHO, 2006; WHO, 2021). In China, Ambient Air Quality Standards (AAQS, GB3095-2012) were upgraded by including standards for PM2.5: 15.00 μg/m3 (annual Grade-I), 35.00 μg/m3 (annual Grade-II and daily Grade-I) and 75.00 μg/m3 (daily Grade-II) in 2012. This came into implementation in 2016, but PM2.5 monitoring data for major cities have been available publicly since 2015 (Ministry of Environmental Protection of China, 2012). Therefore, a study on PM2.5 emissions and control in the context of the Sichuan Basin’s (SCB’s) rapid socioeconomic development is of great significance.
Normally PM2.5 samples are taken across different seasons at a certain location, such as Chengdu, Lanzhou, Nanjing, Tianjin, Shenzhen, Beijing Chongqing, and Hangzhou. Further analysis found that inorganic ions and organic carbon dissolving in water, microelements, carbonaceous species, and certain aromatic hydrocarbons were the main components of PM2.5 samples. A positive matrix factorization model was employed to explore whether road dust, coal combustion, power plants, secondary aerosol and sulfate, vehicle emissions, iron-steel industry, biomass burning and crustal dust were the sources. PM2.5 emissions were extremely severe in winter (Gu et al., 2011; Liu G et al., 2015; Li L et al., 2017; Tan et al., 2017; Kong et al., 2020).
Regional studies of the main megacity cluster in China have highlighted similar topics, with consideration of transportation on PM2.5 emission between cities. In the Yangtze River Delta region, the main components of PM2.5 were sulfate, nitrate, organic matter, and ammonium, originating from biomass burning and vehicle emissions. PM2.5 pollution was exacerbated by adverse meteorology (Hua et al., 2015). In the Beijing-Tianjing-Hebei megacity cluster, extreme haze events were driven by local emissions from Beijing and Hebei, whereas in Tianjin, external transport was the predominant source (Li J et al., 2017). In this region, the spatial association of PM2.5 pollution was studied using Pearson’s correlation coefficient (An et al., 2020). In the Pearl River Delta region, ionic species were a major PM2.5 component, accounting for 53.30% in winter and 39.40% in summer. Source apportionment identified industrial sources as the largest contributors while nitrate and ammonium ion mainly originated from agricultural emissions. Strong seasonal fluctuation in chemical composition was also found, with higher concentrations of ionic species occurring in the winter (Lai et al., 2007; Huang et al., 2018; Hou et al., 2019). The SCB is situated in southwest China; its unique topography as a basin surrounded by mountains causes frequent temperature inversion and traps air pollutants, inducing severe pollution in the winter (Zhang et al., 2012; Tao et al., 2013; Chen et al., 2014). Regional stagnant meteorology tended to prevent the particles from dispersing. Crustal elements were the predominant natural source of PM2.5 whereas anthropogenic activities contributed heavily to other ion species (Feng et al., 2020; Qiao et al., 2019). In south SCB, high PM2.5 concentrations were found (Ning et al., 2018; Fan et al., 2020). Previous studies have attempted to find out how PM2.5 spatial variation is impacted by human activities and natural conditions in Chinese cities using global regression models, the drivers of air pollution in Sichuan province by structural decomposition method and the economic agglomeration impact on PM2.5 pollution by output density model and spatial Durbin model in the Yellow River region (Liu et al., 2018; Wang et al., 2022).
It is noteworthy the primary concerns regarding PM2.5 study have shifted from individual cities to regional scales. But they mainly focused on the chemical characteristics and composition, source apportionment, and seasonal and regional fluctuations in PM2.5 pollution. However few studies have investigated the overall PM2.5 spatial association, relationship between cities and evolution as well as its drivers in SCB by social network analysis. An investigation in this field is essential to understand its formation and inform effective mitigation measures.
Here, the concentration of PM2.5 from 2015 to 2020 and the statistical data for anthropogenic activities from 2015 to 2019 were collected to reveal trends in PM2.5 concentrations and its spatial association network in SCB through social network analysis (SNA) using a gravity model with the following objectives: The PM2.5 spatiotemporal evolution was visualized using ArcGIS. Its spatial association network was studied at the regional scale in SCB using a modified gravity model, with the characterization of overall network and each individual node by SNA. An intuitive spatial association network with a core-edge pattern was observed and the evolution displayed. Its driving factors were further investigated using the quadratic assignment procedure (QAP) method, which can generate realistic results due to its ability to deal with multicollinearity between independent variables. The root causes behind the driving factors are discussed and further regional-scale mitigation proposals are suggested herein; a clean industrial chain by life cycle assessment and an environmentally friendly ideology for lifestyle are expected from production and consumption in future development.
In SNA, the social agent, considered as a node in the social network, is an individual, company, organization, city or country and the connections between the nodes, edges, form the whole network structure. Originally used in sociology (Wasseman and Faust, 1994; Luo, 2005; Scott, J., 2007), SNA has been progressively applied to management, politics, geography, economics, physics (Liu, 2019), and environments (Song et al., 2019; An et al., 2020). The SCB includes eighteen cities with huge population and swift industrialization (Figure 1). It ranks as one of the most severely polluted regions in China due to its basin topography surrounded by high mountains and anthropogenic emission (Zhang et al., 2012). Therefore, the eighteen cities in SCB can be considered as nodes and the interactions between them as the edges in the study of the PM2.5 spatial association, together with the driving factors.
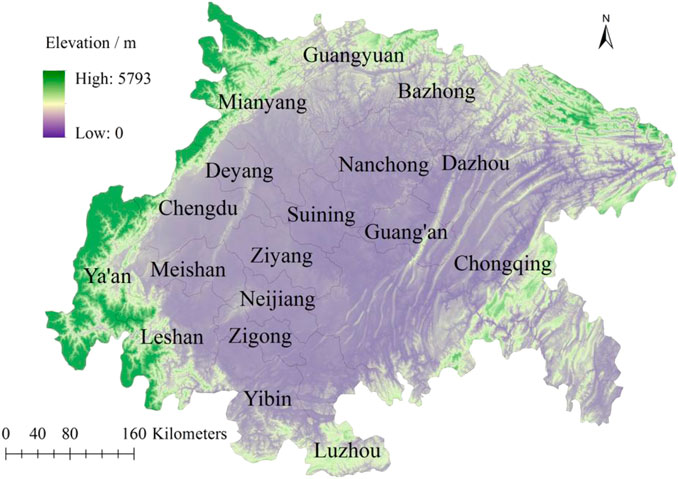
FIGURE 1. Location of eighteen cities in the SCB.
The PM2.5 spatiotemporal evolution in SCB from 2015 to 2020, including the annual average concentration and peak monthly average concentration in December and January, was visualized using ArcGIS. The PM2.5 spatial association network was studied by considering each individual city as a node and inter-city PM2.5 circulation as an edge. Firstly, a spatial correlation matrix should be established. In the gravity model the mutual interaction between cities is proportional to the target parameter but inversely proportional to the distance. It is widely used to construct the spatial correlation matrix and further to evaluate the relationship. This gravity model was shown in Eq. 1 and here the target parameter is PM2.5 concentration in the city (Kuik et al., 2019; Bai et al., 2020; Wang et al., 2020).
Yij: the gravitation between two cities; Mi: the mass (PM2.5 annual average concentration) of city i; Mj: the mass (PM2.5 annual average concentration) of city j; Dij: the distance between two cities; Ci and Cj: PM2.5 annual average concentration of city i and city j; Kij: the empirical constant as Eq. 2; b: the distance attenuation coefficient and considered as 1 here.
Normally, the gravity model was extended by including the relevant elements on the target parameter, which was helpful to make a comprehensive evaluation on the relationship. Therefore, the “mass” of PM2.5 concentration was modified according to the source appointment of PM2.5 in Chongqing and Chengdu. The major components are mainly from coal combustion, vehicle emissions, industrial pollution, and soil dust (Chen et al., 2017; Kong et al., 2020). Based on the modified gravity model in previous research and considering the availability of raw data for each individual city, the following parameters were integrated: urban population (Pi), land area of urbanized area (Li); the number of civilian vehicle (Vi), gross domestic production from secondary industry (Si), and gross domestic production from tertiary industry (Ti). These variables were converted to a comparable order of magnitude as PM2.5 concentration by geometric mean; the square root of the obtained value and PM2.5 concentration was taken as Mi in Eq. 1 producing the modified gravity model in Eq. 3.
A gravity matrix with i rows and j columns was obtained from Eq. 3. It was dichotomized by comparing individual gravity values with the average gravity value of the matrix; if greater than the average, a value of 1 was assigned, indicating strong association between the cities, otherwise a value of 0 was assigned (Liu H et al., 2015; Su and Yu, 2019; Wang et al., 2020). The spatial association was visualized, and the characteristic parameters of the overall network structure and each individual city were assessed using SNA and Ucinet. The QAP method was applied to study the driving factors, without considering the direction of the spatial association, as this paper studies its formation and evolution, following Bai et al. (2020).
The overall network of PM2.5 was evaluated with the parameters network density (D), connectedness (C), and efficiency (GE), as formulated in Eqs. 4–6. A higher network density and connectedness, but lower efficiency implies more connections between nodes, fine accessibility, and fewer isolated nodes (Wasserman and Faust, 1994; Barnett, 2011).
Network density (D) expresses the closeness of nodes and is calculated using the actual number of associations (L) and the maximum potential number of associations (N(N-1)) in the network, as given in the following formula, where N is the number of nodes. It represents the cohesion and tightness of nodes in the network, bounding between 0 and 1. Higher density means the mutual and close dependence among the nodes in the network (Qian et al., 2018).
Network connectedness (C) measures the accessibility between nodes and the stability of the overall structure, as given in the following formula, where (V) is the number of mutually unreachable point pairs and (N) is the number of nodes: It reveals the robustness of the overall network structure, with higher value for close connection with each other in the network (Liu, 2019).
Network efficiency measures the connection efficiency and the degree of redundant edges in the network and is calculated using the number of redundant edges (M) and maximum number of redundant edges (max (M)). The more redundant connections there are, the more inefficient the network is (Qian et al., 2018).
Three parameters were employed to study node behavior in the network and relevant calculation in Eqs. 7–9, (Freeman, 1979).
Nodes with higher degree centrality (DC) have more direct ties with others, greater power, and a more central position in the network (Bai, et al., 2020). The relative degree was calculated using the number of direct associations of the nodes (n) and the number of nodes in the network (N) as follows:
Betweenness centrality (BC) measures the “bridge” function for a node in the network (Liu, 2019). It is defined by how many shortcuts exist between two nodes, considering the number of shortcuts cross node i as follows: gjk(i) is the number of shortest paths connecting node j and node k through node i; gjk is the total number of shortest paths connecting node j and node k, N is the number of the node. It can reflect the intermediary role played by a node in the network.
Closeness centrality (CC) measures whether a node is controlled by others or not and is defined as the shortest length between two nodes (dij) in the following equation, N is the number of the node (Song et al., 2019). It shows how quickly a node reaches all the other nodes in the network and the central nodes not easily affected by others are normally with higher value.
The driving factors of the network were investigated by QAP, which is a non-parametric method, and the multicollinearity problem among multiple independent variables were avoided with the following operations (Song et al., 2019; Bai et al., 2020): firstly, the correlation coefficient was checked by QAP correlation analysis between one independent matrix and one dependent matrix by randomly permuting the data. The relationship between one dependent matrix and multiple independent matrices was explored by QAP regression analysis. The driving factors promoting the network were identified from the independent matrix with the coefficient falling into the accepted region.
PM2.5 concentrations in SCB were obtained from 125 monitoring stations in the eighteen cities from China National Environmental Monitoring Centre (http://www.cnemc.cn), China Urban Statistical Yearbook (National Bureau of Statistics of China, 2016–2021) and an air quality on-line monitoring platform (https://www.aqistudy.cn/). These data were compared with the annual mean PM2.5 concentration data extracted from the gridded global surface PM2.5 concentration dataset on the basis of aerosol optical depth retrievals from the NASA MODIS, MISR, and SeaWIFS instruments as well as subsequent calibration by Atmospheric Composition Analysis Group, Washington University in St. Louis (https://sites.wustl.edu/acag/datasets/surface-pm2-5/). The correlation coefficient were greater than 0.85 for seventeen cities except Guanyuan. Guangyuan exhibited the lowest PM2.5 from 2015 to 2020 in the SCB: 22.00-27.97 μg/m3 from above datasets and 22.00-28.08 μg/m3 from monitoring stations, with the maximum difference of 5.97 μg/m3 from the two origins. Meanwhile, most data from monitoring stations were greater than those from datasets. Therefore, the monitoring data from the stations were used in the study. The straight-line distance between cities was determined using ArcGIS. The socioeconomic data were derived from Sichuan Statistical Yearbook (Sichuan Provincial Bureau of Statistics, 2016-2020) and Chongqing Statistical Yearbook (Chongqing Bureau of Statistics, 2016-2020). These data were substituted into the modified gravity model in Eq. 3 to construct the dependent matrix. The difference of socioeconomic data between cities was used to build the independent matrix.
The annual average concentration of PM2.5 in eighteen cities in SCB from 2015 to 2020 is displayed in Figure 2, with the subdivided range referring to the China Ambient Air Quality Standard: 15.00 μg/m3 for annual grade I, 35.00 μg/m3 for annual grade II and daily grade I, and 75.00 μg/m3 for daily grade II in national standard GB 3095-2012.
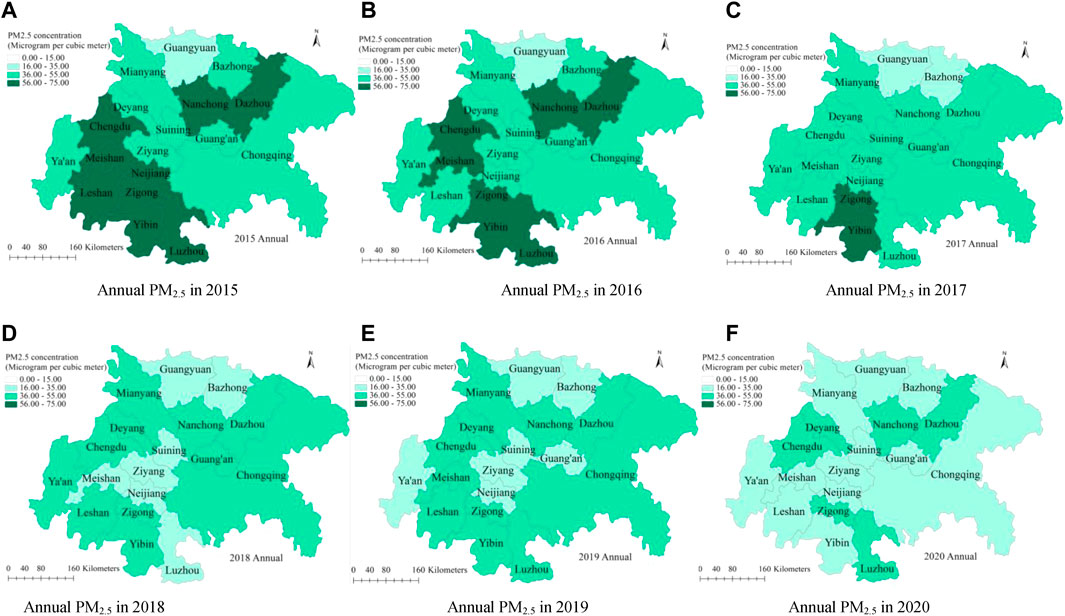
FIGURE 2. PM2.5 annual concentration in SCB 2015-2020. (A) Annual PM2.5 in 2015 (B) Annual PM2.5 in 2016 (C) Annual PM2.5 in 2017 (D) Annual PM2.5 in 2018 (E) Annual PM2.5 in 2019 (F) Annual PM2.5 in 2020.
In 2015, only one city, Guangyuan, located in the northernmost part of SCB had a PM2.5 concentration below 35.00 μg/m3, while eight cities including Chongqing in the central belt from northwest to southeast had PM2.5 concentrations between 36.00 and 55.00 μg/m3. The PM2.5 concentrations in seven cities including Chengdu in the southwest and Nanchong and Dazhou in the north were higher, ranging 56.00–75.00 μg/m3. This most polluted area in the southwest is enclosed among the edge of SCB and two megacities: Chengdu and Chongqing. Gradual improvement occurred from 2015 to 2020; heavy PM2.5 pollution (56.00–75.00 μg/m3) was eliminated and twelve cities reduced their annual concentration to below 35.00 μg/m3. Notably, PM2.5 concentrations decreased from 62.92 to 40.83 μg/m3 in Chengdu and from 55.08 μg/m3 to 32.67 µg/m3 in Chongqing. Unfortunately, PM2.5 exceeded 35.00 μg/m3 in six cities including Chengdu, and no city had levels below than 15.00 μg/m3 in any of the years.
Severe PM2.5 pollution occurred in the winter, particularly in December and January. The spatial pattern of monthly PM2.5 concentrations from 2015 to 2020 was visualized on the basis of the daily concentration standard 35.00 μg/m3 and 75.00 μg/m3 (Figure 3). In 2015, the highest monthly PM2.5 concentration (116.00–155.00 μg/m3) was in the southwest of SCB and the lowest was in Guangyuan, partly consistent with the distribution of annual concentration in Figure 2. However, Guang’an listed as the most polluted city in Figure 3 did not exhibit the highest annual concentration. In 2015, PM2.5 levels were greater than 75.00 μg/m3 in fifteen cities, whereas only one city exceeded this level in 2020. No city achieved concentrations less than 35.00 μg/m3 in any of the years. These monthly concentrations were around 1.50–2.00 times the annual concentration. Figure 4 shows this remarkable gap, with a similarly global decrease, which increases in certain years as annual concentration. The maximum concentration (annual from 73.58 to 43.17 μg/m3; monthly from 136.00 to 77.00 μg/m3) and minimum concentration (annual from 28.08 to 22.00 μg/m3; monthly from 55.00 to 38.00 μg/m3) are plotted in Figure 5. The number of days experiencing PM2.5 levels greater than 75.00 μg/m3 was the highest in December and January across all cities (Figure 5) and declined dramatically but with increases in 2017 and 2019. PM2.5 pollution in the winter is the key factor that must be addressed to mitigate the impact comprehensively and adequate attention should be paid to emissions rebounds following reductions. Spatial heterogeneity has been smoothed since 2015.
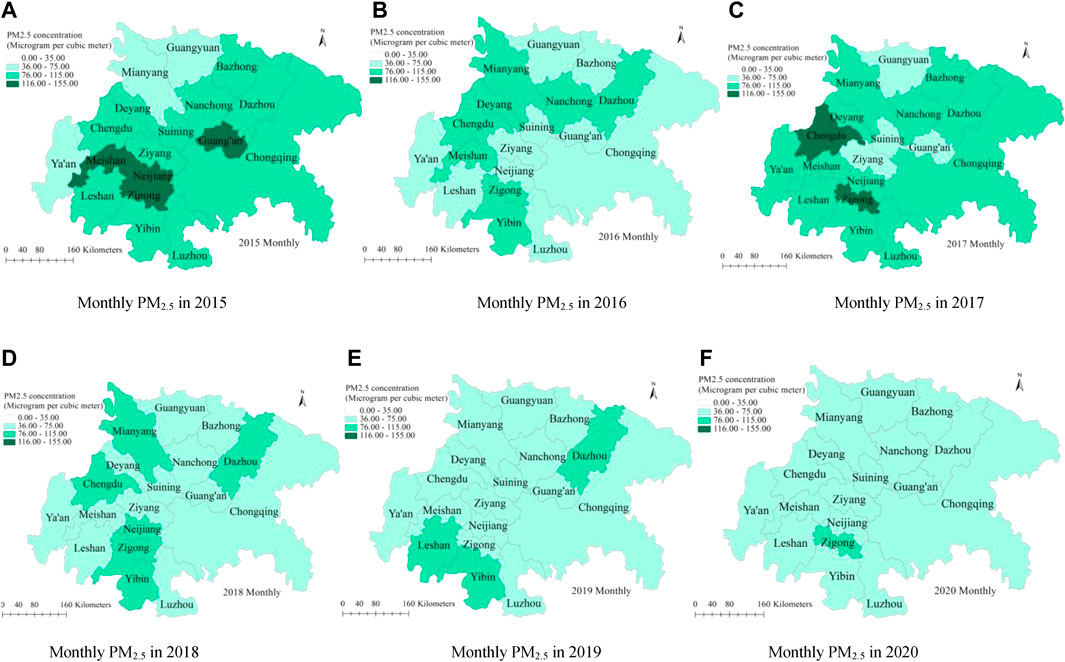
FIGURE 3. PM2.5 peak monthly concentration (December and January) in SCB 2015-2020. (A) Monthly PM2.5 in 2015 (B) Monthly PM2.5 in 2016 (C) Monthly PM2.5 in 2017 (D) Monthly PM2.5 in 2018 (E) Monthly PM2.5 in 2019 (F) Monthly PM2.5 in 2020.
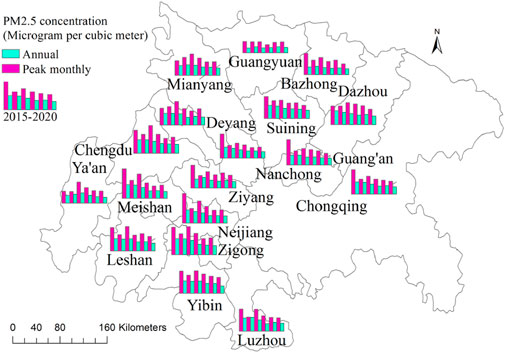
FIGURE 4. PM2.5 concentration gap 2015-2020.
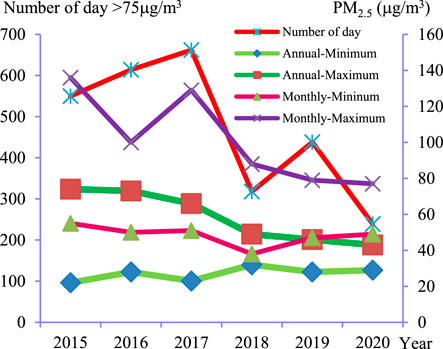
FIGURE 5. PM2.5 maximum and minimum 2015-2020.
The relation matrix was established by the modified gravity model in Eq. 3, and the corresponding visualized spatial association network structure was drawn intuitively using NetDraw in the Ucinet software in Figure 6 for the PM2.5 pollution in SCB in 2015 and 2019. A formed spatial network structure is observed and it changes slightly with Bazhong and Guangyuan no more isolated in 2019. Chengdu and Chongqing take the center with powerful strength in the network while Ya’an, Bazhong and Guangyuan are poorly connected with others and are explicitly marginalized.
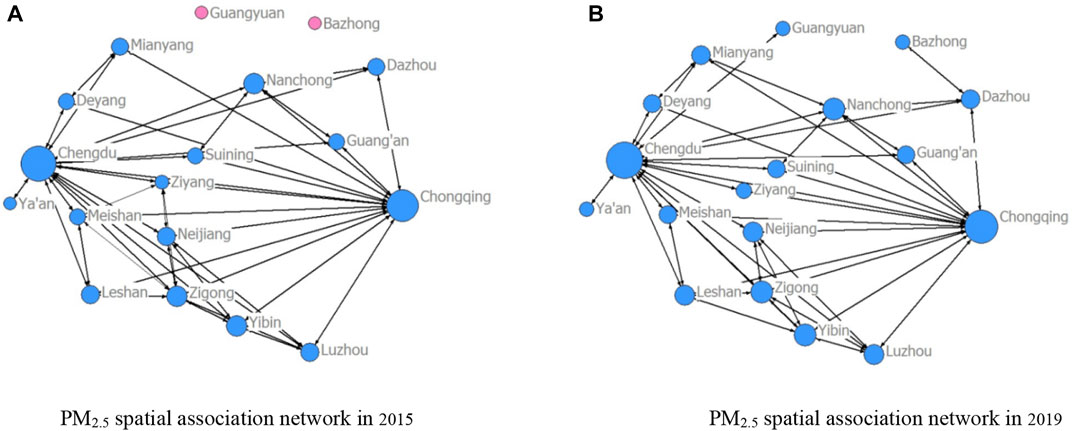
FIGURE 6. Spatial association network of PM2.5 pollution in SCB (The size of point is positively proportional to the degree). (A) PM2.5 spatial association network in 2015 (B) PM2.5 spatial association network in 2019.
Additionally, density, connectedness, and efficiency were calculated for the overall network using Eqs. 4–6; this is illustrated in Figure 7. There was a change in density from 0.29 in 2015 to 0.30 in 2017, followed by a decline to 0.25 in 2018 and subsequent increase to 0.29 in 2019, representing that the closeness degree rises, falls, and rises again in the network structure. The network efficiency exhibits a global increase from 0.72 to 0.80 with an exceptional decrease to 0.75 in 2017, coinciding with the increased density that year. Network connectedness was 0.78 in 2015 and reached 1.00 in 2019, consistent with the network consisting of two isolated nodes in 2015 to being completely connected in 2019 (Figure 6). These data demonstrate the overall network is of significant spatial association effect with periodic changes implying the inter-city association strengthens, then weakens, and then strengthens again.
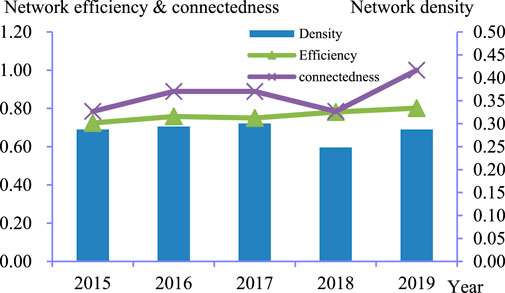
FIGURE 7. Overall network density, connectedness and efficiency.
This evolution could be ascribed to the multiple impacts of rapid development, national environmental policy, and technological improvement. From 2015 to 2019, the relevant socioeconomic data in SCB rose significantly with ratio of 1.14 for urban population, 1.92 for civilian vehicles, 1.28 for urban built area, 1.61 for secondary industry, and 1.51 for tertiary industry (Sichuan Provincial Bureau of Statistics, 2016–2020; Chongqing Bureau of Statistics, 2016–2020). Accordingly, more emission and mutual flow between cities accelerate the formation of PM2.5 association network. In 2017, the rebound of PM2.5 peak monthly concentration in Figure 3, the highest density and the decreasing efficiency in Figure 7 are the consequence. However, this can be prevented by smart urban planning, strict industrial and environmental policy, and green technology. A reasonable urban spatial planning pattern allows less spatial segregation between different functions and shortens daily commutes. A series of policies and technologies for clean production, green transportation, and eco-friendly cities are trying to reverse this trend. The explosion of environmental policy in 2016–2017 such as the National 13th Five-Year Plan for the Environmental Protection, the explicit statement of green and sustainable development in the report at the 19th National Congress of the Communist Party of China explain the turning point in 2018 shown in Figure 7 (State Council of the PRC, 2016; Chinese People’s Publishing House, 2017). These regional and national policies emphasize intense concerns about environmental issues. Combined with strict inspection measures throughout the country by central steering group, preliminary success was achieved in 2018. The balance between environmental and economic is changing and the formation in 2019 was strengthened.
Degree, betweenness, and closeness centrality evaluate the power of each individual node in the network. They were calculated using Eqs. 7–9 with typical data presented in Table 1. Figure 8 presents a visualization of their spatiotemporal evolution.
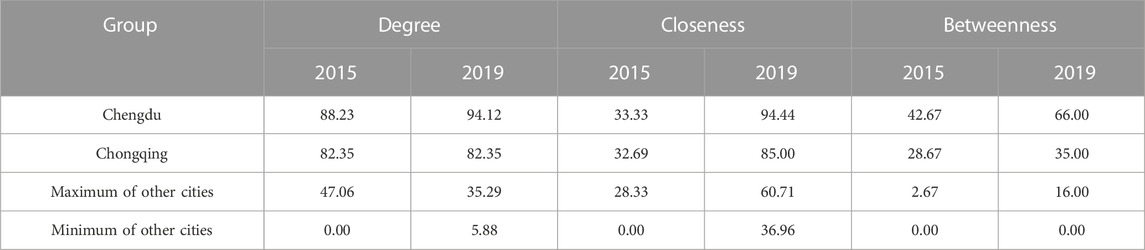
TABLE 1. Typical degree, closeness and betweenness of different cities in PM2.5 association in SCB.
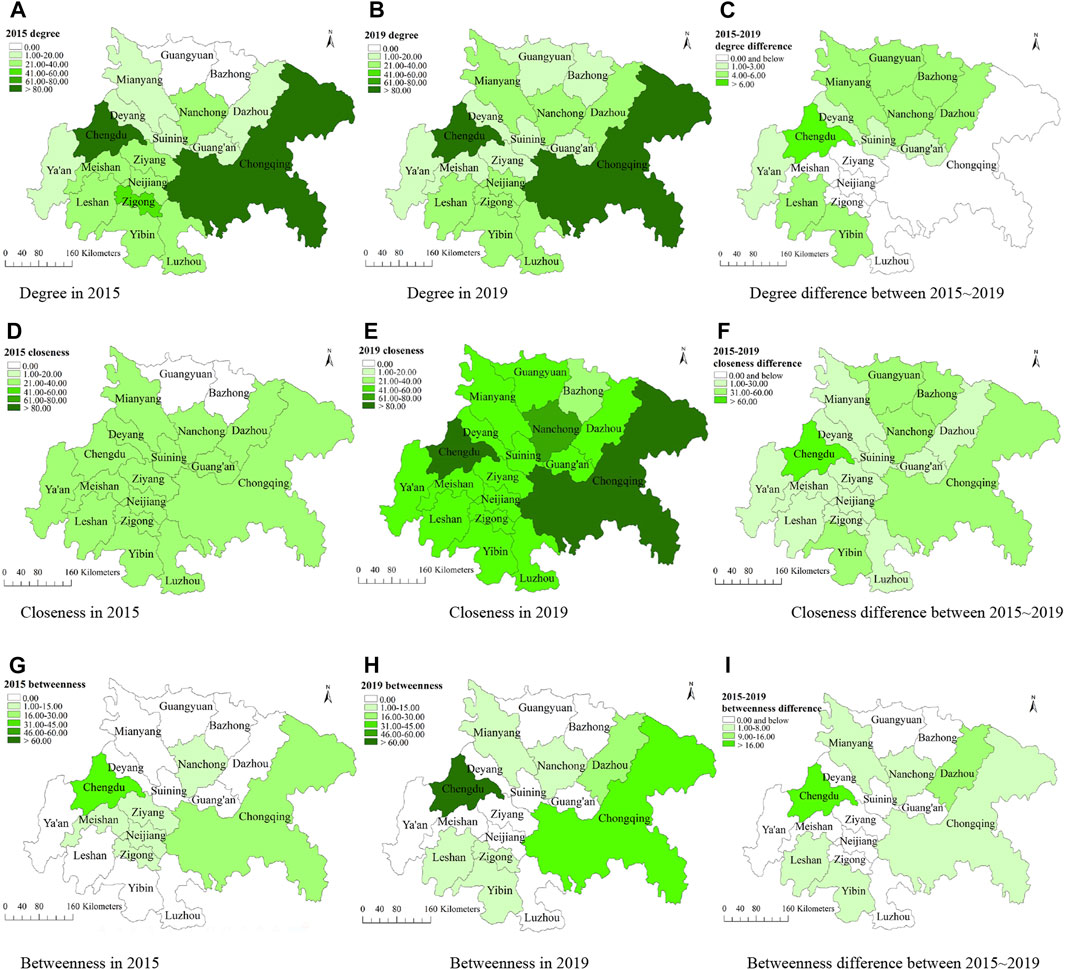
FIGURE 8. Spatiotemporal evolution of degree, closeness and betweenness in PM2.5 association in SCB (2015, 2019). (A) Degree in 2015 (B) Degree in 2019 (C) Degree difference between 2015 and 2019 (D) Closeness in 2015 (E) Closeness in 2019 (F) Closeness difference between 2015 and 2019 (G) Betweenness in 2015 (H) Betweenness in 2019 (I) Betweenness difference between 2015 and 2019.
Table 1 shows that the three indicators were the highest for Chengdu: in particular from 2015 to 2019, closeness and betweenness increased 3.00 fold and 1.50 fold respectively, and degree increased only slightly. Chongqing followed its lead closely but at a slower pace. This means the direct relationship among the two metropolises and other cities is remarkably strong. Their powerful influence is further strengthened by frequently acting as bridges in the association network and being much less susceptible to being controlled by others. Their predominant position can be attributed to their administrative status: Chengdu is the capital of Sichuan province and Chongqing is a municipality directly under the Central Government.
In the other cities, both the maximum closeness and betweenness increased while the maximum degree decreased. Only five cities: Leshan, Yibin, Mianyang, Dazhou and Nanchong, displayed increase in all three parameters. Surprisingly, a decrease both in degree and betweenness occurred in Meishan, Ziyang, Zigong and Neijiang, which lie adjacent to Chengdu and Chongqing, and neither of them has an equivalent influence on the association as compared to their location. This indicates heterogeneity and differentiation occur in the association. The betweenness in these cities was quite small: the maximum was for Dazhou (16.00), was less than 3.00 for the other four cities, and remained 0.00 in 2019. This implies that they were unable to serve as a bridge in the region (Table 1; Figure 8).
The above illustration presents a core-edge pattern for PM2.5 association in SCB predominated by Chengdu and Chongqing and supported by Yibin and Leshan in south, Mianyang, Nanchong, and Dazhou in north. These cities exhibited more spatial ties with other cities, acting as strong bridges, whereas the remaining cities were highly marginalized. Therefore, further PM2.5 mitigation policies should prioritize these core cities.
The drivers of the PM2.5 association network in SCB were investigated. Specifically, the spatial matrix was considered as the dependent variable. The potential factors were focused on three aspects: population, economic and urban development and construction on the basis of a driving mechanism that all the PM2.5 emission is ascribed to consumption and production behavior. Therefore, the difference in eight indicators between the two cities was considered as the independent matrix: direct distance (V1), urban population (V2), urban ratio (V3), the number of civilian vehicle (V4); gross domestic product (GDP) gap between secondary industry and tertiary industry (V5), GDP per capita (V6), per capita road area (V7), and greening rate (V8). These variables were normalized using the Z-score method to be of the same order of magnitude for subsequent QAP analysis.
The similarities between the PM2.5 association matrix and each individual potential independent variable matrix were quantified by the correlation coefficient using QAP correlation analysis in the UCINET software. The matrix data were randomly permuted 5000 times to obtain the detailed result (Table 2). There was a significant negative correlation between the direct distance and the spatial association, the difference of per capita road area and the spatial association at the 1% significance level. Conversely, there was a significant positive correlation among the difference in urban ratio, urban population, the number of civilian vehicle, and GDP gap between second industry and tertiary industry with PM2.5 spatial association at 1% level and between PM2.5 spatial association and GDP per capita at the 5% level. Additionally, the difference in greening rate failed to pass the significance test and no correlation was observed with PM2.5 spatial association.
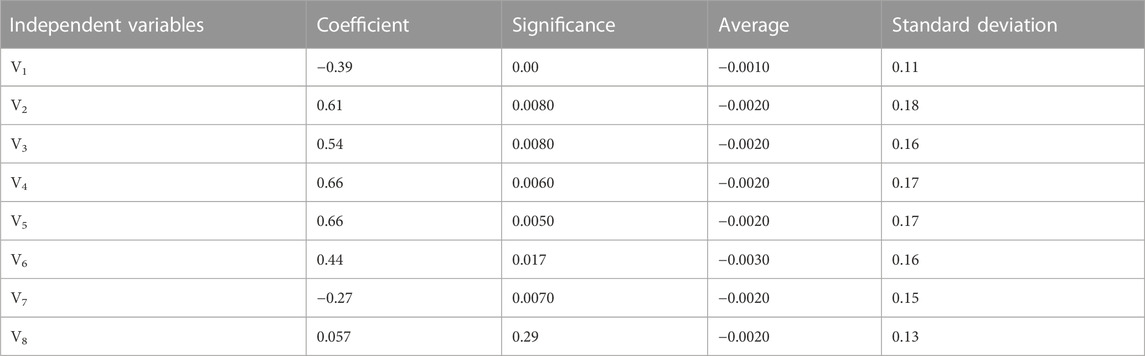
TABLE 2. Coefficient between PM2.5 spatial association and potential driving factors by QAP correlation analysis.
QAP regression analysis was further performed to study the relation between the PM2.5 spatial association matrix and multiple independent variable matrices with significant correlation in Table 2. Data were randomly permuted 5,000 times in Ucinet to obtain the information provided in Table 3:
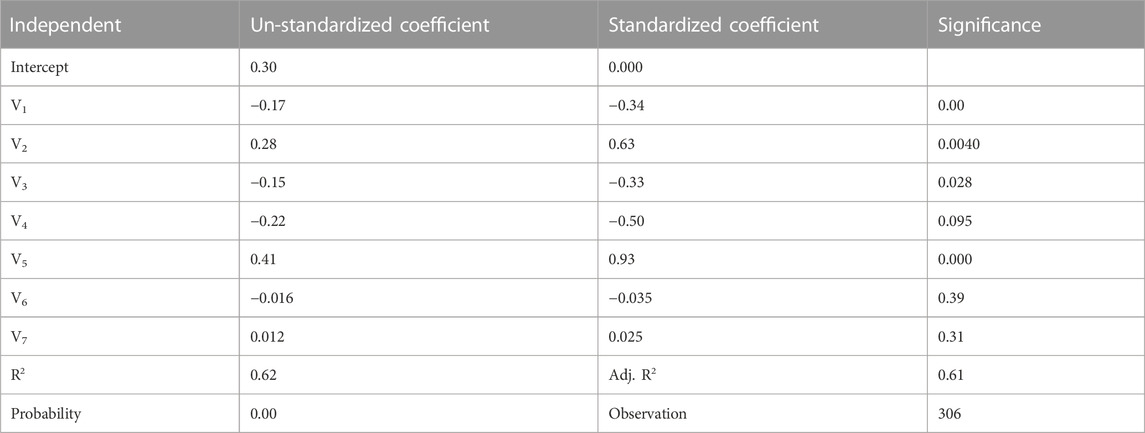
TABLE 3. Driving factors investigated by QAP regression analysis.
Notably, the coefficient of the difference in GDP gap between the secondary and tertiary industry matrices and the difference in urban population matrix reached 0.93 and 0.63, respectively, and was positive at a significance threshold of 1%. This demonstrates that enlarging the differences in these variables between cities play a critical role in influencing the evolution of PM2.5 spatial association Industry has been universally regarded as the origin of PM2.5 emissions and particularly different structure gives diverse impact even with same GDP. Secondary industry is generally recognized as being much more polluting than tertiary industry. This is consistent with the findings of the present study, which identified the GDP gap between secondary and tertiary industries as the most important driver of patterns of PM2.5 concentrations. Urban population size is the most fundamental driver of PM2.5 emissions as the source of all consumption and production activities. Huge consumption drives numerous productions and PM2.5 emissions are made worse by the synergistic effect of mutual performances. During rapid urbanization, people move into cities and this influx enlarges the difference in urban population between cities. The PM2.5 spatial association is strengthened accordingly.
In contrast, the coefficients of the direct distance matrix, the difference in the urban ratio matrix and the difference in the civilian vehicle matrix were −0.34, −0.33, and −0.50, showing significant negative relationships at the 1%, 5%, and 10% level respectively. This implies that when differences in the three indicators between cities are smaller, the PM2.5 spatial association is accelerated. Materials and population flow more frequently between adjacent cities, which subsequently causes anthropogenic PM2.5 emissions and atmospheric circulation are interflowed between them to strengthen the spatial association. Serious PM2.5 pollution always occurs in highly urbanized cities, accompanied by urban ratio enhancement. Transportation is universally criticized for its PM2.5 emissions, particularly from vehicle exhausts and the disturbance to the atmosphere from friction between tires and road surfaces. The number of car of Chengdu and Chongqing rank second and third in number, respectively, in China. Their civilian vehicle increased to 1.41 and 1.66 fold, respectively, from 2015 to 2019; similar increases occurred in other cities but with a much smaller total number of cars, less than 20% of the two big cities (Sichuan Provincial Bureau of Statistics, 2016–2020; Chongqing Bureau of Statistics, 2016–2020). This significant negative indicates an overflow effect with the decreasing the difference of civilian vehicles between cities promotes the relation of the current spatial association.
Additionally, the difference in GDP per capita matrix and that in per capita road area matrix failed to pass the significance test in the QAP regression analysis, indicating that the observed spatial association pattern is not impacted by these factors.
The spatiotemporal evolution shows that PM2.5 levels in most cities in the SCB exceeded the national standard in 2015 and dropped sharply from 2015 to 2020. Nevertheless, a slightly strengthened PM2.5 spatial association network is observed by SNA analysis based on the modified gravity model from 2015 to 2019. Alongside the dual impacts of socioeconomic growth and strict environmental regulations discussed previously, the regional fusion policy in SCB plays an important role: developed as Chengdu-Chongqing Metropolitan Area in 2016 and updated as Chengdu-Chongqing Economic Circle in 2021 (National Development and Reform Commission, Ministry of Housing and Urban-Rural Development, 2016; State Council of the PRC, 2021). However, two cities, Guangyuan and Bazhong, excluded from the latest economic circle, also exhibited an increasingly stronger relationship with other cities in the PM2.5 spatial association in 2019 as compared to their initial isolation in 2015. This phenomenon reminds us regardless of how cities are economically classified, PM2.5 emissions and dispersion inevitably cause interdependent impacts across the whole region. Therefore, regionalism is critical to realize further PM2.5 control and mitigation. Attempting to tackle the emissions of each city individually will likely fail to achieve the desired targets.
The evolution of the density, efficiency, and connectedness of the overall network shows that the closeness degree of spatial association is promoted by some fluctuations. Despite the rapid drop in PM2.5 concentration due to strict environmental regulations, upgrades to the economic structure and smart urban planning, the rebound of the overall network parameters implies the collaborative governance effect of inter-city PM2.5 emissions show a backward trend. The growth of all the socioeconomic parameters is a lasting motivation for local governments. Environmental targets have been outlined in national policy but occasionally fail to be fully addressed in practice. The degree, closeness, and betweenness reveal that Chengdu and Chongqing occupy the center of the network and their strong influence is intensified evidently, of which Chengdu is even more powerful. Based on this core-edge model, they should be prioritized to control PM2.5 emissions.
Ultimately, the driving factors identified by QAP regression call for regional collaboration concentrating on the cities with short distances, small differences in the number of civilian vehicle and urban ratio, but with a large difference in urban population and GDP gap between secondary industry and tertiary industry. These driving factors exhibit a significant impact on the evolution of PM2.5 overall network and the relationship between the nodes in the SCB. Direct distance is mainly involved in the PM2.5 transportation and ties between nodes and the difference of urban ratio is relative small, both with coefficient around 0.33-0.34 from QAP regression. Therefore, GDP gap, urban population and the number of civilian vehicle with the coefficient above 0.50 in the QAP regression were considered to explore the relationship of spatiotemporal evaluation for PM2.5 in individual city in Figure 2. They were illustrated in Figure 9 for sixteen cities except Chengdu and Chongqing whose data were quite huge and unsuitable for the scale herein. Moreover, the GDP sum for secondary industry and tertiary industry were also included. All the data increased from 2015 to 2019 except the GDP gap which were all positive in 2015 but negative for most cities in 2019. This negative GDP gap implies the extent to tertiary industry greater than secondary industry in the economic structure. Its shift partly explains the PM2.5 annual concentration decrease from 2015 to 2019 observed in Figures 2A, E although the other data climbs heavily. The cities with PM2.5 < 35.00 μg/m3 in Figures 2A, E correspond to those with a combination of relatively small value for driving factors in Figure 9. However, Ya’an and Bazhong, with quite small driving factors in Figure 9A is not observed in Figure 2A PM2.5 < 35.00 μg/m3 as their PM2.5 annual concentrations were 36.00 μg/m3, exceeding the standard slightly. Moreover, a synergetic effect among these factors plays an important role as some cities with quite low value in one or two driving factors fails in reaching the PM2.5 < 35.00 μg/m3. These findings demonstrate the dominant factors impacting the spatial and temporal differences are the GDP gap between secondary industry and tertiary industry, urban population and the number of civilian vehicle identified by QAP regression. In Figure 10, Chengdu and Chongqing shows the same trend for all the driving factors which accounts for their PM2.5 mitigation from 2015 to 2019. The negative GDP gap indicates their tertiary industry exceeded second industry since 2015. It is inadequate to achieve PM2.5 < 35.00 μg/m3 in 2015 and 2019 without the synergetic effect of all the factors mentioned above.
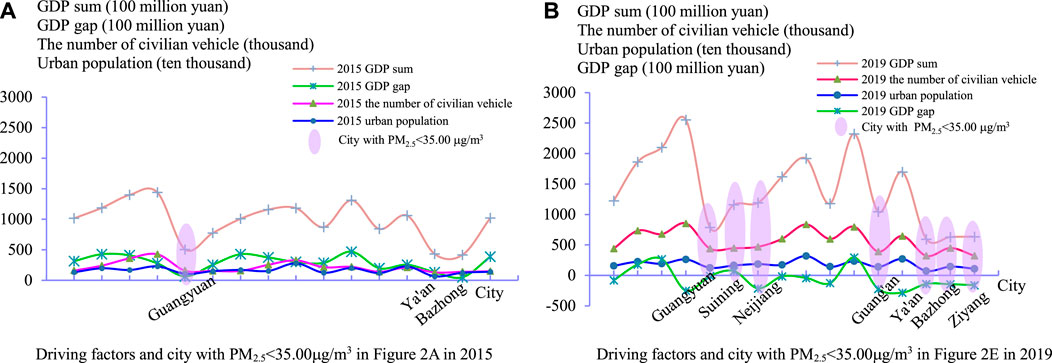
FIGURE 9. The relationship of driving factors and PM2.5 in the SCB (2015, 2019). (A) Driving factors and city with PM2.5 < 35.00 μg/m3 in Figure 2A in 2015 (B) Driving factors and city with PM2.5 < 35.00 μg/m3 in Figure 2E in 2019.
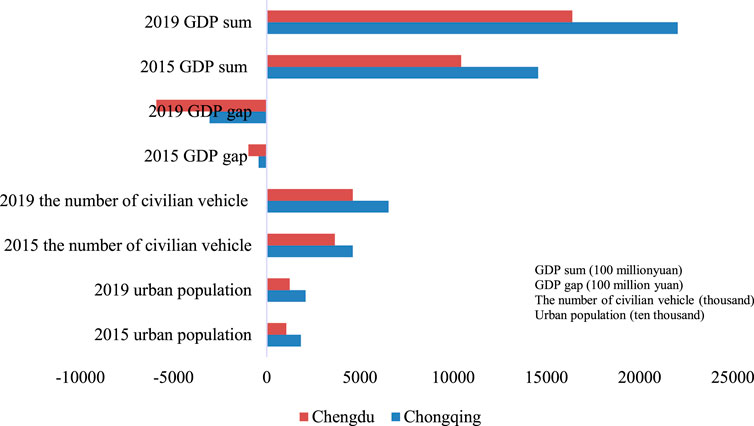
FIGURE 10. Driving factors in Chengdu and Chongqing (2015, 2019).
Although the study findings provide some interesting and valuable insights, they do not reveal the fundamental influencing mechanism of these factors; hence, further study is required. A knowledge of the mechanism could help propose more accurate and precise policy and measures for PM2.5 mitigation. Moreover, the data for the subdivision of tertiary industry are unavailable publicly for each individual city, preventing a comprehensive in-depth analysis of its impact. Further research could be continued with more specific information in the future.
Herein, we discuss the spatiotemporal evolution of PM2.5 pollution by visualizing PM2.5 concentrations from 2015 to 2020 in SCB. Overall network structure and node behavior was investigated using SNA based on the modified gravity model of the PM2.5 spatial association from 2015 to 2019. In addition, the driving factors were explored by QAP analysis. The following conclusions were made:
(1) PM2.5 levels dropped significantly from 2015 to 2020 in SCB. The annual PM2.5 concentration decreased from 62.92 to 40.83 μg/m3 in Chengdu and from 55.08 to 32.67 μg/m3 in Chongqing. The number of cities with an annual PM2.5 concentration above 35.00 μg/m3 fell from seventeen to six. The most heavily polluted season was typically winter, particularly in December and January, which had a monthly concentration around 1.50–2.00 times the annual average. The maximum annual and monthly concentration globally decreased. The number of days where pollution exceeded 75.00 μg/m3 dropped dramatically from more than 600 days to approximately 200 days. Nevertheless, ensuring the continuous improvement of PM2.5 in SCB remains a great challenge in the face of the swift socioeconomic growth, as no city reached less than 15.00 μg/m3 annually and PM2.5 levels rebounded, particularly in peak months occasionally but significantly.
(2) The PM2.5 overall network was significantly spatially associated with periodic changes implying the inter-city association strengthens, then weakened and further strengthened again in SCB from 2015 to 2019; the PM2.5 concentration dropped greatly, the density remained 0.29 both in 2015 and 2019 but increased to 0.30 in 2017, efficiency grew from 0.72 to 0.80, and connectedness from 0.78 to 1.00. There were no more isolated nodes in the network.
(3) A strong “core-edge” pattern in the PM2.5 spatial association network is apparent from the results of degree, betweenness, and closeness centrality analysis. Notably, the two leading cities Chengdu and Chongqing occupied the center of the network, while other cities were marginalized in the network. They exhibited many more spatial associations with other cities and frequently acted as “bridges” between cities. The spatial association network strengthened from 2015 to 2019, during which, the PM2.5 concentrations decreased sharply.
(4) QAP regression analysis found that enlarging the difference of GDP gap between secondary and tertiary industries and larger urban population and narrowing the difference of urban ratio, the number of civilian vehicle, and distance between cities accelerates the formation of the spatial association of PM2.5 in SCB. The variation of GDP gap between secondary industry and tertiary is the predominant factor to explain the global mitigation of PM2.5 in SCB. A synergetic effect of GDP gap between secondary industry and tertiary industry, urban population and the number of civilian vehicle leads to the spatiotemporal difference in the PM2.5 in the SCB. In 2015 and 2019, all the cities with PM2.5 < 35.00 μg/m3 in annual concentration exhibit a combination of small value for driving factors.
These conclusions direct us to the following proposals:
(1) A comprehensive regional strategy should be adopted to control PM2.5 emissions in SCB; its effectiveness should be continuously evaluated and adjusted accordingly, particularly in the peak emissions months in winter. The Construction outline of Chengdu-Chongqing Economic Circle (State Council of the PRC, 2021) stipulates that the air quality excellent rate should reach 88%, excluding two cities in SCB. Integration of the economic and environmental spheres is heavily recommended. PM2.5 emissions rebounds should be prevented by strictly and persistently implementing environmental measures.
(2) For the driving factors demonstrated in QAP regression analysis, the distance between cities is fixed and the increased tendency of number of civilian vehicle and urban ratio is hardly reversed with socioeconomic development. Emissions from traditional secondary industry have received the most attention, but efforts should be diverted to tertiary industry with its swift growth as the transport, real estate, and catering industries are major contributors to PM2.5 emissions. Clean transport has gradually begun to reduce emissions from gasoline, but the upstream production of electricity and cell batteries for electric vehicles have adverse environmental impacts. In the real estate industry, green architecture is a promising measure for PM2.5 mitigation. In China, Green Building Assessment Standard GB/T50378-2019 could be returned to 2006 standard following revisions in 2014, 2016, 2019 (MOHURD, 2019). Nevertheless, it remains a recommended national standard and a conversion to green building across all industries is expected to cover the relevant upstream and downstream industry chain. Catering does not significantly change the traditional cooking style; improving this industry could involve better containment of PM2.5 by evacuation and filtration in cooking facilities. Life cycle assessments of each individual industry chain is important and continuous improvements to tertiary industry are necessary.
(3) Encouraging clean lifestyles should be a priority given human beings’ dual roles as consumers and producers in society. A shift in the perception of what constitutes a good life from one of extreme comfort, convenience and luxury to one that is environmentally friendly will guide individual daily behavior towards cleaner consumption and production. Primary school lessons could help create this awareness, and trial system of a clean lifestyle index with scores for motivation could be implemented, similar to smart watches used for recording progress in physical training.
The original contributions presented in the study are included in the article/supplementary material, further inquiries can be directed to the corresponding author.
Conceptualization, ZL and BW; methodology, ZL and BW; software, ZL and WW; validation, ZL and WW; formal analysis, ZL; investigation, ZL; resources, ZL and WW; data curation, ZL and WW; writing—original draft preparation, ZL; writing—review and editing, ZL; visualization, ZL and WW; supervision, BW; project administration, BW. All authors have read and agreed to the published version of the manuscript.
The authors declare that the research was conducted in the absence of any commercial or financial relationships that could be construed as a potential conflict of interest.
All claims expressed in this article are solely those of the authors and do not necessarily represent those of their affiliated organizations, or those of the publisher, the editors and the reviewers. Any product that may be evaluated in this article, or claim that may be made by its manufacturer, is not guaranteed or endorsed by the publisher.
An, H., Li, J., Zhang, C., and Dong, Z. L. (2020). Spatial correlation network and season evolution of PM2.5 pollution in Beijing-Tianjin-Hebei and surrounding cities. Ecol. Environ. Sci. 29 (7), 1377–1386. (in Chinese with English abstract). doi:10.16258/j.cnki.1674-5906.2020.07.012
Bai, C., Zhou, L., Xia, M., and Feng, C. (2020). Analysis of the spatial association network structure of China’s transportation carbon emissions and its driving factors. J. Environ. Manage. 253, 109765. doi:10.1016/j.jenvman.2019.109765
Chen, Y., Xie, S., Luo, B., and Zhai, C. (2014). Characteristics and origins of carbonaceous aerosol in the Sichuan Basin, China. Atmos. Environ. 94, 215–223. doi:10.1016/j.atmosenv.2014.05.037
Chen, Y., Xie, S., Luo, B., and Zhai, C. (2017). Particulate pollution in urban Chongqing of southwest China: Historical trends of variation, chemical characteristics and source apportionment. Sci. Total Environ. 584–585, 523–534. doi:10.1016/j.scitotenv.2017.01.060
Chinese People's Publishing House (2017). Constitution of the communist party of China (revised and adopted at the 19th national congress of the communist party of China on october 24, 2017). Beijing: Chinese People’s Publishing House.
Chongqing Bureau of Statistics (2016-2020). Chongqing statistical Yearbook. Beijing, China: China Statistics Press. (in Chinese).
Fan, J., Shang, Y., Zhang, X., Wu, X., Zhang, M., Cao, J., et al. (2020). Joint pollution and source apportionment of PM2.5 among three different urban environments in Sichuan Basin, China. Sci. Total Environ. 714, 136305. doi:10.1016/j.scitotenv.2019.136305
Feng, X., Wei, S., and Wang, S. (2020). Temperature inversions in the atmospheric boundary layer and lower troposphere over the Sichuan Basin, China: Climatology and impacts on air pollution. Sci. Total Environ. 726, 138579. doi:10.1016/j.scitotenv.2020.138579
Freeman, L. C. (1979). Centrality in social networks: Conceptual clarification. Soc. Netw. 1, 215–239. doi:10.1016/0378-8733(78)90021-7
Gu, J., Bai, Z., Li, W., Wu, L., Liu, A., Dong, H., et al. (2011). Chemical composition of PM2.5 during winter in Tianjin, China. Particuology 9, 215–221. doi:10.1016/j.partic.2011.03.001
Health Effects Institute (2020). State of global air 2020. Special report. Boston, MA: Health Effects Institute.
Hou, X., Chan, C. K., Dong, G. H., and Yim, S. H. L. (2019). Impacts of transboundary air pollution and local emissions on PM2.5 pollution in the Pearl River Delta region of China and the public health, and the policy implications. Environ. Res. Lett. 14, 034005. doi:10.1088/1748-9326/aaf493
Hua, Y., Cheng, Z., Wang, S., Jiang, J., Chen, D., Cai, S., et al. (2015). Characteristics and source apportionment of PM2.5 during a fall heavy haze episode in the Yangtze River Delta of China. Atmos. Environ. 123, 380–391. doi:10.1016/j.atmosenv.2015.03.046
Huang, Y., Deng, T., Li, Z., Wang, N., Yin, C., Wang, S., et al. (2018). Numerical simulations for the sources apportionment and control strategies of PM2.5 over Pearl River Delta, China, part I: Inventory and PM2.5 sources apportionment. Sci. Total Environ. 634, 1631–1644. doi:10.1016/j.scitotenv.2018.04.208
Kong, L., Tan, Q., Feng, M., Qu, Y., An, J., Liu, X., et al. (2020). Investigating the characteristics and source analyses of PM2.5 seasonal variations in Chengdu, Southwest China. Chemosphere 243, 125267. doi:10.1016/j.chemosphere.2019.125267
Kuik, O., Branger, F., and Quirion, P. (2019). Competitive advantage in the renewable energy industry: Evidence from a gravity model. Renew. Energy 131, 472–481. doi:10.1016/j.renene.2018.07.046
Lai, S. C., Zou, S. C., Cao, J. J., Lee, S. C., and Hok, I. J. (2007). Characterizing ionic species in PM2.5 and PM10 in four Pearl River Delta cities, south China. J. Environ. Sci. 19, 939–947. doi:10.1016/S1001-0742(07)60155–7
Li, J., Du, H., Wang, Z., Sun, Y., Yang, W., Li, J. J., et al. (2017). Rapid formation of a severe regional winter haze episode over a megacity cluster on the North China Plain. Environ. Pollu. 223, 605–615. doi:10.1016/j.envpol.2017.01.063
Li, L., Tan, Q., Zhang, Y., Feng, M., Qu, Y., An, J., et al. (2017). Characteristics and source apportionment of PM2.5 during persistent extreme haze events in Chengdu, southwest China. Environ. Pollut. 230, 718–729. doi:10.1016/j.envpol.2017.07.029
Liu, J. (2019). Whole network approach (third version). Shanghai: Truth & Wisdom Press. (in Chinese).
Liu, G., Li, J., Wu, D., and Xu, H. (2015). Chemical composition and source apportionment of the ambient PM2.5 in Hangzhou, China. Particuology 18, 135–143. doi:10.1016/j.partic.2014.03.011
Liu, H., Liu, C. M., and Sun, Y. N. (2015). Spatial correlation network structure of energy consumption and its effect in China. Chin. Ind. Econ. 5, 83–95. (in Chinese with English abstract). doi:10.19581/j.cnki.ciejournal.2015.05.008
Liu, L., Chen, Y., Wu, T., and Li, H. (2018). The drivers of air pollution in the development of Western China: The case of Sichuan province. J. Clean. Prod. 197, 1169–1176. doi:10.1016/j.jclepro.2018.06.260
Luo, J. D. (2005). Social network analysis teach lecture. Beijing: Social Sciences Academic Press. (in Chinese).
Ministry of Environmental Protection of China, 2012. Ambient Air Quality Standards, GB3095-2012. (now renamed as Beijing: Chinese Ministry of Ecology and Environment of China). Available at: https://www.mee.gov.cn/ywgz/fgbz/bz/bzwb/dqhjbh/dqhjzlbz/201203/W020120410330232398521.pdf, https://www.mee.gov.cn/gkml/hbb/bwj/201708/W020170824378273815892.pdf (accessed 16 August, 2022).
MOHURD (2019). Assessment standard for green building, GB50378-2019. Beijing: Ministry of Housing and Urban-Rural Development of PRC. Available at: https://www.mohurd.gov.cn/gongkai/fdzdgknr/tzgg/201905/20190530_240717.html (accessed August 16, 2022).
National Bureau of Statistics of China (2001). China urban statistical Yearbook. Beijing, China: China Statistic Press. (in Chinese).
National Bureau of Statistics of China (2016-2021). China urban statistical Yearbook. Beijing, China: China Statistic Press. (in Chinese).
National Bureau of Statistics of China (2021). China urban statistical Yearbook. Beijing, China: China Statistic Press. (in Chinese).
National Development and Reform Commission, Ministry of Housing and Urban-Rural Development (2016). Chengdu-chongqing metropolitan area development planning. Beijing: National Development and Reform Commission. Available at: https://www.ndrc.gov.cn/xxgk/zcfb/tz/201605/W020190905516922663608.pdf (accessed August 16, 2022).
Ning, G., Wang, S., Yim, S. H. L., Li, J., Hu, Y., Shang, Z., et al. (2018). Impact of low-pressure systems on winter heavy air pollution in the northwest Sichuan Basin, China. Atmos. Chem. Phys. 18, 13601–13615. doi:10.5194/acp-18-13601–2018
Qian, X., Wang, Y., and Zhang, G. (2018). The spatial correlation network of capital flows in China: Evidence from China’s high-value payment system. China Econ. Rev. 50, 175–186. doi:10.1016/j.chieco.2018.04.005
Qiao, X., Guo, H., Tang, Y., Wang, P., Deng, W., Zhao, X., et al. (2019). Local and regional contributions to fine particulate matter in the 18 cities of Sichuan Basin, southwestern China. Atmos. Chem. Phys. 19, 5791–5803. doi:10.5194/acp-19-5791-2019
Sichuan Provincial Bureau of Statistics (2016-2020). Sichuan statistical Yearbook. Beijing, China: China Statistics Press. (in Chinese).
Song, C., He, J., Wu, L., Jin, T., Chen, X., Li, R., et al. (2017). Health burden attributable to ambient PM2.5 in China. Environ. Pollut. 223, 575–586. doi:10.1016/j.envpol.2017.01.060
Song, J. Z., Feng, Q., Wang, X. P., Fu, H. L., Jiang, W., and Chen, B. Y. (2019). Spatial association and effect evaluation of CO2 emissions in the chengdu-chongqing urban agglomeration: Quantitative evidence from social network analysis. Sustainability 11 (1), 1. doi:10.3390/su11010001
State Council of the PRC (2016). National 13th five-year plan for the environmental protection. Beijing: State Council of the PRC. Available at: https://www.mee.gov.cn/zcwj/gwywj/201811/t20181129_676583.shtml (accessed August 16, 2022).
State Council of the PRC (2021). Construction outline of chengdu-chongqing economic circle. Beijing: State Council of the PRC. Available at: http://www.gov.cn/zhengce/2021-10/21/content_5643875.htm (accessed August 16, 2022).
Su, Y., and Yu, Y. Q. (2019). Spatial association effect of regional pollution control. J. Clean. Prod. 213, 540–552. doi:10.1016/j.jclepro.2018.12.121
Tan, J., Zhang, L., Zhou, X., Duan, J., Li, Y., Hu, J., et al. (2017). Chemical characteristics and source apportionment of PM2.5 in Lanzhou, China. Sci. Total Environ. 601–602, 1743–1752. doi:10.1016/j.scitotenv.2017.06.050
Tao, J., Zhang, L., Engling, G., Zhang, R., Yang, Y., Cao, J., et al. (2013). Chemical composition of PM2.5 in an urban environment in Chengdu, China: Importance of springtime dust storms and biomass burning. Atmos. Res. 122, 270–283. doi:10.1016/j.atmosres.2012.11.004
Wang, X. P., Feng, Q., and Song, J. Z. (2020). The spatial association structure evolution of carbon emissions in Chengdu-Chongqing urban agglomeration and its influence. China Environ. Sci. 40 (9), 4123–4134. (in Chinese with English abstract). doi:10.19674/j.cnki.issn1000-6923.2020.0460
Wang, X., Zhang, Q., and Chang, W. (2022). Does economic agglomeration affect haze pollution? Evidence from China’s Yellow River basin. J. Clean. Prod. 335, 130271. doi:10.1016/j.jclepro.2021.130271
Wasserman, S., and Faust, K. (1994). Social network analysis: Methods and applications. Cambridge: Cambridge University Press.
World Health Organization (2006). WHO air quality guidelines for particulate matter, ozone, nitrogen dioxide and sulfur dioxide. Geveva: World Health Organization. Available at: https://www.who.int/publications/i/item/WHO-SDE-PHE-OEH-06.02 (accessed August 16, 2022).
World Health Organization (2021). WHO global air quality guidelines: Particulate matter (PM2.5 and PM10), ozone, nitrogen dioxide, sulfur dioxide and carbon monoxide. Geveva: World Health Organization. Available at: https://apps.who.int/iris/handle/10665/345329 (accessed August 16, 2022).
Yin, D., Zhao, S., and Qu, J. (2017). Spatial and seasonal variations of gaseous and particulate matter pollutants in 31 provincial capital cities, China. Air Qual. Atmos. Health 10 (3), 359–370. doi:10.1007/s11869-016-0432-1
Zhang, X. Y., Wang, Y. Q., Niu, T., Zhang, X. C., Gong, S. L., Zhang, Y. M., et al. (2012). Atmospheric aerosol compositions in China: Spatial/temporal variability, chemical signature, regional haze distribution and comparisons with global aerosols. Atmos. Chem. Phys. 12, 779–799. doi:10.5194/acp-12-779-2012
Keywords: PM2.5 emission network, spatiotemporal evolution, social network analysis, quadratic assignment procedure, Sichuan Basin
Citation: Li Z, Wu B and Wu W (2023) Analysis of PM2.5 spatial association evolution in the Sichuan Basin and its driving factors. Front. Environ. Sci. 11:1101736. doi: 10.3389/fenvs.2023.1101736
Received: 18 November 2022; Accepted: 27 February 2023;
Published: 31 March 2023.
Edited by:
Zhen Wang, Huazhong Agricultural University, ChinaReviewed by:
Shaohua Zhao, Ministry of Ecology and Environment Center for Satellite Application on Ecology and Environment, ChinaCopyright © 2023 Li, Wu and Wu. This is an open-access article distributed under the terms of the Creative Commons Attribution License (CC BY). The use, distribution or reproduction in other forums is permitted, provided the original author(s) and the copyright owner(s) are credited and that the original publication in this journal is cited, in accordance with accepted academic practice. No use, distribution or reproduction is permitted which does not comply with these terms.
*Correspondence: Zeqiong Li, bGl6ZXFpb25nQGNkdXQuZWR1LmNu, emVxaW9uZy5saUAxNjMuY29t
Disclaimer: All claims expressed in this article are solely those of the authors and do not necessarily represent those of their affiliated organizations, or those of the publisher, the editors and the reviewers. Any product that may be evaluated in this article or claim that may be made by its manufacturer is not guaranteed or endorsed by the publisher.
Research integrity at Frontiers
Learn more about the work of our research integrity team to safeguard the quality of each article we publish.