 Yingzi Zhang1
 Lixing Chen
 Yunchao Fu
 Yibing Xie
94% of researchers rate our articles as excellent or good
Learn more about the work of our research integrity team to safeguard the quality of each article we publish.
Find out more
ORIGINAL RESEARCH article
Front. Environ. Sci., 26 January 2023
Sec. Environmental Informatics and Remote Sensing
Volume 11 - 2023 | https://doi.org/10.3389/fenvs.2023.1098966
Trees have significant effects of shading, humidifying, and cooling, and at the same time, they can create a more comfortable space for people. However, due to the complexity of their own biology, there are also some differences in the regulation mechanism of the space microclimate among different trees. Under the background of a high altitude and cold climate, based on field measurements and numerical simulation, this paper discussed the effects of the morphological indexes, including the height, crown width, leaf area index (LAI), and under branch height of trees and their interactions on the urban microclimate and thermal comfort in Lhasa city, which belongs to the Warm Summer Winter Dry Cold Climate (Dwb). The study revealed the following: 1) LAI is the key factor affecting the thermal environment and thermal comfort of the space under a tree, followed by height and crown width, and the improvement potential of under branch height is relatively weak. 2) The interaction between height and LAI and crown width affects the thermal comfort of the space under a tree. 3) In summer, the optimal combination of tree morphological indexes in Lhasa is LAI = 2, height = 12 m, crown width = 11 m, ground reflectance = 0.2.
Urbanization brings opportunities to urban development, but also raises many challenges, such as global warming, the urban heat island effect, urban environmental vulnerability, frequent extreme weather events, and a decline in the urban living capacity, and the degree and scope of its impact are still increasing (Peng et al., 2012). In February 2022, Working Group II (AR6 WGII IPCC) of the Intergovernmental Panel on Climate Change (IPCC) released the sixth assessment report “Climate Change 2022: Impacts, Adaptation and Vulnerability” (IPCC, 2022), which states that the effects of high temperatures and floods caused by global climate change result in human-induced diseases or premature deaths or lead to changes in the spatial and temporal distribution of vectors, environmental pollution, infectious diseases, and even psychological stress or mental illness (Huang and Liu, 2022).
Many scholars have studied the factors that improve the urban microclimate. As an important part of the urban life system, trees play an important role in increasing humidity and cooling and improving urban comfort (Guo et al., 2022). Compared with shrubs, arbors can not only regulate the microclimate through canopy shading and leaf transpiration, but also create a comfortable activity area for residents (Zheng et al., 2016). The lower space created by them can also make residents create comfortable activity areas. In addition to improving the cooling performance of trees by adopting appropriate planting methods and matching combinations (Langenheim et al., 2020), trees’ own morphological indicators also play a key role in improving the potential microclimate. These indexes include height (Wang et al., 2022), crown width (Wei et al., 2019), LAI (Morakinyo et al., 2018), under branch height (Wang et al., 2022), and crown shape (Wei et al., 2019). Assessing the impact of arbor morphology on their cooling performance not only helps to improve the urban microclimate environment and enhance comfort, but it also helps to reduce residents’ dependence on air conditioning to alleviate heat stress and reduce building energy consumption (Kumakura et al., 2019). In addition, the green space landscape has a significant impact on the physical and psychological recovery, improving residents’ satisfaction with the living environment from the visual and psychological aspects (Gao et al., 2022).
At present, tree research can be generally divided into two types, namely group trees and individual trees (Zhang et al., 2022a), mainly from the aspects of greening types, planting methods and plant morphological characteristics to study the effect of cooling. Some researchers believe that the impact of trees on urban microclimate depends mainly on LAI and leaf area density (LAD) (Shinzato and Duarte, 2013). In a study on the influence of urban forest community on urban cooling effect, it is considered that among the morphological indexes of plants, canopy density, LAI and tree height have the most significant influence on cooling effect, while DBH, density and basal area of trunk have no significant relationship with urban forest cooling effect (Tang et al., 2017). When considering the distribution of vegetation, the arrangement of trees is also one of the important factors that vegetation affects the thermal environment and ventilation (Zhang et al., 2018a). In addition, the differences in tree species also have different effects on the thermal environment. Trees have less evaporation and large shade area, which can better improve the thermal environment than shrubs and grassland (Zhang et al., 2018b). There are also some data conclusions about the cooling effect of trees. Huang et al. (Huang and Liu, 2022) studied the shade space of a park and proved that the cooling effect was the best when the ratio of tree spacing to crown width was slightly greater than 1:1. By measuring the air temperature in the canopy of Tilia cordata in two streets in Munich, Germany, Rahman et al. (Rahman et al., 2017) found that the air temperature in the canopy radius decreased by 3.5°C compared with the unshaded area. In the research method, researchers have used ENVI-met (microclimate simulation software), computational fluid dynamics (CFD), and other software to study the microclimate regulation of trees by numerical simulation under the guidance of thermal comfort evaluation theory and the microclimate change law. Some scholars have proposed that the canopy stomatal conductance calculation model can accurately predict the hourly transpiration rate of trees in no rain and light rain days to explore its impact on the microclimate (Feng et al., 2021). Through ENVI-met simulation software, the microclimate simulation of tree species can be carried out, so as to establish a suitable local microclimate effect evaluation index and establish a microclimate evidence-based design method (Liu et al., 2018). In addition, due to the biological complexity of tree species, the regulation mechanism of trees growing under different climatic conditions with respect to the spatial microclimate is different. At present, the improvement potential of the tree LAI, canopy spatial structure, and tree species difference for the outdoor microclimate and thermal comfort is mainly concentrated in tropical climate (Xu et al., 2020; Liu et al., 2022), cold climate (Qin et al., 2014; Zhao et al., 2016; Li et al., 2017), hot and humid climate (Lin and Lin, 2010; Irmak et al., 2018; Morakinyo et al., 2018; Zheng et al., 2018), mild climate (Sanusi et al., 2017), and arid climate (Wang et al., 2020) areas, while the research on high-altitude cold climate areas is relatively limited. The morphological index of a tree determines its impact on the microclimate and the thermal comfort of the space under the tree. The research results of other climate zones are not fully applicable to the plateau area. Therefore, it is necessary to further understand the characteristics of arbors. To better understand the improvement effect of the morphological indexes of trees on the spatial thermal environment and thermal comfort under high altitude and cold climate conditions, this study based on field measurements and numerical simulation, to achieve the following three goals:
1) To clarify the relationship between the main morphological indexes of trees and the thermal environmental parameters and thermal comfort under high altitude and cold climate conditions.
2) To clarify the effects of the main morphological indexes of trees and their interactions on outdoor thermal comfort at high altitudes and in cold climates.
3) To determine the optimal combination scheme and design strategy of tree morphological indexes suitable for high altitude and cold climate conditions.
This study takes Lhasa as an example to explore the relationship between the main morphological indexes of trees and their interactions with thermal environment parameters and thermal comfort under high altitude and cold climate conditions. Lhasa city (29°41′N, 91°1′E) is located in the southeast of the Tibet Autonomous Region and the middle of the Tibetan Plateau, with an altitude of 3,650 m. According to the Kӧppen climate classification, Lhasa belongs to the Warm Summer Winter Dry Cold Climate (Dwb). As China’s first historical and cultural city, Lhasa is famous for its special natural scenery and religious culture (Figure 1).
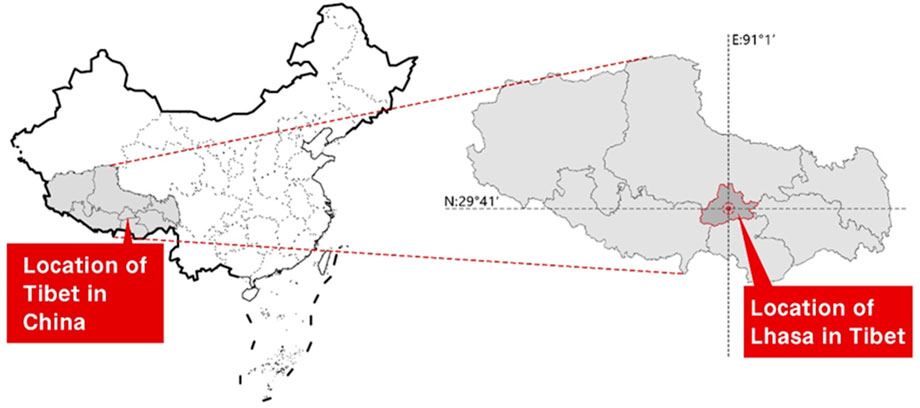
FIGURE 1. Geographical location of Lhasa.
According to the GB 50176-2016 “thermal design specification for civil buildings” thermal climate division, Lhasa belongs to the cold climate zone. It is cold in winter, cool in summer, and dry and less rainy. The rainfall is mainly concentrated in July and August, and the solar radiation is strong. The average annual sunshine duration can reach 3,000 h.Therefore, Lhasa is known as “sunlight City” (Figure 2A). Due to its special geographical location and altitude, the climate of Lhasa is different from that of Xi’an, Beijing, and other cities in the cold climate zone. As shown in Figures 2B, C, Lhasa has stronger solar radiation and a lower annual average temperature. The difference between the annual average maximum and minimum temperatures is small. Although the temperature in Lhasa is low in summer, the solar radiation is strong, and the local residents have higher demand for summer shading space. Trees can not only adjust the temperature and humidity of the surrounding space, but also play a certain attenuation effect on the solar radiation, thus improving the thermal comfort of residents ' space activities under trees. Therefore, it is necessary to study the impact of trees on the thermal environment.
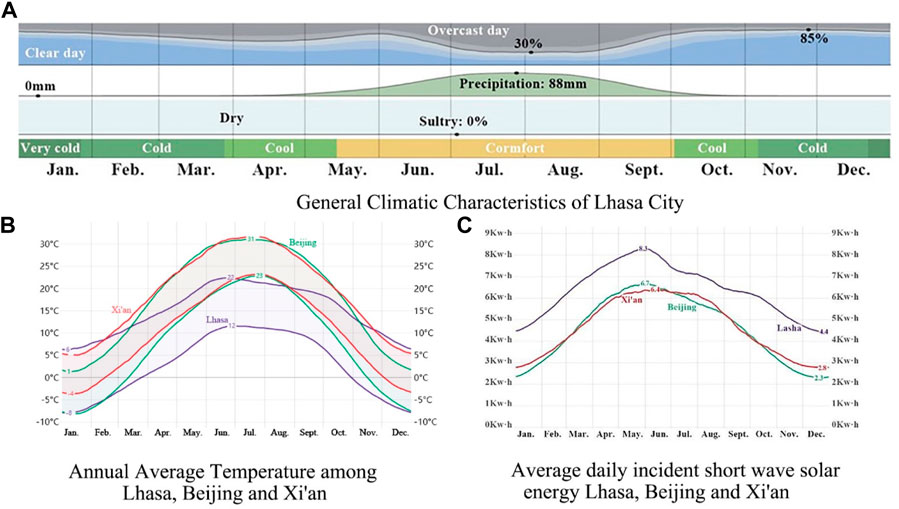
FIGURE 2. Climatic characteristics of Lhasa.
There are 33 kinds of tree species in Tibet, such as pine, fir, spruce, cypress, hardwood, and softwood (Luo and Yang, 2012). According to the data of 119 parks and gardens in the built-up area in 2019 reported by the Lhasa Municipal Garden Bureau, based on the frequency of the distribution statistics of the five types of spatial trees in the square, park, garden, and residential areas and the street trees, the top 10 trees with the highest frequency are Platycladus orientalis, Picea asperata, Ulmus pumila, willow, Prunus cerasifera, Euonymus japonicus, Populus tomentosa, Ligustrum vicaryi, Sabina chinensis, and Cedrus deodara. The frequency of occurrence is shown in Figure 3.
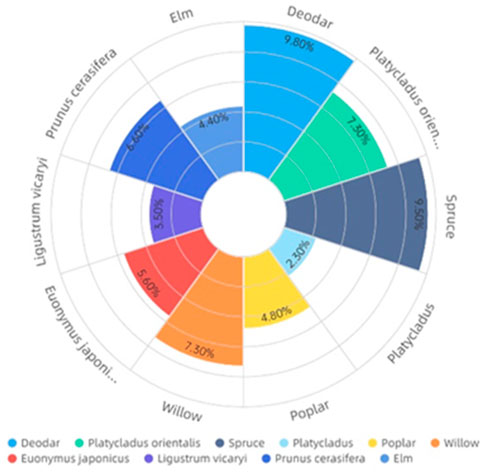
FIGURE 3. Statistical chart of commonly used arbors in Lhasa.
The research framework is shown in Figure 4: 1) Through field investigation and field measurements, the relationship between the main morphological indexes of trees and the thermal environmental parameters and microclimate evaluation indexes was briefly explored, which laid the foundation for the determination of the orthogonal test factors. 2) Based on the abovementioned study, the key morphological indicators were identified, and the final test program was determined by an orthogonal Table. 3) Through the three-dimensional urban microclimate simulation software ENVI-met 4.4.3 (Michael Bruse, Mainz, Germany), the microclimate simulation of the test scheme was carried out to clarify the influence of the different morphological indexes of the trees and their interaction on the thermal comfort of the space below the trees. 4) Taking the physiological equivalent temperature (PET) as the optimization objective, the optimization scheme of the synergistic effect of the tree morphological indexes in Lhasa was determined by assessing the length of time when the test scheme was in the comfort range, and the optimized design strategy was proposed.
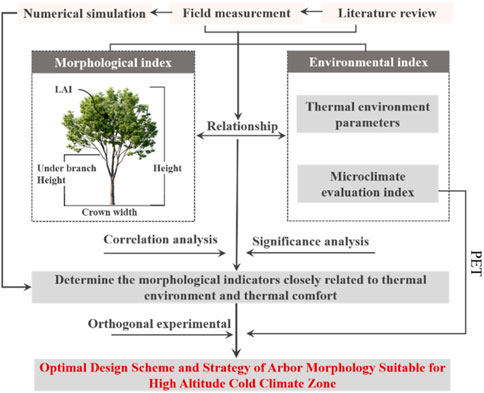
FIGURE 4. Research framework.
The field experiment was conducted over 2 days on August 16 and 17, 2021. The climate conditions were ideal, the weather was cloudy and sunny, and there was a breeze. The experimental sites were selected in Zongjiao Lukang Park and Luobulinka Park in Lhasa (Table 1). Luobulinka Park is located in the western suburbs of Lhasa and includes nearly 100 kinds of plants commonly used in Lhasa, which is conducive to the selection of tree species. Zongjiao Lukang Park is located in the center of Lhasa City. The park has a large area, many tree species, and stable local microclimate conditions, making it easy to select individual trees in an open environment for experiments. Both experimental sites met the requirements of this experimental environment.
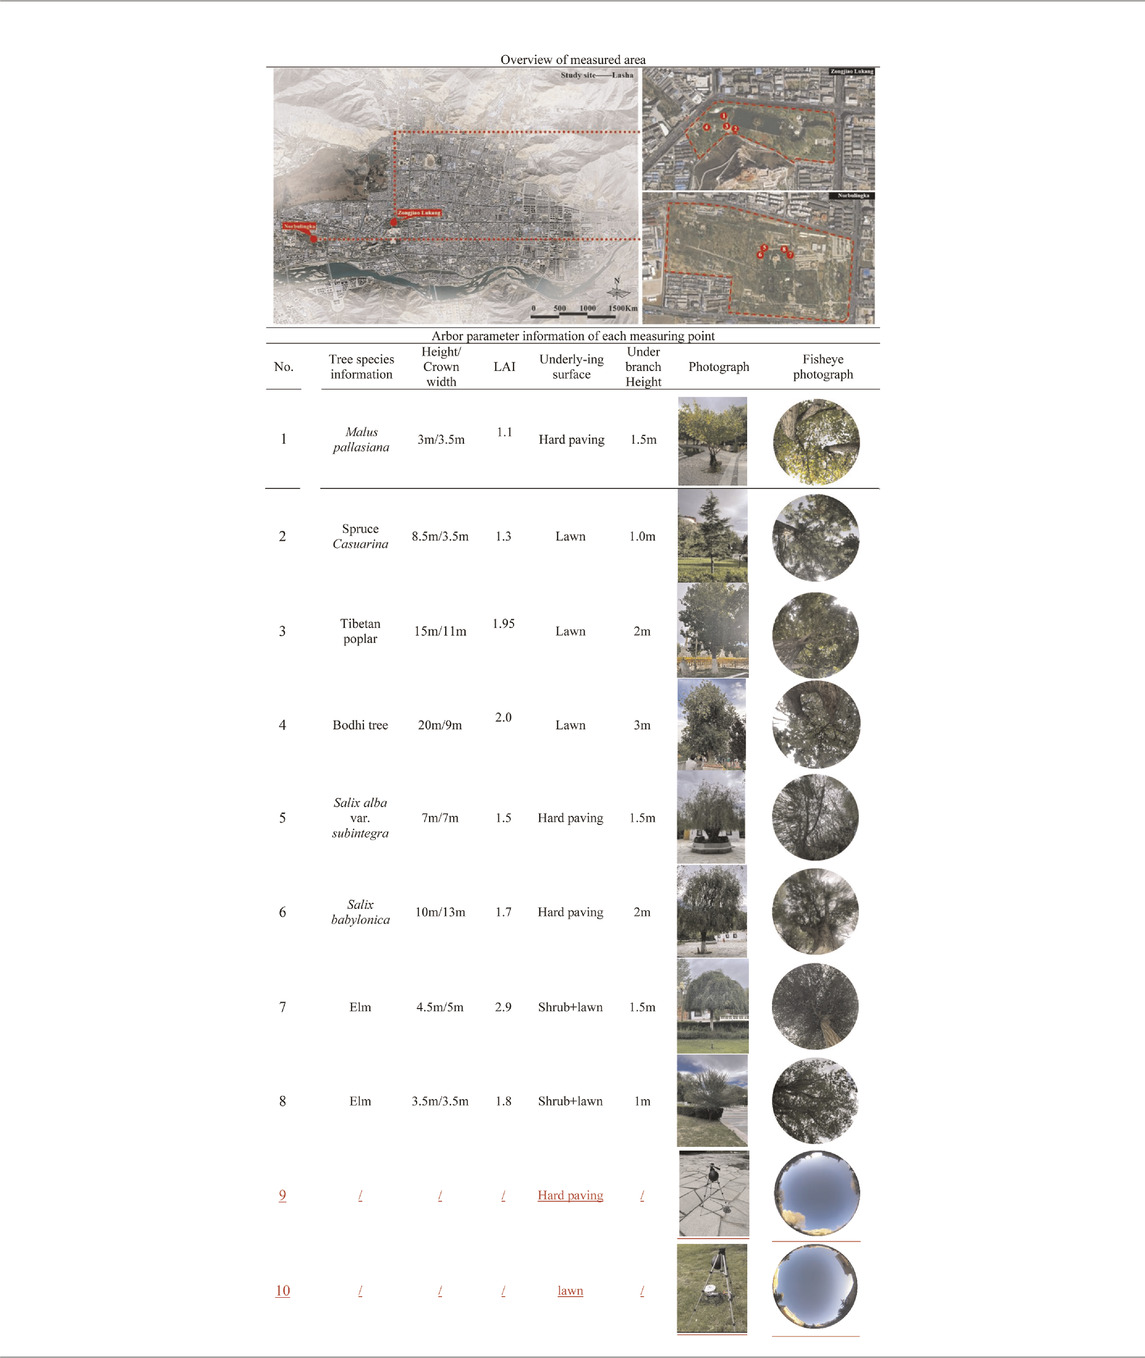
TABLE 1. Measuring point information.
In the selection of the measured tree species, based on the local tree species, according to the field investigation, seven kinds of trees were selected for the experiment, i.e., Salix alba var. subintegra, Salix babylonica, elm, Malus pallasiana, spruce, Tibetan poplar, and Bodhi trees. A total of eight trees were selected as test trees, and four trees were selected in Zongjiao Lukang Park, which were measuring points 1, 2, 3, and 4. Four trees were selected in Roblinka Park as measuring points 5, 6, 7, and 8. In addition, to verify the improvement effect of trees on the surrounding microclimate, an unshaded open space control point was set up in each of the two test areas, which were measuring points 9 and 10. The specific tree parameters of each measuring point are shown in Table 1:
Many studies have shown that height, crown width, LAI, and under branch height are the key factors through which trees improve the outdoor microclimate. Therefore, according to the four aspects of the classification tests, this study conducted a comparative analysis of the tree morphological indicators. To ensure the accuracy of the test analysis, when comparing one of the variables, the parameters of the remaining variables should be controlled to be basically similar. In this paper, the influence of height of trees on the thermal environment was explored through measuring points 1, 2, the influence of under branch height of trees on the thermal environment was explored through measuring points 3 and 4, the influence of crown width of trees on the thermal environment was explored through measuring points 5 and 6, and the influence of LAI on the thermal environment was explored through measuring points 7 and 8.
1) microclimate environment
The microclimate measuring instruments and specific parameters used in the experiment are shown in Table 2. All instruments met the ISO7726 standard. The measurements were collected at a distance of 1.5 m from the shaded center of each measuring point. Due to the limitation of the test instruments and personnel, the measurement was carried out by combining fixed-point observation and flow observation. Before data acquisition, the instrument was first opened and kept stable for 10 min to ensure the accuracy of the test.
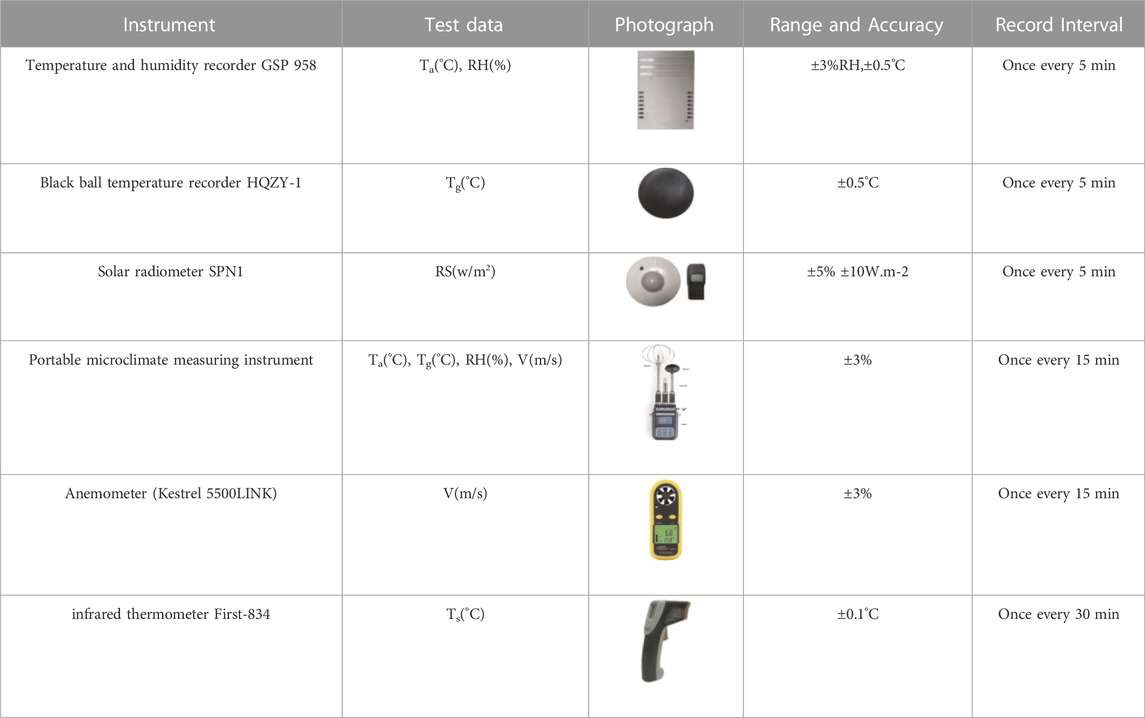
TABLE 2. Parameters of the measurement instruments.
2) physical indicators of trees
The LAI of trees was measured by taking photographs with a fisheye lens in four directions upward from east to west and north to south, near the lower trunk of the trees, and then the measured data were processed using CANEYE LAI V6. 4.91 (French National Institute for Agriculture Research, Toulouse, France) and input into Plant Canopy Analysis System software to calculate the average value of the LAI obtained from the photographs to obtain the LAI of each tree (Wang et al., 2018). The tree heights were calculated using a rangefinder to calculate the vertical distance from the apex of the tree canopy to the ground. The crown widths of the trees were averaged by calculating the distance between the long and short axes of the tree canopies using a tape measure. The height under the branches of the trees was calculated using a distance meter to calculate the vertical distance from the bottom of the crown to the ground. The abovementioned physical morphological indexes of trees, except for the LAI, were repeated three times and the average value was calculated to reduce the error.
The orthogonal experimental design method is used to study the multi-factor multi-level design method according to the orthogonality from a large number of comprehensive tests to select a representative sample for experimental analysis, which can effectively reduce the number of tests (He et al., 2002). On the basis of a field investigation and field measurements, this study further conducted orthogonal experiments to explore the impact of the various morphological indicators of trees and their interaction effects on thermal comfort. The specific steps are shown in Figure 5. The range analysis method was used to analyze the primary and secondary effects of each factor on the outdoor thermal comfort evaluation index (PET) and the optimal level. The variance analysis method was used to determine the significance of each factor and its interaction with respect to PET. In addition, the concept of the contribution rate (Huang and Guan, 2010) was introduced to measure the specific influence of each factor on the test index. The contribution rate is shown as Eq. 1:
In the formula,
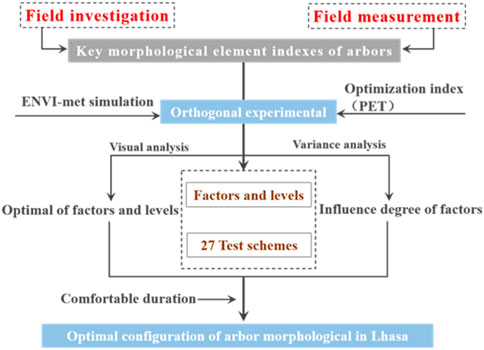
FIGURE 5. Flow chart of orthogonal test optimization.
In recent years, mean radiation temperature (Tmrt) and PET have been widely used in the evaluation of the outdoor microclimate and human comfort (An et al., 2021; Kenawy and Elkadi, 2021).
Physiologically equivalent temperature is a human biometeorological parameter that describes individual thermal perception. It was proposed by Mayer and Hoppe based on the Munich personal energy balance model (MEMI) (Hoppe, 1999). This article uses Rayman software to calculate PET, which can be corrected at low pressure and high altitude. In the process of calculation, it is necessary to input the longitude, latitude, altitude, air temperature, relative humidity, wind speed, Tmrt, and other parameters of the region. According to the thermal comfort and thermal sensation grading table of PET, when PET is at 18°C–23°C, the human body feels comfortable. (Mclaughlin and Walsh, 1998).
Tmrt refers to the average temperature of the surface around the environment on the human body, including the sum of long-wave radiation and short-wave radiation absorbed by the human body. In this study, Tmrt is calculated by the measured global temperature, air temperature, and wind speed (Kántor and Unger, 2011), as shown in Eq. 2:
where Tmrt is the average radiation temperature, °C; Tg is the black ball temperature, °C; Ta is the air temperature, ◦C; Va is wind speed, m/s; D is the diameter of the black ball, m (the standard black ball with d = 0.15 m is used in this paper); and ε is the emissivity of the black sphere (0.95 in this paper).
Since the ALBERO tree modeling module in ENVI-met simulation software cannot directly input the LAI value, the LAI value can only be represented by the LAD of the tree model. Therefore, this paper uses the LAI and LAD empirical conversion formula proposed by Lalic et al. for calculation, as shown in Eq. 3 (Lalic and Mihailovic, 2004):
In the formula, h is the height (m), L (z) is the LAD at height z (m2/m3), and Zm is the height (m) corresponding to the maximum LAD (Lm).
This study used IBM SPSS.22 statistical analysis software and EXCEL software to conduct statistical analysis of the experimental data. First, the overall changes of thermal environment parameters and thermal comfort during the measurement of measured data are described by descriptive statistical analysis. Then, the relationship between the morphological indexes of trees and the thermal environment and thermal comfort of the shaded space under the trees was evaluated by Pearson correlation method and significance analysis method.
The thermal environmental parameters of each measuring point in summer are shown in Table 3. On the whole, compared with the control measuring points 9 and 10, the fluctuation range of the thermal environmental parameter values of the tree measuring points was small, and the spatial thermal environment under the tree changed more stably and had a better spatial thermal environment. Based on a comparison of the thermal environment of tree spaces with different morphological indicators, the thermal environment did not show obvious characteristics due to the complexity of changes in the environment around the space. To sum up, the changes in the morphological indicators of trees affected the thermal environment of the space below the trees to different degrees.
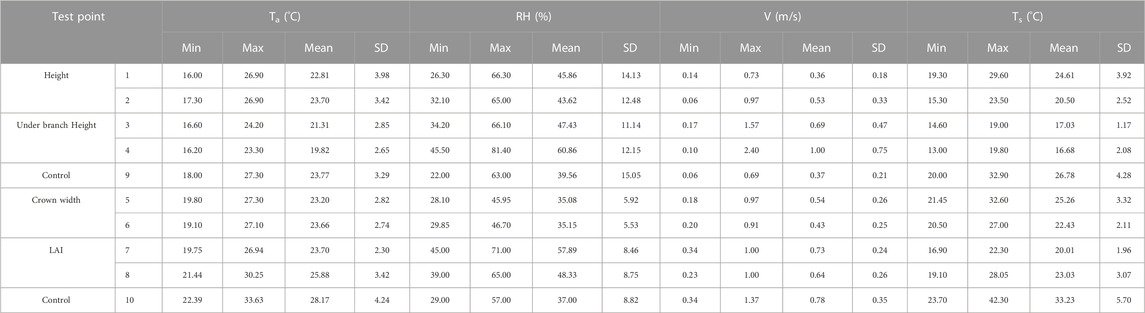
TABLE 3. Description of air temperature, relative humidity, wind speed and surface temperature.
Table 4 shows the calculated values of the thermal environmental parameters at each measuring point in summer. Compared with the control measuring points 9 and 10, the Tmrt and PET fluctuation range of the tree measuring point was smaller, and the space under the tree was more comfortable and stable in terms of thermal changes. By comparing the thermal comfort of tree space with different morphological indicators, the spatial thermal comfort of measuring points 2 and 4 with higher tree height and branch height is better than that of measuring points 9 and 10 without shading. And the spatial thermal comfort of measuring points 6 and 7 with larger crown width and LAI is better than that of measuring points 9 and 10 without shading.
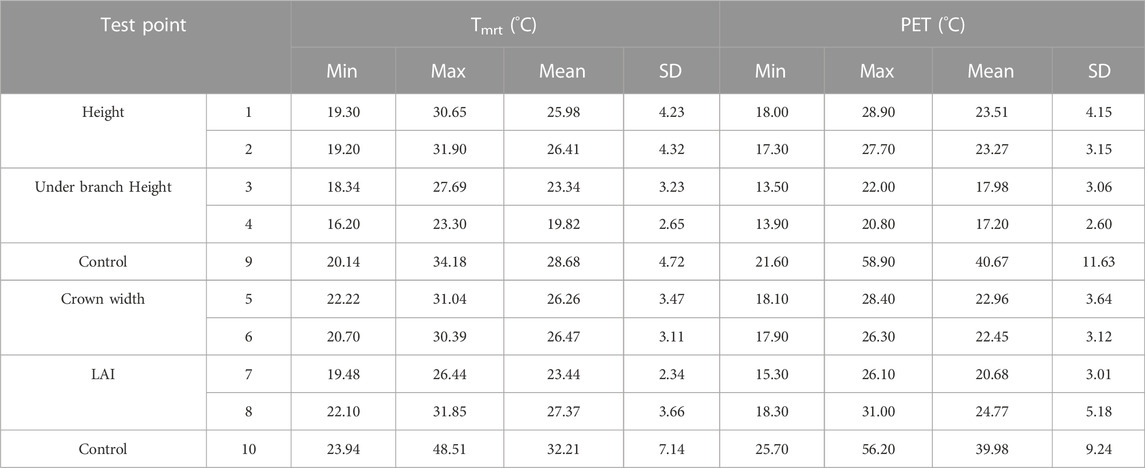
TABLE 4. Description of Tmrt and PET.
Pearson correlation analysis (Table 5) was conducted on the morphological indicators of the trees and the thermal environmental parameters. The Sig. value is a test significance index. When the significance test p < 0.05 or p < 0.01, the relevant results (R) can pass 95% or 99% significance test, the relevant results (R) have a * said significant at 0.05 level, there are two * said significant at 0.01 level (Li, 2004). The results showed that in summer, the height and LAI of trees were significantly correlated with the thermal environmental parameters. The height of trees had the highest correlation with the surface temperature (Ts), which was significantly positive. Tree height negatively correlated with air temperature (Ta), and positively correlated with the relative humidity (RH) and wind speed (V). LAI was negatively correlated with SR, Ta, Ts, and V and positively correlated with RH. Compared with the height and LAI of trees, the correlation between the crown width, under branch height, and thermal environmental parameters of the trees was weak, crown width was negatively correlated only with Ts, and under branch height was positively correlated only with RH.
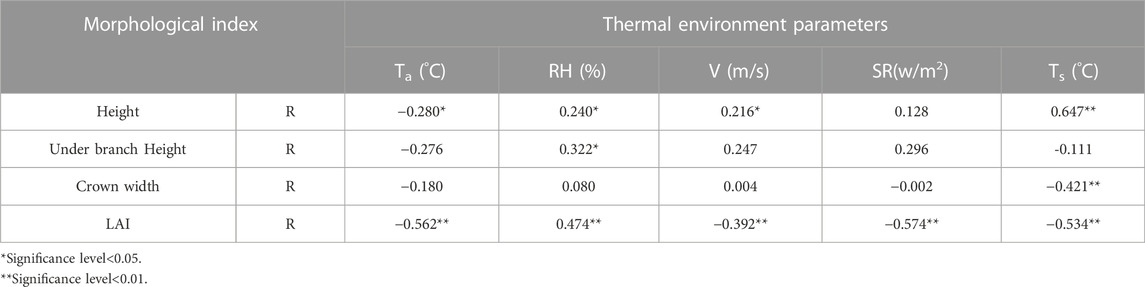
TABLE 5. Correlation between arbor morphological indexes and thermal environmental parameters.
By analyzing the significance of the effect of the tree morphological indexes on Tmrt and PET, the influence of different tree shape parameters on thermal comfort was determined. Table 6 shows that in summer, tree crown width (sig. = 0.019) and LAI (sig. = 0.001) had significant effects on Tmrt, while height (sig. = 0.284) and under branch height (sig. = 0.052) had no significant effects on Tmrt. The tree height (sig. = 0.004) and LAI (sig. = 0.002) had significant effects on PET, while the crown width (sig. = 0.184) and the under branch height (sig. = 0.570) had no significant effects on PET.
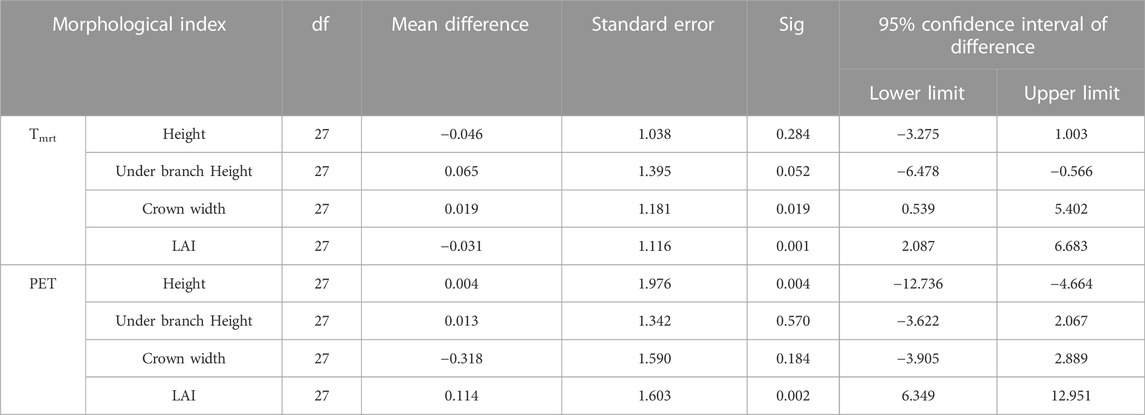
TABLE 6. Significance analysis of different morphological indexes of arbors on Tmrt and PET.
In general, the LAI, height, and crown width of trees had a significant impact on the thermal comfort of the surrounding environment, while the under branch height had a relatively small impact. Combined with the actual observation, the under branch height mainly affected the position of a shadow but did not affect the size of a shadow, so the regulation of the thermal environment was small. As there will be some error effects in the field measurement, this study further explored the impact of key morphological indicators and their interactions on the thermal comfort of the surrounding environment through numerical simulation.
Based on the abovementioned research, it can be concluded that the LAI, height, and crown width of trees have a strong impact on the thermal environment and thermal comfort of the surrounding space. In addition, since the morphological indicators of trees also have a significant impact on Tmrt, and the nature of the ground under the trees is also one of the important factors affecting thermal comfort, this paper further conducted orthogonal tests on four factors, namely, LAI (A), height (B), crown width (C), and ground reflectance (D), as well as a numerical simulation of the test scheme. In this paper, PET was used as the thermal environment evaluation index, and the high-frequency period of outdoor activities of local residents in summer was selected for the comprehensive optimization design of the tree morphology index. The simulation results were subject to a height of 1.5 m in the shaded space under a tree.
The average LAI of PET in the comfort zone in Lhasa is one to three, and the height of trees is 6.5–20.0 m (Lalic and Mihailovic, 2004). In combination with the average value of the measured tree physical morphology indexes, the factors and levels of the orthogonal test were determined, as shown in Table 7.
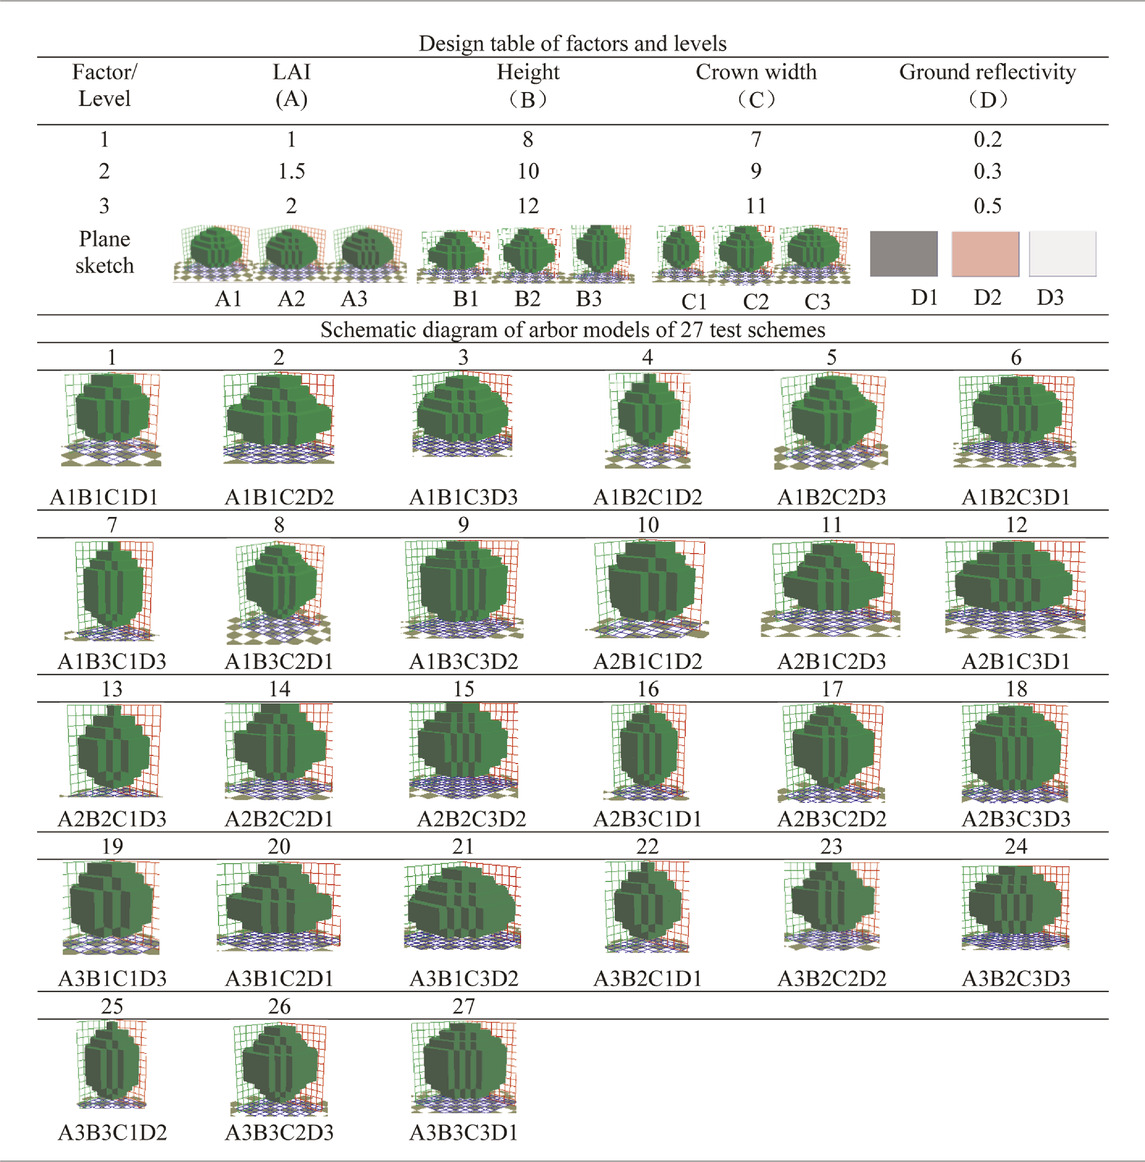
TABLE 7. The information of orthogonal test.
In this orthogonal experiment, considering the influence of the four selected factors and their interactions on the microclimate and thermal comfort, the orthogonal experiment standard table L27 (313) was used to prepare the test plan. For the selected four factors and three levels, if the comprehensive test was carried out 81 times, only 27 simulation tests could represent the results of the comprehensive test after using the orthogonal test method. The tree model of the simulation test scheme is shown in Table 7.
To ensure the universality and practical significance of the study, this paper selected the meteorological parameters of typical meteorological days that best represented the seasonal climate characteristics of Lhasa as the initial boundary conditions of the simulation test. Through statistical analysis of the meteorological parameters of Lhasa over the years, it was concluded that the hottest month of a typical meteorological year in Lhasa is June, and a typical meteorological day in summer is June 21 (Ministry of Housing and Urban-Rural Development of the People 's Republic of China, 2014). Therefore, the subsequent simulation used the meteorological data on June 21 as the simulation boundary condition. Since the wind speed data were only collected four times a day, the average wind speed and high-frequency wind direction in June were taken as the wind speed value and wind direction at 10 m. The specific boundary condition settings are shown in Table 8.
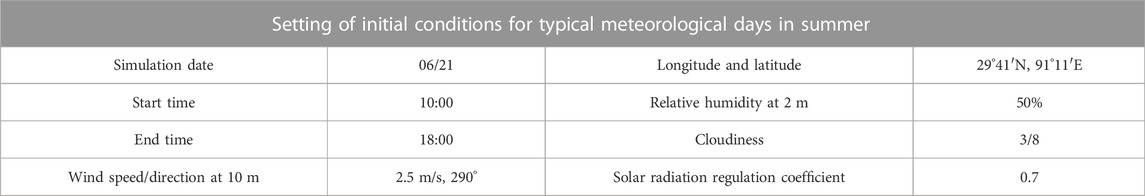
TABLE 8. Setting of simulation boundary conditions.
The visual analysis method was used to analyze the primary and secondary effects and optimal level of each factor to calculate the total PET value and average value of each factor level, as well as draw the PET trend chart (Figure 6) and orthogonal test results table (Table 9). It can be seen from the overall trend of PET change that in summer the average PET value corresponding to each factor was in a slightly cool range in the morning, the canopy width and ground reflectivity of trees had no obvious impact, and at noon and in the afternoon, each factor was in a comfortable and slightly warm range, and the overall average PET value in the daytime was in a comfortable range. The influence degree of each morphological index of trees on PET in the morning, noon, and afternoon was compared, and the range (R) was analyzed. The greater the R, the greater the influence on PET. The greater the R, the greater the impact on PET. It can be seen that the order of the comprehensive impact degree was LAI > height > crown width > ground reflectivity. It is worth noting that at noon, the height of a tree had a greater impact on the shaded space under the trees than LAI.
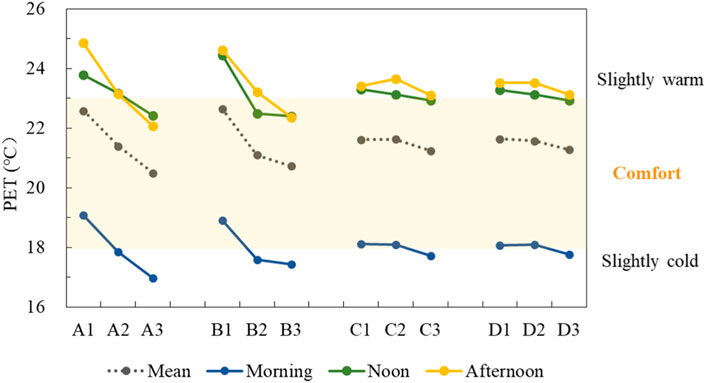
FIGURE 6. PET trend of outdoor public activities in residential areas in summer.
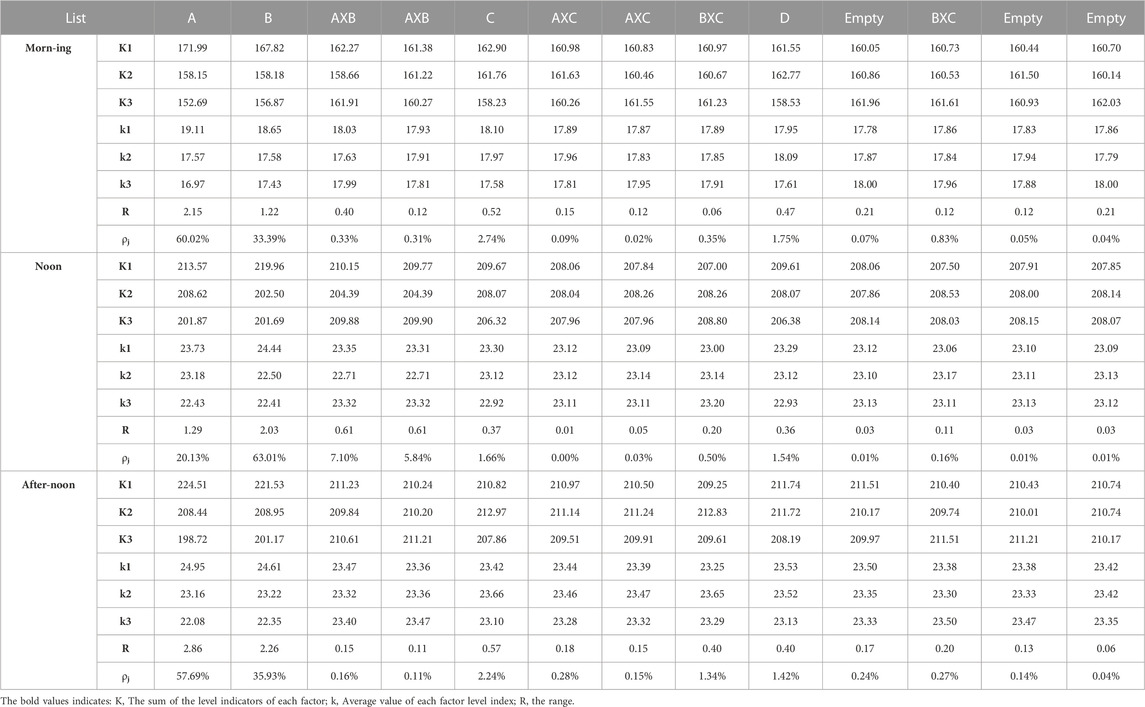
TABLE 9. Results of orthogonal test in summer.
The following was conducted: Each factor level index K1, K2, and K3 and each average value k1, k2, and k3 were compared, and the ranking of optimal level of each factor was analyzed. Taking the comfort range of PET as the optimization target in summer, it can be seen that 1) LAI of tree: LAI = 1 in the morning and LAI = 2 at noon and in the afternoon were optimal, and the order was LAI= > LAI = 1.5 > LAI = 1. 2) The height of a tree: height = 8 m in the morning and height = 12 m at noon and in the afternoon were optimal, and the order of its levels was height = 12 m > height = 10 m > height = 8 m. 3) Crown breadth: crown breadth = 7 m in the morning and crown breadth = 11 m at noon and in the afternoon were optimal, and the order of its levels was crown breadth = 11 m > crown breadth = 7 m > crown breadth = 9 m. 4) Ground reflectivity: ground reflectivity of 0.3 in the morning and 0.5 at noon and in the afternoon was optimal, and the order of its levels was ground reflectivity of 0.5 > ground reflectivity of 0.3 > ground reflectivity of 0.2.
The significance analysis of each influential factor is shown in Table 10. The larger the F value in the table, the more significant the influence of the selected factors and levels on PET. In summer, LAI, height, crown width, ground reflectivity, the values of the interaction between LAI and height, and the Sig of interaction between height and crown width of trees in the morning were less than 0.05, indicating a significant impact on PET in the space below the tree. According to the F value, the significant order of the influential factors was LAI > height > crown width > ground reflectance > interaction between height and crown width > interaction between height and LAI. At noon, the solar radiation increased, and the interaction between various factors was significantly enhanced. The significant order of the factors was height > LAI > interaction between LAI and height > crown width > ground reflectance > interaction between height and crown width. In the afternoon, the interaction between the factors was weakened, and the significant order of the factors was the same as that in the morning, but the interaction between LAI and height was no longer significant.
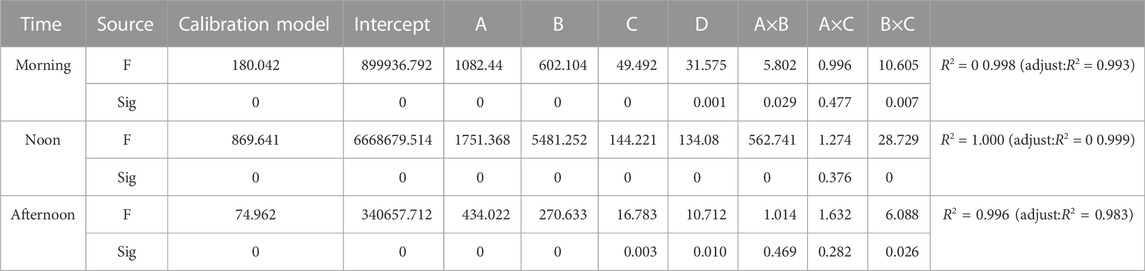
TABLE 10. Analysis of variance results of various factors in summer.
From Table 11, the contribution ρj of each influencing factor and its interaction with PET in the space below the tree are as follows: 1) LAI and the height of trees had the greatest impact on PET, and they were higher in the morning and evening. 2) Compared with the other two factors, the influence of crown width and ground reflectivity on PET was smaller. 3) Comparing the influence of three interactions on PET, the interaction between LAI and height was the most obvious, reaching 7.10% at noon, while the interaction between LAI and crown width was not significant.
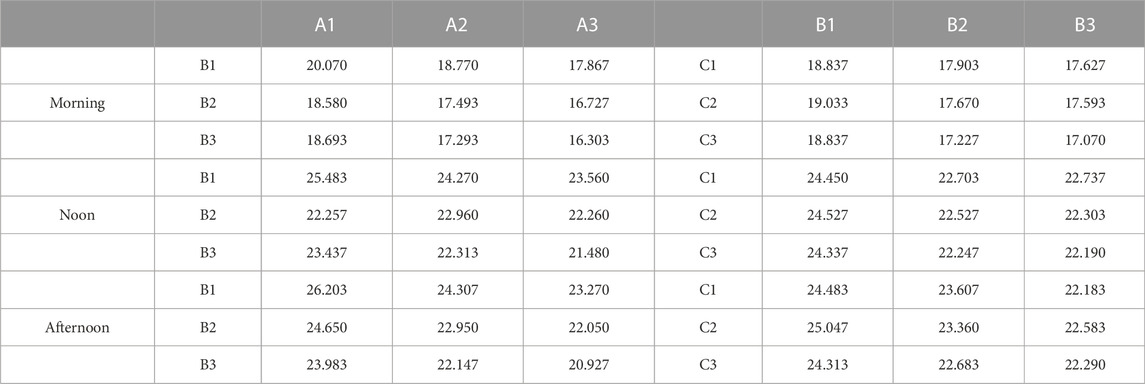
TABLE 11. Calculation of interactions between A and B, B and C in summer.
According to the above, the interaction between LAI and crown diameter was not significant, so only the interactions between LAI and height (A and B) and between height and crown diameter (B and C) were considered. The interaction calculation results of the three periods in summer are shown in Table 11. Taking the comfort range of PET as the optimization target, it can be seen that among the best combinations of LAI and tree height, the combination of A1B1 in the morning and A3B3 at noon and in the afternoon was the best. In general, the combination of A1Bi and B3Ai (i = 1, 2, 3) had high thermal comfort. Among the best combinations of height and crown width, B1C2 in the morning and B3C3 at noon and in the afternoon were the best. In general, B1Ci and B3Ci (i = 1, 2, 3) had higher thermal comfort.
The 27 test schemes were comprehensively optimized, with the longest time in the comfort range as the optimization target, and the PET value of each test scheme was determined as the length of time in the comfort range within the simulation time. The results are shown in Figure 7. In summer, the best model was No. 27 A3B3C3D1, that is, LAI = 2, height 12 m, crown width 11 m, and ground reflectivity 0.2, followed by No. 16, 25, and 26 models, and the corresponding combination of tree morphology indicators was A2B3C1D1, A3B3C1D2, and A3B3C2D3, that is, LAI = 1.5, height 12 m, crown width 7 m, ground reflectivity 0.2; LAI = 2, height 12 m, crown width 7 m, ground reflectivity 0.3; and LAI = 2, height 12 m, crown width 9 m, ground reflectivity 0.5.
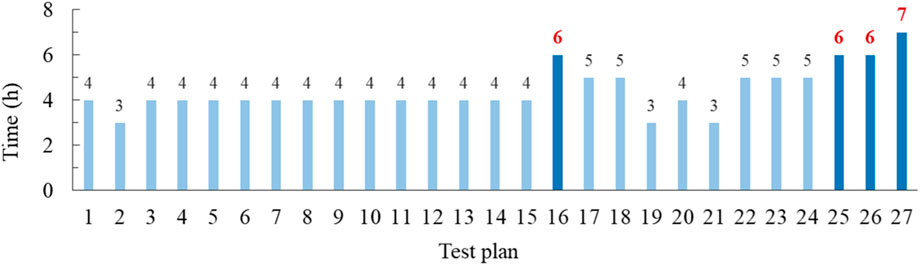
FIGURE 7. Total duration of each test scheme in thermal comfort range in summer.
Previous studies have shown that tree crown plays a key role in cooling performance (de Abreu-Harbich et al., 2015). In this paper, trees with different morphological characteristics were explored. The results showed that in summer, the LAI of trees played a key role in the thermal environment and thermal comfort of the shaded space under trees, followed by the height and crown width of trees, and the improvement potential of the under branch height was relatively weak. Previous studies have shown that the attenuation of solar radiation is a key factor for trees to improve thermal comfort (Morakinyo et al., 2018). Considering the special plateau climate characteristics of Lhasa, the solar radiation is strong and the sunshine duration is long. The research in this paper proves that increasing the LAI of trees can reduce the solar radiation intensity, air temperature, surface temperature and increase the relative humidity of the shaded space under the trees, but also hinders the wind speed. At the same time, there was a direct relationship between LAI, Tmrt, and PET benefits because a larger LAI can attenuate more incident short-wave radiation and reduce the air temperature and surface temperature under the tree. As an important factor of the energy exchange of the underlying surface, the ground temperature can also affect the long wave radiation under the tree, compensate for the adverse impact of reduced wind speed, and improve the thermal comfort level of the space under a tree. In addition, transpiration of trees is mainly carried out through leaves. The more leaves, not only can increase the humidity of the surrounding environment, but also can improve the thermal comfort level of the space under the tree. This conclusion is similar to that obtained in the research of Morakinyo (Morakinyo et al., 2018) and Zheng (Zhao et al., 2016), et al. in hot and humid climate areas, Wang (Sanusi et al., 2017) and Qin (Qin et al., 2014), et al. in cold climate areas, and Teshnehdel, S (Teshnehdel et al., 2020), et al. in arid climate areas. It can be seen that under different climatic conditions, the conclusion that among the three morphological indicators of LAI, height, and crown width, LAI has greater potential to improve the thermal environment and thermal comfort in the shaded space under trees tends to be consistent in different climatic regions. The height of trees directly affects the height of tree crowns. Trees with similar crown size and LAI will form different shaded areas and widths (SVF) under trees, thus bringing different levels of comfort to people under trees. Besides, the cooling effect of vegetation also varies with the time of day. Meili, N. (Meili et al., 2021). proposed that vegetation has an obvious diurnal cycle on the impact of global thermal climate index (UTCI), and tree coverage is more effective in reducing UTCI in the daytime. Zhang, J (Zhang et al., 2022b) put forward that LAI shows significant microclimate regulation effect in the evening.Our research results also confirm this conclusion. Different morphological indicators of trees have different effects on PET in a day. LAI and crown width contribute most to PET in the morning and afternoon, and tree height contributes most to PET at noon.Due to the strong solar radiation in Lhasa during the day, trees play a greater role in regulating thermal comfort through their own shape and respiration and transpiration. In addition to considering the improvement effect of single variable on thermal environment and thermal comfort, this paper further confirms that the interaction between arbor height, LAI, and crown width affects the thermal comfort of the space under trees. Zhang et al. (Zhang and Gou, 2021) proposed a new index, the ratio of crown diameter to branch position height (D/PH), which quantifies the impact of the interaction between the height and crown width of trees on Tmrt improvement. With regard to the interaction between tree canopy and LAI, studies have shown that the larger the crown diameter, the more leaves there are, which can improve the efficiency of plant biological effects, such as photosynthesis (Bard and Fox, 1995) and transpiration (Pruppacher and Klett, 1999). However, the results of this study showed that the interaction between the tree canopy and LAI had no significant effect on improving thermal comfort.
In addition to considering the morphological indicators of trees and their interaction to improve the thermal environment and thermal comfort, this study also proposed the optimal combination of tree morphological indicators suitable for Lhasa: LAI = 2, height 12 m, crown width 11 m, and ground reflectivity 0.2, followed by LAI = 1.5, height 12 m, crown width 7 m, ground reflectivity 0.2; LAI = 2, height 12 m, crown width 7 m, ground reflectivity 0.3; and LAI = 2, height 12 m, crown width 9 m, ground reflectivity 0.5. The optimal combination of arbor morphological indexes in Lhasa has been less explored in previous urban microclimate studies.
Based on the abovementioned analysis, the optimal design strategy of tree morphology suitable for high-altitude cold climate conditions is proposed:
(1) The LAI of trees should not be too high or too low, which can take into account the different needs of thermal comfort in the morning and afternoon. (2) The use of trees with a large canopy can effectively increase the comfortable area of the space under the trees and improve the comfort level. When planting trees, the spacing and number of trees can be controlled to increase the size of the tree crown in a disguised way to increase the area of the space under the trees in a comfortable range. (3) Under the condition that the line of sight is not blocked, to a certain extent, raising the height of trees can effectively improve the comfort level of the space under trees. At the same time, attention should be paid to the interaction between the height and LAI and the height and crown width of trees to maximize the comfort area of the space under the trees. (4) In addition, in the selection of tree species, the tree species suitable for Tibet should be selected, and the height, crown width, and LAI of the trees should be combined with three important factors for planting in different regions to play the best role in microclimate regulation.
In general, it will be helpful for landscape design to select appropriate morphological characteristics for urban green space according to the improvement effect of trees on the microclimate. However, this study still has some limitations. First, in terms of actual measurement, it is difficult to accurately control the single factor variable of morphological indicators when selecting the sample size, and the sample size is small. Second, in the numerical simulation, because the ALBERO tree modeling module of ENVI-met software cannot precisely model the tree trunk, branches, and leaves, it will have a certain impact on the experimental results. In addition to the four morphological indicators mentioned in this paper, the thermal environment and thermal comfort of the space under the tree are also affected by other factors, such as tree species, crown shape, diameter at breast height, and layout. Therefore, to better guide landscape design, the research on these factors is also a key issue that needs to be considered and deepened in future research.
This study investigated the impact of tree morphological indicators on the outdoor microclimate under the characteristics of a high-altitude cold climate and drew the following four conclusions:
1) Compared with the control point of a treeless open space, the change in the thermal environment and thermal comfort under trees was more stable and had a better spatial thermal environment.
2) The LAI of trees is the key factor affecting the thermal environment and thermal comfort of the space under the trees, followed by the relatively weak improvement potential of the height, crown width, and under branch height.
3) The interaction between height, LAI, and crown width affects the thermal comfort of the space under the tree.
4) In summer, the optimal combination of tree shape indicators in Lhasa was LAI = 2, height 12 m, crown width 11 m, ground reflectivity 0.2, followed by LAI = 1.5, height 12 m, crown width 7 m, ground reflectivity 0.2; LAI = 2, height 12 m, crown width 7 m, ground reflectivity 0.3; and LAI = 2, height 12 m, crown width 9 m, ground reflectivity 0.5.
The original contributions presented in the study are included in the article/supplementary material, further inquiries can be directed to the corresponding author.
Proposal and design of research proposition,YZ, LC, CS and YF; Field investigation, data simulation, and data analysis, LC and CS; Paper writing, LC, CS and YX; All authors have read and agreed to the published version of the manuscript.
The work was supported by the National Natural Science Foundation of China “Research on Optimization and Design of Urban Social Living Space in Tibet Based on Microclimate Improvement” (Project No.51578453), the Sichuan Regional Innovation Cooperation Project “The Key Technologies and Demonstration Application of Tibetan Village Human Settlements Improvement Under Extreme Climate and Fragile Ecological Environment Constraints” (Project No.2021YFQ0040) and the scientific research projects of Sichuan Provincial Architectural Design and Research Institute(SADI) “Research on technical measures of carbon neutral building design” (Project No. KYYN202107).
The research was supported by the meteorological data provided by the Meteorological Bureau of the Tibet Autonomous Region. And we have polished the manuscript through Letpub.
The authors declare that the research was conducted in the absence of any commercial or financial relationships that could be construed as a potential conflict of interest.
All claims expressed in this article are solely those of the authors and do not necessarily represent those of their affiliated organizations, or those of the publisher, the editors and the reviewers. Any product that may be evaluated in this article, or claim that may be made by its manufacturer, is not guaranteed or endorsed by the publisher.
An, L., Hong, B., Cui, X., Geng, Y., and Ma, X. (2021). Outdoor thermal comfort during winter in China's cold regions: A comparative study. Sci. Total Environ. 768, 144464. doi:10.1016/j.scitotenv.2020.144464
Bard, A. J., and Fox, M. A. (1995). Artificial photosynthesis: Solar splitting of water to hydrogen and oxygen. Acc. Chem. Res. 28 (3), 141–145. doi:10.1021/ar00051a007
de Abreu-Harbich, L. V., Labaki, L. C., and Matzarakis, A. (2015). Effect of tree planting design and tree species on human thermal comfort in the tropics. Landsc. Urban Plan. 138, 99–109. doi:10.1016/j.landurbplan.2015.02.008
Feng, X., Zhang, Y., Xu, G., and Huang, C. (2021). Observation and model optimization for transpiration cooling of urban arbor in the hot-humidRegion. Build. Sci. 37 (02), 27–37+108. doi:10.13614/j.cnki.11-1962/tu.2021.02.05
Gao, Y., Huang, H., Ye, J., Li, Z., and Zheng, Y. (2022). Influence of landscape naturalness degree in campus green spaces on human physiological and psychological indicators. J. Chin. Urban For. 20 (04), 103–109.
Guo, W., Cheng, B., Wang, C., and Tang, X. (2022). Tree planting indices and their effects on summer park thermal environment: A case study of a subtropical satellite city, China. Indoor Built Environ. (1), 31109–31120. doi:10.1177/1420326X20977614
He, S., Wen, Z., and Lou, T. (2002). Experimental design and data processing. Changsha: National University of Defense Technology Press.
Hoppe, P. (1999). The physiological equivalent temperature–a universal index for the biometeorological assessment of the thermal environment. Int. J. Biometeorology 43 (2), 71–75. doi:10.1007/s004840050118
Huang, C., and Liu, Q. (2022). Interpretation of IPCC AR6 on climate change and human health. Clim. Change Res. 18 (04), 442–451.
Huang, R., and Guan, Y. (2010). Statistical analysis of data-SPSS principle and application. Beijing: Higher Education Press.
IPCC (2022). Climate change 2022: Impacts, adaptation and vulnerability. Cambridge: Cambridge University Press.
Irmak, M. A., Yilmaz, S., Mutlu, E., and Yilmaz, H. (2018). Assessment of the effects of different tree species on urban microclimate. Environ. Sci. Pollut. Res. 25, 15802–15822. doi:10.10.1007/s11356-018-1697-8
Kántor, N., and Unger, J. (2011). The most problematic variable in the course of human-biometeorological comfort assessment — The mean radiant temperature. Central Eur. J. Geosciences 3 (1), 90–100. doi:10.2478/s13533-011-0010-x
Kenawy, I., and Elkadi, H. (2021). Effects of cultural diversity and climatic background on outdoor thermal perception at Melbourne city, Australia. Build. Environ. 195, 107746. doi:10.1016/j.buildenv.2021.107746
Kumakura, E., Miyakawa, Y., Sunag, N., Onodera, H., and Fukasawa, T. (2019). Influence of residents’ behaviour on the thermal environment of a common garden path for detached houses in summer. Archit. Sci. Rev. 62, 47–57. doi:10.1080/00038628.2018.1510367
Lalic, B., and Mihailovic, D. T. (2004). An empirical relation describing leaf-area density inside the forest for environmental modeling. J. Appl. Meteorology 43, 6412–6645. doi:10.1175/1520-0450(2004)043<0641:AERDLD>2.0
Langenheim, N., White, M., Tapper, N., LivesleySJ, , and Ramirez-Lovering, D. (2020). Right tree, right place, right time: A visual-functional design approach to select and place trees for optimal shade benefit to commuting pedestrians. Sustain. Cities Soc. 52, 101816. doi:10.1016/j.scs.2019.101816
Li, F., Shi, H., Wei, F., Liu, J., and Feng, X. (2017). Effects on urban local climate of different tree species landscape pattern. J. Henan Polytech. Univ. Sci. 36 (01), 69–74. doi:10.16186/j.cnki.1673-9787.2017.01.012
Lin, B., and Lin, Y. (2010). Cooling effect of shade trees with different characteristics in a subtropical urban park. Am. Soc. Hortic. Sci. 45, 83–86. doi:10.21273/HORTSCI.45.1.83
Liu, H., Lim, J., Thet, B. W. H., Lai, P., and Koh, W. (2022). Evaluating the impact of tree morphologies and planting densities on outdoor thermal comfort in tropical residential precincts in Singapore. Build. Environ. 221, 109268. doi:10.1016/j.buildenv.2022.109268
Liu, Z., Zheng, S., Fang, X., Lu, X., and Zhao, L. (2018). Simulating validation of ENVI-met vegetation model to Ficus microcarpa in hot-humid region of subtropical zone. J. Beijing For. Univ. 40 (03), 1–12. doi:10.13332/j.1000-1522.20170396
Luo, H., and Yang, F. (2012). Tibet’s afforestation tree species selection. Central South For. Inventory Plan. 31 (03), 27–29. doi:10.16166/j.cnki.cn43-1095.2012.03.015
Mclaughlin, S. B., and Walsh, M. E. (1998). Evaluating environmental consequences of producing herbaceous crops for bioenergy. Biomass & Bioenergy 14 (4), 317–324. doi:10.1016/S0961-9534(97)10066-6
Meili, N., Aceroac, A., Peleg, N., Manoli, G., Burlando, P., and Fatichie, S. (2021). Vegetation cover and plant-trait effects on outdoor thermal comfort in a tropical city. Build. Environ. 195, 107733. doi:10.1016/j.buildenv.2021.107733
Ministry of Housing and Urban-Rural Development of the People 's Republic of China (2014). Thermal environment design standard for urban residential areas. Beijing: China Architecture & Building Press.
Morakinyo, T. E., Lau, K. K. L., Ren, C., and Eg, E. (2018). Performance of Hong Kong’s common trees species for outdoor temperature regulation, thermal comfort and energy saving. Build. Environ. 137, 157–170. doi:10.1016/j.buildenv.2018.04.012
Peng, S., Piao, S., Ciais, P., Friedlingstein, P., Ottle, C., Breon, F., et al. (2012). Surface urban heat island across 419 global big cities. Environ. Sci. Technol. 46 (2), 696–703. doi:10.1021/es2030438
Pruppacher, H. R., and Klett, J. D. (1999). Microphysics of clouds and precipitation. J. Atmos. Chem. 32, 420–422. doi:10.1023/A:1000652616430
Qin, Z., Li, Z., Cheng, F., Chen, J., and Liang, B. (2014). Influence of canopy structural characteristics on cooling and humidifying effects of Populus tomentosa community on calm sunny summer days. Landsc. Urban Plan. 127, 75–82. doi:10.1016/j.landurbplan.2014.04.006
Rahman, M. A., Moser, A., Rötzer, T., and Pauleit, S. (2017). Within canopy temperature differences and cooling ability of Tilia cordata trees grown in urban conditions. Build. Environ. 114, 118–128. doi:10.1016/j.buildenv.2016.12.013
Sanusi, R., Johnstone, D., Sanusi, R., Johnstone, D., May, P., and Livesley, S. J. (2017). Microclimate benefits that different street tree species provide to sidewalk pedestrians relate to differences in Plant Area Index. Landsc. urban Plan. 157, 502–511. doi:10.1016/j.landurbplan.2016.08.010
Shinzato, P., and Duarte, D. (2013). Hygrothermal optimisation of museum storage spaces. Energy Build. 136 (44), 169–178. doi:10.1016/j.enbuild.2012.08.043
Tang, Z., Ren, Z., Zhang, H., and He, X. (2017). Cooling effects of urban forest community structure. Chin. J. Appl. Ecol. 28 (09), 2823–2830. doi:10.13287/j.1001-9332.201709.012
Teshnehdel, S., Akbari, H., Di Giuseppe, E., and Brown, R. D. (2020). Effect of tree cover and tree species on microclimate and pedestrian comfort in a residential district in Iran. Build. Environ. 178, 106899. doi:10.1016/j.buildenv.2020.106899
Wang, A., Ren, G., and Qin, Y. (2020). Research on influence of tree shape of city squares on microclimate in semiarid areas. Landsc. Archit. 27 (07), 100–107. doi:10.14085/j.fjyl.2020.07.0100.08
Wang, J., Xiong, Q., Lin, Q., and Huang, H. (2018). Feasibility of using mobile phone to estimate forest leaf area index: A case study in yunnan pine. Remote Sens. Lett. 9 (2), 180–188. doi:10.1080/2150704X.2017.1399470
Wang, Q., Sun, H., and Xie, X. (2022). Landscape optimization for park leisure space based on microclimate comfort. J. Chin. Urban For. 20 (05), 10–15.
Wei, X., Hao, R., Zhang, M., Shen, H., Qiu, Y., and Geng, H. (2019). Microclimate changes with simulated canopy spatial structures. J. Zhejiang A F Univ. 36 (04), 783–792.
Xu, R., He, R., Chen, J., Si, Y., and Que, J. (2020). Comparison of thermal comfort effect between typical palm and broadleaf trees in tropical city. J. Chin. Urban For., 1–13.
Zhang, J., Gou, Z., Cheng, B., and Khoshbakht, M. (2022b). A study of physical factors influencing park cooling intensities and their effects in different time of the day. J. Therm. Biol. 109, 103336. doi:10.1016/j.jtherbio.2022.103336
Zhang, J., and Gou, Z. (2021). Tree crowns and their associated summertime microclimatic adjustment and thermal comfort improvement in urban parks in a subtropical city of China. Urban For. Urban Green. 59, 126912. doi:10.1016/j.ufug.2020.126912
Zhang, J., Khoshbakht, M., Liu, J., Gou, Z., Xiong, J., and Jiang, M. (2022a). A clustering review of vegetation-indicating parameters in urban thermal environment studies towards various factors. J. Therm. Biol. 110, 103340. doi:10.1016/j.jtherbio.2022.103340
Zhang, L., Zha, Q., and Lan, Y. (2018b). Study on cooling effect of residential green space in wuhan. Chin. Landsc. Archit. 34 (04), 47–53.
Zhang, L., Zhan, Q., and Lan, Y. (2018a). Effects of the tree distribution and species on outdoor environment conditions in a hot summer and cold winter zone: A case study in wuhan residential quarters. Build. Environ. 130, 27–39. doi:10.1016/j.buildenv.2017.12.014
Zhao, X., Li, G., and Gao, T. (2016). Thermal comfort effects and morphological characteristics of typical street trees in summer in harbin. Landsc. Archit., 1274–1280. doi:10.14085/j.fjyl.2016.12.0074.07
Zheng, S., Guldmann, J. M., Liu, Z., and Zhao, L. (2018). Influence of trees on the outdoor thermal environment in subtropical areas: An experimental study in Guangzhou, China. Sustain. Cities Soc. 42, 482–497. doi:10.1016/j.scs.2018.07.025
Keywords: high altitude, arbor, morphological indexes, field measurement, orthogonal test optimization, microclimate
Citation: Zhang Y, Chen L, Sun C, Fu Y and Xie Y (2023) An investigation of the influence of the morphological indexes of trees on the outdoor microclimate at high altitude in summer. Front. Environ. Sci. 11:1098966. doi: 10.3389/fenvs.2023.1098966
Received: 15 November 2022; Accepted: 03 January 2023;
Published: 26 January 2023.
Edited by:
Zhonghua Gou, Wuhan University, ChinaReviewed by:
Jian Zhang, Griffith University, AustraliaCopyright © 2023 Zhang, Chen, Sun, Fu and Xie. This is an open-access article distributed under the terms of the Creative Commons Attribution License (CC BY). The use, distribution or reproduction in other forums is permitted, provided the original author(s) and the copyright owner(s) are credited and that the original publication in this journal is cited, in accordance with accepted academic practice. No use, distribution or reproduction is permitted which does not comply with these terms.
*Correspondence: Yunchao Fu, eXVuY2hhb2Z1QGZveG1haWwuY29t
Disclaimer: All claims expressed in this article are solely those of the authors and do not necessarily represent those of their affiliated organizations, or those of the publisher, the editors and the reviewers. Any product that may be evaluated in this article or claim that may be made by its manufacturer is not guaranteed or endorsed by the publisher.
Research integrity at Frontiers
Learn more about the work of our research integrity team to safeguard the quality of each article we publish.