 Qian Sun1,2
 Hao Yuan
- 1Chongqing Southwest Research Institute for Water Transport Engineering, Chongqing Jiaotong University, Chongqing, China
- 2School of Civil Engineering, Chongqing Jiaotong University, Chongqing, China
- 3Chongqing Xike Water Transportation Engineering Consulting Co.,Ltd., Chongqing, China
- 4State Key Laboratory of Hydraulics and Mountain River Engineering, Sichuan University, Chengdu, China
Splashing is the main atomization source for a jet impinging on a liquid layer. Increased understanding of splashing rainfall characteristics can help to reduce the hazard of flood discharge atomization in hydraulic engineering. In this study, the spatial distribution of splashing rainfall caused by a nappe flow impinging on a downstream water cushion was experimentally investigated. Effects of the main hydraulic factors of impingement velocity, unit discharge, and water-cushion depth on splashing were investigated. The shape of splashing rainfall contours was approximately elliptical in horizontal planes. Maximum rainfall intensity was in the surrounding impingement region, and rainfall intensity decreased with an increase in the distance between the impingement center point and measurement points. Splashing rainfall intensity increased with increases in impingement velocity and unit discharge, whereas the opposite was observed with an increase in plunge pool depth. A gamma distribution described rainfall intensity distribution in the longitudinal and vertical direction, whereas a Gaussian distribution described intensity in the transverse direction. A series of empirical relations were proposed.
1 Introduction
As the infrastructure for the development of hydropower resources, hydraulic projects have been constructed or are under construction all over the world (Ho et al., 2017; Tang et al., 2019; Wagner et al., 2019; Lin X. J. et al., 2021; Karami et al., 2022; Shu et al., 2022). In China, the flood discharges of numerous hydraulic projects are characterized by high falling heights, large discharge flows, and narrow valleys (Li et al., 2018). Therefore, the problem of flood discharge atomization is very serious (Yuan et al., 2018). The atomization source mainly plays three parts in hydraulic projects: liquid jet fragmentation in the air, breakup of twin impinging liquid jets, and jet splashing. Liquid jet fragmentation in the air is generic to a high-speed liquid jet moving in initially stagnant air and entraining a large amount of air that leads to a jet breakups into water blocks and droplets (Reitz and Bracco, 1982; Blaisot and Adeline, 2003; Ma et al., 2016). The breakup of twin impinging liquid jets typically changes the jet movement directions and disintegrates into water ligaments and droplets (Yuan et al., 2018). The jet splashing atomization involves the impingement between a liquid jet and a quiescent pool, which includes additional forms of splashing droplets and water mist (Figure 1). This type of atomization is most likely observed in high-head dams. The splashing droplets form an artificial high-intensity rainfall near the impingement zone. With the assistance of nappe and valley winds, droplets diffuse to downstream of and over the dam, with larger droplets settled as rain and smaller droplets transported as mist (Liu et al., 2015). According to field measurements in the Xiluodu hydraulic project with a falling height of 190 m (Du et al., 2017), splashing rainfall intensity exceeds 4700 mm/h, more than 1 km downstream of the dam is affected, and the height of water mist over the dam crest reaches 50 m. Such intensity greatly exceeds that of natural rainfall records, thus, it poses hazards to power station operation, slope stability, and the ecological environment (Lin L. et al., 2021). Therefore, understanding the spatial distribution of splashing rainfall and predicting splashing effects are important components in the design of large hydropower stations and the surrounding ecological environment.
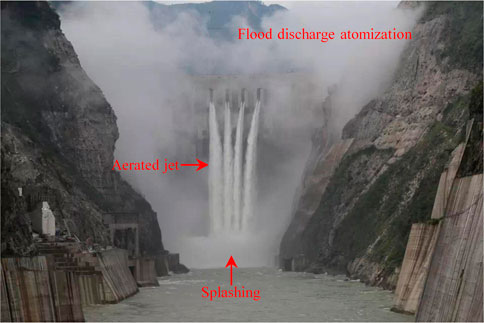
FIGURE 1. Flood discharge atomization induced by release from dam surface orifices at the Jinping-1 Hydropower Station.
To understand the mechanism of flood-discharge atomization and reduce its harm in hydraulic engineering, many studies have used prototype observation, physical model experiments, and mathematical models to investigate how splashing rainfall distribution is affected by hydraulic conditions (Lian et al., 2014; Liu et al., 2015). Field measurements have also been used to identify macro-laws and provide verification for theoretical studies (Liu G. et al., 2020). Sun and Liu (2003) collected and analyzed existing prototype observation data and found that the longitudinal range of splashing rainfall is primarily affected by discharge flow, jet impingement velocity, and entry angle. Although prototype observation is the most direct method to study splashing atomization, it requires extensive work, and stochastic factors can easily affect measurements. In addition, it is difficult to directly extrapolate measurement results from one specific project to others. Physical model experiments are effective supplements to prototype observations because they can examine a single variable factor and be conducted repeatedly. Zhou et al. (2008) and Wu et al. (2011) tested different model scales and found flood discharge atomization is closely related to the Weber number (We). When the Weber number is greater than 500, the effects of surface tension and viscous force are relatively weak and have little effect on the test results, indicating that test results can be scaled up to prototype dimensions. Liu D. et al. (2020) simplified a jet to horizontal outflow from a rectangular nozzle and studied the effect of pressure variation on rainfall intensity. Based on field and experimental tests, a mathematical model was developed that is a semi-empirical and theoretical prediction method. Some researchers (Lian et al., 2014; 2019a; Liu et al., 2015) regarded splashing droplet movement as a stochastic process and developed a stochastic splash model to predict rainfall intensity distribution. Liu G. et al. (2020) developed a numerical atomization model according to the laws of mass conservation and momentum conservation and a water transportation equation. However, because of the complexity of atomization, the accuracy and reliability of current numerical models should be verified by realistic engineering. According to various studies (Sun and Liu, 2003; Lian et al., 2019b), hydraulic conditions, such as discharge flow and impingement velocity, clearly have major effects on flood discharge atomization. However, because of the complexity of atomization and limitations of measurement methods, the spatial distribution of splashing rainfall has not been tested in sufficient detail. In addition, the type of spatial distribution and quantitative effects of different hydraulic parameters on atomization rainfall intensity remain unclear.
In this study, with the focus on existing problems, the splashing caused by a high-speed nappe impinging on a plunge pool was experimentally investigated. Effects of impingement velocity, unit discharge, and water cushion depth were examined. Flow behaviors caused by the impingement of a nappe and spatial distribution of splashing rainfall were also analyzed. Relations between the magnitude of splashing rainfall and various hydraulic factors are discussed. The impact outcomes determined in this study can shed light on the complex dynamics and distributions of splashing rainfall, which are essential to understand for practical applications.
2 Experimental setup
The experimental study was conducted on a large-scale physical device designed to study turbulent jets and splashing atomization in overtopping weirs. The device was assembled at the Chongqing Southwest Research Institute for Water Transport Engineering in China. All laboratory ventilation openings were closed to avoid any wind effect on the jets. Figure 2 shows a schematic of the experimental setup. The setup consisted primarily of a turbulent jet generation system, a plunge pool, a water circulation system, two lifting systems, and a rainfall collection platform. The experimental facility allows researchers to vary falling heights between 3.0 and 6.0 m and flows from 0.01 to 0.15 m3/s. The coordinate system was built by taking the center point of the rectangular jet impingement zone as the coordinate origin, with x-, y-, and z-axes representing longitudinal, transverse, and vertical directions, respectively.
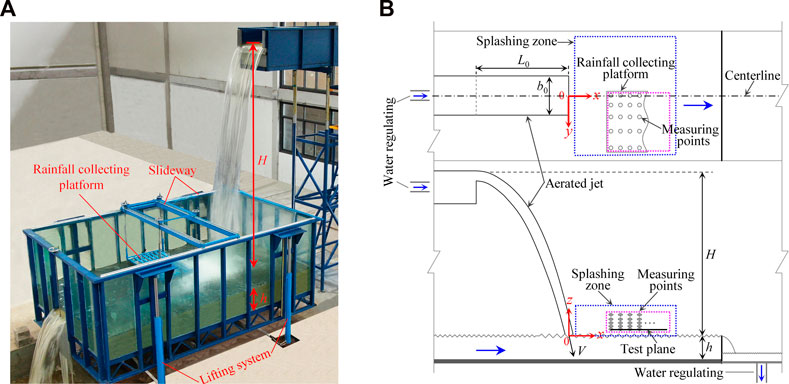
FIGURE 2. (A) Experimental setup in the laboratory and (B) schematic of the experimental setup.
The moveable inlet channel had a length of 6.0 m and a width of 0.825 m, and it ended in a rectangular sharp-crested weir with a height of 0.40 m. The water level upstream of the weir was measured with a ruler, accurate to ±0.5 mm. The plunge pool was 5.00 m long, 3.00 m wide, and 1.35 m deep. The space was sufficient to include the diffusion range of splashing rainfall. The plunge pool was made of transparent tempered glass to enable observation of inside flow. Different water cushion depths were analyzed by modifying the height of the wall on the downstream side.
A rainfall collection platform was customized to collect splashing rainfall in the horizontal plane (xoy plane in Figure 2) at different elevations. The platform mainly included a moveable rainfall collection panel, rainfall collectors, and fixing tools (Figure 3). Eighty (10 × 8 matrix) holes were on the rainfall collection panel to fix the position of measurement points, and the measurement points were elevated 11 cm above the panel. The location of the center point on top of a rainfall collector was defined as the measurement point coordinate. Rainfall collectors were placed at a constant spacing of 10 cm in the x-direction, whereas the spacing varied from 10 cm when y = 0 cm–20 cm near the longitudinal wall. Because the splashing rainfall intensity varied from point to point, rainfall collectors with capacities from 20 ml to 500 ml were used. The top of a rainfall collector was a short circular tube with a length of 10 cm and an inner diameter of 1.6 cm. Zhang and Zhu (2013) used bottles with different bottle-neck diameters (1.52 cm–3.26 cm) to measure the rainfall intensity distribution of an aerated water jet in the air and obtained a measurement error of only 3%, which indicated that the measurement error associated with different bottle-neck diameters is negligible.
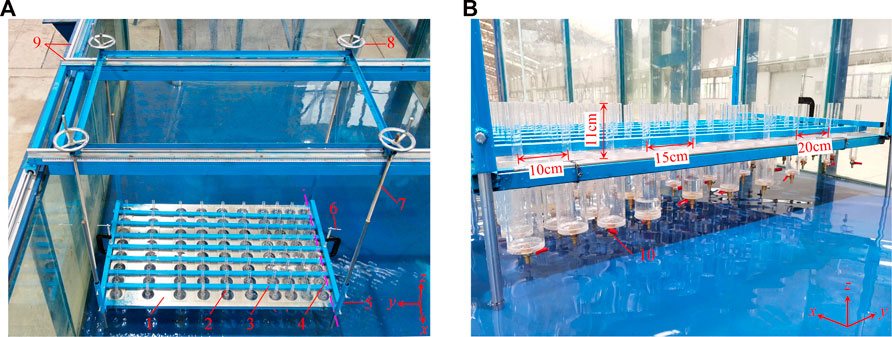
FIGURE 3. Rainfall collection platform: 1, rainfall collection panel; 2, rainfall collector; 3, rectangular steel tube; 4, downstream channel centerline; 5, fixing tool; 6, clip; 7, screw; 8, screw disc; 9, slideway; 10, valve.
The center point of the rectangular jet impingement zone was determined by using the trajectory of the central nappe as proposed by Scimeni (1930) and also used by Castillo et al. (2014). The experimental measurement zone was 50 cm (x = 50 cm) downstream of the impingement center point and its downstream area, and various elevations were examined. Because the nappe was nearly symmetrical in the transverse direction, only half of the splashing zone was measured in this study. To measure the rainfall intensity in that zone, a rainfall collection platform was placed in the first region downstream of the impingement region to collect splashing water. Next, the entire platform was moved 0.8 m in the longitudinal direction to the next measurement region. This step was repeated until the rainfall intensity was less than 10 mm/h.
After impingement, water flow in the impingement zone and the near zone rolled, and the water level increased in the plunge pool. To avoid backwater entering rainfall collectors and affecting splashing measurement results, the minimum measurement elevation was 20 cm above the water surface, where there was little effect from impingement in the plunge pool. With the same hydraulic condition and location, different collection times (T = 1/6, 1/3, 1/2, and 1 h) were compared. Ultimately, T = 1/2 h was selected. To ensure measurement accuracy, each test was performed twice and an average was determined. Statistical results show that the relative errors of the two measurement results are less than 10% for all the tests. Owing to the randomness of the sizes, ejection velocities, and angles of splashing droplets, the measurement errors are acceptable. The average rainfall intensity of a measurement point (x, y, z) was calculated as follows:
where
Table 1 shows the most representative parameters of 75 splashing tests. In this work, three discharges (q), five falling heights (H), and five water cushion depths (h) were studied. Water-cushion depths ranged from 20 cm to 60 cm at an interval of 10 cm. In each test, five to seven elevations (z) ranging from 20 cm to 50 cm were measured at an interval of 3–10 cm. The variable V was the jet impingement velocity due to the gravity effects, and the little effect of air-water friction was not considered. Fr, Re and We were the Froude, Reynolds, and Weber numbers (Pfister and Chanson, 2012; Castillo et al., 2014) for the jet section before the impact with the water surface of the plunge pool, respectively. The impingement angle between the jet and horizontal plane was θ, which was estimated by the nappe trajectory according to Scimeni (1930). In all tests, the width to depth ratio of the nappe was between 7.0 and 10.2 at the top of the weir. The lateral width of the nappe changed little as it fluctuated in the air (Liu and Liu, 1989). Although scale effects may occur in a physical model (Heller, 2011), such effects can be reduced by careful choice of parameters and interpretation of results. According to Pfister and Chanson (2012), when Re > 2 to 3 × 10⁵ or We0.5 > 140, the scale effect is small for high-speed air-water two-phase flow when Froude similitude is considered.
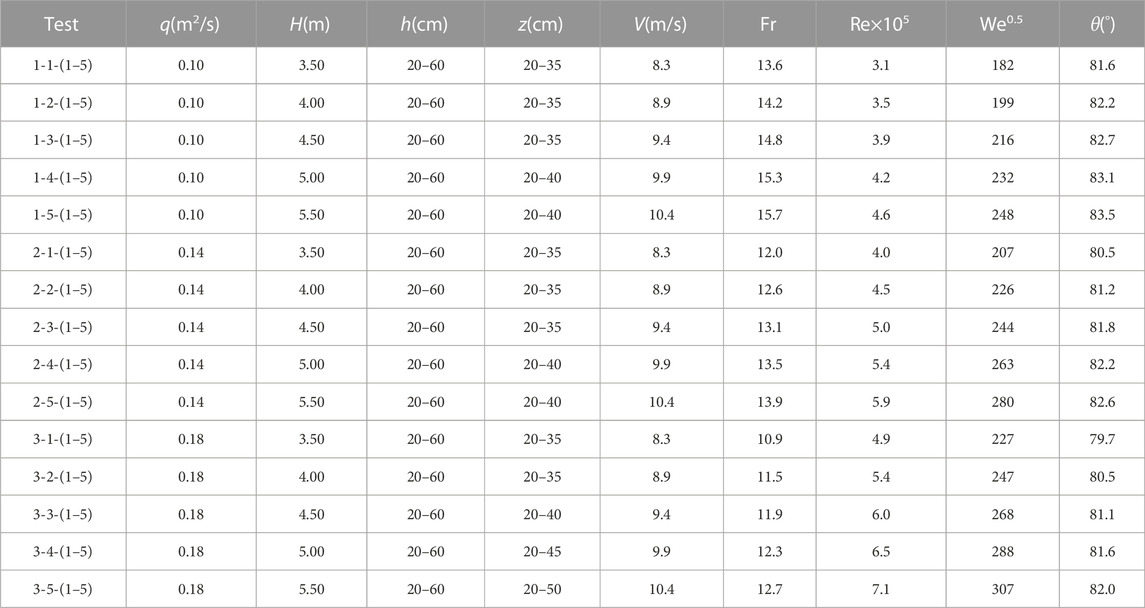
TABLE 1. Experimental working conditions.
3 Experimental results
3.1 Jet impact and splashing regimes
Jet impact and splashing phenomena depend strongly on prior jet deformation and breakup (Lian et al., 2019b). A jet initially has a smooth surface and then develops nearly axisymmetric disturbances. Those disturbances increase as the jet moves downstream, resulting in a jet that is no longer a continuous mass as soon as the disturbance amplitude reaches the jet thickness. The distance between the jet exit and breakup point is called the jet breakup length (Lb). Ervine et al. (1997) found that surface tension and turbulence effects determine the Lb and proposed an experimental equation to estimate Lb for a circular jet. Based on the research by Ervine et al. (1997), Castillo et al. (2014) conducted further research on nappe flow and provided the following experimental equation of the breakup length for a nappe:
where K ≈ 0.85 is a non-dimensional fit coefficient; Kφ is the experimental term of the turbulence parameter, with Kφ≈1.02 for two-dimensional nappe flow and Kφ≈1.24 for three-dimensional nappe flow; and Bi, Fri, and Tu are the jet thickness, Froude number, and the turbulent intensity at the issuance conditions, respectively. Details are provided in Castillo et al. (2014).
According to Eq. 2, the breakup length ranged from 2.7 m to 3.3 m in the present study, which was much smaller than the jet trajectory length (l). The jet entrained a lot of air, and jet disturbances became significant when reaching the plunge pool surface. In the process of impingement, a high-speed shock wave was generated, resulting in depression and deformation of the plunge pool surface. Subsequently, jet diffusion, rolling, mixing, and air entrainment occurred in the plunge pool, accompanied by strong momentum and energy exchanges. Simultaneously, the flow velocity near the impingement zone was discontinuous, which increased the water level and a liquid sheet formed. The phenomenon was similar to the liquid crown formed by the impact of a droplet with a liquid surface breakup (Yarin and Weiss, 1995; Yarin, 2006). The action of surface tension (capillary instability of the Rayleigh type) caused the liquid sheet to be unstable, with eventual breakup and formation of ligaments, blocks, and droplets (Figure 4). Splashing drops moved as projectiles in the air with different velocities and angles, resulting in drops that diffused at a distance. Simultaneously, ligaments and blocks with relatively large volumes were unstable and further breakup into finer droplets. Thus, splashing atomization rainfall was generated.
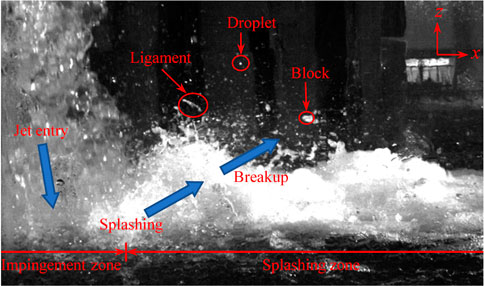
FIGURE 4. Jet impact and splashing regimes.
3.2 Spatial distribution characteristics of splashing rainfall intensity
3.2.1 Rainfall distribution in horizontal planes
Rainfall intensity distribution is the most important parameter to characterize flood discharge atomization, which is also used to classify the atomization zone. As shown in Figure 5, the shape of splashing rainfall contours is approximately elliptical in horizontal planes, and the jet impingement central point does not coincide with the central point of an ellipse. This has also been observed in circular jet splashing (Liu et al., 2010) and ski-jump jet splashing (Liu et al., 2015). This is because the entry angle of the jet was inclined and the flow direction in the plunge pool tended to be downstream. In addition, because the impinging jet was symmetric around the x-axis, splashing rainfall was also approximately symmetric. The top right-hand corner included the rainfall intensity contours experimentally measured in the present study.
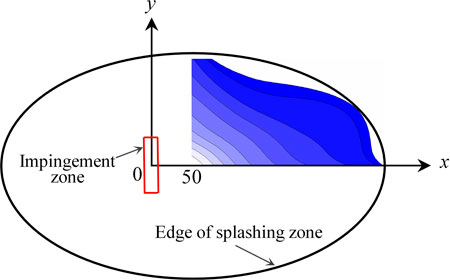
FIGURE 5. Diagram of an inclined jet splashing rainfall range in the horizontal plane and experimental measurement zone in the present study, while typical rainfall intensity contours are shown in the top right-hand corner.
Figure 6 shows splashing rainfall distribution in half-width horizontal planes. In each contour of rainfall intensity, the jet impingement central point was the coordinate origin, and the intensity of 10 mm/h marked the edge. The edge with 10% of Imax (the maximum rainfall intensity in a horizontal xoy plane) is also marked with a red, dashed line in Figure 6. Due to the limitation of plunge pool width, the largest lateral width of measurement points was 130 cm (y = 130 cm). At relatively low elevations, the rain intensity was greater than 10 mm/h when y = 130 cm, but it was less than 3% of Imax. The Imax was in the surrounding impingement region, and it decreased as the elevation (z) increased. For example, in the test of q = 0.18 m2/s, V = 10.4 m/s, and h = 20 cm, Imax was 2039 mm/h when z = 20 cm, 463 mm/h when z = 35 cm, and 144 mm/h when z = 50 cm. The shape of splashing rainfall contours was similar to a 1/4 ellipse in the measurement zone, and the decreasing gradient in the x-direction was greater than that in the y-direction, which is consistent with ski-jump jet splashing experimental results by Liu et al. (2015). However, because the impact angle (θ) is approximately 39° in Liu et al. (2015) which is much lower than that in this study (θ ≈ 81°), there is less decrease in the gradient of rainfall intensity in the x-direction. In addition, only two tests were conducted, and each test measured one elevation (z = 40 cm or 50 cm). Hence, splashing rainfall distributions in the z-direction and the effects of different hydraulic factors on splashing atomization still need to be explored further. In this study, the experimental results showed that the magnitude and range of splashing rainfall decreased with an increase in z, and the details are discussed in section 3.2.4.
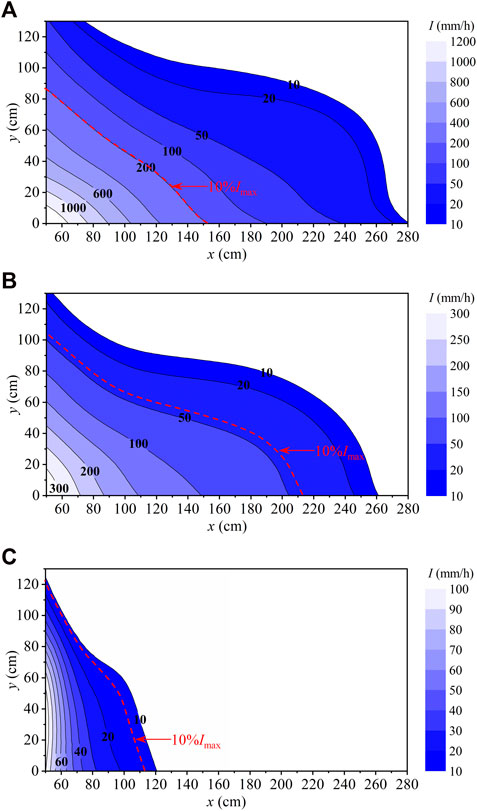
FIGURE 6. Typical rainfall intensity distribution in the horizontal planes, with V = 10.4 m/s, q = 0.18 m2/s, h = 20 cm, (A) z = 20 cm; (B) z = 35 cm; and (C) z = 50 cm.
3.2.2 Rainfall intensity distribution in the x direction
Figure 7 shows typical splashing rainfall intensity distributions on the x-axis. According to numerical simulation results (Liu et al., 2008; Lian et al., 2014), splashing rainfall intensity first increases and then decreases on the x-axis, and the maximum is close to the jet impingement zone. Because the jet breakups and splits into droplets before impingement, the droplets may drop into collectors near the impingement zone, therefore, splashing rainfall cannot be accurately measured. In this study, rainfall intensity on the x-axis was regarded as the maximum in the transverse. In addition, with an increase in x, there was a reduction in rainfall intensity, which gradually flattened.
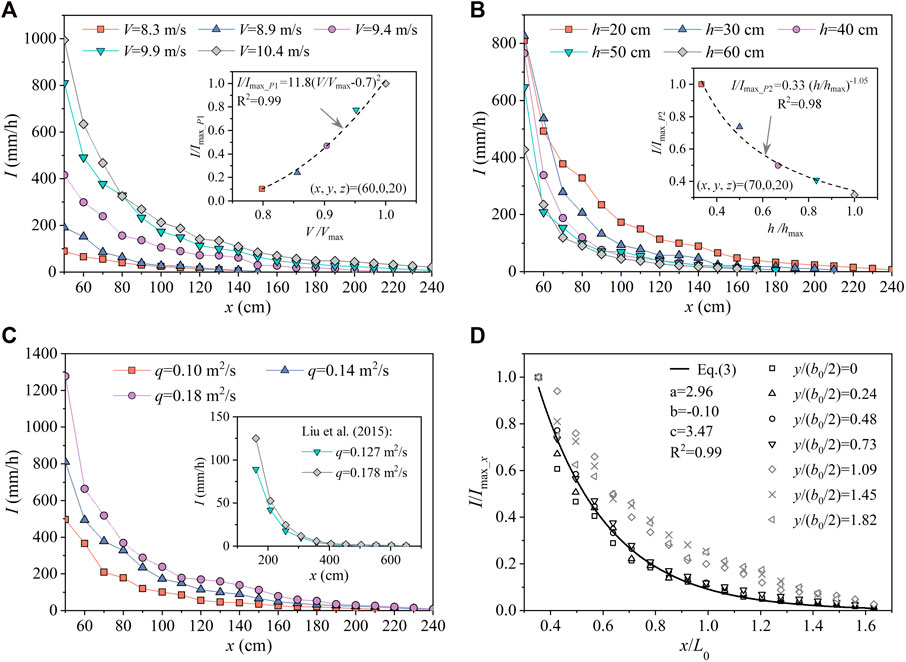
FIGURE 7. Typical examples of rainfall intensity distribution in the x direction, (A) with different jet impingement velocities and q = 0.14 m2/s, h = 20 cm, y = 0 cm, and z = 20 cm, while the inner figure represents the relation between the dimensionless impingement velocity (V/Vmax) and the dimensionless rainfall intensity (I/Imax_P1) for a typical measurement point with the coordinate of (x, y, z) = (60, 0, 20); (B) with different plunge pool depths and V = 9.9 m/s, q = 0.14 m2/s, y = 0 cm, and z = 20 cm, while the inner figure depicts the relation between the dimensionless plunge pool depth (h/hmax) and the dimensionless rainfall intensity (I/Imax_P2) for a typical measurement point with the coordinate of (x, y, z) = (70, 0, 20); (C) with different unit discharges and V = 9.9 m/s, h = 20 cm, y = 0 cm, and z = 20 cm in the present tests and in Liu et al. (2015) study (inner figure); and (D) with different dimensionless longitudinal distance (x/L0) and comparisons with Eq. 3 and V = 9.9 m/s, q = 0.14 m2/s, h = 20 cm, and z = 20 cm.
Figure 7A shows the longitudinal distribution of rainfall intensity (I) on the x-axis with different jet impingement velocities (V). The inner figure represents the relation between the dimensionless impingement velocity (V/Vmax) and the dimensionless rainfall intensity (I/Imax_P1) for a typical measurement point (P1) with the coordinate of (x, y, z) = (60, 0, 20). Vmax was the maximum jet impingement velocity, which was 10.4 m/s in the present study. Imax_P1 was the maximum rainfall intensity at the P1 measurement point for five different velocities. As shown in Figure 7A, I increased with V. For q = 0.14 m2/s, h = 20 cm, x = 60 cm, y = 0 cm, and z = 20 cm, when V = 8.3, 8.9, 9.4, 9.9, and 10.4 m/s, the measured rainfall intensity was 66, 152, 298, 492, and 634 mm/h, respectively. The relation between V/Vmax and I/Imax_P1 was described by a quadratic equation; Zhan et al. (2018); Qian et al. (2022) studied splashing generation by a liquid jet impinging on a horizontal plate and found the splashing ratio (the ratio of the total volume of splashing droplets and primary jet volume) first increases with impingement Weber number and then remains constant. The result was primarily due to a large V that indicated high kinetic energy, as well as the splashing related to jet breakup. When the velocity was greater than a certain limit, the jet disintegrated into small droplets. Droplets are severely affected by air drag force, and ultimately, the moving velocity is a constant, such as natural rainfall. In hydraulic engineering, the jet impingement velocity primarily depends on the falling height, and the falling height is directly related to topographic conditions and dam operation conditions.
Figure 7B shows the effect of plunge pool depth on splashing rainfall intensity on the x-axis. The inner figure depicts the relation between the dimensionless plunge pool depth (h/hmax) and the dimensionless rainfall intensity (I/Imax_P2) for a typical measurement point (P2) with the coordinate of (x, y, z) = (70, 0, 20). hmax is the maximum plunge pool depth, which is 60 cm in the present study. Imax_P2 is the maximum rainfall intensity for the P2 measurement point for five different plunge pool depths. As shown in Figure 7B, the rainfall intensity decreased with plunge pool depth in general. In the position of x = 50 cm or 60 cm, because of the large proportions of ligaments and blocks, variation in rainfall intensity with h was not obvious. When x ≥ 70 cm, because the rainfall was primarily generated by droplets, an increase in h contributed to a decrease in I. For V = 9.9 m/s, q = 0.14 m2/s, x = 70 cm, y = 0 cm, and z = 20 cm, when h = 20, 30, 40, 50, and 60 cm, the measured rainfall intensity was 378, 279, 188, 154, and 119 mm/h, respectively. The relation between h/hmax and I/Imax_P2 was described by a power function. In the present research, the difference in I when h = 20–40 cm was large, but it was much smaller when h = 40–60 cm. Those could be explained in similar tests. For a drop impacting on a liquid film (Geppert et al., 2017; Wu et al., 2021), increasing film thicknesses results in an increase in splashing droplet diameter, whereas the number of droplets decreases. This result is primarily because with an increase in film thickness, the crown wall thickens, which results in the generation of splashing droplets with relatively large diameters. A thicker film can absorb more kinetic energy. According to the energy conservation law, less energy is used to break the crown wall, and thus, fewer droplets are generated. The rainfall intensity at a point is the result of the combined effect of droplet size and number under a certain probability. Simultaneously, with an increase in plunge pool depth, the rainfall intensity difference decreased gradually. Therefore, it can be inferred that when plunge pool depth exceeds a certain limit, it has little effect on splashing rainfall.
Figure 7C shows the effect of unit discharge (q) on splashing rainfall intensity (I) on the x-axis in the present tests and in Liu et al. (2015) study (inner figure). Jet impingement is closely related to the condition of jet breakup (Ervine et al., 1997). Generally, with lower flow, higher falling height, and more air aeration, the jet breakup is more severe. Qian et al. (2022) studied a nozzle jet impact on a plate, and found that with a small initial nozzle jet diameter (range from 2 mm to 8 mm), when l ≥ Lb (l is jet length) in a jet, the jet breakups into drops before reaching the plate. In this study, all tests met the condition of l ≥ Lb, and much air was entrained in the jet. In addition, the jet became a sheet with a large number of waves, and many drops detached from the sheet rim before impingement. As shown in Figure 7C, an increase in q resulted in an increase in I when the degree of the jet breakup was severe. Which is consistent with the measurements of Liu et al. (2015). Because a large q indicating high kinetic energy. For V = 9.9 m/s, h = 20 cm, x = 50 cm, y = 0 cm, and z = 20 cm, when q = 0.10, 0.14, and 0.18 m2/s, the measured rainfall intensity was 495, 811, and 1277 mm/h, respectively. The splashing rainfall intensity on the x-axis caused by ski-jump jet impingement in Liu et al. (2015) is also plotted in Figure 7C. Because the ski-jump jet has a smaller impingement angle than that of the nappe jet, the longitudinal length of the splashing rainfall range is greater.
In Figure 7D, the dimensionless rainfall intensity (I/Imax_x) is plotted against the dimensionless longitudinal distance (x/L0). Imax_x was the maximum rainfall intensity on a given longitudinal line. L0 was the longitudinal distance from the weir to the impingement center point, as calculated by Scimeni (1930). b0/2 was half of the jet impingement width. In Figure 7D, each symbol represents one value depending on the impingement condition and location. The measurement points for which y/(b0/2) ≤ 1 are marked in black, whereas those for which y/(b0/2) > 1 are marked in grey. For all investigated splashing combinations, I/Imax_x decreased with increasing x/L0. The discreteness of longitudinal rainfall intensity distribution with different y values was small when y/(b0/2) ≤ 1, whereas the opposite was true when y/(b0/2) > 1. This result was primarily because the rainfall for y/(b0/2) > 1 was generated by drops deflection in the lateral direction but that for y/(b0/2) ≤ 1 was generated by drops with small azimuth angles. In addition, the variation gradient of I/Imax_x in the x-direction when y/(b0/2) ≤ 1 was greater than that when y/(b0/2) > 1. This result was primarily because the azimuth angles and moving distance of ligaments and blocks with large volumes were small, which resulted in the Imax_x in the region of y/(b0/2) ≤ 1 being much greater than that in the region of y/(b0/2) > 1. The rainfall intensity distribution in the longitudinal direction was similar to a gamma distribution and was expressed by Eq. 3. The data of I/Imax_x when y/(b0/2) ≤ 1 were described well by the following Eq. 3 (the continuous line in Figure 7D):
where a, b, and c are coefficients, which vary with impingement condition and location. Because of the complexity of splashing rainfall, additional research is needed to determine the correlated coefficients.
3.2.3 Rainfall intensity distribution in the y direction
Figure 8A shows typical splashing rainfall intensity distributions on the y-axis with different jet impingement velocities. In Figure 8B, the dimensionless rainfall intensity I/Imax_y is plotted against the dimensionless lateral distance y/(b0/2). Imax_y is the maximum rainfall intensity on a given lateral line. The maximum rainfall intensity was near to the x-axis, and an increase in y resulted in an approximate decrease in I, which is consistent with the results of Lian et al. (2019a); Liu et al. (2015). The result occurs primarily because in the middle of a nappe, the jet is thicker and the air entrainment fraction is smaller than in other parts, thus, the impingement kinetic energy is greater. In the present study, for V = 9.9 m/s, q = 0.14 m2/s, h = 20 cm, x = 50 cm, and z = 20 cm, when y = 0, 10, 20, 30, 45, 60, 75, 90, 110, and 130 cm, the rainfall intensity was 811, 786, 676, 527, 248, 141, 80, 38, 20, and 9 mm/h, respectively. As shown in Figure 8A, rainfall intensity increased with impingement velocity (V), which was consistent with the analysis of rainfall intensity distribution in the x direction. Because the effects of water cushion depth and unit discharges for rainfall intensity were the same as above, they were not repeated here. Figure 8B shows the dimensionless rainfall intensity I/Imax_y plotted against the dimensionless lateral distance y/(b0/2). The rainfall intensity in the transverse direction conformed to a Gaussian distribution, described as follows:
where k1 and k2 are undetermined coefficients.
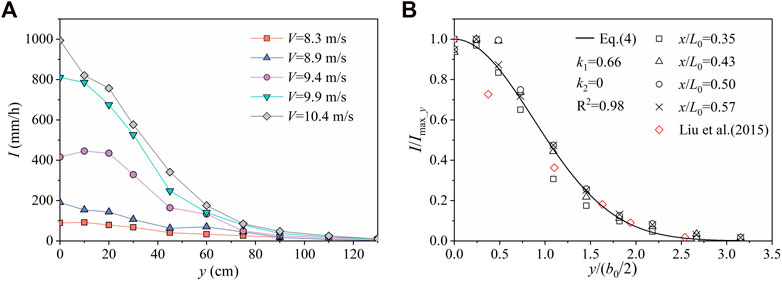
FIGURE 8. Typical examples of rainfall intensity distribution in the y direction, with (A) different jet impingement velocities and q = 0.14 m2/s, h = 20 cm, x = 50 cm, and z = 20 cm; and (B) different dimensionless longitudinal locations and comparisons with Eq. 4 and V = 9.9 m/s, q = 0.14 m2/s, h = 20 cm, and z = 20 cm.
3.2.4 Rainfall intensity distribution in the z direction
Figure 9A shows typical splashing rainfall intensity distributions on the z-axis with different elevations. The inner figure presented the rainfall intensity for a typical vertical line with the coordinate of (x, y) = (50, 0) versus z. In general, the I for the same (x, y) decreased strongly with z. This result could be explained by a drop impact on a liquid film (Yarin and Weiss, 1995; Yarin, 2006). With the impact on a liquid layer, a crown-like liquid sheet emerges, and with the development of the liquid sheet, the top of the liquid sheet becomes thinner than the bottom. Owing to the action of surface tension, as the top edge of the crown-like liquid sheet breaks up, very small and rapidly moving droplets form first. With further development of liquid sheets, surface tension stability is difficult to maintain, and sheets breakup into large droplets, water blocks, and ligaments, which are large in size and low in velocity.
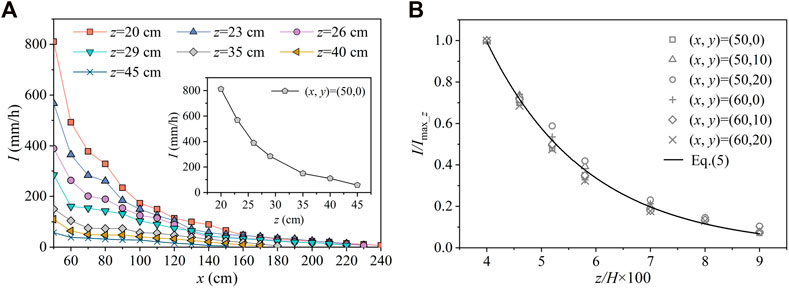
FIGURE 9. Typical examples of the rainfall intensity distribution in the z direction, with (A) different elevations (z) and V = 9.9 m/s, q = 0.14 m2/s, h = 20 cm, and y = 0 cm, while the inner figure depicts the rainfall intensity for a typical vertical line with the coordinate of (x, y) = (50, 0) versus z; and (B) dimensionless rainfall intensity I/Imax_z for typical measurement points against z/H × 100 and V = 9.9 m/s, q = 0.14 m2/s, and h = 20 cm.
Figure 9B shows dimensionless rainfall intensity I/Imax_z for typical measurement points plotted against z/H × 100. Imax_z is the maximum rainfall intensity on a vertical line. As shown in Figure 9B, I/Imax_z decreased with an increase in z/H. Rainfall intensity distribution in the vertical direction was also similar to a gamma distribution and was expressed as follows:
where m1, m2, and m3 are undetermined coefficients.
3.2.5 Experimental equation to estimate Imax
In a jet-splashing regime, splashing characteristics, including splashing rainfall intensity and splashing range, are mainly determined by the impingement velocity V, entry angle θ, shape of the jet, unit discharge q, and plunge pool depth h (Sun and Liu, 2003; Lian et al., 2019b). In this study, the shape of the nappe was fixed (rectangular), and the difference between entry angles was small (ranging from 79.7° to 84.8°) and therefore could be neglected. In the current study, V, q, and h were the main factors affecting splashing rainfall. Figure 10 shows the relation between
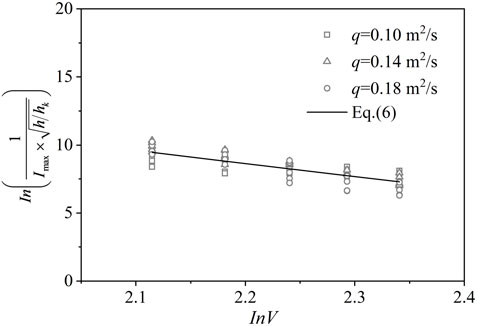
FIGURE 10. The relationship between
Where 8.3 m/s ≤ V ≤ 10.4 m/s, 0.10 m2/s ≤ q ≤ 0.14 m2/s, 20 cm ≤ h ≤ 60 cm, and θ ≈ 80°. In Figure 10, the solid line represents Eq. 6, with regression coefficient R2 = 0.67. The data were discrete because sizes, velocities, and ejected angles of splashing droplets were stochastic. The magnitude of rainfall intensity was the result of the combined action of droplets with different probabilities.
4 Discussion
Flood discharge atomization is a complex air-water two-phase flow, and the atomization rainfall characteristics are affected by hydraulic factors, meteorological conditions, and topographic conditions (Lian et al., 2019b). Because meteorological and topographic conditions are difficult to change in a defined project, adverse effects of flood discharge atomization are typically mitigated by hydraulic regulation. According to previous studies (Liu et al., 2010; Lian et al., 2019b) impingement velocity, discharge, and water cushion depth are the main factors affecting atomization rainfall intensity and diffusion range. In this study, effects of different hydraulic factors on splashing rainfall caused by impingement between a nappe and a plunge pool were analyzed. According to the experimental data, jet impingement velocity was the most important factor affecting atomization, which is usually determined by the terrain. Therefore, in the case of high-dam flood discharge, the impact on atomization caused by high velocity is unavoidable, which must be recognized when considering hydraulic safety. To reduce the hazards of flood discharge atomization, the following suggestions should be considered. First, optimize operation of dam flood discharge, and adopt an appropriate small discharge for flood discharge. Second, the water cushion depth should be appropriately large. The present study showed that atomization rainfall intensity decreased with an increase in water cushion depth. However, beyond a certain depth, the effect of reducing atomization is very small, although there are increases in construction workload and costs. Third, monitoring of practical projects should be strengthened and protective measures should be implemented in key regions with high-intensity rainfall.
5 Conclusion
In the present study, the splashing rainfall caused by a nappe impingement on a downstream plunge pool was studied experimentally. Splashing rainfall under different hydraulic conditions was investigated. Spatial distributions of rainfall and effects of hydraulic factors on various splashing regimes are summarized as follow.
With jet impact on the water surface of the plunge pool, splashing emerged in the form of ligaments, blocks, droplets, and mist. The shape of an inclined jet splashing rainfall contours was similar to an ellipse in horizontal planes. Maximum rainfall intensity was in the surrounding impingement region, and rainfall intensity decreased with an increase in the distance between the impingement center point and measurement points. In longitudinal and vertical directions, a gamma distribution described rainfall intensity distribution. In the lateral direction, rainfall intensity conformed to a Gaussian distribution. Rainfall intensity increased with impingement velocity in a quadratic relation. With an increase in plunge pool depth, rainfall intensity decreased, with the reduction gradually flattening. In addition, an increase in unit discharge resulted in an increase in rainfall intensity when the degree of the jet breakup was severe.
According to test data, relations between maximum rainfall intensity and hydraulic factors were established. The current work is a first step towards a better understanding of flood discharge atomization in hydraulic engineering. In addition, the scaling effect must be considered in physical model tests. Additional prototype observations should be conducted to verify the effects of hydraulic factors in the present study on the regulation of flood discharge atomization.
Data availability statement
The original contributions presented in the study are included in the article/supplementary material, further inquiries can be directed to the corresponding author.
Author contributions
Conceptualization, HY and QS; methodology, WW; Experiment, QS and LH; writing—original draft preparation, QS and LH; writing—review and editing, HY and WW; visualization, QS and CX. All authors have read and agreed to the published version of the manuscript.
Funding
This work was supported by the National Natural Science Foundation of China (Grant Nos. 52109076 and 51939007), the China Postdoctoral Science Foundation (Grant No. 2022MD723724), the Natural Science Foundation of Chongqing (Grant Nos. cstc2021jcyj-msxmX1175 and CSTB2022NSCQ-BHXO722), and the Natural Science Foundation of Chongqing Jiaotong University (Grant No. F1220084).
Acknowledgments
The authors appreciate the editor and the reviewers for their constructive suggestions.
Conflict of interest
Author HY, LH, and CX were employed by the Company Chongqing Xike Water Transportation Engineering Consulting Co.,Ltd.
The remaining authors declare that the research was conducted in the absence of any commercial or financial relationships that could be construed as a potential conflict of interest.
Publisher’s note
All claims expressed in this article are solely those of the authors and do not necessarily represent those of their affiliated organizations, or those of the publisher, the editors and the reviewers. Any product that may be evaluated in this article, or claim that may be made by its manufacturer, is not guaranteed or endorsed by the publisher.
References
Blaisot, J. B., and Adeline, S. (2003). Instabilities on a free falling jet under an internal flow breakup mode regime. Int. J. Multiph. Flow. 29, 629–653. doi:10.1016/S0301-9322(03)00020-X
Castillo, L. G., Carrillo, J. M., and Blázquez, A. (2014). Plunge pool dynamic pressures: A temporal analysis in the nappe flow case. J. Hydraul. Res. 53, 101–118. doi:10.1080/00221686.2014.968226
Du, L., Lu, J. L., Li, L., and Xu, X. W. (2017). Prototype observation on flood discharge atomization of large hydraulic project. J. Yangtze River Sci. Res. Inst. 34, 59–63.
Ervine, D. A., Falvey, H. T., and Withers, W. (1997). Pressure fluctuations on plunge pool floors. J. Hydraul. Res. 35, 257–279. doi:10.1080/00221689709498430
Geppert, A., Terzis, A., Lamanna, G., Marengo, M., and Weigand, B. (2017). A benchmark study for the crown-type splashing dynamics of one- and two-component droplet wall–film interactions. Exp. Fluids 58, 172–227. doi:10.1007/s00348-017-2447-2
Heller, V. (2011). Scale effects in physical hydraulic engineering models. J. Hydraul. Res. 49, 293–306. doi:10.1080/00221686.2011.578914
Ho, M., Lall, U., Allaire, M., Devineni, N., Kwon, H. H., Pal, I., et al. (2017). The future role of dams in the United States of America. Water Resour. Res. 53, 982–998. doi:10.1002/2016WR019905
Karami, H., Dadrasajirlou, Y., Jun, C., Bateni, S. M., Band, S. S., Mosavi, A., et al. (2022). A novel approach for estimation of sediment load in dam reservoir with hybrid intelligent algorithms. Front. Environ. Sci. 10, 821079. doi:10.3389/fenvs.2022.821079
Li, X. Z., Chen, Z. J., Fan, X. C., and Cheng, Z. J. (2018). Hydropower development situation and prospects in China. Renew. Sustain. Energy Rev. 82, 232–239. doi:10.1016/j.rser.2017.08.090
Lian, J. J., He, J. L., Liu, F., Ran, D. J., Wang, X. Q., and Wang, C. (2019a). An improved empirical model for flood discharge atomization and its application to optimize the flip bucket of the Nazixia project. Int. J. Environ. Res. Public Health 16, 316. doi:10.3390/ijerph16030316
Lian, J. J., Li, C. Y., Liu, F., and Wu, S. Q. (2014). A prediction method of flood discharge atomization for high dams. J. Hydraul. Res. 52, 274–282. doi:10.1080/00221686.2013.873744
Lian, J. J., Liu, D., and Liu, F. (2019b). Research progress and frontiers on flood discharge atomization of Chinese high dam projects. J. Hydraul. Eng. 50, 283–293.
Lin, L., Li, Y., Zhang, W., Huang, Z., Chen, D., Liu, M., et al. (2021). Research progress on the impact of flood discharge atomization on the ecological environment. Nat. Hazards 108, 1415–1426. doi:10.1007/s11069-021-04774-x
Lin, X. J., Huang, G. H., Wang, G. Q., Yan, D. H., and Zhou, X. (2021). Risk assessment of dam-breach flood under extreme storm events. Front. Environ. Sci. 9, 742901. doi:10.3389/fenvs.2021.742901
Liu D., D., Lian, J. J., Liu, F., Liu, D. M., Ma, B., and Shi, J. Z. (2020). An experimental study on the effects of atomized rain of a high velocity waterjet to downstream area in low ambient pressure environment. Water 12, 397. doi:10.3390/w12020397
Liu, F., Lian, J. J., Zhang, X. J., and Li, C. Y. (2010). Experimental study of atomization and splashing caused by a ski-jump jet into scour pool. J. Hydroelectr. Eng. 29, 113–117.
Liu, G., Tong, F., Tian, B., and Gong, J. (2020). Finite element analysis of flood discharge atomization based on water–air two-phase flow. Appl. Math. Model. 81, 473–486. doi:10.1016/j.apm.2020.01.003
Liu, H. T., Liu, Z. P., Xia, Q. F., and Sun, S. K. (2015). Computational model of flood discharge splash in large hydropower stations. J. Hydraul. Res. 53, 576–587. doi:10.1080/00221686.2015.1090491
Liu, S. H., Sun, X. F., and Luo, J. (2008). Unified model for splash droplets and suspended mist of atomized flow. J. Hydrodyn. 20, 125–130. doi:10.1016/s1001-6058(08)60037-2
Liu, X. L., and Liu, J. (1989). Experimental study on the diffusion and aeration of three-dimensional jet. J. Hydraul. Eng. 11, 10–17.
Ma, Y., Zhu, D. Z., Rajaratnam, N., and Camino, G. A. (2016). Experimental study of the breakup of a free-falling turbulent water jet in air. J. Hydraul. Eng. 142, 06016014. doi:10.1061/(ASCE)HY.1943-7900.0001188
Pfister, M., and Chanson, H. (2012). Scale effects in physical hydraulic engineering models by VALENTIN HELLER, Journal of Hydraulic Research, Vol. 49, No. 3 (2011), pp. 293–306. J. Hydraulic Res. Hydraul. Res. 50, 244–246. doi:10.1080/00221686.2012.654671
Qian, S. T., Zhu, D. Z., and Xu, H. (2022). Splashing generation by water jet impinging on a horizontal plate. Exp. Therm. Fluid Sci. 130, 110518. doi:10.1016/j.expthermflusci.2021.110518
Reitz, R. D., and Bracco, F. V. (1982). Mechanism of atomization of a liquid jet. Phys. Fluids 25, 1730–1742. doi:10.1063/1.863650
Shu, A. P., Wang, L., Zhu, F. Y., Zhu, J. P., Pi, C. L., Zhang, Z. R., et al. (2022). Hydrodynamic Process of Partial and en Masse Dam Failure Induced Debris Flows. Front. Environ. Sci. 10, 905499. doi:10.3389/fenvs.2022.905499
Sun, S. K., and Liu, Z. P. (2003). Longitudinal range of atomized flow forming by discharge of spillways and outlet works in hydropower stations. J. Hydraul. Eng. 12, 53–58.
Tang, S. W., Chen, J. T., Sun, P. G., Li, Y., Yu, P., and Chen, E. (2019). Current and future hydropower development in Southeast Asia countries (Malaysia, Indonesia, Thailand and Myanmar). Energy Policy 129, 239–249. doi:10.1016/j.enpol.2019.02.036
Wagner, B., Hauer, C., and Habersack, H. (2019). Current hydropower developments in Europe. Curr. Opin. Environ. Sustain. 37, 41–49. doi:10.1016/j.cosust.2019.06.002
Wu, S., Wu, X., Zhou, H., Chen, H., Sha, H., and Zhou, J. (2011). Analysis and application of the scale effect of flood discharge atomization model. Sci. China Technol. Sci. 54, 64–71. doi:10.1007/s11431-011-4619-2
Wu, Y., Wang, Q., and Zhao, C. Y. (2021). A comparative study of the immiscibility effect on liquid drop impacting onto very thin films. Exp. Fluids 62, 137–217. doi:10.1007/s00348-021-03232-5
Yarin, A. L. (2006). Drop impact dynamics: Splashing, spreading, receding, bouncing. Annu. Rev. Fluid Mech. 38, 159–192. doi:10.1146/annurev.fluid.38.050304.092144
Yarin, A. L., and Weiss, D. A. (1995). Impact of drops on solid surfaces: Self-similar capillary waves, and splashing as a new type of kinematic discontinuity. J. Fluid Mech. 283, 141–173. doi:10.1017/S0022112095002266
Yuan, H., Xu, W. L., Li, R., Feng, Y. Z., and Hao, Y. F. (2018). Spatial distribution characteristics of rainfall for two-jet collisions in air. Water 10, 1600. doi:10.3390/w10111600
Zhan, Y., Oya, N., Enoki, K., Okawa, T., Aoyagi, M., and Takata, T. (2018). Droplet generation during liquid jet impingement onto a horizontal plate. Exp. Therm. Fluid Sci. 98, 86–94. doi:10.1016/j.expthermflusci.2018.05.022
Zhang, W. M., and Zhu, D. Z. (2013). Bubble characteristics of air-water bubbly jets in crossflow. Int. J. Multiph. Flow. 55, 156–171. doi:10.1016/j.ijmultiphaseflow.2013.05.003
Keywords: flood discharge atomization, rainfall intensity distribution, splashing test, nappe flow, plunge pool
Citation: Sun Q, Yuan H, Wei W, Hu L and Xie C (2023) Spatial distribution characteristics of splashing rainfall caused by nappe flow impingement on a plunge pool. Front. Environ. Sci. 11:1096960. doi: 10.3389/fenvs.2023.1096960
Received: 13 November 2022; Accepted: 16 January 2023;
Published: 27 January 2023.
Edited by:
Huiyu Dong, Research Center for Eco-environmental Sciences (CAS), ChinaCopyright © 2023 Sun, Yuan, Wei, Hu and Xie. This is an open-access article distributed under the terms of the Creative Commons Attribution License (CC BY). The use, distribution or reproduction in other forums is permitted, provided the original author(s) and the copyright owner(s) are credited and that the original publication in this journal is cited, in accordance with accepted academic practice. No use, distribution or reproduction is permitted which does not comply with these terms.
*Correspondence: Hao Yuan, eXVhbmhhb0BjcWp0dS5lZHUuY24=