 Shucheng Liu1*
 Peijin Wu2
- 1School of Statistics and Mathematics, Zhejiang Gongshang University, Hangzhou, China
- 2School of Geographic Sciences, East China Normal University, Shanghai, China
The rapid expansion of Chinese cities has led to serious urban productivity and eco-environment changes, and has therefore attracted considerable international academic attention. The main objective of this study is to investigate the theoretical mechanisms and practical effects of urban sprawl on green total factor productivity (GTFP), in order to provide a reference for optimizing the spatial layout of cities and promoting high-quality economic development. Realistic urban land area and population characteristics are extracted using DMSP/OLS and NPP/VIIRS nighttime lighting data, and LandScan global population dynamics statistics to measure the urban sprawl index. GTFP is measured using a super-SBM model that considers undesirable output. Based on the panel data of Chinese cities from 2006 to 2020, a spatial Durbin model was constructed to carry out the empirical analysis. The results show that, overall, urban sprawl in China is detrimental to its own GTFP, while contributing to the GTFP of neighboring cities. The impacts of urban sprawl vary markedly across cities of different sizes and across regions.
1 Introduction
Eco-environmental quality and urban sprawl are two connected problems affecting the development of global urbanization (Wigginton et al., 2016). Urban sprawl is a significant problem in urban development because it occurs when the rate of land development surpasses the rate of population growth. This can result in a low-density, mono-regional, and self-sufficient urban form (Tian et al., 2017; Zhang et al., 2022). Urban sprawl is a common phenomenon in both developed and developing countries (Wang et al., 2020). Urban sprawl not only changes the spatial structure, industrial layout, and consumption preferences of cities but also brings about problems such as waste of arable land and environmental pollution (Li and Li, 2019; Guan et al., 2020), which become important drivers of urban efficiency. Therefore, it is essential to comprehend the economic and social repercussions of urban sprawl in order to achieve high standards of urban spatial planning as well as high-quality urban economic development, particularly in China’s new era of dual domestic and international circulation.
China’s economy has shifted from a stage of high growth to a stage of high-quality development, and how to improve the quality and efficiency of economic development is a central concern of the government (Chen and Wang, 2022). Green Total Factor Productivity (GTFP) is an important indicator of the quality of economic growth and the extent of resource use (Chen and Golley, 2014). The 20th Party Congress report proposed promoting dynamic and efficient changes in economic development and increasing total factor productivity. The 2021 Chinese government work report pointed out the need to improve the quality of new types of urbanization, strengthen pollution prevention and control and eco-environment construction, and vigorously promote green development. Effectively enhancing GTFP is the key to China’s high-quality economic development at this stage.
Urban sprawl is a phenomenon of irrational expansion in the process of urbanization, and this rapid and low-density expansion of urban space is a cause for concern. Urban sprawl leads to the spatial dispersion of economic activities and increases the spatial distance between economic agents, with consequences for urban production activities and the ecological environment (Jaeger et al., 2010; Seevarethnam et al., 2021). So, what exactly is the impact of urban sprawl on GTFP? In the context of continuous urban sprawl and the promotion of sustainable development, it is of great theoretical and practical significance to explore the impact of urban sprawl on green total factor productivity in China in order to reasonably plan the spatial layout of cities and promote high-quality economic development.
This paper focuses on the relationship between urban sprawl and GTFP with a view to providing policy insights for China’s new type of urbanization and high-quality development. The main contributions of this study are: First, based on the economic and social effects of urban sprawl, the mechanism of its effect on GTFP is explained in terms of both productivity changes and eco-environment changes caused by urban sprawl. Secondly, the urban sprawl index is constructed using a combination of nighttime lighting data and LandScan global population dynamics statistics to identify high- and low-density areas within the city, making the urban sprawl index more spatial in nature. Thirdly, considering the spatial dependency between cities, a spatial econometric model is used to explore the effect of urban sprawl on GTFP, and further in-depth exploration is carried out by city size and region.
The remainder of this paper is organized as follows: Section 2 presents a literature review and theoretical foundation. Section 3 outlines the empirical methodology and data used. Section 4 analyzes the empirical results. Section 5 provides conclusions and policy implications.
2 Literature review and theoretical foundation
2.1 Measurement of urban sprawl
The analysis of the impact of urban sprawl first involves the measurement of urban sprawl. Some scholars have used a single indicator to reflect urban sprawl, while others have used multiple indicators to construct sprawl indices to measure sprawl characteristics. The use of a single indicator to measure urban sprawl focuses on the relationship between urban population and land area, mainly in terms of density (population density, employment density, residential density, density of residential units) (Terzi and Bolen, 2009; Chen et al., 2021), elasticity (land and population growth elasticity, land and employment growth elasticity, land and GDP growth elasticity) (Han, 2020; Zhang J et al., 2020) (Han, 2020; Zhang X et al., 2020), spatial patterns (accessibility, agglomeration, connectivity, fragmentation) (Mustafa and Teller, 2020; Wu et al., 2022), and so on. In contrast, multidimensional indicators are more helpful in reflecting the true picture of urban sprawl. George et al. (2008) constructed a system of indicators to measure urban sprawl based on six dimensions: density, concentration, centrality, nucleation, and accessibility. Wang et al. (2020) measured the level of urban sprawl in China at three levels: urban land area, population, and population density before and after sprawl. Clearly, none of the above methods is sufficient to fully characterize the low density and spatial dispersion that characterize urban sprawl (Lan et al., 2021). Furthermore, statistical data continue to have limitations, such as inconsistencies in the scope or calibre of statistics, administrative unit limitations, and time lags.
With the development and application of technological tools such as remote sensing systems and geographic information systems (GIS), GIS technology can be used to extract more accurate urban areas (Henderson et al., 2003). Nighttime light largely reflects human productive activities and can be used as a proxy for variables such as economic development and population density (Henderson et al., 2012). Nighttime lighting data not only have the superiority of good continuity, accessibility, and independent objectives but also avoid one-sidedness, subjectivity, and poor replication among the different regions. In recent years, more and more scholars have used nighttime lighting data to quantitatively measure urban sprawl. Using nighttime lighting data and the LandScan global population data to delineate real urban areas under the conditions of both lighting brightness and population density, an urban sprawl index is constructed to reflect the spatial expansion of cities (Gao et al., 2016; Lu et al., 2020). When using GIS technology, there is some variation in the urban sprawl indices obtained due to differences in the remote sensing image data used, the actual extent of the city extracted, and the urban sprawl criteria defined. Therefore, how to accurately measure urban sprawl is still an urgent problem to be solved.
2.2 Measurement and influencing factors of GTFP
Traditional total factor productivity measures mainly consider factors such as capital and labor, while less consideration is given to the consumption of natural resources such as energy and minerals, and the environmental pollution caused by economic growth. With the increasing pressure on resources and environment, the concept of green and sustainable development has gradually attracted attention. Resource and environmental factors are no longer just endogenous variables affecting economic growth, but have become a rigid constraint limit to economic growth (Zhang et al., 2015). In view of this, scholars have incorporated resource and environmental factors into the framework of total factor productivity measurement and proposed the concept of GTFP (Wu et al., 2020). Compared with traditional total factor productivity, GTFP and its growth can more accurately reflect the real economic growth performance and changes (Chen and Kong, 2022).
Data Envelopment Analysis (DEA), an important tool for efficiency evaluation, not only enables effective analysis of the productivity of a decision unit but also allows decomposition to identify the causes of inefficiencies in the decision unit (Liu et al., 2022). Traditional DEA models are mostly based on radial and angular measurements, which make it difficult to consider the slackness of inputs and outputs, and the measured efficiency values are not accurate enough. To overcome this shortcoming, Tone (2001) modified the model by constructing the super-SBM model, which not only effectively avoids the bias caused by radial and angular measures but also allows the evaluation of multiple efficient units. The super-SBM model, in which output is defaulted to desirable output, ignores the negative environmental externalities caused by urban production activities and is therefore based on the super-SBM model, which considers undesirable output (Mardani et al., 2017).
In recent years, China’s GTFP has shown an overall declining trend, but with significant regional differences (Xu et al., 2021; Zhao and Chen, 2022). The factors influencing GTFP are complex and varied. Throughout the existing research findings, the literature related to the topic of this paper has mainly analyzed it from the perspectives of urbanization, economic agglomeration, and city size. Yuan et al. (2019) point out that urbanization is an important driver of GTFP growth, while Zheng et al. (2018) argue that urbanization reduces GTFP in general, with the negative effect diminishing when the level of urbanization crosses a twofold threshold. Wu and Ge (2019) found a non-linear relationship between urbanization and GTFP based on cross-country panel data from the One Belt, One Road. In addition, a U-shaped relationship between economic agglomeration and GTFP has been found (Hao et al., 2022), and the effect of city size on GTFP has been shown to be facilitated and then inhibited (Dong H et al., 2022). Unfortunately, there has been little discussion on how urban sprawl affects GTFP.
2.3 The effect of urban sprawl on GTFP
Urban sprawl leads to a reconfiguration of urban space and changes in economic activity, which have an impact on urban productivity. Urban sprawl implies an increase in commuting distances and commuting costs, reducing opportunities for face-to-face exchanges, and discouraging knowledge spillovers and technological innovation. At the same time, urban sprawl reduces the probability of matching factors of production and the capacity for intra-city division of labor, increasing transaction costs (Partridge et al., 2009). Intuitively, urban sprawl reduces spatial agglomeration, and low agglomeration is detrimental to productivity (Lucas and Rossi-Hansberg, 2002). However, the impact of urban sprawl on productivity may not be a single negative effect. In high-density cities, where diseconomies of agglomeration due to traffic congestion and high housing prices may outweigh the contribution of agglomeration economies, urban sprawl can mitigate diseconomies of agglomeration to some extent, thereby contributing to productivity gains (Melo et al., 2017). Empirical analyses have also found that the effect of urban sprawl on productivity is insignificant and not necessarily negative, and that polycentric agglomeration patterns can significantly increase urban productivity (Bartoloni and Baussola, 2021). There may be a “degree” of urban sprawl, with moderate sprawl contributing to urban productivity while excessive sprawl has a dampening effect.
The relationship between urban sprawl and eco-environment is more complex, showing mainly a dual impact. On the one hand, urban sprawl has led to a shift of urban activities from the center to the periphery, and the suburbanization of the population has reduced urban population density, resulting in a reduction in carbon emissions per unit area and an improvement in urban environmental quality (Yang and Yan, 2021). The expansion of urban space has been accompanied by a gradual expansion of green areas within the city and an improvement in the eco-environment (Renata et al., 2021). On the other hand, urban sprawl has a negative impact on the eco-environment through traffic and travel, urban construction, and other aspects. As cities continue to expand into the surrounding rural areas, green open spaces are being swallowed up in large numbers, destroying the inherent self-regulating ecosystems of cities. Bueno-Suarez and Coq-Huelva (2020) argue that urban sprawl leads to the occupation of arable land, the destruction of ecological wetlands, and environmental pollution, which have a negative impact on the eco-environment. The construction of cities and infrastructure is accompanied by a dramatic increase in resource consumption and pollutant emissions. Using global nighttime lighting data, Tao et al. (2021) found that urban sprawl can disperse inner city space, increase commuting distances, and change travel patterns, thereby consuming more fossil energy and increasing urban PM2.5 concentrations.
In summary, studies have focused on the productivity effects or eco-environment effects of urban sprawl, with little literature integrating urban sprawl and GTFP into a unified analytical framework. In fact, GTFP encompasses both productivity and environmental factors. It is through the impact of urban sprawl on urban productivity and eco-environment that GTFP is affected. Based on this, this paper uses DMSP/OLS and NPP/VIIRS nighttime light integration data, LandScan population dynamics statistics to construct an urban sprawl index, and a super-SBM model that considers undesirable outputs to measure GTFP. Based on a panel of Chinese cities from 2006 to 2020, a spatial econometric model was constructed to explore the effect of urban sprawl on GTFP from multiple perspectives. This study attempts to provide valuable information for optimizing the spatial layout of cities and promoting new types of urbanization and high-quality development.
3 Empirical framework and data
3.1 Empirical framework
3.1.1 Spatial correlation test
Spatial correlation is a fundamental property of attributes of geographical objects in space (Moran, 1948). Before constructing a spatial econometric model, it is necessary to perform a spatial correlation test. The spatial autocorrelation index captures whether the variables are significantly spatially dependent at a given spatial scale (Chen, 2021). In this paper, Moran’s index (Moran’s I) was used to conduct a spatial autocorrelation test to analyze the distribution characteristics of the variables in geographical space. The calculation formula is as follows:
where
3.1.2 Model construction
In the model setting, the spatial lag model (SLM) measures the degree of spatial dependence by considering endogenous interactions of explanatory variables, and the model can capture the indirect effects (spatial spillover) of explanatory variables within a region on the surrounding region. In addition, as regional spatial correlations are quite complex, there may be interactions between spatial error terms. A spatial error model (SEM) can measure the impact of certain unobservable factors in the surrounding region on the explanatory variables in that region (Ugarte, 2011). This paper introduces spatial interactions into panel regression models and combines the SLM model with the SEM model to form a more generalized spatial Durbin model (SDM) (Zhao et al., 2020). In fact, it provides an appropriate framework to capture direct, indirect, and aggregate spatial effects by considering both endogenous and exogenous interactions. Specifically, the SDM model is expressed as follows:
where subscripts i and t denote city and year, respectively. W is the spatial weight matrix. GTFPit denotes GTFP and WGTFPit is its spatial lag term. USit denotes urban sprawl and WUSit is its spatial lag term. Xit denotes control variables. μi, ξt and εit are spatial fixed effects, time fixed effects and random error terms.
The spatial weight matrix is crucial to spatial econometric models, which capture the way in which geographic elements influence each other (Liu and Liu, 2019). To fully consider the reality of geographic attributes, an inverse geographic distance matrix was constructed to reflect the geospatial relationships between cities (Kim et al., 2019). The inter-city distance data were measured by the distance function of ArcGIS software, and the vector base map data were obtained from the standard map of the Ministry of Natural Resources of China (GS (2019)1719). The weight matrix is constructed using the following formula:
where dij denotes the distance between city i and city j. In order to retain as much as possible, the main features of the spatial weight matrix and to avoid the loss of economic interpretation of the weight matrix due to distance decay, the maximum characteristic roots of the matrix are used for normalization.
3.2 Data source and variable description
Based on data availability, in this study, panel data for 270 prefecture-level or above cities in mainland China from 2006 to 2020 were selected. These data were collected from the National Bureau of Statistics of China, the China Statistical Yearbook, and the municipal statistical yearbook.
3.2.1 Explained variable
This paper measures GTFP using a super-SBM model that takes undesirable output into account. The model expressions are as follows (Liu and Wang, 2008):
where
The choice of input-output variables is important for the SBM model (Table 1). Based on the production function in economic growth theory, cities are used as decision units to measure GTFP.
(1) Input variables. Economic growth theory uses capital and labor as the main input factors for economic growth. With regard to the capital element, fixed asset investment plays a decisive role in regional economic development, while output is more dependent on the capital stock formed by past investment, so the fixed capital stock is used to represent capital input (Dong X et al., 2022). Urban fixed capital stocks were estimated using the perpetual inventory method and adjusted using provincial fixed capital investment deflators. At the same time, total energy consumption converted to standard coal was also used as an input variable, taking into account the far-reaching impact of energy consumption on urban productivity (Ding et al., 2017). The labor element continues the approach adopted in most of the literature (Zhang J et al., 2020), where the total number of people employed in urban units and the private sector is summed to obtain the total number of people employed in the labor force to represent labor input.
(2) Desirable output variables. Desirable output is captured using two indicators: GDP, which measures economic output, and local fiscal revenue, which measures the efficiency and profitability of enterprises and institutions. The introduction of fiscal revenue as an output indicator is effective in preventing idiosyncratic bias in GDP, providing a more comprehensive picture of urban productivity, and making the results more accurate (Yamazaki, 2022). To exclude the effect of price factors, GDP is deflated using the provincial price indices for the base period of 2006.
(3) Undesirable output variables. While cities are capturing desirable outputs, they are often accompanied by a range of pollutants such as carbon dioxide, sulfur dioxide, dust, sewage, and noise that have a negative impact on the environment, which are known as undesirable outputs. Undesirable outputs have both negative economic and ecological effects, weakening the actual results of economic development and causing waste of resources and environmental pollution (Zhang et al., 2011). Therefore, it is important to minimize undesirable outputs while keeping desirable outputs constant. Considering the availability of data, the pollution index was measured using a combination of industrial wastewater emissions, industrial sulfur dioxide emissions and industrial smoke and dust emissions as a proxy indicator. The indicator weights were first estimated using the entropy weighting method, and then a weighted average of the standardized indicator values was used to obtain the pollution index.
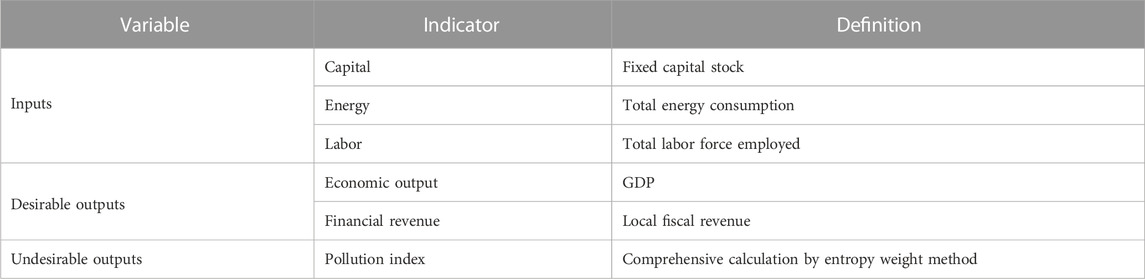
TABLE 1. Input-output indicator system of GTFP.
3.2.2 Explanatory variable
This paper uses DMSP/OLS with NPP/VIIRS nighttime lighting data and LandScan global population dynamics statistics to construct an urban sprawl index. The specific measurement steps are as follows.
(1) Integration of DMSP/OLS and NPP/VIIRS nighttime lighting data. DMSP/OLS data from 2006 to 2013 and NPP/VIIRS data from 2013 to 2020 were selected, and the nighttime lighting data were cropped according to the administrative boundaries of China, converting the lighting images from WGS84 geographic coordinates to equal area projections in Albers geographic coordinates, while the image data were spatially resampled to 1 km image elements. The administrative division vector data used in the process is taken from the National 1:4 million database of the National Centre for Basic Geographic Information. The pre-processing of DMSP/OLS data includes mutual correction, continuous correction, and saturation correction; the pre-processing of NPP/VIIRS data includes synthesis of annual data, resampling, and de-negativity (Zhang and Seto, 2011; Liu et al., 2012). The final results are stable and comparable nighttime lighting integration data from 2006 to 2020.
(2) Extraction of urban extent. Based on China’s economic development and urban population changes, it is assumed that the urbanization process is irreversible and that there will be no urban land that exists in the first period but disappears in the second. With the help of integrated nighttime lighting data, city boundaries were extracted using a threshold of 10 for the light intensity value (Cheng and Gao, 2021). This method largely avoids the bias of the district statistics and gives a clearer picture of the real city’s area and shape.
(3) Definition of urban sprawl. Urban sprawl does not necessarily lead to urban sprawl; only anomalous sprawl in which slow population growth over the same period leads to a decrease in urban population density is considered urban sprawl (Schneider and Woodcock, 2008). In this paper, the developed but less populated areas within the city are regarded as urban inactive areas. Inactive areas are the result of urban sprawl, and they reflect the state of uncontrolled land use and low-density expansion that occurred during urban sprawl. In this regard, LandScan population data is used to measure population concentrations within cities to determine the type of urban sub-region to which they belong, and to construct an urban sprawl index.
(4) Construction of the urban sprawl index. Drawing on the methodology of Fallah et al. (2011), urban space is divided into two types: low density and high density, using the national average density as the boundary. Since land urbanization is generally faster than population urbanization in China, the changes in population and land area are considered at the same time to reflect the degree of urban sprawl.
By using LandScan population data to identify the population distribution of all the rasters within a city, the rasters belonging to the same city are summed up to obtain the population and land area of the city, and the average population density of the city is calculated. The national average population density is used as a criterion to classify high- and low-density urban areas. The number of people in each region is summed to obtain the proportion of people in the city with a population density higher and lower than the national average, HP and LP, which in turn gives the population spread index (SP); the land area in each region is summed to obtain the proportion of land area in the city with a population density higher and lower than the national average, HA and LA, which in turn gives the land spread index (SA).
A more scientific urban sprawl index (Sprawl) is constructed by combining both population and land dimensions of the sprawl index. This indicator provides a comprehensive and accurate picture of the typical characteristics of China’s urban sprawl: population decentralization, low urban spatial density and declining land use intensity.
where Sprawli has a value range of [0,1], the closer to one the higher the degree of urban sprawl.
3.2.3 Control variables
In order to enhance the accuracy of this empirical research, six control variables that could have an impact on GTFP were selected by referring to relevant literature studies (Tang et al., 2017; Zhang et al., 2021; Zhan et al., 2022). Specifically, the following control variables were included: economic growth; industrial structure; technological progress; market size; infrastructure construction; and openness degree. The model variables and a summary of the statistics are presented in Table 2.
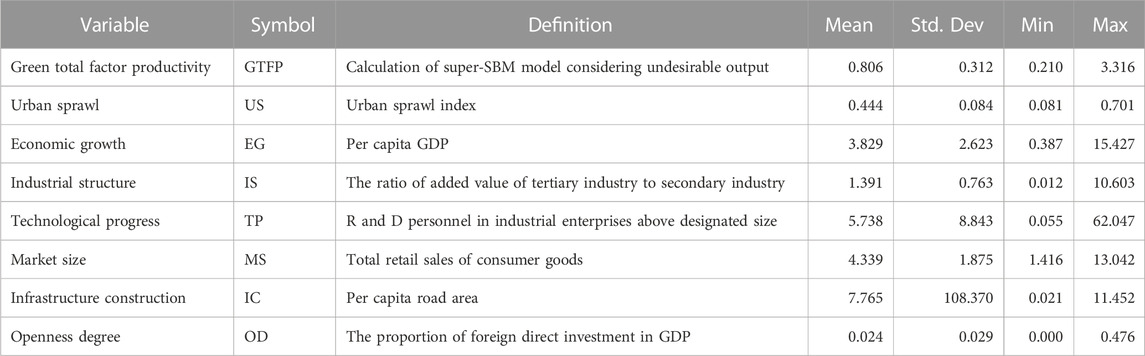
TABLE 2. Definitions and data description of variables.
4 Empirical results and analysis
4.1 Applicability and selection of specific spatial model
Based on a standardized inverse geographical distance weight matrix, Moran’s I was used to test for spatial autocorrelation of GTFP, urban sprawl, and control variables (Table 3). The results show that Moran’s I for each variable passes the 1% significance level test and that there is significant spatial dependence. At the same time, this spatial dependence shows a roughly gradual increase, which means that the links between cities are increasingly strengthened. Therefore, it is necessary to apply a spatial econometric model to analyze the impact of urban sprawl on GTFP.

TABLE 3. Spatial autocorrelation test for variables.
In order to avoid the effect of model setup errors on the validity of the estimation results, an appropriate spatial econometric model should be scientifically selected. For this purpose, the Hausman test was first conducted. The results of the Hausman test indicate that two-way fixed effects in time and space are more appropriate. Further calculate LM, LR, and Wald statistics based on the spatiotemporal fixed effect model (Table 4). Table 4 presents the LM and robot LM statistical coefficients at a significance level of p 0.01; this indicates that the choice of the SDM model for estimation is more effective. At the 1% significance level, LR and Wald test results reject the case that the SDM model can be converted to the SLM and SEM models. Therefore, the two-way fixed effects SDM model was selected for subsequent empirical analysis.
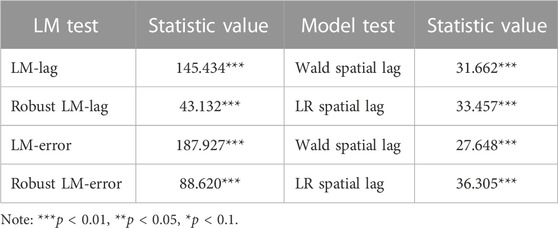
TABLE 4. Spatial econometric model selection test.
4.2 SDM model estimation results
If the model contains both time and space fixed effects, the parameter estimates tend to be biased when the sample size and period are large. The bias correction for parameter estimates obtained based on maximizing the likelihood function is based on the approach of Lee and Yu (2012). Table 5 reports the estimation results for the SDM model, with model 1) as a random effects model, model 2) as a fixed effects model, and model 3) as a bias-corrected fixed effects model.
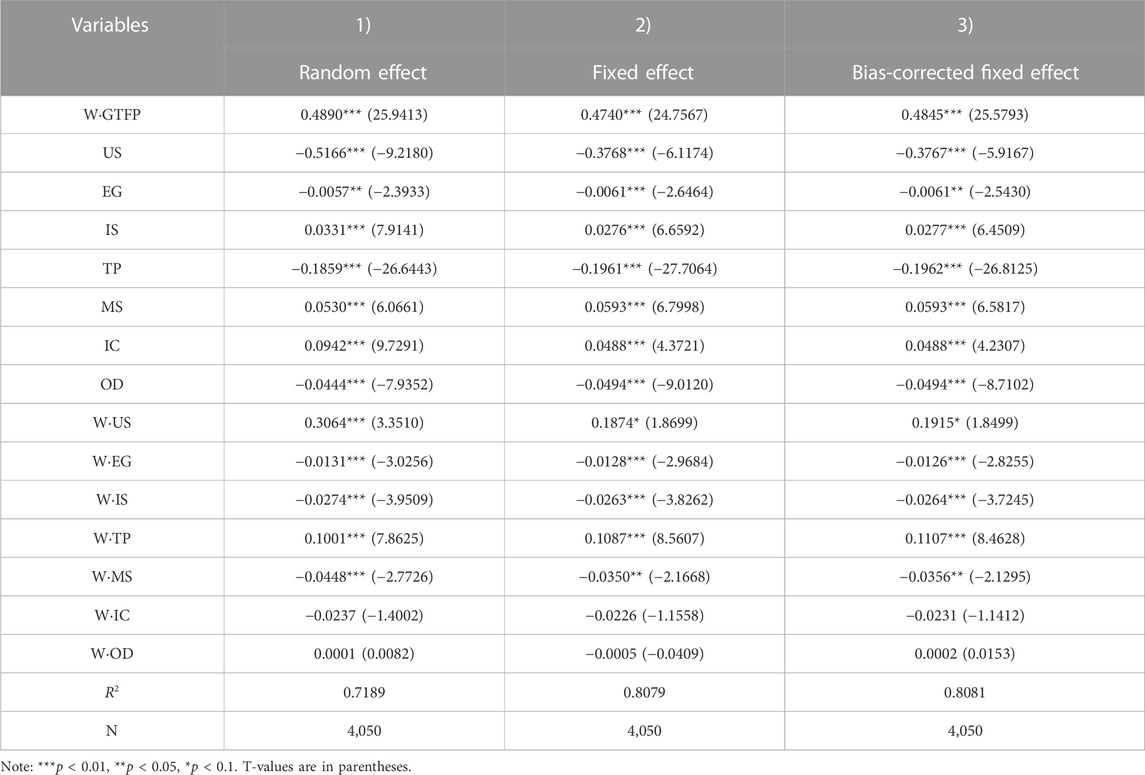
TABLE 5. SDM model estimation results.
As can be seen from Table 5, the coefficient of the spatial lag term of the variable is more sensitive to bias correction. According to the estimation results of model 3), the coefficient of the spatial lag term of GTFP is 0.4845, which passes the 1% significance test. This suggests that there is a significant spatial spillover effect of GTFP in China and that an increase in GTFP in cities will have a positive impact on the quality of economic development in neighboring cities.
Based on model 3), the direct effect, indirect effect, and total effect of each explanatory variable were further measured (Table 6). The direct effect coefficients do not correspond exactly to those of the SDM model, mainly due to feedback effects (Ojede et al., 2018). The feedback effect is generated because changes in the explanatory variables cause responses in neighboring cities, which in turn transmit the effects of the neighboring cities back to the city, as reflected in the spatially lagged terms of the explanatory and explained variables, respectively.
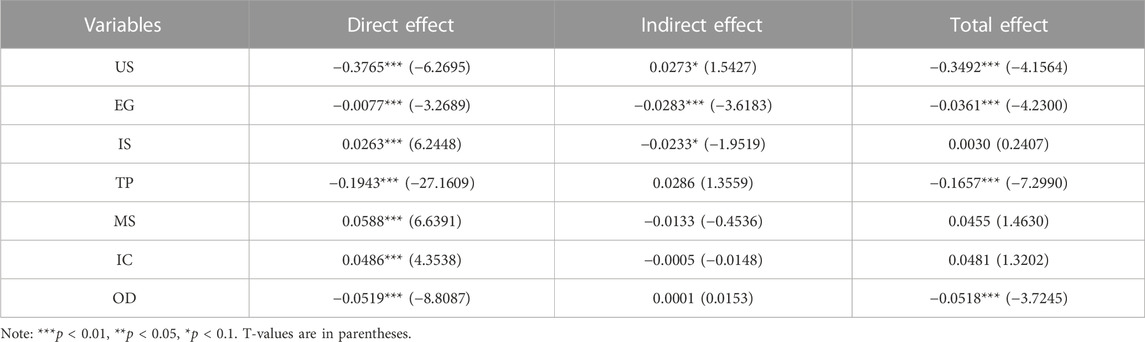
TABLE 6. Direct and indirect effects of SDM model in bias-corrected fixed effect.
As can be seen from Table 6, the direct effect coefficient of urban sprawl on GTFP is 0.3765, which passes the 1% significance level test, implying that urban sprawl will inhibit the increase of GTFP in the city itself. The reason for this may be that urban sprawl in China has led to a low-density and spatially dispersed intra-urban pattern, weakening positive agglomeration externalities such as resource sharing, efficient matching, and knowledge spillovers (Wang et al., 2020); at the same time, urban sprawl has led to further agglomeration in high-density areas, reinforcing congestion effects and agglomeration costs, and to some extent hindering green total factor productivity (Tian et al., 2017). The coefficient of spatial spillover effect of urban sprawl is 0.0273, indicating that urban sprawl has a catalytic effect on the GTFP of neighboring cities. Sprawl allows the urban fringe to expand outwards, bringing the geographical distance between the city and its neighbors closer, facilitating neighboring cities to share the benefits of agglomeration, and promoting GTFP. The total effect of urban sprawl on GTFP is significantly negative at the level of 1%. This is because the negative inhibition effect of urban sprawl on the GTFP of the city itself exceeds the positive promotion effect of urban sprawl on the GTFP of the city. Overall, urban sprawl is not conducive to GTFP growth.
4.3 Robustness check
This paper carries out robustness tests of the model estimation results in terms of replacing the measures, excluding special samples, and transforming the spatial weight matrix. Much of the literature dealing with urban sprawl and agglomeration economies directly uses population density (ratio of resident population to urban area) as a measure of urban sprawl, so the model is re-estimated using urban population density (PD) instead of the urban sprawl index as the explanatory variable. Considering that municipalities are directly administered by the central government and their development plans may differ from those of prefecture-level cities (Lin and Zhu, 2021), they are excluded to avoid policy bias. In addition, the spatial weight matrix of (0,1) neighborhood relations was used to replace the inverse geographical distance weight matrix for robustness testing. The test results are shown in Table 7.
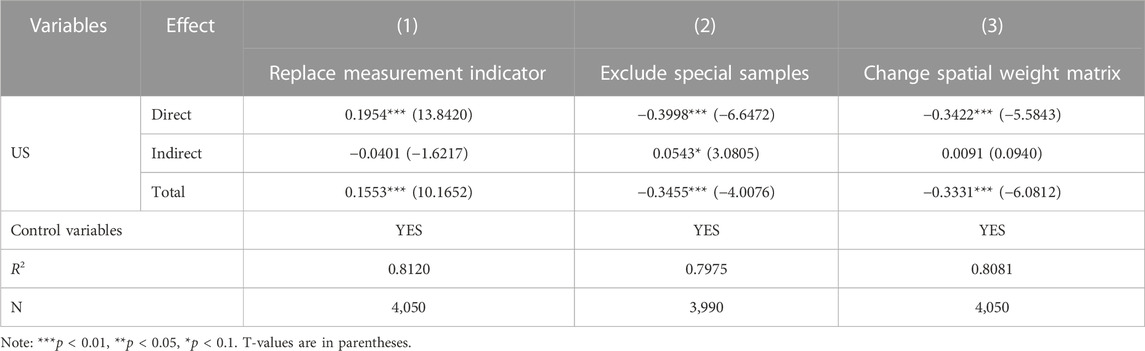
TABLE 7. Robustness check results.
Population density has an inverse quantitative relationship with the urban sprawl index, with higher population density implying lower urban sprawl. The direct and total effects of urban population density on GTFP are positive, passing the 1% significance level test. This validates the conclusion that urban sprawl causes a dampening effect on GTFP. After removing municipalities and transforming the spatial weight matrix, the coefficients of the variables obtained from the re-estimation remained largely consistent and showed strong robustness. Overall, urban sprawl is indeed detrimental to GTFP and the findings of the study are credible.
4.4 Heterogeneity analysis
This paper examines the heterogeneity of the model estimation results in terms of city size and geographical area, and provides insight into the scale and regional differences in the effects of urban sprawl on GTFP (Table 8). The sample is divided into four types: small cities, medium cities, large cities and mega cities, using the 2020 urban population as the criterion. According to the distribution of natural resources and economic and social development, China is divided into four economic zones: eastern, central, western and northeastern.
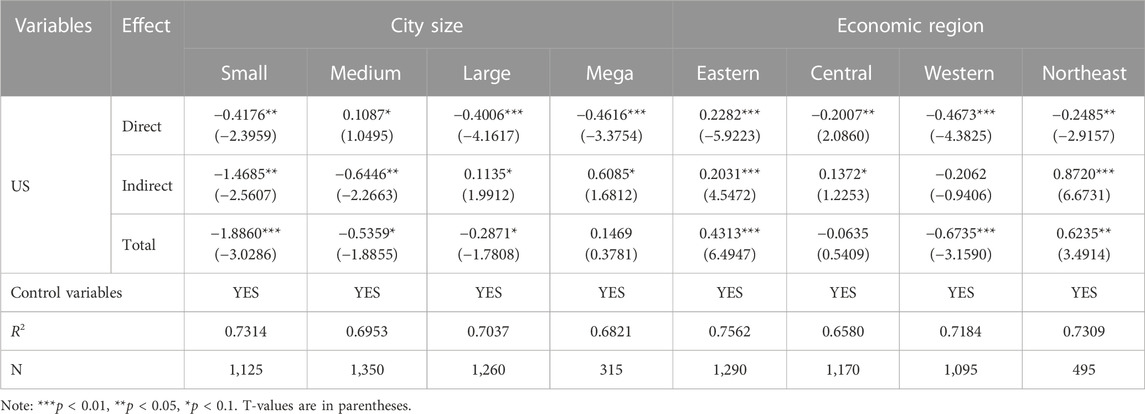
TABLE 8. Heterogeneity test results.
4.4.1 City size heterogeneity
There is some variation in the effect of sprawl on GTFP in cities of different sizes.
(1) Direct effect. The direct effect of sprawl on GTFP is significantly negative for small cities, large cities and mega cities at the 5% significance level, with a significantly stronger effect for mega cities. The reason is that mega cities are economically developed, with high development intensity and population density in the central city, while urban sprawl widens the spatial distance between economic agents within the city, weakening the scale effect (Zheng et al., 2018), which is not conducive to the enhancement of GTFP. The direct effect of the sprawl of medium-sized cities on GTFP is positive because the development of blocks within medium-sized cities is relatively balanced and the core agglomerations are not prominent. Under resource and environmental constraints, urban sprawl is conducive to enhancing intra-city factor flows and inter-block network linkages, thus promoting GTFP.
(2) Indirect effect. The spread of large cities and mega cities has a catalytic effect on the GTFP of surrounding cities. This is because the sprawl of large cities reduces the geographical distance between cities, bringing them closer together and promoting innovative knowledge spillovers, factor and capital flows, which in turn have a radiating effect on neighboring cities (Bartoloni and Baussola, 2021). The indirect effect of sprawl on GTFP in small and medium-sized cities is significantly negative at the 5% level. The reason for this is that small and medium-sized cities are relatively poor in transport facilities and factors of production, and sprawl, while bringing them closer to neighboring cities, can provide insufficient positive spillover effects.
(3) Total effect. The total effect of urban sprawl in large, medium and small cities is significantly negative, except for the total effect of mega-city sprawl on GTFP, which is positive.
Overall, the sprawl of large and mega-cities significantly inhibits their own GTFP and contributes to the GTFP of neighboring cities; the direct effect of the sprawl of medium-sized cities is positive, while the indirect and total effects are negative; the sprawl of small cities has a negative effect on both their own and neighboring cities’ GTFP.
4.4.2 Regional heterogeneity
The effect of urban sprawl on GTFP varies somewhat across regions.
(1) Direct effect. The direct effect of urban sprawl on GTFP is negative at the 5% significance level in the central, western and northeastern regions. The reason is that the central areas of most cities within these regions are still in the agglomeration phase and urban sprawl is not conducive to the development of agglomeration economies (Zhang et al., 2022), thus having a dampening effect on GTFP. The direct effect of urban sprawl on GTFP is significantly positive in the eastern region. This is because the eastern region is economically developed and many cities have formed a polycentric development pattern. Urban sprawl is conducive to strengthening inter-block linkages and weakening the congestion effect of central areas, thus promoting GTFP.
(2) Indirect effect. The indirect effect of urban sprawl on green total factor productivity was significantly positive in the eastern, central and northeastern regions, while the indirect effect was negative in the western region. This means that urban sprawl in economically active regions is more likely to contribute to GTFP in neighboring cities, mainly through spatial spillovers of labor, knowledge, and capital (Li et al., 2022).
(3) Total effect. The total effect of urban sprawl on GTFP is negative in the central and western regions, while the total effect is positive in the eastern and northeastern regions.
Overall, urban sprawl in the eastern region has a significant contribution to GTFP in both itself and its neighboring cities; the direct effect of urban sprawl in the central and northeastern regions is negative and the indirect effect is positive; urban sprawl in the western region has a negative effect on GTFP in both itself and its neighboring cities.
5 Conclusion and discussion
5.1 Conclusions
The main objective of this study is to systematically investigate the impact of urban sprawl on GTFP, both theoretically and empirically. Firstly, a theoretical analysis revealed the mechanisms by which urban sprawl leads to changes in productivity and eco-environment. Secondly, we use nighttime lighting data and LandScan population dynamics statistics to construct an urban sprawl index and apply a super-SBM model that considers undesirable output to measure GTFP. On this basis, a SDM model was developed to examine the specific effects of urban sprawl on GTFP based on panel data of Chinese cities from 2006 to 2020.
The results of the study show that, on the whole, urban sprawl in China has a dampening effect on GTFP; however, the spillover effect from urban sprawl is beneficial to the GTFP of neighboring cities due to the existence of inter-city spatial correlation. Robustness tests proved the credibility of the study’s findings. Heterogeneity analysis shows that the effect of urban sprawl on GTFP varies significantly across cities of different sizes and across regions.
5.2 Policy implications
The findings of the study have implications for promoting a new type of urbanization with people at its core, optimizing the spatial layout of cities, and promoting economic transformation, upgrading and high-quality development.
First, urban sprawl during the urbanization process should be properly controlled. When regulating the size and spatial layout of the city’s population, the management cannot simply rely on land expansion to ease the pressure on the central city in the face of the trend towards increasing population density in the central city. Targeted measures should be taken to optimize the layout of infrastructure to improve the quality and efficiency of public services in accordance with the actual land use of the city, thereby reducing the negative externalities and congestion effects of agglomeration and improving urban efficiency.
Second, in order to avoid urban sprawl, the traditional urban planning model should be changed to advocate eco-environmental fit and public participation in urban planning. Policymakers should scientifically delineate urban development boundaries, strictly control the number of new parks and the scale of construction land, adhere to the compact city development model, focus on the efficiency of land development and use, and use market mechanisms to guide the location choices of enterprises and individuals within and between cities. Encourage mixed-use and compact development of urban land to form a more rational urban spatial structure and enhance the ecological resource carrying capacity of the city.
Third, when carrying out urban sprawl regulation, attention needs to be paid to urban scale differences, regional differences, and spatial correlations. Local governments should adhere to city-specific policies, pay attention to the integration of economic development, population movement, and industrial structure of the region when formulating planning guidelines, maintain a scientific intensity of land development and population concentration, and promote high-quality economic development. Large cities with advanced economies should maintain moderate urban sprawl, strengthen the spatial match between population and industry, take advantage of capital and talent to develop high-tech industries, and use technological innovation to help boost GTFP. Smaller cities that are economically backward should guard against urban sprawl, promote the gathering of population in the central area, and give full play to the scale effect brought about by agglomeration. In addition, cities should fully consider the influence of neighboring cities when planning their own development, effectively bring into play the spatial correlation between cities, build a city network system with complementary industrial structures, rational division of functions, orderly flow of factors, and shared knowledge overflow, and promote the synergistic enhancement of GTFP.
5.3 Strength and limitations
Our research makes several contributions to the literature on urban sprawl and its socio-economic impacts. First, we provide insight into the link between urban sprawl and GTFP, contributing to the enrichment of knowledge on the determinants of productivity and eco-environmental change. Second, the integrated use of nighttime lighting data and LandScan population dynamics statistics to construct an urban sprawl index effectively overcomes the limitations of traditional statistics and makes the measurement results more accurate. Third, the impact of urban sprawl on GTFP is studied under a spatial econometric framework, considering spatial interaction effects, thereby reducing estimation bias and improving precision.
Admittedly, our research also has some limitations, mainly in terms of data, indicators, and models. Due to limited data availability, some meaningful indicators (including carbon emissions, PM2.5, water quality, soil environmental quality, the number of clean days in a year, etc.) were not considered when measuring the GTFP. In the context of sustainable development, research on the measurement of cleaner production and eco-environmental quality has received increasing attention from scholars. Future research should follow this trend and improve the accuracy of GTFP measurements. This paper does not consider the possible non-linear interaction relationship between urban sprawl and GTFP. With the development of spatial econometrics, it can be examined in the future using spatial non-parametric models. Furthermore, the effect of urban sprawl on GTFP is only verified by the empirical case of Chinese cities using spatial econometric models in this study. Future validation in other parts of the world, especially in developing countries, will be necessary to test the generalizability of the method.
Data availability statement
Publicly available datasets were analyzed in this study. This data can be found here: The datasets analyzed for this study can be found in the National Bureau of Statistics of China http://www.stats.gov.cn/.
Author contributions
SL: Writing—Original draft preparation, Methodology, Conceptualization. PW: Writing—Reviewing and Editing, Validation, Supervision. All authors have read and agreed to the published version of the manuscript.
Funding
This work was supported by the Major Program of National Fund of Philosophy and Social Science of China (20&ZD133).
Conflict of interest
The authors declare that the research was conducted in the absence of any commercial or financial relationships that could be construed as a potential conflict of interest.
Publisher’s note
All claims expressed in this article are solely those of the authors and do not necessarily represent those of their affiliated organizations, or those of the publisher, the editors and the reviewers. Any product that may be evaluated in this article, or claim that may be made by its manufacturer, is not guaranteed or endorsed by the publisher.
References
Bartoloni, E., and Baussola, M. (2021). Productivity and earnings at the firm-plant level: The case of Lombardy’s urban and non-urban agglomerations. Spat. Econ. Anal. 16 (3), 333–354. doi:10.1080/17421772.2020.1854480
Bueno-Suarez, C., and Coq-Huelva, D. (2020). Sustaining what is unsustainable: A review of urban sprawl and urban socio-environmental policies in North America and western europe. Sustainability 12 (11), 4445. doi:10.3390/su12114445
Chen, D., Lu, X., Hu, W., Zhang, C., and Lin, Y. (2021). How urban sprawl influences eco-environmental quality: Empirical research in China by using the Spatial Durbin model. Ecol. Indic. 131, 108113. doi:10.1016/j.ecolind.2021.108113
Chen, S., and Golley, J. (2014). ’Green’ productivity growth in China’s industrial economy. Energy Econ. 44, 89–98. doi:10.1016/j.eneco.2014.04.002
Chen, R., and Kong, Y. (2022). Redefine carbon footprint performance with the total factor productivity: A case from a regional food production system. Ecol. Indic. 144, 109540. doi:10.1016/j.ecolind.2022.109540
Chen, M., and Wang, H. (2022). Import technology sophistication and high-quality economic development: Evidence from city-level data of China. Econ. Research-Ekonomska Istraživanja 35 (1), 1106–1141. doi:10.1080/1331677x.2021.1956362
Chen, Y. (2021). An analytical process of spatial autocorrelation functions based on Moran’s index. PloS One 16 (4), e0249589. doi:10.1371/journal.pone.0249589
Cheng, K., and Gao, D. (2021). The mechanism and effects of urban sprawl on total factor productivity in prefecture level cities of China: Based on DMSP/OLS and NPP/VIIRS night light data. China Land Sci. 35 (11), 90–100. (in Chinese). doi:10.11994/zgtdkx.20211103.152823
Ding, Q., Cai, W., Wang, C., and Sanwal, M. (2017). The relationships between household consumption activities and energy consumption in China— an input-output analysis from the lifestyle perspective. Appl. Energy 207, 520–532. doi:10.1016/j.apenergy.2017.06.003
Dong, H., Liu, W., Liu, Y., and Xiong, Z. (2022). Fixed asset changes with carbon regulation: The cases of China. J. Environ. Manag. 306, 114494. doi:10.1016/j.jenvman.2022.114494
Dong, X., Chen, Y., Zhuang, Q., Yang, Y., and Zhao, X. (2022). Agglomeration of productive services, industrial structure upgrading and green total factor productivity: An empirical analysis based on 68 prefectural-level-and-above cities in the Yellow River Basin of China. Int. J. Environ. Res. Public Health 19 (18), 11643. doi:10.3390/ijerph191811643
Fallah, B. N., Partridge, M. D., and Olfert, M. R. (2011). Urban sprawl and productivity: Evidence from US metropolitan areas. Pap. Regional Sci. 90 (3), 451–472. doi:10.1111/j.1435-5957.2010.00330.x
Gao, B., Huang, Q., He, C., Sun, Z., and Zhang, D. (2016). How does sprawl differ across cities in China? A multi-scale investigation using nighttime light and census data. Landsc. Urban Plan. 148, 89–98. doi:10.1016/j.landurbplan.2015.12.006
George, G., Royce, H., and Michael, R. (2008). Wrestling sprawl to the ground: Defining and measuring an elusive concept. Hous. Policy Debate 12 (4), 681–717. doi:10.1080/10511482.2001.9521426
Guan, D., He, X., He, C., Cheng, L., and Qu, S. (2020). Does the urban sprawl matter in yangtze river economic belt, China? An integrated analysis with urban sprawl index and one scenario analysis model. Cities 99, 102611. doi:10.1016/j.cities.2020.102611
Han, J. (2020). Can urban sprawl be the cause of environmental deterioration? Based on the provincial panel data in China. Environ. Res. 189, 109954. doi:10.1016/j.envres.2020.109954
Hao, A., Tan, J., Ren, Z., and Zhang, Z. (2022). A spatial empirical examination of the relationship between agglomeration and green total-factor productivity in the context of the carbon emission peak. Front. Environ. Sci. 10, 829160. doi:10.3389/fenvs.2022.829160
Henderson, M., Yeh, E. T., Gong, P., Elvidge, C., and Baugh, K. (2003). Validation of urban boundaries derived from global night-time satellite imagery. Int. J. Remote Sens. 24 (3), 595–609. doi:10.1080/01431160304982
Henderson, J. V., Storeygard, A., and Weil, D. (2012). Measuring economic growth from outer space. Am. Econ. Rev. 102 (2), 994–1028. doi:10.1257/aer.102.2.994
Jaeger, J. A. G., Bertiller, R., Schwick, C., Cavens, D., and Kienast, F. (2010). Urban permeation of landscapes and sprawl per capita: New measures of urban sprawl. Ecol. Indic. 10 (2), 427–441. doi:10.1016/j.ecolind.2009.07.010
Kim, S. W., Achana, F., and Petrou, S. (2019). A bootstrapping approach for generating an inverse distance weight matrix when multiple observations have an identical location in large health surveys. Int. J. Health Geogr. 18 (1), 27. doi:10.1186/s12942-019-0189-5
Liu, Z., He, C., Zhang, Q., Huang, Q., and Yang, Y. (2012). Extracting the dynamics of urban expansion in China using DMSP-OLS nighttime light data from 1992 to 2008. Landsc. Urban Plan. 106 (1), 62–72. doi:10.1016/j.landurbplan.2012.02.013
Lan, H., Zheng, P., and Li, Z. (2021). Constructing urban sprawl measurement system of the Yangtze River economic belt zone for healthier lives and social changes in sustainable cities. Technol. Forecast. Soc. Change 165, 120569. doi:10.1016/j.techfore.2021.120569
Lee, L., and Yu, J. (2012). QML estimation of spatial dynamic panel data models with time varying spatial weights matrices. Spat. Econ. Anal. 7 (1), 31–74. doi:10.1080/17421772.2011.647057
Li, G., and Li, F. (2019). Urban sprawl in China: Differences and socioeconomic drivers. Sci. Total Environ. 673, 367–377. doi:10.1016/j.scitotenv.2019.04.080
Li, X., Zhou, M., Zhang, W., Yu, K., and Meng, X. (2022). Study on the mechanism of haze pollution affected by urban population agglomeration. Atmosphere 13 (2), 278. doi:10.3390/atmos13020278
Lin, B., and Zhu, J. (2021). Impact of China’s new-type urbanization on energy intensity: A city-level analysis. Energy Econ. 99, 105292. doi:10.1016/j.eneco.2021.105292
Liu, F., and Liu, C. (2019). Regional disparity, spatial spillover effects of urbanisation and carbon emissions in China. J. Clean. Prod. 241, 118226. doi:10.1016/j.jclepro.2019.118226
Liu, F., and Wang, P. (2008). DEA malmquist productivity measure: Taiwanese semiconductor companies. Int. J. Prod. Econ. 112 (1), 367–379. doi:10.1016/j.ijpe.2007.03.015
Liu, X., Liu, Y., and Wang, B. (2022). Evaluating the sustainability of Chinese cities: Indicators based on a new data envelopment analysis model. Ecol. Indic. 137, 108779. doi:10.1016/j.ecolind.2022.108779
Lu, C., Li, L., Lei, Y., Ren, C., Su, Y., Huang, Y., et al. (2020). Coupling coordination relationship between urban sprawl and urbanization quality in the west Taiwan Strait Urban Agglomeration, China: Observation and analysis from DMSP/OLS nighttime light imagery and panel Data. Remote Sens. 12 (19), 3217. doi:10.3390/rs12193217
Lucas, R. E., and Rossi-Hansberg, E. (2002). On the internal structure of cities. Econometrica 70 (4), 1445–1476. doi:10.1111/1468-0262.00338
Mardani, A., Zavadskas, E. K., Streimikiene, D., Jusoh, A., and Khoshnoudi, M. (2017). A comprehensive review of data envelopment analysis (DEA) approach in energy efficiency. Renew. Sustain. Energy Rev. 70, 1298–1322. doi:10.1016/j.rser.2016.12.030
Melo, P. C., Graham, D. J., Levinson, D., and Aarabi, S. (2017). Agglomeration, accessibility and productivity: Evidence for large metropolitan areas in the US. Urban Stud. 54 (1), 179–195. doi:10.1177/0042098015624850
Moran, P. A. P. (1948). The interpretation of statistical maps. J. R. Stat. Soc. Ser. B-statistical Methodol. 10 (2), 243–251. doi:10.1111/j.2517-6161.1948.tb00012.x
Mustafa, A., and Teller, J. (2020). Self-reinforcing processes governing urban sprawl in Belgium: Evidence over six decades. Sustainability 12 (10), 4097. doi:10.3390/su12104097
Ojede, A., Atems, B., and Yamarik, S. (2018). The direct and indirect (spillover) effects of productive government spending on State economic growth. Growth Change 49 (1), 122–141. doi:10.1111/grow.12231
Partridge, M. D., Rickman, D. S., Ali, K., and Olfert, M. R. (2009). Do new economic geography agglomeration shadows underlie current population dynamics across the urban hierarchy? Pap. Regional Sci. 88 (2), 445–466. doi:10.1111/j.1435-5957.2008.00211.x
Renata, R. C., Barbara, C., and Andrzej, S. (2021). Which polish cities sprawl the most. Land 10 (12), 1291. doi:10.3390/land10121291
Schneider, A., and Woodcock, C. E. (2008). Compact, dispersed, fragmented, extensive? A comparison of urban growth in twenty-five global cities using remotely sensed data, pattern metrics and census information. Urban Stud. 45 (3), 659–692. doi:10.1177/0042098007087340
Seevarethnam, M., Rusli, N., Ling, G. H. T., and Said, I. (2021). A geo-spatial analysis for characterising urban sprawl patterns in the Batticaloa Municipal Council, Sri Lanka. Land 10 (6), 636. doi:10.3390/land10060636
Tang, D., Tang, J., Xiao, Z., Ma, T., and Bethel, B. (2017). Environmental regulation efficiency and total factor productivity—effect analysis based on Chinese data from 2003 to 2013. Ecol. Indic. 73, 312–318. doi:10.1016/j.ecolind.2016.08.040
Tao, A., Liang, Q., Kuai, P., and Ding, T. (2021). The influence of urban sprawl on air pollution and the mediating effect of vehicle ownership. Processes 9 (8), 1261. doi:10.3390/pr9081261
Terzi, F., and Bolen, F. (2009). Urban sprawl measurement of Istanbul. Eur. Plan. Stud. 17 (10), 1559–1570. doi:10.1080/09654310903141797
Tian, L., Li, Y., Yan, Y., and Wang, B. (2017). Measuring urban sprawl and exploring the role planning plays: A shanghai case study. Land Use Policy 67, 426–435. doi:10.1016/j.landusepol.2017.06.002
Tone, K. (2001). A slacks-based measure of efficiency in data envelopment analysis. Eur. J. Operational Res. 130 (3), 498–509. doi:10.1016/s0377-2217(99)00407-5
Ugarte, M. D. (2011). Introduction to spatial econometrics. J. R. Stat. Soc. 174 (2), 513–514. doi:10.1111/j.1467-985x.2010.00681_13.x
Wang, X., Shi, R., and Zhou, Y. (2020). Dynamics of urban sprawl and sustainable development in China. Socio-Economic Plan. Sci. 70, 100736. doi:10.1016/j.seps.2019.100736
Wigginton, N. S., Fahrenkamp-Uppenbrink, J., Wible, B., and Malakoff, D. (2016). Cities are the future. Science 352, 904–905. doi:10.1126/science.352.6288.904
Wu, X., and Ge, P. (2019). Financial development transmission effect of urbanization on green TFP: Evidence from “The Belt and Road”. J. Guizhou Univ. Finance Econ. 198 (1), 18–29.
Wu, H., Hao, Y., and Ren, S. (2020). How do environmental regulation and environmental decentralization affect green total factor energy efficiency: Evidence from China. Energy Econ. 91, 104880. doi:10.1016/j.eneco.2020.104880
Wu, Y., Li, C., Shi, K., Liu, S., and Chang, Z. (2022). Exploring the effect of urban sprawl on carbon dioxide emissions: An urban sprawl model analysis from remotely sensed nighttime light data. Environ. Impact Assess. Rev. 93, 106731. doi:10.1016/j.eiar.2021.106731
Xu, X., Cui, Y., and Zhong, Y. (2021). Impact of environmental regulation and FDI on green total factor productivity: Evidence from China. Environ. Eng. Manag. J. 20 (2), 177–184. doi:10.30638/eemj.2021.018
Yamazaki, A. (2022). Environmental taxes and productivity: Lessons from Canadian manufacturing. J. Public Econ. 205, 104560. doi:10.1016/j.jpubeco.2021.104560
Yang, Y., and Yan, D. (2021). Does urban sprawl exacerbate urban haze pollution? Environ. Sci. Pollut. Res. 28 (40), 56522–56534. doi:10.1007/s11356-021-14559-1
Yuan, W., Li, J., Meng, L., Qin, X., and Qi, X. (2019). Measuring the area green efficiency and the influencing factors in urban agglomeration. J. Clean. Prod. 241, 118092. doi:10.1016/j.jclepro.2019.118092
Zhan, X., Li, R., Liu, X., He, F., Wang, M., Qin, Y., et al. (2022). Fiscal decentralisation and green total factor productivity in China: SBM-GML and IV model approaches. Front. Environ. Sci. 10, 989194. doi:10.3389/fenvs.2022.989194
Zhang, C., Liu, H., Bressers, H. T. A., and Buchanan, K. S. (2011). Productivity growth and environmental regulations - accounting for undesirable outputs: Analysis of China’s thirty provincial regions using the Malmquist-Luenberger index. Ecol. Indic. 70 (12), 2369–2379. doi:10.1016/j.ecolecon.2011.07.019
Zhang, Y., Jin, P., and Feng, D. (2015). Does civil environmental protection force the growth of China’s industrial green productivity? Evidence from the perspective of rent-seeking. Ecol. Indic. 51, 215–227. doi:10.1016/j.ecolind.2014.06.042
Zhang, J., Mishra, A. K., Zhu, P., and Li, X. (2020). Land rental market and agricultural labor productivity in rural China: A mediation analysis. World Dev. 135, 105089. doi:10.1016/j.worlddev.2020.105089
Zhang, X., Zhou, J., and Song, W. (2020). Simulating urban sprawl in China based on the artificial neural network-cellular automata-markov model. Sustainability 12 (11), 4341. doi:10.3390/su12114341
Zhang, J., Lu, G., Skitmore, M., and Ballesteros-Perez, P. (2021). A critical review of the current research mainstreams and the influencing factors of green total factor productivity. Environ. Sci. Pollut. Res. 28 (27), 35392–35405. doi:10.1007/s11356-021-14467-4
Zhang, M., Li, Y., Guo, R., and Yan, Y. (2022). Heterogeneous effects of urban sprawl on economic development: Empirical evidence from China. Sustainability 14 (3), 1582. doi:10.3390/su14031582
Zhang, Q., and Seto, K. C. (2011). Mapping urbanization dynamics at regional and global scales using multi-temporal DMSP/OLS nighttime light data. Remote Sens. Environ. 115 (9), 2320–2329. doi:10.1016/j.rse.2011.04.032
Zhao, L., and Chen, L. (2022). Research on the impact of government environmental information disclosure on green total factor productivity: Empirical experience from Chinese province. Int. J. Environ. Res. Public Health 19 (2), 729. doi:10.3390/ijerph19020729
Zhao, P., Zeng, L., Lu, H., Zhou, Y., Hu, H., and Wei, X. (2020). Green economic efficiency and its influencing factors in China from 2008 to 2017: Based on the super-SBM model with undesirable outputs and spatial Dubin model. Sci. Total Environ. 741, 140026. doi:10.1016/j.scitotenv.2020.140026
Keywords: urban sprawl, green total factor productivity, nighttime lighting data, landscan population statistics, spatial durbin model
Citation: Liu S and Wu P (2023) The impact of urban sprawl on green total factor productivity: A spatial econometric analysis in China. Front. Environ. Sci. 11:1095349. doi: 10.3389/fenvs.2023.1095349
Received: 11 November 2022; Accepted: 16 February 2023;
Published: 24 February 2023.
Edited by:
Guo Wei, University of North Carolina at Pembroke, United StatesReviewed by:
Yuanchun Zhou, Nanjing University of Finance and Economics, ChinaAnlu Zhang, Huazhong Agricultural University, China
Gui Jin, China University of Geosciences Wuhan, China
Copyright © 2023 Liu and Wu. This is an open-access article distributed under the terms of the Creative Commons Attribution License (CC BY). The use, distribution or reproduction in other forums is permitted, provided the original author(s) and the copyright owner(s) are credited and that the original publication in this journal is cited, in accordance with accepted academic practice. No use, distribution or reproduction is permitted which does not comply with these terms.
*Correspondence: Shucheng Liu, MTg2NjgwNjE4NTFAMTYzLmNvbQ==