 Huali Li
 Jianjun Zhou
 Man Zhang
95% of researchers rate our articles as excellent or good
Learn more about the work of our research integrity team to safeguard the quality of each article we publish.
Find out more
ORIGINAL RESEARCH article
Front. Environ. Sci. , 19 January 2023
Sec. Freshwater Science
Volume 11 - 2023 | https://doi.org/10.3389/fenvs.2023.1093413
This article is part of the Research Topic Hydrodynamic Characteristics and Pollutant Transport in Rivers and Nearshore Environments View all 10 articles
Phosphorus (P) is a crucial macronutrient, and recently a venture agent of pollutant, in aquatic systems worldwide. Most of P circulates with sediment through rivers, and the relationship between P and sediment is the basis for understanding the biogeochemical processes in rivers. Although studies of fluvial P have been carried out at specific sites and for particular problems, the general regime by which sediment affects P recirculation still warrants attention. In this study, a series of water samples were collected from six different rivers in China whose sediment concentration and size distribution vary widely and their P properties were analyzed in the laboratory. From this analysis of field samples, a highly consistent comet shaped pattern of sediment effects on P is revealed, i.e., generally the range of the concentration of total P has a diverge-converge trend as the sediment concentration increases. It is further supported by examining the strictly composed samples from P adsorption experiments. Furthermore, case analyses were performed on the basis of the above relationships to illustrate the impact of sediment on P cycling in rivers. The results can infer the following: 1) There is a strong positive correlation between total P and sediment concentration, indicating that sediment is a crucial agent in the movement and fate of P. 2) The negative correlation between dissolved P and sediment concentration indicates a buffering effect of sediment, especially fine sediment, on dissolved P, interpreting the intricate phenomena of increased dissolved P concentration caused by sediment reduction. Hence, natural sediment has the prevailing advantage in moderating the water quality of rivers, which is directly relevant to mitigating the present pollution and eutrophication of waters. 3) River damming causes a P blockage tendency, altering the fluvial nourishment to contamination in the river.
Phosphorus (P), one of the most critical macronutrient elements affecting aquatic environments and their ecology, mainly circulates with sediment via rivers (Smil, 2000). In the global P cycle, the atmospheric deposition amounts to only 3–4 Mt, while the amount transported to the ocean via erosion and runoff is as high as 25–30 Mt (Smil, 2000). Importantly, P has a strong affinity to sediment (Müller et al., 2006), and the P of the world’s large rivers is mostly attached to sediment (i.e., 80%–90%) (Zhou et al., 2018). Therefore, the river sediment transport largely determines the destination and circulation path of P.
In recent decades, sediment has been intensively disturbed by human activities, such as river damming and inter-basin water diversion projects (Vörösmarty et al., 2003; Syvitski et al., 2005; Best, 2019; Grill et al., 2019), which inevitably affects P transport and transformation processes in rivers (Zhou et al., 2013; Maavara et al., 2015; Zhou et al., 2015; Li et al., 2022). For instance, the substantial reduction in total P (TP) trapped by dams is widely observed in rivers, reaching 77% in the Yangtze River (Zhou et al., 2013), 40% in the Madeira River (Almeida et al., 2015), and 60% in the Zambezi River (Kunz et al., 2011), mainly due to the reduced sediment loads. Additionally, the self-purification capacity of natural rivers is gradually changing, as manifested by the continuously increasing dissolved P (DP) level detected in large rivers (Chai et al., 2009; Pan et al., 2013; Zhou et al., 2018; Chen et al., 2020; Zeng et al., 2022; Zhang et al., 2022). Although the dramatic shifts in sediment and the ecological and environmental risks of basin-wide fluvial P changes are acknowledged, our understanding of how sediment impacts P cycling in rivers is still incomplete.
The relationship between P and sediment is the cornerstone for understanding the process of P cycling in rivers, and basic knowledge of this relationship has been reported, such as that between P and sediment load (Qs) (Zhou et al., 2013; Huang et al., 2015), sediment concentration (S) (Uusitalo et al., 2000; Yu et al., 2010; Zhou et al., 2013; Almeida et al., 2015; Zeng et al., 2022; Zhang et al., 2022), and sediment grain size (Yao et al., 2015; Zhou et al., 2015). However, most of these studies were limited to a specific situation, such as an individual river. To our best knowledge, no study has yet integrated the general regime of fluvial P constituted by sediment with the wide disparity in the concentration and size distribution of sediment at the scale of different rivers. Moreover, previous studies mostly focus on the effect of S on P, while the effects of sediment grain size on P were rarely considered. Actually, the adsorption behaviors of natural sediment would be significantly affected by sediment grain size (Meng et al., 2014), and the grain size is crucially important for the transport of P in the flow (Zhou et al., 2015). Therefore, sediment grain size should also be considered when investigating the effects of sediment on P. Furthermore, most of the experimental studies on P adsorption/desorption focused on the maximum adsorption capacity of P by sediment (Zhou et al., 2005; Omari et al., 2019; Li et al., 2021), paying little attention to the buffering effects of river sediment against P pollution. Moreover, most experiments only explored a narrow range of values of sediment and P concentrations, while these values are generally one or two orders of magnitude higher than those in the natural rivers (Zhou et al., 2005; Wang et al., 2009; Omari et al., 2019). Hence, the findings of those studies cannot directly reflect the natural conditions, limiting their practical applicability. Accordingly, although notable field surveys and laboratory studies have been carried out recently for specific sites and problems, the general regime underpinning the effects of sediment on P cycling deserves further investigation.
In this study, a series of water samples from six rivers in China differing widely in their sediment concentration and size distribution were collected and their P properties were analyzed in the laboratory to derive the relationship between P and sediment. The regimes of fluvial P constituted by sediment spanning a low to high S and from a large to small grain size were explored. Then, laboratory experiments were also conducted for further verification of these relationships. Finally, case analyses were conducted to discuss changes in P cycling as caused by sediment reduction and its impact on the ecology and environment of rivers. This study differs from previous works (Zhou et al., 2013; Zhou et al., 2015) in that 1) here the range of sediment concentration was much wider as samples from six rivers were used instead of from only the Three Gorges Reservoir region, 2) phosphorus adsorption experiments were conducted in this study to further explain the effects of sediment grain size on P.
The sampling locations are shown in Figure 1 and the sampling periods are listed in Table 1. About 2–5 L of water samples were collected at each site. Every sample was divided into two subsamples, one for sediment (A) and the other for P (B) analysis in laboratory. Sub-sample A was further divided into two parts, one for sediment concentration (measured according to China national standard GB11901-89) and the other for the grain size distributions (measured using the HORIBA LA-920 Laser Particle Size Analyzer). Sub-sample B was also subdivided into one unfiltered part and the other filtered through a 0.45-μm filter, all of the subsamples were digested with potassium persulfate to analyze P using the ammonium metamolybdate spectro-photometric method (Environment Protection Administration of China (EPA China), 1989).
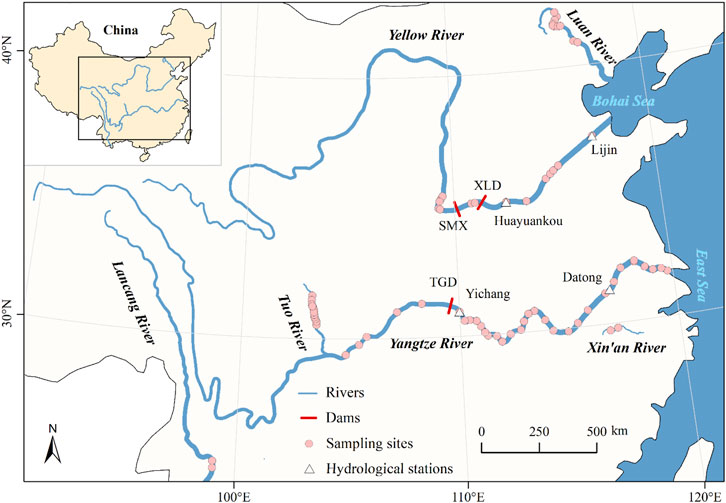
FIGURE 1. The sampling sites along six different rivers in China and the relevant locations used in this study. TGD, SMX, and XLD respectively denote the dams for the Three Gorges, Sanmenxia, and Xiaolangdi reservoirs.
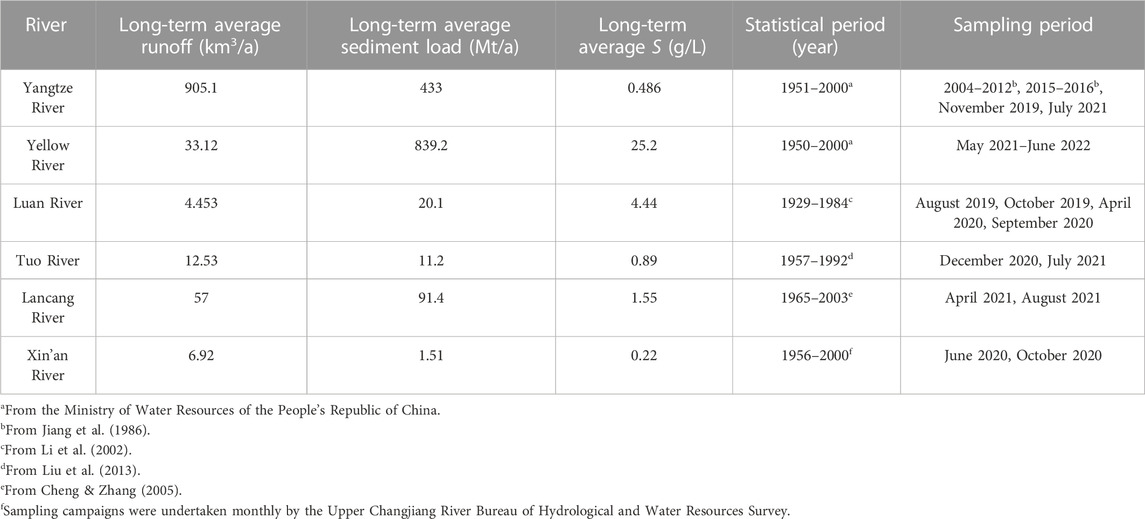
TABLE 1. Basic characteristics of the six different rivers in China selected for this study and their sampling periods.
We define TP concentration (Ctp, mg/L) and DP concentration (Cdp, mg/L) as the measured value in the unfiltered samples and the value after filtration through a 0.45-μm filter, respectively; and particulate P (PP) concentration (Cpp, mg/L) as the difference between Ctp and Cdp (i.e., Cpp = Ctp - Cdp) (Zhou et al., 2013). For the sediment properties, S (g/L) denotes the sediment concentration; D50 (μm) is the median particle size of sediment; Ca (m2/L) is the surface area concentration of sediment (
In addition to field surveys, we also collected long-term data for flow and sediment at key hydrological stations, the Yichang and Datong stations in the Yangtze River as well as the Huayuankou and Lijin stations in the Yellow River (Figure 1). This included daily average data of the flow discharge and sediment concentration (1950–2020) and monthly average data for the sediment grain size distribution (1960–2019), which was provided by the Ministry of Water Resources of China (MWR).
In the laboratory, P adsorption experiments were tested to verify the results from the rivers. Three sediment samples collected from the Yellow River were used: fine sediment (D50 = 4.61 μm), median sediment (D50 = 20.89 μm), and coarse sediment (D50 = 51.56 μm) (grain size distribution of these three sediment samples see Supplementary Figure S1). These sediment samples were naturally air-dried and their native P content (dpp0) was 0.59, 0.49 and 0.27 mg/g, respectively. A batch of strictly composed samples was prepared by adding a different amount of sediment (0.3, 0.6, 1.5, 3, 6, 15, 30, 60, 150 or 300 mg) to 30 mL of a P solution with initial P concentrations (denoted as Cdp0) of 0.001, 0.01, 0.1, 0.5, 1, and 10 mg/L. These samples were then processed in an incubator shaker and shaken continuously for 24 h to achieve an equilibrium adsorption (Li et al., 2021). Next, the Cdp under equilibrium conditions was measured after passing each sample through a 0.45-μm filter (see section 2.1) and the Ctp was calculated according to the conservation of matter (Ctp = Cdp0 + Sdpp0).
As seen in Table 1, the selected six rivers in China differs substantially in terms of their sediment properties, especially S. The long-term average S of the Yellow River (25.2 g/L) is about two orders of magnitude higher than that of the Xin’an River (0.22 g/L), and the long-term average S of the Luan River (4.44 g/L) is about one order of magnitude higher than that of the Yangtze River (0.486 g/L). As expected, the samples collected from these six rivers in this study has a wide disparity in their S (0.001–41.8 g/L) and D50 (1.49–195.62 μm) (Figure 2A). Similar to sediment, a wide disparity in the P properties is evident, especially for Ctp (0.02–21.66 mg/L) (Figure 2B). It is worth noting that the peaks of S (41.8 g/L) and Ctp (21.66 mg/L) both appear in the Yellow River, being comparable to that of previous study (47.94 g/L and 30.98 mg/L) (Yu et al., 2010). Like most rivers in the world (Zhou et al., 2018), TP is dominated by PP (the average proportion of Cdp to Ctp of all samples is 68%).
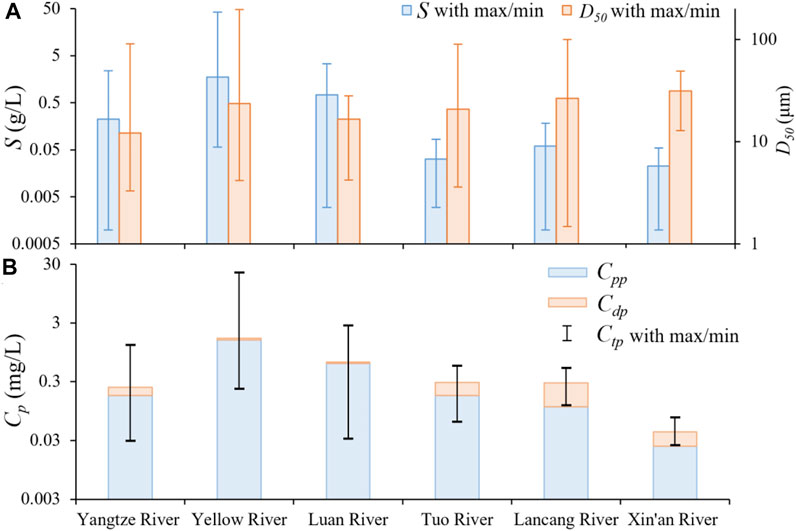
FIGURE 2. Sediment and phosphorus conditions of six different rivers in China during the sampling period. The height of the column denotes average values of sediment concentration (S) (A), median grain size (D50) (A), Total P concentration (Ctp) (B), dissolved P concentration (Cdp) (B) and particulate P concentration (Cpp) (B). The error bars denote the maximum and minimum values of S (A), D50 (A) and Ctp (B).
Figure 3 shows the relationships between P and sediment in the six rivers that have a wide disparity in their sediment concentration and size distribution. There is a highly consistent positive relationship between Ctp and S in these six rivers (Figure 3A), indicating that sediment is a crucial agent in the movement and fate of P. This positive pattern is consistent with other rivers like the Pearl River (Duan and Zhang, 1999), the Mississippi River (Welch et al., 2014) and Aurajoki River (Uusitalo et al., 2000), and even lakes such as Poyang Lake (Pu et al., 2020). Notably, the relationship between Ctp and S shows a clear comet shaped pattern from divergence to convergence with increasing S. For instance, the regression relationship between Ctp and S in the area with low S (like S ≤ 0.1 g/L, R2 = 0.04) is much worse than that in the area with high S (S > 0.1 g/L, R2 = 0.92) (Supplementary Figure S3). It indicates that P is mainly attached to the sediment and Ctp is controlled by sediment in high sediment laden rivers like the Yellow River and Luan River.
FIGURE 3. Relationships between fluvial P and natural sediment based on the field data collected from six different rivers in China. (A) Total P concentration (Ctp), (C) proportion of dissolved P (Cdp/Ctp), and (E) mass density of particulate P (dpp) versus sediment concentration (S); and (B) Ctp, (D) Cdp/Ctp, and (F) areal density of particulate P (da) versus the surface area concentration of sediment (Ca). The grey dotted lines represent the fitted regression of P versus sediment.
By contrast, the proportion of DP (Cdp/Ctp) is negatively related to S (Figure 3C), indicating a buffering effect of sediment on DP. The comet shaped pattern is more evident from the relationship between Cdp/Ctp and S. Specifically, in those areas with high S, sediment has a strong buffering effect, thus Cdp/Ctp is close to zero (i.e., the DP level is mainly controlled by S). However, with the decreases of S, the buffering effect of sediment gradually diminishes, and Cdp/Ctp varies widely (i.e., 3.7%–93.3%), being affected mainly by other factors like the riparian P input. Values of Cdp/Ctp in areas with low S in this study (e.g., Yangtze River and Lancang River) are similar to those reported for some low-sediment water bodies, like lakes (Cdp/Ctp = 10%–97%) (Pu et al., 2020) and estuaries (Cdp/Ctp = 50%–90%) (Fang and Wang, 2020).
Sediment PP density dpp is also inversely proportional to S (Figure 3E), which indicates that sediment has a strong adsorption potential in areas with high S or small grain size (Zhou et al., 2018), when considering the competitive mechanism between sediment particles (Müller et al., 2006). For example, the markedly lower dpp due to high S of the Yellow River than the other rivers implies that the sediment still has a strong adsorption potential, a view supported by experimental findings that most of the Yellow River’s suspended sediment acts as a sink for additional phosphate input (Pan et al., 2013).
The highly consistent relationships between P and S from six rivers with varying S convincingly demonstrate the dependence of fluvial P on sediment (Figures 3A, C, E). The specific surface area of sediment affecting P adsorption varies with its particle size (Goldberg and Sposito, 1985; Boström et al., 1988). Therefore, we propose that Ca might better reflect the effect of sediment on P after a comprehensive consideration of S and grain size. The correlation results are shown in Figures 3B, D, F, where the effect of Ca on fluvial P displays a similar pattern to that from S, but PP has a slightly better relationship with Ca (Figure 3F) than its relationship with S (Figure 3E). However, there is no significant improvement in the relationship between TP (or DP) and sediment. One possible reason is that flocculation may affect the effective surface area of fine sediment in natural waters, which may raise inaccuracy when calculating Ca in this study. This effect is discussed in detail in the next section with experimental results.
For a better understanding of the P partition regime (denoted mainly as the ratio Cdp/Ctp) constituted by sediment of natural water samples, strictly composed samples is analyzed in this section. Figure 4 shows the relationship between Cdp/Ctp and sediment of the strictly composed samples from the P adsorption experiments. We can see that Cdp/Ctp is overall inversely proportional to S and Ca, and it also exhibits a consistent comet shaped pattern (Figures 4A, B), corroborating the field-based results for the rivers (Figure 3C). This comet-like pattern is also supported by the equilibrium adsorption model. These general results confirm that the comet shaped buffer phenomenon in field measurements (Figures 3C, D) is a reasonable and natural law. As shown in Figures 4A, B, the relationship between Cdp/Ctp and Ca is more diffuse than the relationship between Cdp/Ctp and S. As mentioned in Section 3.1, flocculation of sediment, especially fine sediment, may raise inaccuracy when calculating Ca. Here, the effective surface area (
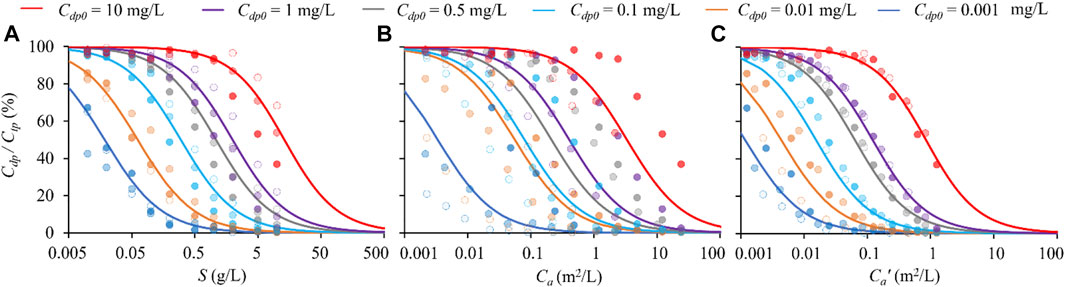
FIGURE 4. Relationship between the proportion of dissolved P at adsorption equilibrium (Cdp/Ctp) and total sediment concentration (S) (A), total area concentration of sediment (Ca) (B) and the total effective surface area concentration of sediment (
Our results present a highly consistent comet shaped pattern of sediment effects on P based on the analysis of field samples from six rivers in China, and it is further supported by examinations of the strictly composed samples. The comet shaped pattern indicates that P is mainly attached to the sediment and Ctp and Cdp/Ctp are controlled by sediment in the area with high S. But as S decreases, Ctp and Cdp/Ctp perhaps are affected relatively more by other factors, such as the P input level and the sediment grain size. Considering that low sediment content and high pollution load are the current and future status of most rivers, the divergence phenomenon in areas with low S deserves more attention. In this section, we further discuss the mechanism behind these obtained relationships and possible ecological and environmental effects. After that, we apply the obtained relationships between P and sediment to estimate long-term variability of P in rivers caused by sediment reduction, by using the Yangtze River and Yellow River as examples.
Our results uncover negative relationship between Cdp/Ctp and S, indicating a strong buffering effect of sediment on DP. However, the divergence phenomenon in the comet tail region implies that this buffering effect is not only controlled by S. Taking the Yangtze River as an example (Figure 5), the statistical results of the measured data show that Cdp/Ctp gradually increase as the group-average D50 increase, indicating that Ca decrease. Thus, assuming a relatively constant P input level during the sampling period, Cdp/Ctp shifts from being S-controlled to sediment grain size-controlled with declining S. In particular, in areas with low S, the advantage of fine sediment over coarse sediment is most prominent in terms of the buffering effect on DP.
FIGURE 5. The proportion of dissolved P (Cdp/Ctp) versus sediment concentration (S) based on the measured data collected from the Three Gorges Reservoir area of the Yangtze River (2004–2012 and 2015–2016). Different symbols represent artificial groups with Cdp/Ctp of 80%–100%, 60%–80%, 40%–60% and 0%–40%, respectively.
The outstanding buffering effect of fine sediment is due to its stronger ability to adsorb P compared to coarse sediment. As evinced by Figure 6, sediment can restrain the increase in DP caused by increasing Cdp0 through adsorption. The extent that the slope deviates from one can be used to quantify the restraining effect of sediment on Cdp levels in solution. Sediment grain size is a key factor responsible for the restraining effect. Specifically, despite the same S, the amount of phosphate remaining in solution can vary greatly among these three sediment types. Especially, for fine sediment, at the highest S (10 g/L), most of the added P is removed by adsorption (k3 = 0.15), whereas the effect of coarse sediment under the same S is not discernible (k3 = 0.81). This is because Ca of the latter (0.75 m2/L) is less than 10% that of the former (12.4 m2/L).
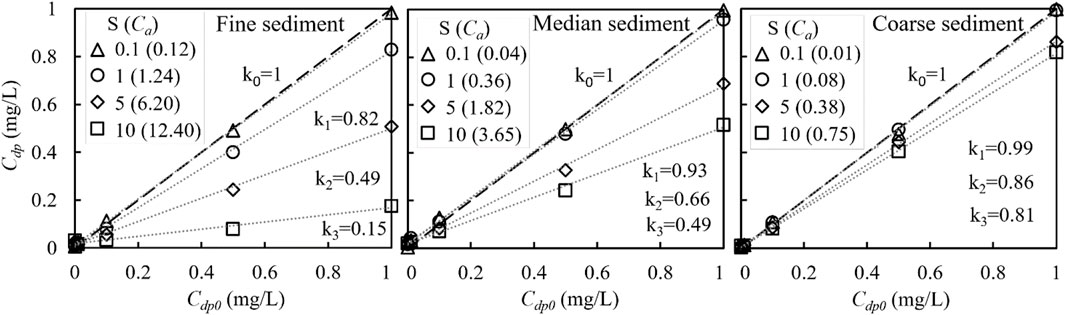
FIGURE 6. Effect of P pollution condition (indicated by the initial dissolved P concentration, Cdp0) on dissolved P concentration (Cdp) at adsorption equilibrium. The k0∼k3 denotes the slope between Cdp0 and Cdp when S = 0 (clear water, meaning no adsorption occurs), 1, 5, and 10 g/L, respectively. The units of sediment concentration (S) and surface area concentration of sediment (Ca) are g/L and m2/L, respectively. Panels correspond to fine (D50 = 4.61 µm), median (D50 = 20.89 µm), and coarse (D50 = 51.56 µm) sediment.
It is important to note that, for all of the three sediment size types, the relationship between Cdp and Cdp0 becomes linear with a slope of 1 as S is reduced below 0.1 g/L (Figure 6). This can further interpret the above-mentioned divergence phenomenon in the relationship between Ctp and S (S < 0.1 g/L, R2 = 0.04). These relationships all indicate that an S value of 0.1 g/L may be a critical threshold for the buffering effect of natural sediment, below which most phosphate cannot be removed by sediment. Actually, for some natural sediment collected from river bed, this threshold value of S is even higher (0.2–1.0 g/L) (Pan et al., 2013). However, in recent years, the natural S in many rivers may fail to reach this threshold. For instance, the average S of the Tuo River (0.03 g/L), Lancang River (0.06 g/L) and Xin’an River (0.02 g/L) during the sampling period in this study are all far below this threshold. This indicates that the buffering effect of sediment on DP in these rivers is gradually disappearing.
DP (especially dissolved inorganic phosphate, DIP) is easily used by primary producers (Maruo et al., 2015) and is often a pollutant for a local or stationary system. In recent years, the significant DP-elevating phenomena has been widely reported in the context of sediment reduction (Chai et al., 2009; Dai et al., 2011; Pan et al., 2013; Chen et al., 2020). Our results suggest that adsorption of dissolved phosphate onto sediment, particularly fine sediment, is a key process to keep Cdp at a relatively low level and to improve the river water quality.
To illustrate the impact of sediment reduction on P cycling in a river, the Yangtze River and the Yellow River are taken as examples for further discussion. The relationship between P and S and that between the P and Ca in the Yellow River are proposed in this study (Supplementary Figure S3). The relationship between P and S (Zhou et al., 2013) and that between the P and Ca (Zhou et al., 2015) in the Yangtze River reported in previous studies are used directly. First, according to the relationship between P and S and the sediment data, long-term variation in the cumulative TP flux (Ltp) in the Yangtze River (Figure 7C) and Yellow River (Figure 7D) is estimated. Then, combined with sediment grading data, long-term variation in the Ctp and Cdp in the Yangtze River (Figure 7E) and Yellow River (Figure 7F) are roughly modeled using the obtained relationships between P and Ca.
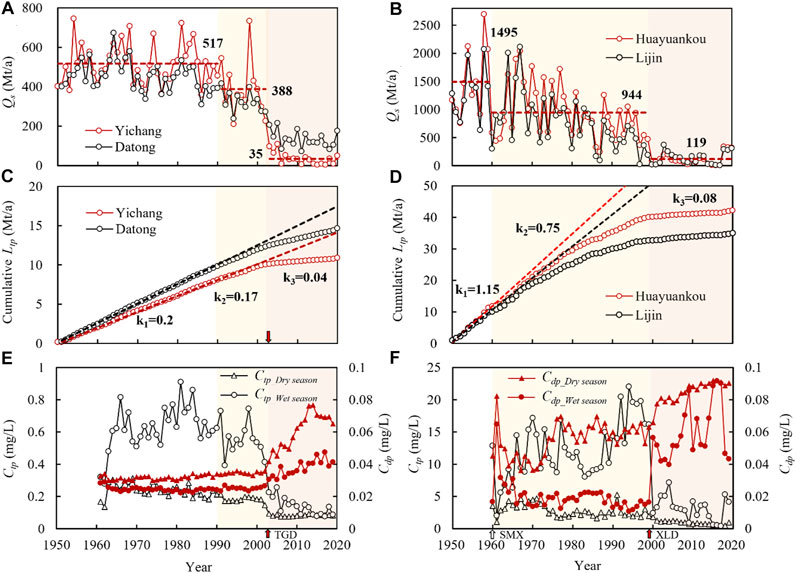
FIGURE 7. Long-term variation in the annual sediment load (Qs) and accumulative total P flux (Ltp) at Yichang and Datong in the Yangtze River (A and C), and at Huayuankou and Lijin in the Yellow River (B and D) (1950–2020). Long-term variation of the simulated total P concentration (Ctp) and dissolved P concentration (Cdp) at Yichang in the Yangtze River (E) and at Huayuankou in the Yellow River (F) during the dry season (October–May in the Yangtze River and November–June in the Yellow River) and the wet season (June–September in the Yangtze River and July–October in the Yellow River) (1960–2019). The dashed lines indicate the average value of the corresponding process at Yichang (A) and Huayuankou (B), and the slope of the cumulative Ltp at Yichang and Datong (1951–1990) (C), and at Huayuankou and Lijin (1950–1959) (D). k1∼k3 denotes the average growth rate of Ltp in 1951–1990, 1991–2002, and 2003–2020 at Yichang (C), and 1950–1959, 1960–1999, and 2000–2020 at Huayuankou (D). Arrows indicate when the Three Gorges Reservoir (TGR) in the Yangtze and Sanmenxia (SMX) and Xiaoliangdi (XLD) reservoirs in the Yellow River became operational.
Estimates show that the growth rate of cumulative Ltp (Figure 7C) and Ctp (Figure 7E) related to sediment in the Yangtze River has declined slightly since 1990 in the context of sediment reduction (Figure 7A). In particular, an obvious inflection point appears in 2003 just after the Three Gorges Reservoir (TGR) became operational. The average growth rate of cumulative Ltp through Yichang falls to 0.04 MT/a in 2003–2020, only accounting for 20% of that in 1951–1990 (0.2 MT/a) and the Ctp during wet season at Yichang falls to 0.14 mg/L in 2003–2019, only accounting for 22% of that in 1951–1990 (0.63 mg/L). Like the Yangtze River, the estimated growth rate of cumulative Ltp (Figure 7D) and Ctp (Figure 7F) related to sediment in the Yellow River has declined slightly since 1960 (Figure 7B), relating to the implementation of dams and other hydraulic projects along the river. In particular, the average growth rate of cumulative Ltp through Huayuankou falls to 0.08 MT/a in 2000–2020, being less than 7% of that in 1950–1959 (1.15 MT/a) (Figure 7D). The estimated decreasing trend of Ltp and Ctp in the Yangtze River and Yellow River in this study is consistent with other rivers in the world, such as the Madeira River (decline by 40%) (Almeida et al., 2015) and the Zambezi River (60% trapped) (Kunz et al., 2011). The above estimates for long-term TP are rough but have a physical basis, i.e., sediment has a strong affinity to P due to its great specific surface areas and active surface sites (Davis and Kent 1990; Huang et al., 2016). In this study, this physical basis is further illustrated by both the strong positive correlation between TP and S in the field measurements and the strong P adsorption for natural sediment in the laboratory experiments. Long-term measurements show that since the TGR begins operating in 2003, 93% of the sediment normally delivered to the middle and lower Yangtze River through Yichang has been trapped; it decreased to only 35 Mt/a (2003–2020) compared with 517 Mt/a over the long term (1951–1990) (Figure 7A). Similarly, a stepwise decline in sediment is observed as the implementation of dams and other hydraulic projects along the Yellow River and the average Qs through Huayuankou in 2000–2020 (119 MT/a) constituted just 8% of that in 1950–1959 (1495 MT/a) prior to the implementation of Sanmenxia Dam (1960) and Xiaoliangdi Dam (1999) (Figure 7B). In fact, the percentage of sediment interception in these rivers far exceeds that of other major rivers globally (Vörösmarty et al., 2003). Therefore, the dramatic decrease in TP estimated in this study is reasonable, which is also consistent with the global trend (Maavara et al., 2015).
Like most rivers in the world, P in the Yangtze River and Yellow River occurs mainly in particulate form (Zhou et al., 2018). In fact, PP is likely strongly adsorbed to iron and aluminum oxide surfaces and is not readily bioavailable (Berner and Rao, 1994). However, PP can be released from sediment and may become mobilized and bioavailable after undergoing transformation under certain chemical conditions (e.g., low pH and low oxygen concentration) (Silva and Sampaio, 1998). Numerous studies have shown that PP is the key source of potentially bioavailable P (BAP) and the ratio BAP/PP is 19%–31% in the Yellow River (Yao et al., 2015) and 45.6% in the Yangtze River (Wei et al., 2010). Thus, from a long-term ecological perspective, maintaining the long-term stability of both the sediment and TP load is critical for the primary productivity of estuary and coast, where P is often the limiting nutrient for bioactivity (Wang et al., 2021). To our knowledge, the ratio of nitrogen (N) to P (N/P) has far surpassed the normal value (15–16) in either the Yangtze River (192.5–317.5) (Shen & Liu, 2009) or Yellow river (700−1480), being much higher than that of other major rivers worldwide (Pan et al., 2013; Wang et al., 2021). This very high N/P ratio means that both the two rivers are extreme P-limited ecosystems and their productivity is severely limited by P (Elser et al., 2007; Shen and Liu, 2009). On the one hand, such significant reductions in Ltp and Ctp will not only further reduce the bioavailability of P but also augment the existing high N/P, altering the nutrient structure of downstream rivers. On the other hand, dam trapping causes P accumulation in the reservoirs that changes fluvial nourishment to contamination within the river.
Conversely, evident increases in Cdp against a background of decreasing Ctp are found in both the Yangtze River (Figure 7E) and the Yellow River (Figure 7F). Especially in the dry season, Cdp increases to 0.08 mg/L at Yichang and 0.09 mg/L at Huayuankou, respectively, in recent years. The inferred trend of rising Cdp is supported further by additional observations from the Yangtze River and the Yellow River; for example, (i) recently, Zhang et al. (2022) reported that the Cdp rose from 0.05 mg/L (2003–2012) to 0.1 mg/L (2013–2017) under the background of decreasing TP at Yichang in the Yangtze River; (ii) earlier, Pan et al. (2013) found the DIP (important components of the DP) increasing from 0.29 μmol/L (1980–1992) to 0.43 μmol/L (2007) due to S decreasing in the Yellow River. The abnormally increased DP level indicates that the decreasing sediment may have nearly lost its ability to buffer P pollutant (Figure 6). In fact, our estimates of how much P cycling could be affected by sediment reduction are likely to be conservative and poorly constrained because TP and DP are not only affected by sediment but also directly affected by pollutant emissions (Zeng et al., 2022). In recent decades, anthropogenic P emissions from both point and non-point sources, particularly fertilizers applied to support agriculture, have greatly enhanced the P load to watersheds (Jarvie et al., 2006). For instance, long-term (1980–2015) net anthropogenic phosphorus input to the Yangtze River Basin has progressively increased (by ∼1.4-fold) (Hu et al., 2020). Such high phosphate input would further promote a rising DP according to our laboratory experiments results (Figure 6). Therefore, maintaining a certain degree of turbidity in rivers plays an important role in the health of water bodies. Major strategies of the Yangtze River and Yellow River require that ecological protection of rivers be put in the first place, and it is recommended for the reservoirs to properly increase the amount of fine sediment released downstream to sustain the health of the downstream ecology.
In this study, the regime of fluvial P constituted by sediment was systematically investigated by collecting a series of samples from six rivers of China having a disparate sediment concentration and size distribution, combined with laboratory experiments. The main conclusions are as follows:
1) A highly consistent comet shaped pattern of sediment effects on P is found based on the analysis of field samples. It is further supported by examining the strictly composed samples from P adsorption experiments. Specifically, in areas with high S, there is strong dependence of fluvial P on sediment, and Ctp and Cdp/Ctp are mainly controlled by S. However, as S declines, the regime of fluvial P changes from S-controlled to the one affected more by other factors such as the P input level and sediment grain size.
2) A strong positive correlation between Ctp and S is obtained, thus indicating that sediment is a crucial agent in the movement and fate of P. Moreover, Cdp is negatively related to S, indicating a buffering effect of sediment on dissolved P and interpreting the intricate phenomena of increased Cdp caused by sediment reduction.
3) On the basis of the above relationships obtained, we roughly estimate changes in P cycling in rivers caused by sediment reduction and present a P blockage tendency in both the Yangtze River and Yellow River. Dam trapping causes P accumulation in the reservoirs would not only alter the nutrient structure of downstream river and estuary but also increases contamination within the river. Furthermore, the estimated long-term Cdp shows a trend of increase, which suggests the ability of sediment to buffer DP may have been eliminated by dams.
Anthropogenic activities are altering the path and nature of sediment in rivers in various ways, arguably adversely affecting the transport and transformation of fluvial P. The regime of fluvial P constituted by sediment obtained in this study servers as a knowledge base for further investigation of this fundamental biogeochemical cycle.
The original contributions presented in the study are included in the article/Supplementary Material, further inquiries can be directed to the corresponding author.
HL: Field sampling, experimental tests, analysis and draft manuscript preparation. JZ: Conceptual idea, project administration, funding acquisition, reviewing and editing, supervision. MZ: Field sampling, project administration, data curation, reviewing and editing. All authors contributed to the article and approved the submitted version.
This work has been financially supported by the National key research and development program of China, (2022YFC3202701) (co-authors: JZ and MZ).
The constructive suggestions of the editors and reviewers are gratefully acknowledged.
The authors declare that the research was conducted in the absence of any commercial or financial relationships that could be construed as a potential conflict of interest.
All claims expressed in this article are solely those of the authors and do not necessarily represent those of their affiliated organizations, or those of the publisher, the editors and the reviewers. Any product that may be evaluated in this article, or claim that may be made by its manufacturer, is not guaranteed or endorsed by the publisher.
The Supplementary Material for this article can be found online at: https://www.frontiersin.org/articles/10.3389/fenvs.2023.1093413/full#supplementary-material
Almeida, R. M., Tranvik, L., Huszar, L. M. V., Sobek, S., Mendonça, R., Barros, N., et al. (2015). Phosphorus transport by the largest Amazon tributary (Madeira River, Brazil) and its sensitivity to precipitation and damming. Inland Waters Print. 5 (3), 275–282. doi:10.5268/IW-5.3.815
Berner, R. A., and Rao, J.-L. (1994). Phosphorus in sediments of the Amazon River and estuary: Implications for the global flux of phosphorus to the sea. Geochimica Cosmochimica Acta 58 (10), 2333–2339. doi:10.1016/0016-7037(94)90014-0
Best, J. (2019). Anthropogenic stresses on the world’s big rivers. Nat. Geosci. 12, 7–21. doi:10.1038/s41561-018-0262-x
Boström, B., Andersen, J. M., Fleischer, S., and Jansson, M. (1988). Exchange of phosphorus across the sediment-water interface. Hydrobiologia 170 (1), 229–244. doi:10.1007/BF00024907
Chai, C., Yu, Z., Shen, Z., Song, X., Cao, X., and Yao, Y. (2009). Nutrient characteristics in the Yangtze River estuary and the adjacent east China sea before and after impoundment of the three Gorges dam. Sci. Total Environ. 407 (16), 4687–4695. doi:10.1016/j.scitotenv.2009.05.011
Chen, Q., Shi, W., Huisman, J., Maberly, S. C., Zhang, J., Yu, J., et al. (2020). Hydropower reservoirs on the upper Mekong River modify nutrient bioavailability downstream. Natl. Sci. Rev. 7 (9), 1449–1457. doi:10.1093/nsr/nwaa026
Cheng, X., and Zhang, C. (2005). Analysis of hydrological characteristics of Xin’an River Basin in anhui province. Water Conservancy Sci. Technol. Anhui Prov. 2 , 11–13. [in Chinese].
Dai, Z., Du, J., Zhang, X., Su, N., and Li, J. (2011). Variation of riverine material loads and environmental consequences on the Changjiang (Yangtze) estuary in recent decades (1955−2008). Environ. Sci. Technol. 45 (1), 223–227. doi:10.1021/es103026a
Davis, J. A., and Kent, D. B. (1990). Surface complexation modeling in aqueous geochemistry. Rev. Mineral. Geochem 23, 177–260.
Duan, S. W., and Zhang, S. (1999). The variations of nitrogen and phosphorus concentrations in the monitoring stations of the three major rivers in China [in Chinese]. Sci. Geogr. Sin. 19 (5), 411–416. doi:10.13249/j.cnki.sgs.1999.05.411
Elser, J. J., Bracken, M. E., Cleland, E. E., Gruner, D. S., Harpole, W. S., Hillebrand, H., et al. (2007). Global analysis of nitrogen and phosphorus limitation of primary producers in freshwater, marine and terrestrial ecosystems. Ecol. Lett. 10 (12), 1135–1142. doi:10.1111/j.1461-0248.2007.01113.x
Fang, T.-H., and Wang, C. W. (2020). Dissolved and particulate phosphorus species partitioning and distribution in the danshuei river estuary, northern taiwan. Mar. Pollut. Bull. 151, 110839. doi:10.1016/j.marpolbul.2019.110839
Goldberg, S., and Sposito, G. (1985). On the mechanism of specific phosphate adsorption by hydroxylated mineral surfaces: A review. Commun. Soil Sci. Plant Analysis 16 (8), 801–821. doi:10.1080/00103628509367646
Grill, G., Lehner, B., Thieme, M., Geenen, B., Tickner, D., Antonelli, F., et al. (2019). Mapping the world’s free-flowing rivers. Nature 569, 215–221. doi:10.1038/s41586-019-1111-9
Hu, M., Liu, Y., Zhang, Y., Shen, H., Yao, M., Dahlgren, R. A., et al. (2020). Long-term (1980–2015) changes in net anthropogenic phosphorus inputs and riverine phosphorus export in the Yangtze River basin. Water Res. 177, 115779. doi:10.1016/j.watres.2020.115779
Huang, L., Fang, H., Fazeli, M., Chen, Y., He, G., and Chen, D. (2015). Mobility of phosphorus induced by sediment resuspension in the Three Gorges Reservoir by flume experiment. Chemosphere 134, 374–379. doi:10.1016/j.chemosphere.2015.05.009
Huang, L., Fang, H., He, G., and Chen, M. (2016). Phosphorus adsorption on natural sediments with different pH incorporating surface morphology characterization. Environ. Sci. Pollut. Res. Int. 23 (18), 18883–18891. doi:10.1007/s11356-016-7093-3
Jarvie, H. P., Neal, C., and Withers, P. J. A. (2006). Sewage-effluent phosphorus: A greater risk to river eutrophication than agricultural phosphorus? Sci. Total Environ. 360 (1), 246–253. doi:10.1016/j.scitotenv.2005.08.038
Jiang, T., Fang, X., Xu, H., and Guo, W. (1986). Runoff and sediment transport analysis at the estuary of the Luan River. Adv. Mar. Sci. 4, 100–113.
Kunz, M. J., Wüest, A., Wehrli, B., Landert, J., and Senn, D. B. (2011). Impact of a large tropical reservoir on riverine transport of sediment, carbon, and nutrients to downstream wetlands. Water Resour. Res. 47 (12), W12531. doi:10.1029/2011WR010996
Li, C., Wang, Z., Liu, H., Zuo, L., Lu, Y., Wu, P., et al. (2022). Impact of a water-sediment regulation scheme on nutrient variations at the Lijin station of the Yellow River. Front. Environ. Sci. 10, 900508. doi:10.3389/fenvs.2022.900508
Li, C., Liu, X., Cao, S., He, W., and Zhang, Z. (2002). Development of water powerre source in Sichuan and soil-water conservation in upper reaches of Yangtze River. Resour. Enuironment Yangtza Basin 11 (2), 117–122.
Li, X., Huang, L., Fang, H., Chen, M., Cui, Z., Sun, Z., et al. (2021). Phosphorus adsorption by sediment considering mineral composition and environmental factors. Environ. Sci. Pollut. Res. 28, 17495–17505. doi:10.1007/s11356-020-12206-9
Liu, C., He, Y., Des Walling, E., and Wang, J. (2013). Changes in the sediment load of the Lancang-Mekong River over the period 1965–2003. Sci. China Technol. Sci. 56 (4), 843–852. doi:10.1007/s11431-013-5162-0
Maavara, T., Parsons, C. T., Ridenour, C., Stojanovic, S., Dürr, H. H., Powley, H. R., et al. (2015). Global phosphorus retention by River Damming. Proc. Natl. Acad. Sci. U. S. A. 112, 15603–15608. doi:10.1073/pnas.1511797112
Maruo, M., Ishimaru, M., Azumi, Y., Kawasumi, Y., Nagafuchi, O., and Obata, H. (2015). Comparison of soluble reactive phosphorus and orthophosphate concentrations in river waters. Limnology 17 (1), 7–12. doi:10.1007/s10201-015-0463-6
Meng, J., Yao, Q., and Yu, Z. (2014). Particulate phosphorus speciation and phosphate adsorption characteristics associated with sediment grain size. Ecol. Eng. 70, 140–145. doi:10.1016/j.ecoleng.2014.05.007
Müller, B., Stierli, R., and Wüest, A. (2006). Phosphate adsorption by mineral weathering particles in oligotrophic waters of high particle content. Water Resour. Res. 42 (10), W10414. doi:10.1029/2005wr004778
Omari, H., Dehbi, A., Lammini, A., and Abdallaoui, A. (2019). Study of the phosphorus adsorption on the sediments. J. Chem. 2019, 1–10. doi:10.1155/2019/2760204
Pan, G., Krom, M. D., Zhang, M., Zhang, X., Wang, L., Dai, L., et al. (2013). Impact of suspended inorganic particles on phosphorus cycling in the Yellow River (China). Environ. Sci. Technol. 47 (17), 9685–9692. doi:10.1021/es4005619
Pu, J., Wang, S., Ni, Z., Wu, Y., Liu, X., Wu, T., et al. (2020). Implications of phosphorus partitioning at the suspended particle-water interface for lake eutrophication in China’s largest freshwater lake, Poyang Lake. Chemosphere 263, 128334. doi:10.1016/j.chemosphere.2020.128334
Shen, Z.-L., and Liu, Q. (2009). Nutrients in the Changjiang River. Environ. Monit. Assess. 153 (1–4), 27–44. doi:10.1007/s10661-008-0334-2
Silva, C., and Sampaio, L. S. (1998). Speciation of phosphorus in a tidal floodplain forest in the Amazon estuary. Mangroves Salt Marshes 2 (1), 51–57. doi:10.1023/A:1009950208582
Smil, V. (2000). Phosphorus in the environment: Natural flows and human interferences. Annu. Rev. Energy Environ. 25 (1), 53–88. doi:10.1146/annurev.energy.25.1.53
Syvitski, J. P., Vörösmarty, C. J., Kettner, A. J., and Green, P. (2005). Impact of humans on the flux of terrestrial sediment to the global coastal ocean. Science 308 (5720), 376–380. doi:10.1126/science.1109454
Uusitalo, R., Yli-Halla, M., and Turtola, E. (2000). Suspended soil as a source of potentially bioavailable phosphorus in surface runoff waters from clay soils. Water Res. Oxf. 34 (9), 2477–2482. doi:10.1016/S0043-1354(99)00419-4
Vörösmarty, C. J., Meybeck, M., Fekete, B., Sharma, K., Green, P., and Syvitski, J. P. M. (2003). Anthropogenic sediment retention: Major global impact from registered river impoundments. Glob. Planet. Change 39 (1–2), 169–190. doi:10.1016/s0921-8181(03)00023-7
Wang, J., Bouwman, A. F., Liu, X., Beusen, A., and Yu, Z. (2021). Harmful algal blooms in Chinese coastal waters will persist due to perturbed nutrient ratios. Environ. Sci. Technol. Lett. 8, 276–284. doi:10.1021/acs.estlett.1c00012
Wang, Y., Shen, Z., Niu, J., and Liu, R. (2009). Adsorption of phosphorus on sediments from the Three-Gorges Reservoir (China) and the relation with sediment compositions. J. Hazard. Mater. 162 (1), 92–98. doi:10.1016/j.jhazmat.2008.05.013
Wei, J. F., Chen, H. T., Liu, P. X., Li, R. H., and Yu, Z. G. (2010). Phosphorus forms in suspended particulate matter of the Yangtze River [in Chinese]. Adv. Water Sci. 121 (1), 107–112.
Welch, H. L., Coupe, R. H., and Aulenbach, B. T. (2014). Concentrations and transport of suspended sediment, nutrients, and pesticides in the lower Mississippi-Atchafalaya River subbasin during the 2011 Mississippi River flood, April through July (Report No. 2014–5100; Scientific Investigations Report. Reston, Virginia: USGS Publications Warehouse, 54. doi:10.3133/sir20145100
Yao, Q.-Z., Du, J.-T., Chen, H.-T., and Yu, Z.-G. (2015). Particle-size distribution and phosphorus forms as a function of hydrological forcing in the Yellow River. Environ. Sci. Pollut. Res. Int. 23 (4), 3385–3398. doi:10.1007/s11356-015-5567-3
Yu, T., Wei, M., Ongley, E., Li, Z., and Chen, J. (2010). Long-term variations and causal factors in nitrogen and phosphorus transport in the Yellow River, China. Estuar. Coast. Shelf Sci. 86 (3), 345–351. doi:10.1016/j.ecss.2009.05.014
Zeng, X., Huang, L., He, G., Wang, D., Wu, X., and Fang, H. (2022). Phosphorus transport in the Three Gorges Reservoir over the past two decades. J. Hydrology 609, 127680. doi:10.1016/j.jhydrol.2022.127680
Zhang, S., Zeng, Y., Zha, W., Huo, S., Niu, L., and Zhang, X. (2022). Spatiotemporal variation of phosphorus in the Three Gorges Reservoir: Impact of upstream cascade reservoirs. Environ. Sci. Pollut. Res. Int. 29, 56739–56749. doi:10.1007/s11356-022-19787-7
Zhou, A., Tang, H., and Wang, D. (2005). Phosphorus adsorption on natural sediments: Modeling and effects of pH and sediment composition. Water Res. 39 (7), 1245–1254. doi:10.1016/j.watres.2005.01.026
Zhou, J., Zhang, M., and Li, Z. (2018). Dams altered Yangtze River phosphorus and restoration countermeasures [in Chinese]. Hupo Kexue 30 (4), 865–880. doi:10.18307/2018.0401
Zhou, J., Zhang, M., Lin, B., and Lu, P. (2015). Lowland fluvial phosphorus altered by dams. Water Resour. Res. 51 (4), 2211–2226. doi:10.1002/2014wr016155
Keywords: phosphorus, sediment, regime, river environment, river ecology
Citation: Li H, Zhou J and Zhang M (2023) Regime of fluvial phosphorus constituted by sediment. Front. Environ. Sci. 11:1093413. doi: 10.3389/fenvs.2023.1093413
Received: 09 November 2022; Accepted: 09 January 2023;
Published: 19 January 2023.
Edited by:
Biyun Guo, Zhejiang Ocean University, ChinaReviewed by:
Pengfei Hei, Minzu University of China, ChinaCopyright © 2023 Li, Zhou and Zhang. This is an open-access article distributed under the terms of the Creative Commons Attribution License (CC BY). The use, distribution or reproduction in other forums is permitted, provided the original author(s) and the copyright owner(s) are credited and that the original publication in this journal is cited, in accordance with accepted academic practice. No use, distribution or reproduction is permitted which does not comply with these terms.
*Correspondence: Man Zhang, emhhbmdtYW44NkB0c2luZ2h1YS5lZHUuY24=
Disclaimer: All claims expressed in this article are solely those of the authors and do not necessarily represent those of their affiliated organizations, or those of the publisher, the editors and the reviewers. Any product that may be evaluated in this article or claim that may be made by its manufacturer is not guaranteed or endorsed by the publisher.
Research integrity at Frontiers
Learn more about the work of our research integrity team to safeguard the quality of each article we publish.