 Xinmiao Zhou
 Shengchao Ye
- Business School, Ningbo University, Ningbo, Zhejiang, China
The problem of correlation between the Chinese green bond market and the government bond market may affect the smooth operation of the national economy. In this paper, a total of 3,181 sets of data representing the China’s green bond market and the government bond market for the period 2010–2022 are selected, and the VECM-DCC-VARMA-AGARCH model is used to analyse the spillover effects between the two in terms of information transmission and risk contagion. The results indicate that 1) The dynamic correlation between the China’s green bond market and the government bond market is significant, with obvious information transmission and risk contagion effects. 2) Compared to the government bond market, the green bond market is more sensitive to new information and the intensity of the reflection is stronger. 3) There is a long-term equilibrium relationship between the China’s green bond market and the government bond market, and the government bond market will adjust in the direction of green bonds through an error correction mechanism when deviations occur. 4) There is a significant two-way risk contagion effect between the green bond market and the government bond market, but the intensity of the effect is asymmetric. 5) The dynamic correlation between the green bond market and the government bond market has been deepening. Based on the above findings, we have put forward some rationalisation proposals.
1 Introduction
With the advent of the “Double Carbon” era, 1China is poised to achieve a higher level of green development, and the development of green industries, along with the green transformation of industries, will further release their potential. It is estimated that China’s future annual capital demand for green industries will reach RMB 3–4 trillion (Escalante et al., 2020). Furthermore, the function of green finance in supporting the development of various green industries will become more prominent, playing a central role in China’s green development. Green bonds have a very high degree of activity and application in the green financial system and occupy an important position amongst all green financial instruments. Due to their attached green attributes in line with the direction of economic development and policy guidance, they are gradually becoming a hot product in the Chinese financial market (Gao et al., 2021). Funds raised through green bonds are mostly invested in green industries with environmental benefits but with tight capital requirements and long return cycles. Such funds also play an important role in effectively alleviating the problems of high financing costs and difficulties in financing green enterprises and projects (Lin and hong, 2022). At the same time, China’s financial market environment is still in the process of improving and maturing, and the trends of increasing financial liberalisation and loosening financial regulations are becoming much more obvious, objectively leading to increasing linkages among various financial markets, including the green bond market (Liu et al., 2020).
To date, China’s green bond market is considered the second largest in the world (Lin and hong, 2022). However, its rapid development and expanding market size have led to increased concerns about its correlation with other financial markets and the potential impact it may have on the financial system as a whole (Zhang, 2020). As a traditional fixed income market, its size, yield levels and maturity spreads are inextricably linked to the macroeconomy and are closely related to the national economy as a whole. Therefore, the study of the risk correlation between China’s green bond market and the government bond market is crucial to the efficient and sustainable development of China’s green financial market and the smooth operation of the national economy.
This paper investigates the correlation between China’s green bond market and the government bond market based on the background information stated above. The VECM-DCC-VARMA-AGARCH model is used to analyse the information transmission and risk contagion between the two markets so as to better examine the correlation between them. Based on the results of this study’s empirical analysis, a better understanding of the impact of fluctuations in China’s green bond market on the macroeconomy can be formed, and additional recommendations for countermeasures to prevent financial risks and improve the development of the green bond market can be made.
2 Review of relevant literature
2.1 Green bonds and macroeconomic relevance research
As a new type of financial instrument, green bonds are still in the process of rapid development. Due to their positive growth expectations and expanding market scale, the relationship between the green bond market and the national macro economy has attracted research attention, especially in the area of risk correlation, which is prevalent in the financial market. For example, Ma (2015) pointed out that green bonds, as an important financial instrument in China’s green financial market, have unique applicability in guiding social capital and promoting economic transformation due to their high social value, high liquidity, low risk and short maturity. In response to the general situation of slow economic growth and low interest rates in the ECO countries, Carlstrom et al. (2017) argued that investors are more eager to seek financial products that offer higher and more stable returns than traditional financial assets, and green bonds have been created to meet this demand, thus giving these countries an advantage in making their economies more sustainable. Kui (2016) took the first G20 Green Finance Synthesis Report as a background and analysed the favourable and unfavourable conditions for the development of green finance in China under the current environment with reference to international green finance practices. This study (Kui, 2016) revealed that the innovation and development of green finance can effectively promote economic growth and transformation. Gianfrate and Peri (2019) argued that the convenience of green bond financing is higher than other options; thus, they play an important role in improving the investment and financing environment for green projects. They also reported that a more open and effective environment can promote green financial innovation, leading to green economic development.
2.2 Study of the relationship between the green bond market and other markets
In recent years, the relationship between the green bond market and other markets has received considerable attention from researchers, and the possible impact of this new development on other markets has gradually become clearer and better understood. Pham (2016) found earlier that overall shocks in traditional bond markets tend to spill over into the green bond market, and that such shock effects are time-varying. Subsequently, a series of studies by Reboredo, 2018 revealed more systematically the links between the green bond market and other markets. By unifying the green bond market with traditional fixed income, energy and equity markets into the analytical framework and examining the price linkages between them, it was found that the green bond market is more closely linked to the fixed income market but less correlated with the equity and energy markets (Reboredo et al., 2020), while the reverse pass-through effect of the green bond market on other markets is negligible (Reboredo and Ugolini, 2020). On this basis, Reboredo et al. (2020), Naeem et al., 2021b further constructed a network of linked green bond markets and capital markets in the US and the EU, showing that green bonds have a strong interaction with government and corporate bonds in Europe and the US, both in the long and short term. Subsequently, the scope of the study was further extended, with Naeem et al. (2021a) focusing on the correlation between green bond markets and different commodity markets, finding significant asymmetries, with the strongest hedging benefits against volatility in natural gas, some industrial metals and agricultural commodities. Pham and Nguyen (2021) analysed the correlation between international green bonds and other asset categories, including energy markets, equity markets and traditional bonds, and find that the spillover effects between different asset classes and green bonds vary significantly across quantiles Gao et al. (2021). examined the dynamic return and volatility spillover effects between the green bonds market and major financial markets, using the Chinese market as a sample, and found that there are significant two-way risk spillover effects between the green bond market and the traditional bond market, while the risk spillover between the green bond market, the foreign exchange market and the currency market was not significant. The relationship between the green bond market and other pan-green markets is also gaining attention. Hammoudeh et al. (2020), using the US market as a sample, found a significant causal relationship between the US 10-year Treasury index and green bonds, while the causal relationship between the clean energy index and green bonds was very limited. Liu et al. (2021), using the Chinese market as a sample, found a significant causal relationship between the green bond market and the clean energy stock market. Ren et al. (2022) studied the linkage between the carbon futures market and the green bond market and found that the carbon futures market has a unidirectional effect on the green bond index, and this effect is positive in the medium to long term, but unstable in the short term, which means that the relationship between the two is obviously influenced by volume, and investors are still adapting to this trend.
The above research shows that there is a broad correlation between the green bond market and other financial or commodity markets, and although there are differences in the direction and intensity of the interaction, the green bond market has become a non-negligible player in financial markets and even macroeconomic stability.
2.3 Mechanisms for green bond markets to influence the macroeconomy
By combing through the relevant literature above, we can infer to a certain extent the mechanism of interaction between the green bond market and the macro economy. Firstly, the innovative and convenient nature of green bonds compared to other financing instruments will help to promote the development of green industries by catering to investors’ investment needs, thereby guiding the development of the macro economy (Ding et al., 1993; Carlstrom et al., 2017). Secondly, the green bond market is closely linked to other traditional financial and commodity markets. On the one hand, due to the risk spillover effects commonly found in financial markets, the green bond market is susceptible to fluctuations in other financial markets, and on the other hand, as an emerging financial market, fluctuations in the green financial market can easily be transmitted to other financial markets due to inadequate mechanisms and unfamiliarity of investors. This could lead to unknown risks and even systemic financial risks (Reboredo et al., 2020; Reboredo et al., 2020; Gao et al., 2021). In addition, some scholars have also focused on the micro level of green financial markets such as green bonds affecting the macro economy. For example, Desalegn and Tangl (2022) found that from a bank’s perspective, green financial innovation has a significant positive effect on improving the financial performance of Ethiopian banks, and this is a key reason why banks continue to promote green financial product development, which can be expected to have a significant impact on macroeconomic development patterns. Liu et al. (2022a) found that, in the context of green development becoming a consensus, scientifically sound steering strategies, including green bond markets, promote overall economic energy efficiency by influencing the level of investment in industrial structure and R&D innovation, and the extent of improvement is strongly correlated with resource endowment. Liu et al. (2022b) found that there is a positive spatial spillover effect between regional green innovation efficiency and development quality and technology industry agglomeration, and that the mutual promotion between the three contributes to the overall transformation of the regional economy. In further, studies by Li et al. (2021), Wang et al. (2021), Zhou et al. (2020) and Li et al. (2022) on the relationship between firms’ investment orientation and their digital transformation and R&D innovation behaviour have important implications for our understanding of the macroeconomic impact mechanisms of the development of green bond markets.
2.4 Study on the correlation between the government bond market and macroeconomy
The relationship between government bonds and macroeconomics has long been a concern of many researchers. For instance, Barro (1979) argued that government bonds can be used to finance temporary expenditures and release some liquidity when the government is under pressure to spend. In terms of the macroeconomic effects of government debt, it has been found to have a certain stimulating effect on the economy and can effectively drive the country’s economic development in the short term; however, its size should be kept within a reasonable range; otherwise, it will cause macroeconomic instability (Elmendorf and Mankiw, 1999). Meanwhile, Abbas and Christensen (2007) selected relevant data from some countries as a sample for empirical analysis and concluded that reasonable and moderate debt rising can significantly boost a country’s economic growth. A study by Miao et al. (2017) on China’s macroeconomic data from 1986 to 2013 found that fiscal deficits do not contribute to economic growth in the long run and that government debt also inhibits short-term economic growth. Zhao and Chen (2018) conducted an in-depth analysis of the mechanism explaining how government debt affects economic growth. They found that government debt only has a positive contribution to the economy when the market interest rate is lower than the economic growth rate. In conclusion, the size of government debt, the level of yields and maturity spreads are all closely related to the operation of the macro economy.
2.5 Research on information transmission and risk contagion amongst financial markets
2.5.1 Study of information transmission effects between financial markets
A more common approach to studying the information transmission effects in financial markets is to study the information transmission relationship between markets from the perspective of the change in the mean value of returns. For example, Cha and Oh (2000) used a VAR model to find a strong correlation between developed markets and emerging Asian markets as a result of the Asian financial crisis. Meanwhile, Maćkowiak (2007) found that significant changes in US monetary policy have a direct effect on interest rates and exchange rates in emerging markets and have a significant impact on them by using an SVAR model. Park and Ratti (2008) found that oil price shocks in the US and several European countries (regions) have a significant impact on stock returns by constructing a multivariate VAR model empirically. In terms of domestic research, studies on the information transmission effect between the nominal exchange rate of RMB and the stock market (Deng and Yang, 2008) and the information transmission effects amongst stock returns, bond returns and interest rate returns (Yue and Zhang, 2014) are considered successful applications of VAR models.
2.5.2 Study of risk contagion effects in financial markets
The volatility spillover effect, or risk contagion effect, is used to describe the interactions between markets in terms of the volatility of the variance of yields (Engle and Manganelli, 2004). Bollerslev (1986) constructed the GARCH model based on the ARCH model (Engle, 1982), which was used to predict the future conditional variance more accurately by reducing the parameters to be estimated. Their approach can better solve the heteroscedasticity problem in financial time series. Since Bollerslev et al. (1988) proposed a multivariate GARCH model to better characterise the correlation between markets, GARCH family models have become the most mainstream research method in this field. Some representative studies include Kanas (1998), who studied the correlations amongst the United Kingdom, French and German stock markets based on multivariate EGARCH models; Engle (2002), who used DCC-GARCH models to study the dynamic correlation between the US stock and bond markets; and Dean et al. (2010), who used GARCH models to study the correlation between the Australian stock and bond markets. Amongst domestic research, the main examples include the study on the linkage characteristics of China’s stock market and bond market yield changes using the DCC-MVGARCH model based on t-distribution (Luo et al., 2014), the study on the two-way spillover effects of international commodity and financial markets based on the BEKK-GARCH model (Tan et al., 2018) and the study that used the VAR-GARCH-BEKK model to investigate the information transmissibility between monetary policy and stock market markets in China (Li et al., 2014; Liu et al., 2022c), among others. The study by Liu and Finance, (2017) is noteworthy as it aimed to make up for the shortcomings of the BEKK and DCC-GARCH models by considering the problem of mutual influence of separate estimation of mean and variance equations and innovatively used the VECM-DCC-VARMA-AGARCH association model to complete the empirical operation and obtain more accurate scientific conclusions. This method is also used in the current study.
In summary, both the green bond market and the government bond market play a vital role in macroeconomic development, and there are extensive links between the green bond market and other markets, including the financial markets. As the government bond market is an important reference for the financial market, it is reasonable to assume that there is also a very close relationship between the two bond markets. As the government bond market has an important role in combating systemic risk, the information transmission and risk contagion between it and the green bond market should naturally be an issue of concern. However, there is a lack of clear literature on the correlation between the emerging green bond market and the government bond market. A systematic study of the relationship between the two would be of great benefit to the overall state of macroeconomic performance, and this is the main expected contribution of this study.
3 Model
In order to simultaneously study the price transmission function, risk contagion effect and asymmetric effect of volatility between the green bond market and government bond market within one system, this paper draws on Liu and Finance, (2017) by combining the error correction model (VECM) and GARCH model and setting the variance equation in the form of DCC-VARMA-AGARCH to overcome the shortcomings of the traditional BEKK and DCC models in order to more accurately portray the dynamic linkage between the two markets. At the same time, the conditional mean equation in this paper is set in the form of a vector error correction model (VECM) to examine the long-term stability of the relationship between the green bond market and the government bond market as well as the short-term dynamic adjustment process, and to examine the direction of information transmission between markets. The VECM-DCC-VARMA-GARCH model with joint estimation of the mean and variance equations can be expressed as
Where,
This paper builds on the VARMA-GARCH model proposed by Ling and McAleer (2003) by further adding the asymmetric effects of positive and negative information shocks to the variance equation (McAleer et al., 2009), which is set up to better fit the characteristics of the Chinese financial market (Zhou et al., 2020). The main feature of the VARMA-GARCH model is that the variance equation simulates the process of VARMA to calculate the ARCH and GARCH terms (Kupiec, 1995) and applies it to the analysis of multivariate GARCH. Compared to other multivariate GARCH models, the model coefficient structure is more brief and the economic significance is more easily interpreted. The constructed variance equation in the form of DCC-VARMA-AGARCH is as follows:
In Eqs 1, 2, the residual vector
Meanwhile, we discuss the dynamic correlation between the two markets through a DCC-GARCH model (Engle, 2002). The conditional correlation coefficient matrices are
where
In the mean equation, if all
Where
In order to better identify and analyse the risk contagion effect between the two markets, the variance equation (Eq. 2) is expanded as follows.
It is clear that the conditional variance of the series of the two market variables is affected by the squared prior residuals and conditional variance from the other market, in addition to the squared prior residuals and conditional variance. The parameter
where
4 Quantitative analysis results
4.1 Sample selection and basic analysis
4.1.1 Sample selection
Considering the relatively obvious market segmentation in the Chinese green bond market (Zhou et al., 2020), this paper selects the average yield to maturity of the more representative 3–5 years China Bond-China Green Bond Index (CBA04931, ‘gr35’ for short) as a proxy variable for the green bond market, which is a full-price index compiled from a sample of green bonds listed in the interbank bond market, SSE and SZSE in RMB as the currency. To avoid errors in sample matching due to differences in compilation companies and guidelines, the average yield to maturity of the 5-year China Bond-China Government Bond Full Price Index (CBA03103, “go5” for short) is selected as the proxy variable for the government bond market. The data used in this paper were obtained from the Wind database, and the sample time period was from 5 January 2010 to 30 December 2022. The resulting data contained a total of 3181 sets of observations.
Figure 1 plots the time-series variation of the 3–5 years green bond yield to maturity (gr35) against the 5-year government bond yield to maturity (go5). Figure 2 plots the time-series variation of the two sets of yield to maturity after differencing (i.e., volatility clustering effect), which are referred to as “Dgr35” and “Dgo5” for short. Figure 3 plotts the deviation from a normal distribution of the differential series of yields in the two markets. Figure 4 plots the cumulative distribution of the two markets’ yields to maturity differential series, excluding the 2.5% quantile extremes in the upper and lower tails.
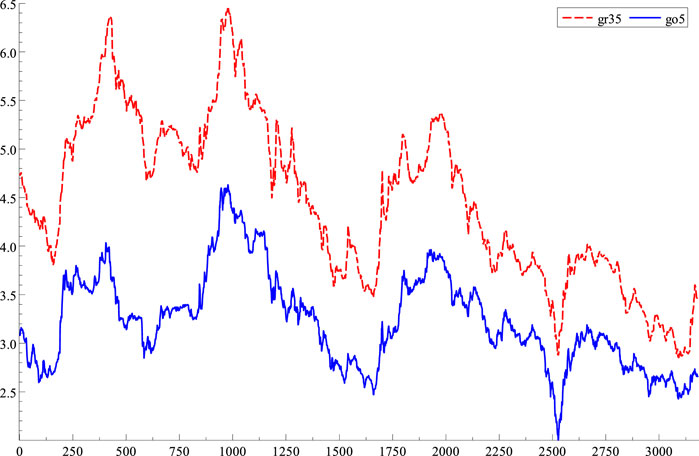
FIGURE 1. The temporal trend of gr35 and go5.
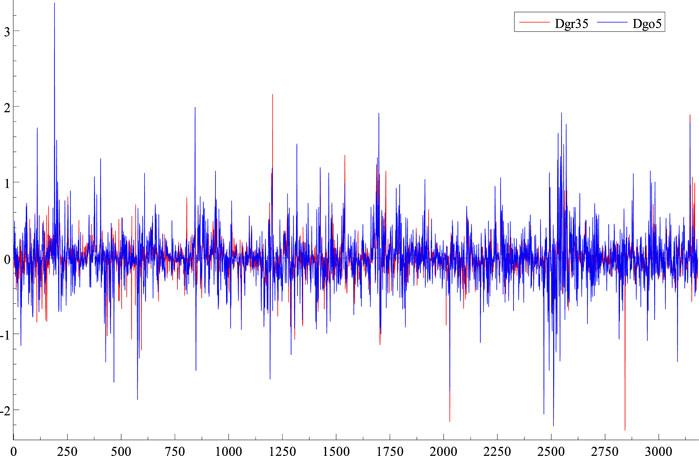
FIGURE 2. The volatility clustering effects of Dgr35 and Dgo5.
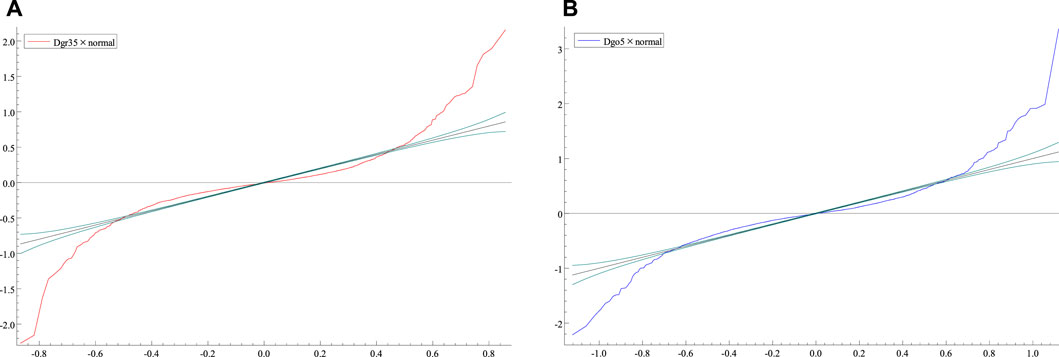
FIGURE 3. Comparison of the distributions of Dgr35 and Dgo5 with the normal distribution.
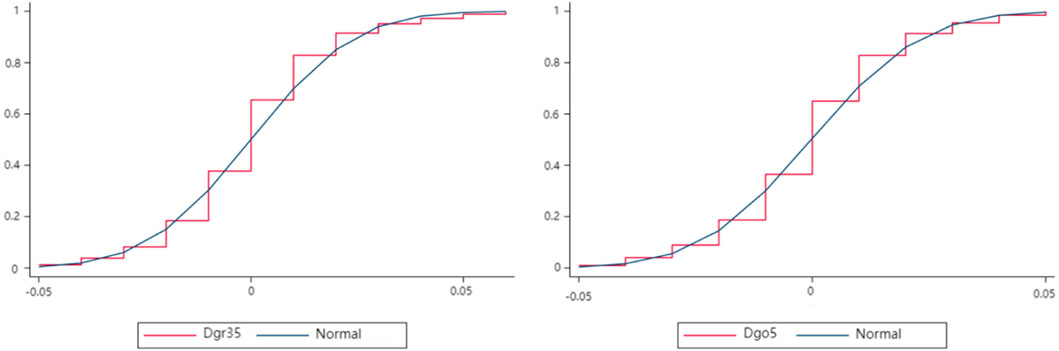
FIGURE 4. The cumulative distributions of Dgr35 and Dgo5.
As shown in Figure 1, the series of maturity yields of green bonds and government bonds generally show a relatively obvious downward trend, consistent with the continued easing of monetary policy in China in recent years and the overall downward trend of market interest rates. Therefore, the maturity yield series of green bonds and government bonds should be a non-smooth series, and the time trend graph trend is relatively close, indicating a potential long-term equilibrium (co-integration) relationship. Thus, the form of the vector error correction model (VECM) model is considered in the conditional mean equation setting of this paper.
Meanwhile, as shown in Figure 2, the differential series of the yield to maturity always fluctuates up and down around the value of zero, and the average fluctuation is large. Furthermore, a larger perturbation is followed by another larger perturbation, while a smaller perturbation succeeds another smaller perturbation. This means that a clustering effect is observed on the volatility, indicating some degree of ARCH effect in the series.
Figure 3 shows that the differential series of both yields have an asymmetric distribution in the upper and lower tails. These indicate that the differential series of maturity yields in both markets are likely to have more significant volatility in the tails and that the upper tails of both series are significantly more volatile than the lower tails, which is more pronounced on the right-hand side of the government bond market. This means that the risk of long positions in both bond markets is likely to be more significant than that of short positions. Furthermore, the risk is more pronounced. Thus, it is clear that the distributions of both series have thick tails, are skewed and do not conform to a normal distribution.
Finally, as can be seen from Figure 4, approximately 95% of the sample values of the magnitude of volatility (i.e., the absolute value of the difference series) of the two bond markets’ returns to maturity do not exceed 0.05, indicating that both have sample values close to or greater than 5% or greater than 0.05. Combined with Figure 3, the presence of risk, particularly tail risk, in the two bond markets can be seen more clearly.
4.1.2 Descriptive statistical analysis
Table 1 presents the basic statistical characteristics of the differential series of 3–5 years green bond maturity returns (Dgr35) and the differential series of 5-year government bonds maturity returns (Dgo5). The standard deviations of the two are similar, indicating that the short-to medium-term green bond market has a similar degree of volatility to the government market. The skewness, kurtosis and the JB statistic also indicate that both the green bond and government bond yield to maturity differentials do not follow normal distributions, showing spikes and thick tails. The ARCH-LM test shows a significant ARCH effect for both series, and the BP-Q statistic shows significant autocorrelation for both the original series and the squared term series. Therefore, it is reasonable and feasible to investigate the contagion effect between the two markets using a multivariate GARCH-type model.
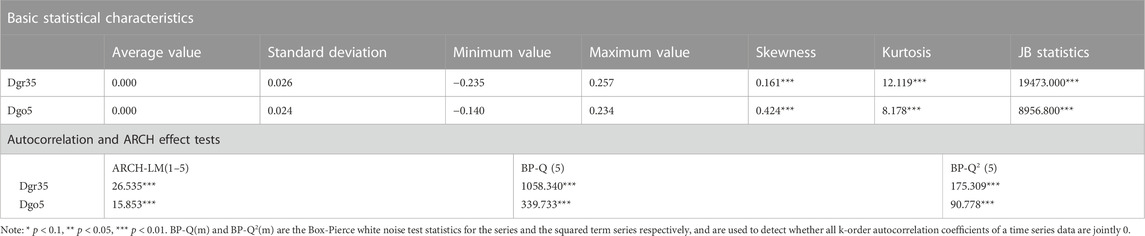
TABLE 1. Basic statistical characteristics and results of autocorrelation and ARCH effect tests.
4.1.3 Unit root and co-integration tests
The stability test is a prerequisite for GARCH modelling and can be effective in avoiding pseudo-regressions. Table 2 presents the results of the ADF unit root test. As can be seen, Panels 1 and 2 reveal that both market yield-to-maturity series are non-stationary, whilst both market yield-to-maturity difference series are stationary. These results indicate that both market yields to maturity are single-integer series of order 1 (i.e., the I (1) process). Based on this finding, the two-step method (Engle and Granger, 1987) is applied to perform a unit root test on the residual series Ei35 of the linear regression model between the green bond yield to maturity and the government bond yield to maturity. The results shown in Panel three indicate a long-run equilibrium co-integration relationship between the green bond yield to maturity and the government bond yield to maturity, implying that it is more reasonable to use the VECM model in the study of information transmission.
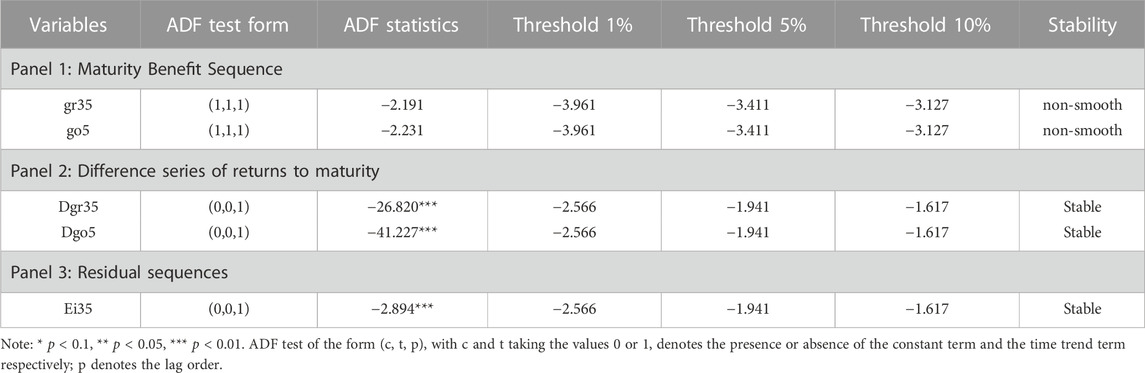
TABLE 2. Unit root test and co-integration test results for each series.
4.2 Empirical analysis of information transmission and volatility spillover effects between the green bond market and the government bond market
4.2.1 Lagged order test
In Table 3, LL denotes the log-likelihood function, LR denotes the likelihood ratio test (i.e., a likelihood ratio test to measure the joint significance of the last order coefficients), and FPE denotes the Akaike final prediction error, which is a measure of the mean squared error of one-step ahead forecast. The information criterion in Table 3 indicates that four is the best lag order; thus, the lag order of the VAR model for gr35 and go5 is determined to be the fourth order, and the lag order of the VECM model below is determined to be the third order.
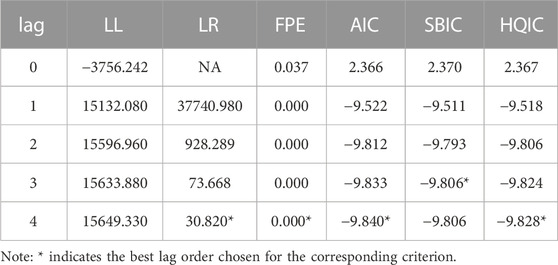
TABLE 3. Results of the gr35 and go5 lagged order tests.
4.2.2 Granger causality test
The co-integration relationship can illustrate the long-term stable relationship but not the causal relationship between the series. The results of the Granger causality test in Table 4 show that the government bond market yield affects the green bond market yield to a greater extent and is the Granger cause of the green bond market yield. The original hypothesis that green bond market yields are not the Granger cause of the government bond market yields cannot be rejected, indicating that green bond market yields may not be the Granger cause of the government bond market yields and that there may be a unidirectional causal relationship between the two.
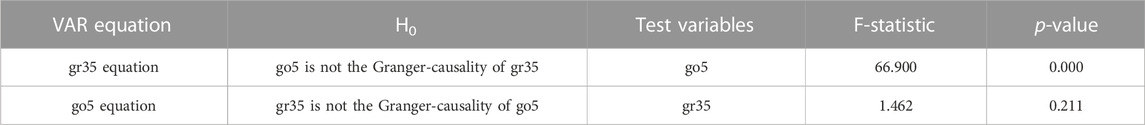
TABLE 4. Results of the gr35 and go5 Granger causality tests.
4.2.3 Model estimation results and analysis
Panel 1 in Table 5 presents the estimated results of the model mean equation, where
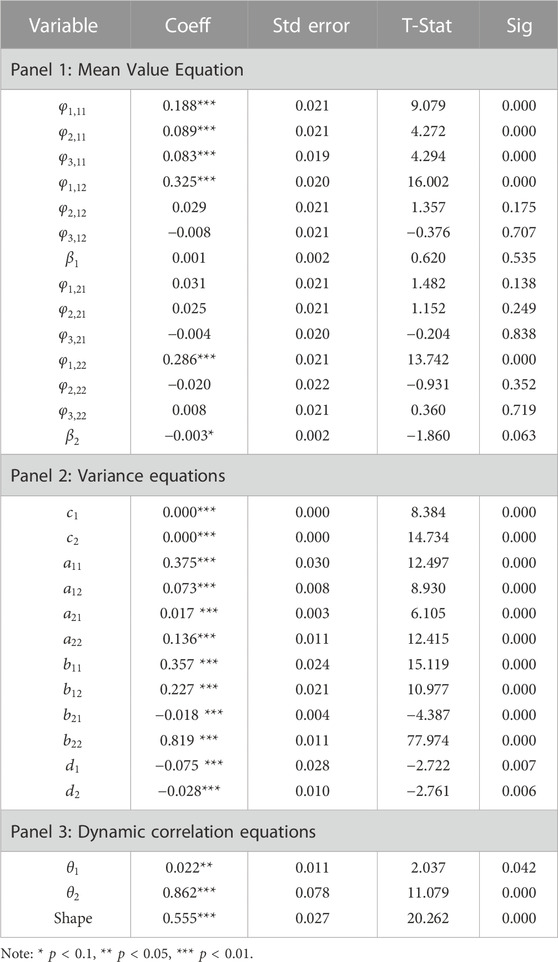
TABLE 5. Estimation results of the parameters of the VECM-DCC-VARMA-AGARCH model.
An analysis of the estimated results of the mean equation shows that the level of change in green bond market yields is significantly influenced by the first 1–3 periods of its own (1%), as well as the first 1 period (1% level) of the change in the government bond market yields. The level of change in the government bond market yields is significantly influenced by the first 1 period (1% level) of its own. The above results suggest two things: (1) a strong autocorrelation and some degree of cross-correlation between the levels of yield changes in both the green bond and government bond markets; and (2) that neither bond market is an efficient market. The green bond market is more dependent on its own historical yield changes and has a long duration of influence, whilst the government bond market is less dependent on its own historical yield changes and has a short duration of influence. The dependence of the green bond market on changes in the government bond market yields is significantly stronger than the dependence of the latter on changes in the former. In other words, the government bond market is more responsive to information, and changes in yields to maturity are ahead of the green bond market. This is mainly due to the late start of green finance in China and the fact that the green bond market is still far less developed than the government bond market, both in terms of scale and maturity.
The coefficient on the error correction term is insignificant for the maturity return differential in the green bond market and significantly negative (at the 10% level) for the error correction term for the maturity return differential in the government bond market. This indicates that when the long-term equilibrium relationship between the green bond market and government bond market maturity yield deviates, the green bond maturity yield does not correct for the deviation from the equilibrium of the two, while the government bond maturity yield adjusts towards the green bond maturity yield through the correction mechanism, indicating that the main body of the project on which the government bond is based is increasingly in line with the requirements of green development, which to some extent indicates that the relevant strategies and supportive policies are having an effect.
Panel 2 shows the results of the variance equation estimation of the model. Before analysing the results, it is necessary to explain ARCH-type and GARCH-type volatility spillover effects, which represent the sensitivity of a market to new information and the persistence of the effects of prior events in that market, respectively (Engle, 2002; Engle and Manganelli, 2004).
Firstly, in terms of the performance of the two markets’ own risk characteristics, it can be found that
Secondly, in terms of information transmission between the two markets, it can be found that
Thirdly, in terms of the continuity of the impact of the preceding events, it can be found that
Combining the estimated results of both ARCH and GARCH-type effects, we have
Panel three presents the estimated results of the model’s dynamic correlation equation. In terms of the dynamic correlation between green bonds and the government bond market yields,
4.2.4 DCC dynamic correlation coefficient analysis
As shown in Figure 5, the dynamic correlation coefficient between green bonds and government bond yields is always positive, with the overall fluctuation level concentrated in the range of 0.35–0.6, reaching a minimum value of 0.219 and 0.217 in period 549 and 2844, after which there is no more relative low value. The overall trend is also relatively slow to rise. This indicates that with the continuous development of green finance, green bonds—as the most rapidly developing green financial derivatives—have seen their issuance scale rise. Thus, the diversification of issuance types, maturities and subjects, as well as the increase in secondary market activity, all of which have contributed to the continuous maturation of China’s green bond market, deepens the dynamic link with the government bond market. The graph also shows strong fluctuations in the relatively volatile financial environments around 2010, 2015 and 2018, with the highest values exceeding 0.7, which is close to or almost exceeding 0.8. This indicates that the risk spillover effect between the government bond market and the green bond market is also more pronounced in volatile environments.
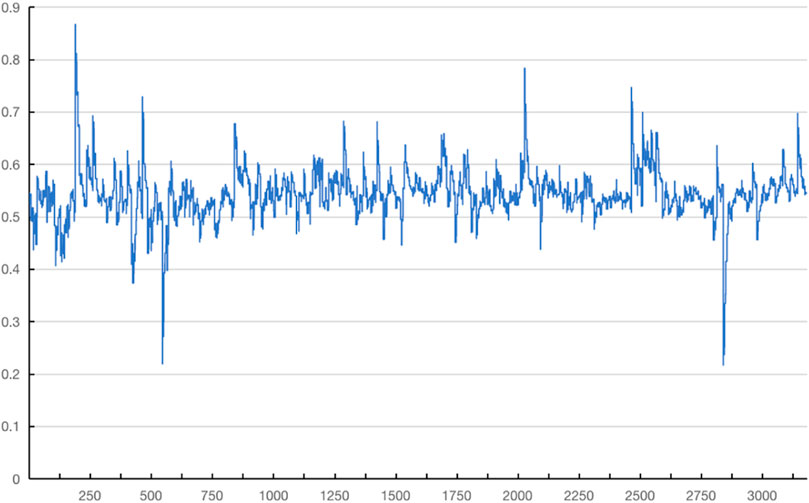
FIGURE 5. The dynamic correlation coefficient between Dgr35 and Dgo5.
4.3 Robustness tests
To ensure the accuracy and robustness of the estimation results, this paper first performs autocorrelation and ARCH effect tests on the standard residuals and their squared terms obtained from the model estimation. Then, F-tests are performed on the mean equation to determine the reliability of the information transmission relationship. Finally, likelihood ratio tests are performed on the variance equation to determine the reliability of the risk contagion relationship. The results of each of the three tests are presented below.
4.3.1 Correlation test for standardised residuals
From the serial correlation test results in Table 6, it can be seen that both standardised residual series no longer have serial autocorrelation; from the ARCH effect test, it is apparent that both standardised residual series no longer show the ARCH effect. Although there is still some correlation in the squared series of the residuals, the model fit is generally found to be adequate and robust.
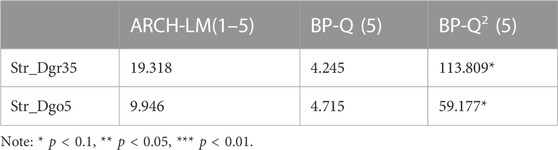
TABLE 6. Tests based on the standardised residuals of the model.
4.3.2 Information transmission relationship test
Table 7 presents the results of the test for the information transmission relationship, i.e., the results of the joint significant F-test on the coefficients of the model mean equation, which is determined by calculating the joint significant F-statistic of the differential lagged terms of the green bond and the government bond yields to maturity in the model mean equation. The results reveal that the original hypothesis of no information transmission from the government to the green bond market (
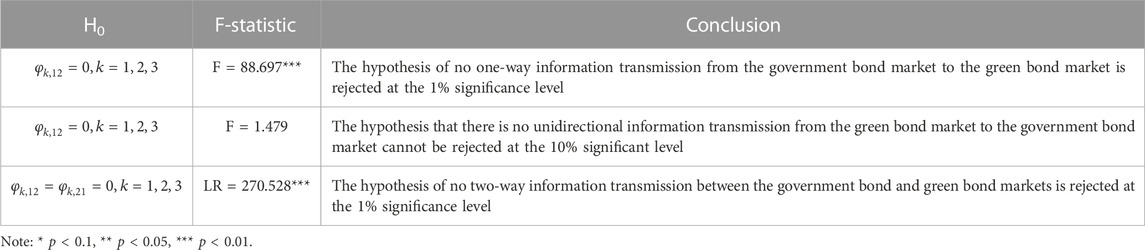
TABLE 7. Test of information transmission relationship between green bonds and the government bond market benefits.
4.3.3 Test for risk contagion effects
Table 8 shows the results of the risk spillover effect test, i.e., the results of the joint significance test of the coefficients of the model variance equation. This was performed by calculating the LR statistic of the joint significant likelihood ratio test of the cross-term conditional variance and the squared residuals in the variance equation. The results show that the hypothesis of no unidirectional volatility spillover from the government bond market to the green bond market (
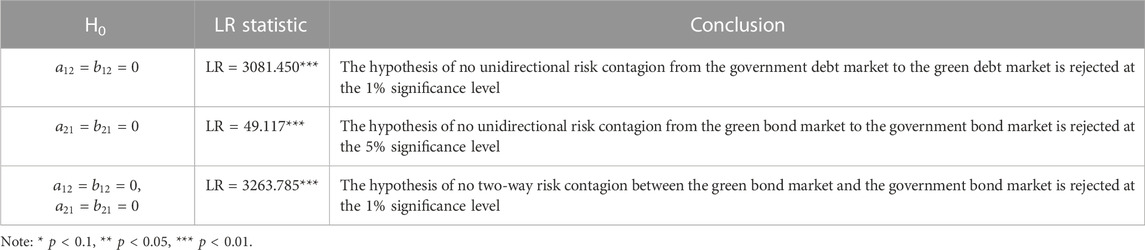
TABLE 8. Test of risk contagion effects between green bonds and the government bond market.
Meanwhile, the hypothesis that there is no two-way risk contagion between the green bond market and the government bond market (
5 Conclusion
This paper focuses on the information transmission and risk contagion effects between the green bond market and the government bond market in China, and analyses them through VECM-DCC-VARMA-AGARCH modelling. The following conclusions were obtained:
1. There is an overall two-way information transmission relationship between the China’s green bond market and the government bond market, but the information transmission from the government bond market to the green bond market is significantly stronger than the other reverse information transmission. The government bond market is more independent and is less influenced by its own pre-existing influences and the green bond market and is less persistent. It is more responsive to the impact of new information.
2. The green bond market is more sensitive to new information than the government bond market, and also more responsive to its own pre-existing volatility, suggesting that the green bond market translates new information shocks into market volatility more quickly. This may be due to the inadequate information disclosure system in China’s green bond market, resulting in investors not being fully informed and overreacting, thus increasing the risk of unanticipated shocks to the market.
3. There is a long-term equilibrium relationship between the green bond market and the government bond market, and government bond maturity returns are adjusted towards green bonds through an error correction mechanism when deviations occur. This means that the project entities on which the government bonds are based are increasingly in line with the requirements of green development, indicating to some extent that the relevant guiding policies are working.
4. In terms of risk contagion, there is a two-way ARCH-type risk contagion effect in both markets, and the impact of new information shocks in the government bond market has a relatively greater impact on the volatility of the green bond market. There is asymmetry in the GARCH-type risk contagion effect in both markets. Pre-early shocks in the government bond market increase the volatility of the current green bond market, while pre-early shocks in the green bond market decrease the volatility of the current government bond market, and pre-early shocks in the government bond market have a relatively greater impact on the volatility of the green bond market.
5. There is a strong positive dynamic correlation between China’s green bond and government bond markets, and the correlation shows a slow upward trend overall. The correlation between the two will show strong volatility in times of financial market turmoil, i.e., volatility spillover effects will be more pronounced in times of crisis.
In summary, this study provides the following policy recommendations.
1. The authorities should improve the information disclosure mechanism of green bonds, build an accurate and feasible tracking and evaluation mechanism, strengthen the timely and standardised disclosure of important information and reduce the various risks arising from information asymmetry.
2. Emphasis should be placed on innovation in the green bond market, enriching the types, maturities and subjects of green bonds, fostering a diversified green bond market and gradually optimising and expanding the issuing entities in the green bond market in a conditional manner.
3. Deepen the reform of the financial system, improve the green financial system, maximise the “double carbon” opportunity, introduce supportive policies to promote the development of green finance in due course and promote the diversified and comprehensive development of the financial market.
4. Enhance regulatory awareness, build a risk-related early warning system and strengthen the accurate identification and effective prevention and control of various potential risks that may exist in new financial markets.
Data availability statement
The original contributions presented in the study are included in the article/supplementary material, further inquiries can be directed to the corresponding author.
Author contributions
XZ conceived and designed the research and provided guidance throughout the entire research process. SY wrote the main part of the manuscript. HL collected the data and wrote the methods section. All authors contributed to the article and approved the submitted version.
Funding
This work was supported in part grants from Major Supporting Project of the National Social Science Fund of China (21BJY002 and 20AZD033), Humanities and Social Sciences Research Project of the Ministry of Education (20YJA790097) and Te Philosophy and Social Sciences in Zhejiang Province (20XXJC03ZD).
Conflict of interest
The authors declare that the research was conducted in the absence of any commercial or financial relationships that could be construed as a potential conflict of interest.
Publisher’s note
All claims expressed in this article are solely those of the authors and do not necessarily represent those of their affiliated organizations, or those of the publisher, the editors and the reviewers. Any product that may be evaluated in this article, or claim that may be made by its manufacturer, is not guaranteed or endorsed by the publisher.
Footnotes
1Double Carbon, short for “peak carbon” and “carbon neutral”, refers to the Chinese government’s commitment to achieve peak carbon by 2030 and carbon neutrality by 2060.
References
Abbas, S. M., and Christensen, J. The role of domestic debt markets in economic growth: An empirical investigation for low-income countries and emerging markets [J]. IMF Working Paper, Washington, D.C, 2007, doi:10.1057/imfsp.2009.24
Barro, R. J. (1979). On the determination of the public debt. J. political Econ. 87 (5), 940–971. doi:10.1086/260807
Bollerslev, T., Engle, R. F., and Wooldridge, J. M. (1988). A capital asset pricing model with time-varying covariances. J. political Econ. 96 (1), 116–131. doi:10.1086/261527
Bollerslev, T. (1986). Generalized autoregressive conditional heteroskedasticity. J. Econ. 31 (3), 307–327. doi:10.1016/0304-4076(86)90063-1
Carlstrom, C. T., Fuerst, T. S., and Paustian, M. (2017). Targeting long rates in a model with segmented markets. Am. Econ. J. Macroecon. 9 (1), 205–242. doi:10.1257/mac.20150179
Cha, B., and Oh, S. (2000). The relationship between developed equity markets and the Pacific Basin's emerging equity markets. Int. Rev. Econ. Finance 9 (4), 299–322. doi:10.1016/S1059-0560(00)00057-5
Dean, W. G., Faff, R. W., and Loudon, G. F. (2010). Asymmetry in return and volatility spillover between equity and bond markets in Australia. Pacific-Basin Finance J. 18 (3), 272–289. doi:10.1016/j.pacfin.2009.09.003
Deng, S., and Yang, C. (2008). An empirical study on the relationship between stock price and exchange rate in China[J]. Financial Res. 2022, 29–41. doi:10.3724/SP.J.1141.2008.00043
Desalegn, G., and Tangl, A. (2022). Forecasting green financial innovation and its implications for financial performance in Ethiopian Financial Institutions: Evidence from ARIMA and ARDL model. Natl. Account. Rev. 4 (2), 95–111. doi:10.3934/NAR.2022006
Ding, Z., Granger, C. W. J., and Engle, R. F. (1993). A long memory property of stock market returns and a new model. J. Empir. finance 1 (1), 83–106. doi:10.1016/0927-5398(93)90006-D
Elmendorf, D. W., and Mankiw, N. G. (1999). Chapter 25 government debt. Handb. Macroecon. 1, 1615–1669. doi:10.1016/S1574-0048(99)10038-7
Engle, R. (1982). Autoregressive conditional heteroscedasticity with estimates of the variance of United Kingdom inflation. Econ. J. Econ. Soc. 50 (4), 987–1007. doi:10.2307/1912773
Engle, R. (2002). Dynamic conditional correlation: A simple class of multivariate generalized autoregressive conditional heteroskedasticity models[J]. J. Bus. Econ. Statistics 20 (3), 339–350. doi:10.1198/073500102288618487
Engle, R., and Granger, C. (1987). Co-integration and error correction: Representation, estimation, and testing. Econometrica 55 (2), 251–276. doi:10.2307/1913236
Engle, R., and Manganelli, S. (2004). CAViaR: Conditional autoregressive value at risk by regression quantiles[J]. J. Bus. Econ. statistics 22 (4), 367–381. doi:10.1198/073500104000000370
Escalante, D., Choi, J., Chin, N., Cui, Y., and Larsen, M. L. (2020). The state and effectiveness of the green bond market in China. Clim. Policy Initiat. 2020, 10–27.
Gao, Y., Li, Y., and Wang, Y. (2021). Risk spillover and network connectedness analysis of China’s green bond and financial markets: Evidence from financial events of 2015–2020. North Am. J. Econ. Finance 2021 (57), 101386. doi:10.1016/j.najef.2021.101386
Gianfrate, G., and Peri, M. (2019). The green advantage: Exploring the convenience of issuing green bonds. J. Clean. Prod. 219, 127–135. doi:10.1016/j.jclepro.2019.02.022
Hammoudeh, S., Ajmi, A. N., and Mokni, K. (2020). Relationship between green bonds and financial and environmental variables: A novel time-varying causality. Energy Econ. 92 (92), 104941. doi:10.1016/j.eneco.2020.104941
Kanas, A. (1998). Volatility spillovers across equity markets: European evidence. Appl. Financ. Econ. 8 (3), 245–256. doi:10.1080/096031098333005
Kui, B. (2016). Innovative development of green finance in China under the framework of G20[J]. Gov. Stud. 2016 (6), 64–72. CNKI:SUN:ZSWD.0.2016-06-009.
Kupiec, P. H. (1995). Techniques for verifying the accuracy of risk measurement models[M]. Division of Research and Statistics, Division of Monetary Affairs, Federal Reserve Board.
Li, C., Guo, Z., and Wang, R. (2014). Research on spillover effect between monetary policy and stock markets—based on VAR-GARCH-BEKK model[J]. J. Beijing Inst. Technol. Sci. Ed. 16 (4), 83–91. CNKI:SUN:BLDS.0.2014-04-013.
Li, T., Li, X., and Albitar, K. (2021). Threshold effects of financialization on enterprise R&D innovation: A comparison research on heterogeneity. J. Quant. Financ. Econ. 5 (5), 496–515. doi:10.3934/QFE.2021022
Li, Z., Zou, F., and Mo, B. (2022). Does mandatory CSR disclosure affect enterprise total factor productivity?[J]. Econ. Research-Ekonomska Istraživanja 35 (1), 4902–4921. doi:10.1080/1331677X.2021.2019596
Lin, L., and Hong, Y. Developing a green bonds market: Lessons from China. Eur. Bus. Organ. Law Rev. 1 (2022): 143–185. doi:10.1007/s40804-021-00231-1
Ling, S., and McAleer, M. (2003). Asymptotic theory for a vector ARMA-GARCH model[J]. Econ. theory 19 (2), 280–310. doi:10.1017/S0266466603192092
Liu, C., and Finance, S. O. (2017). Should stock index futures be restricted trading in the stock market crisis:evidence from the 2015 Chinese stock market crisis[J]. Statistics Inf. Forum 32 (1), 84–93. doi:10.3969/j.issn.1007-3116.2017.01.013
Liu, N., Liu, C., Da, B., Zhang, T., and Guan, F. (2021). Dependence and risk spillovers between green bonds and clean energy markets. J. Clean. Prod. 2021 (279), 123595. doi:10.1016/j.jclepro.2020.123595
Liu, Y., Zhao, Y., Zhu, J., and Yang, C. (2022c). Technological industry agglomeration, green innovation efficiency, and development quality of city cluster. Green Finance 4 (4), 411–435. doi:10.3934/GF.2022020
Liu, Y., Failler, P., and Ding, Y. (2022a). Enterprise financialization and technological innovation: Mechanism and heterogeneity. PloS One 17 (12), e0275461. doi:10.1371/journal.pone.0275461
Liu, Y., Failler, P., and Liu, Z. (2022b). Impact of environmental regulations on energy efficiency: A case study of China’s air pollution prevention and control action plan. Sustainability 14 (6), 3168. doi:10.3390/su14063168
Liu, Y., Li, Z., and Xu, M. (2020). The influential factors of financial cycle spillover: Evidence from China. Emerg. Mark. Finance Trade 56 (6), 1336–1350. doi:10.1080/1540496x.2019.1658076
Luo, R., Men, M., and Wu, K. (2014). A dynamic analysis of nonlinearity of the Co-movement between stock market and bond market in China[J. Available at: https://kns.cnki.net/KCMS/detail/detail.aspx?dbcode=CJFD&dbname=CJFD2014&filename=ZYCY201403007.
Ma, J. (2015). On the construction of China's green finance system[J]. Finance Forum 20 (5), 18–27. doi:10.3969/j.issn.1009-5810.2013.09.008
Maćkowiak, B. (2007). External shocks, U.S. monetary policy and macroeconomic fluctuations in emerging markets. J. monetary Econ. 54 (8), 2512–2520. doi:10.1016/j.jmoneco.2007.06.021
McAleer, M., Hoti, S., and Chan, F. (2009). Structure and asymptotic theory for multivariate asymmetric conditional volatility. Econ. Rev. 28 (5), 422–440. doi:10.1080/07474930802467217
Miao, X., Xiang, L., and Zhang, R. (2017). Government debts, fiscal deficits and their macroeconomic effects:analysis based on soft constraints of debt[J]. Fiscal Sci. 25 (1), 101–117. CNKI:SUN:CZKX.0.2017-01-010.
Naeem, M. A., Farid, S., Ferrer, R., and Shahzad, S. J. H. (2021a). Comparative efficiency of green and conventional bonds pre- and during COVID-19: An asymmetric multifractal detrended fluctuation analysis. Energy Policy 2021 (153), 112285. doi:10.1016/j.enpol.2021.112285
Naeem, M. A., Nguyen, T. T. H., Nepal, R., Ngo, Q. T., and Taghizadeh–Hesary, F. (2021b). Asymmetric relationship between green bonds and commodities: Evidence from extreme quantile approach. Finance Res. Lett. 2021 (43), 101983. doi:10.1016/j.frl.2021.101983
Park, J., and Ratti, R. A. (2008). Oil price shocks and stock markets in the U.S. and 13 European countries. Energy Econ. 30 (5), 2587–2608. doi:10.1016/j.eneco.2008.04.003
Pham, L. (2016). Is it risky to go green? A volatility analysis of the green bond market[J]. J. Sustain. Finance Invest. 6 (4), 263–291. doi:10.1080/20430795.2016.1237244
Pham, L., and Nguyen, C. P. (2021). Asymmetric tail dependence between green bonds and other asset classes. Glob. Finance J. 2021 (50), 100669. doi:10.1016/j.gfj.2021.100669
Reboredo, J. C. (2018). Green bond and financial markets: Co-Movement, diversification and price spillover effects. Energy Econ. 74 (74), 38–50. doi:10.1016/j.eneco.2018.05.030
Reboredo, J. C., Ugolini, A., and Aiube, F. A. L. (2020). Network connectedness of green bonds and asset classes. Energy Econ. 86 (86), 104629. doi:10.1016/j.eneco.2019.104629
Reboredo, J. C., and Ugolini, A. (2020). Price connectedness between green bond and financial markets. Econ. Model. 88 (88), 25–38. doi:10.1016/j.econmod.2019.09.004
Ren, X., Li, Y., Wen, F., and Lu, Z. (2022). The interrelationship between the carbon market and the green bonds market: Evidence from wavelet quantile-on-quantile method[J]. Technol. Forecast. Soc. Change 2022 (179), 121611.
Tan, X., Zhang, J., and Zheng, X. (2018). The two-way spillover effects among international commodity markets and financial markets—An empirical study based on BEKK-GARCH model and spillover index method[J]. China Soft Sci. 15 (8), 31–48. CNKI:SUN:ZGRK.0.2018-08-004.
Wang, M., Lang, L., and Lan, H. (2021). The measurement and analysis of technological innovation diffusion in China's manufacturing industry. Natl. Account. Rev. 3 (4), 452–471. doi:10.3934/NAR.2021024
Yue, Z., and Zhang, Y. (2014). An empirical study on the spillover effect of money market and bond market on CSI 300 index[J]. Macroeconomics 3, 100–108. CNKI:SUN:JJGA.0.2014-03-011.
Zhang, H. Regulating green bond in China: Definition divergence and implications for policy making. J. Sustain. Finance Invest. 10.2 (2020): 141–156. doi:10.1080/20430795.2019.1706310
Zhao, X., and Chen, X. (2018). Study on the nonlinear effect of government debt on economic growth[J]. Stud. Int. Finance 2, 54–65. doi:10.16475/j.cnki.1006-1029.2018.02.006
Zhou, X., Tang, S., and Liu, H. (2020). Research on the segmentation effect and policy choice of China’s green bond market[J]. China Soft Sci. 11, 42–51. Available at: https://kns.cnki.net/KCMS/detail/detail.aspx?dbcode=CJFD&filename=ZGRK202011004.
Keywords: green bond market, government bond market, information transmission, risk contagion, VECM-DCC-VARMA-AGARCH
Citation: Zhou X, Lu H and Ye S (2023) The information transmission and risk contagion effect between green bond market and government bond market in China. Front. Environ. Sci. 11:1091203. doi: 10.3389/fenvs.2023.1091203
Received: 06 November 2022; Accepted: 02 March 2023;
Published: 14 March 2023.
Edited by:
Mobeen Ur Rehman, Shaheed Zulfikar Ali Bhutto Institute of Science and Technology (SZABIST), United Arab EmiratesReviewed by:
Wee-Yeap Lau, University of Malaya, MalaysiaDarren Shannon, University of Limerick, Ireland
Zhenghui Li, Guangzhou University, China
Copyright © 2023 Zhou, Lu and Ye. This is an open-access article distributed under the terms of the Creative Commons Attribution License (CC BY). The use, distribution or reproduction in other forums is permitted, provided the original author(s) and the copyright owner(s) are credited and that the original publication in this journal is cited, in accordance with accepted academic practice. No use, distribution or reproduction is permitted which does not comply with these terms.
*Correspondence: Shengchao Ye, eWVzaGVuZ2NoYW9AbmJ1LmVkdS5jbg==